

TheCryptoOnur
2.7k Posts

TheCryptoOnur
Report
Block User
Social Media Content Creator / Full Stack Developer www.cryptoonur.xyz
57 Following
3.2K+ Followers
1.0K+ Liked
Posts
All
Quotes
Videos
📈 $HYPE · 4H
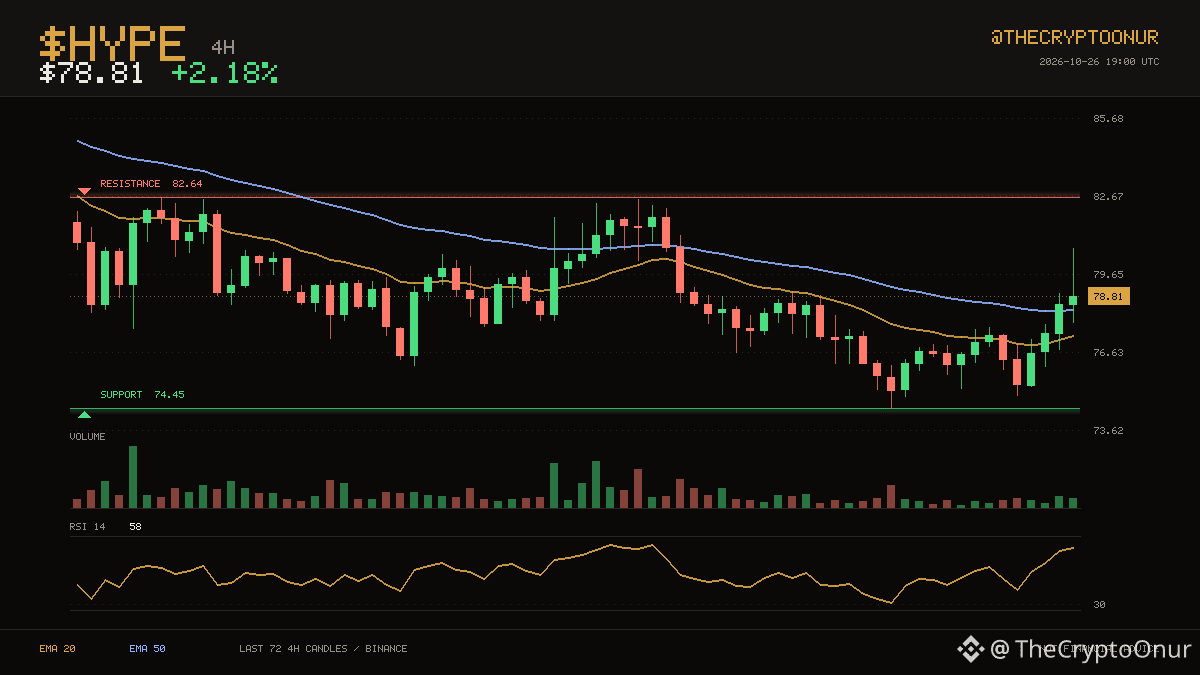
$HYPE sits at $78.81, with the 20 and 50 4-hour averages both below price. The two week range runs from $74.45 up to $82.64. That puts price in the middle of the range. That is 4.9% to the ceiling and 5.5% to the floor. The 20 has stayed below the 50 for a long stretch now. RSI at 58 is neutral, so momentum is not blocking a move either way. Over the past day it has traded between $74.99 and $80.65, sitting around the middle of it now. Participation is light at about 0.6x average volume. Up 2.2% over 24 hours.
DYOR
$HYPE #Trading
📈 $HYPE · 4H
$HYPE sits at $78.81, with the 20 and 50 4-hour averages both below price. The two week range runs from $74.45 up to $82.64. That puts price in the middle of the range. That is 4.9% to the ceiling and 5.5% to the floor. The 20 has stayed below the 50 for a long stretch now. RSI at 58 is neutral, so momentum is not blocking a move either way. Over the past day it has traded between $74.99 and $80.65, sitting around the middle of it now. Participation is light at about 0.6x average volume. Up 2.2% over 24 hours.
DYOR
$HYPE #Trading
$HYPE sits at $78.81, with the 20 and 50 4-hour averages both below price. The two week range runs from $74.45 up to $82.64. That puts price in the middle of the range. That is 4.9% to the ceiling and 5.5% to the floor. The 20 has stayed below the 50 for a long stretch now. RSI at 58 is neutral, so momentum is not blocking a move either way. Over the past day it has traded between $74.99 and $80.65, sitting around the middle of it now. Participation is light at about 0.6x average volume. Up 2.2% over 24 hours.
DYOR
$HYPE #Trading
7
📉 $WLD · 1H
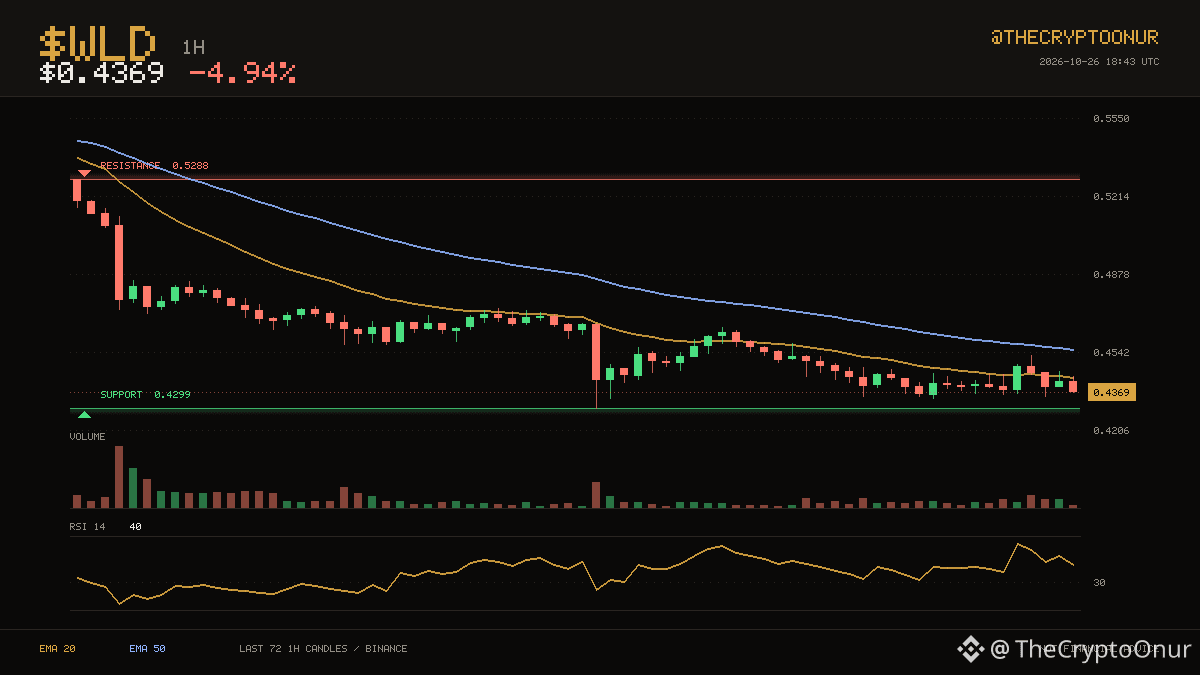
Buyers have been showing up around $0.4299, which is where price is sitting now. $WLD is at $0.4369, under both its 20 and 50 hourly averages. It is sitting in the bottom third of the range. Support is the near one at 1.6% below; the range high is far above. Averages have been ordered the same way for a long stretch now, with the 20 below the 50. Momentum is mid range with RSI at 40. The 24 hour range runs $0.4346 to $0.4600, and price is near the bottom of it. Volume is thin, around 0.5x the recent average, so moves here are easier to fade. Down 4.9% over 24 hours.
Binance spot data. DYOR
$WLD #Binance
📉 $WLD · 1H
Buyers have been showing up around $0.4299, which is where price is sitting now. $WLD is at $0.4369, under both its 20 and 50 hourly averages. It is sitting in the bottom third of the range. Support is the near one at 1.6% below; the range high is far above. Averages have been ordered the same way for a long stretch now, with the 20 below the 50. Momentum is mid range with RSI at 40. The 24 hour range runs $0.4346 to $0.4600, and price is near the bottom of it. Volume is thin, around 0.5x the recent average, so moves here are easier to fade. Down 4.9% over 24 hours.
Binance spot data. DYOR
$WLD #Binance
Buyers have been showing up around $0.4299, which is where price is sitting now. $WLD is at $0.4369, under both its 20 and 50 hourly averages. It is sitting in the bottom third of the range. Support is the near one at 1.6% below; the range high is far above. Averages have been ordered the same way for a long stretch now, with the 20 below the 50. Momentum is mid range with RSI at 40. The 24 hour range runs $0.4346 to $0.4600, and price is near the bottom of it. Volume is thin, around 0.5x the recent average, so moves here are easier to fade. Down 4.9% over 24 hours.
Binance spot data. DYOR
$WLD #Binance
9
📉 $PEPE · 1H
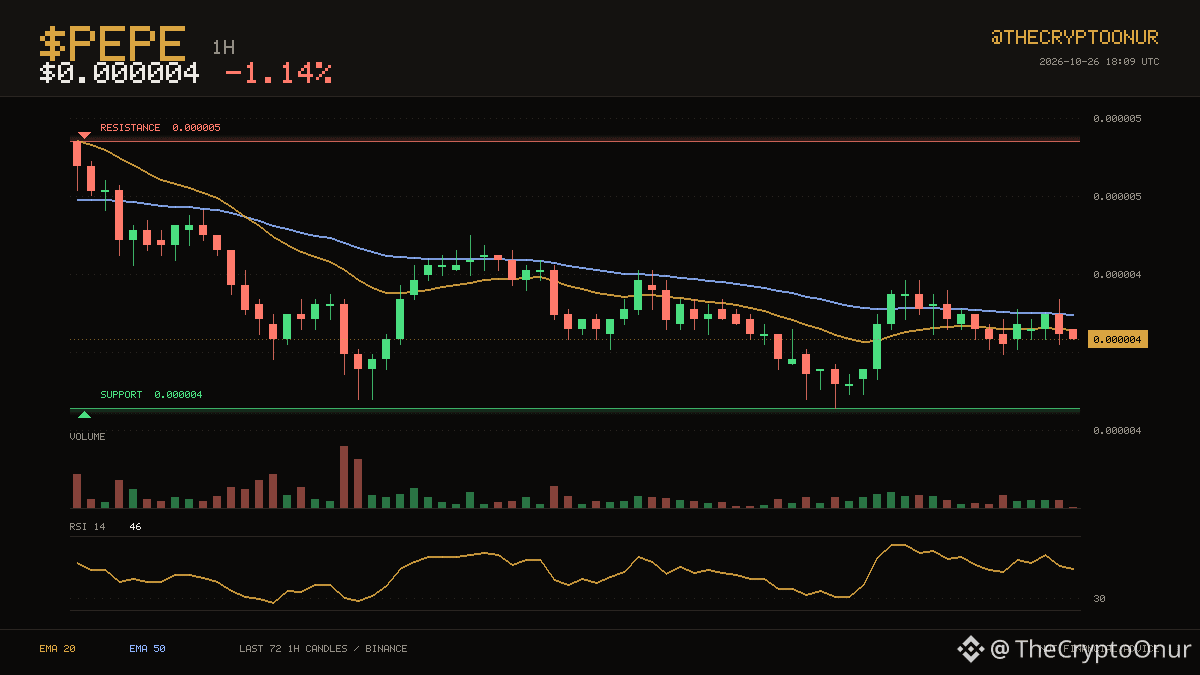
$PEPE trades at $0.000004, still on the weak side of its hourly averages. The three day range runs from $0.000004 up to $0.000005. Price is down in the lower third of that range. That is 9.2% to the ceiling and 3.2% to the floor. The 20 has stayed below the 50 for 59 candles. RSI at 46 is neutral, so momentum is not blocking a move either way. Over the past day it has traded between $0.000004 and $0.000004, sitting around the middle of it now. Participation is light at about 0.5x average volume. Down 1.1% over 24 hours.
DYOR
$PEPE #Trading
📉 $PEPE · 1H
$PEPE trades at $0.000004, still on the weak side of its hourly averages. The three day range runs from $0.000004 up to $0.000005. Price is down in the lower third of that range. That is 9.2% to the ceiling and 3.2% to the floor. The 20 has stayed below the 50 for 59 candles. RSI at 46 is neutral, so momentum is not blocking a move either way. Over the past day it has traded between $0.000004 and $0.000004, sitting around the middle of it now. Participation is light at about 0.5x average volume. Down 1.1% over 24 hours.
DYOR
$PEPE #Trading
$PEPE trades at $0.000004, still on the weak side of its hourly averages. The three day range runs from $0.000004 up to $0.000005. Price is down in the lower third of that range. That is 9.2% to the ceiling and 3.2% to the floor. The 20 has stayed below the 50 for 59 candles. RSI at 46 is neutral, so momentum is not blocking a move either way. Over the past day it has traded between $0.000004 and $0.000004, sitting around the middle of it now. Participation is light at about 0.5x average volume. Down 1.1% over 24 hours.
DYOR
$PEPE #Trading
12
🟢 $DOGE · 1D
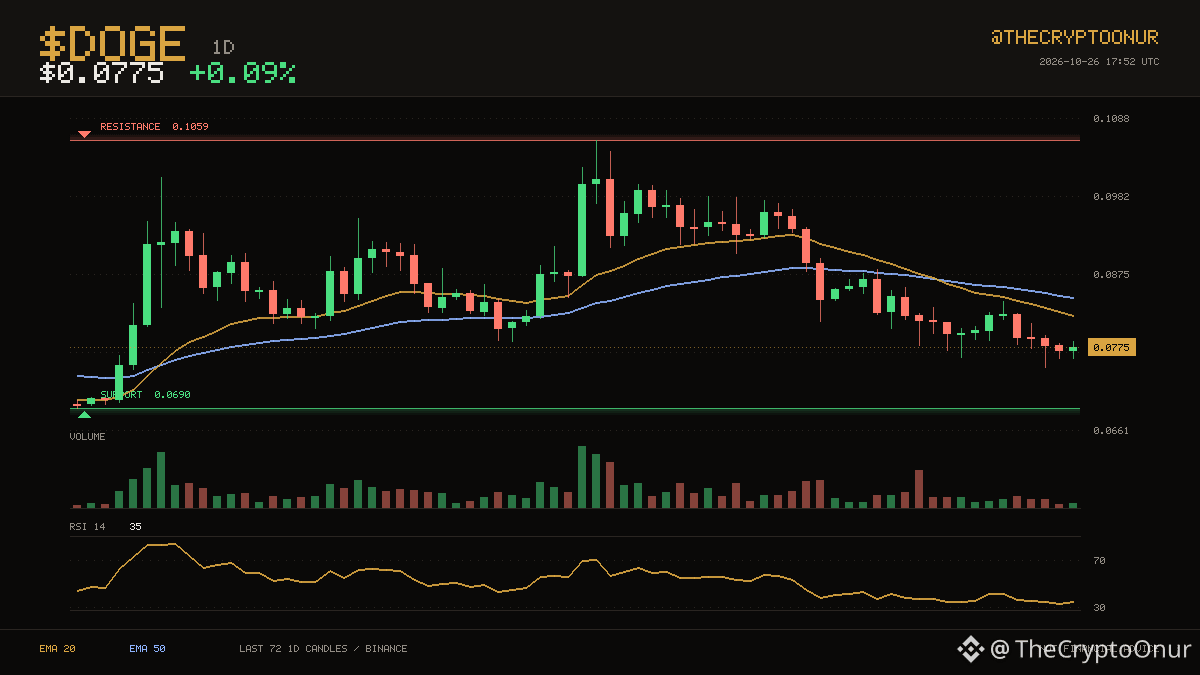
Price is $0.0775 and $DOGE remains below the averages that capped it earlier. $0.0690 on the low side and $0.1059 on the high side have contained the last two months. It is sitting in the bottom third of the range. Support is the near one at 10.9% below; the range high is far above. This shift is fresh: the 20 has been below the 50 for only 10 candles. Momentum is mid range with RSI at 35. The 24 hour range runs $0.0760 to $0.0782, and price is around the middle of it. Volume is close to normal at 1.0x the recent average. Flat over the past 24 hours.
DYOR
$DOGE #Crypto
🟢 $DOGE · 1D
Price is $0.0775 and $DOGE remains below the averages that capped it earlier. $0.0690 on the low side and $0.1059 on the high side have contained the last two months. It is sitting in the bottom third of the range. Support is the near one at 10.9% below; the range high is far above. This shift is fresh: the 20 has been below the 50 for only 10 candles. Momentum is mid range with RSI at 35. The 24 hour range runs $0.0760 to $0.0782, and price is around the middle of it. Volume is close to normal at 1.0x the recent average. Flat over the past 24 hours.
DYOR
$DOGE #Crypto
Price is $0.0775 and $DOGE remains below the averages that capped it earlier. $0.0690 on the low side and $0.1059 on the high side have contained the last two months. It is sitting in the bottom third of the range. Support is the near one at 10.9% below; the range high is far above. This shift is fresh: the 20 has been below the 50 for only 10 candles. Momentum is mid range with RSI at 35. The 24 hour range runs $0.0760 to $0.0782, and price is around the middle of it. Volume is close to normal at 1.0x the recent average. Flat over the past 24 hours.
DYOR
$DOGE #Crypto
6
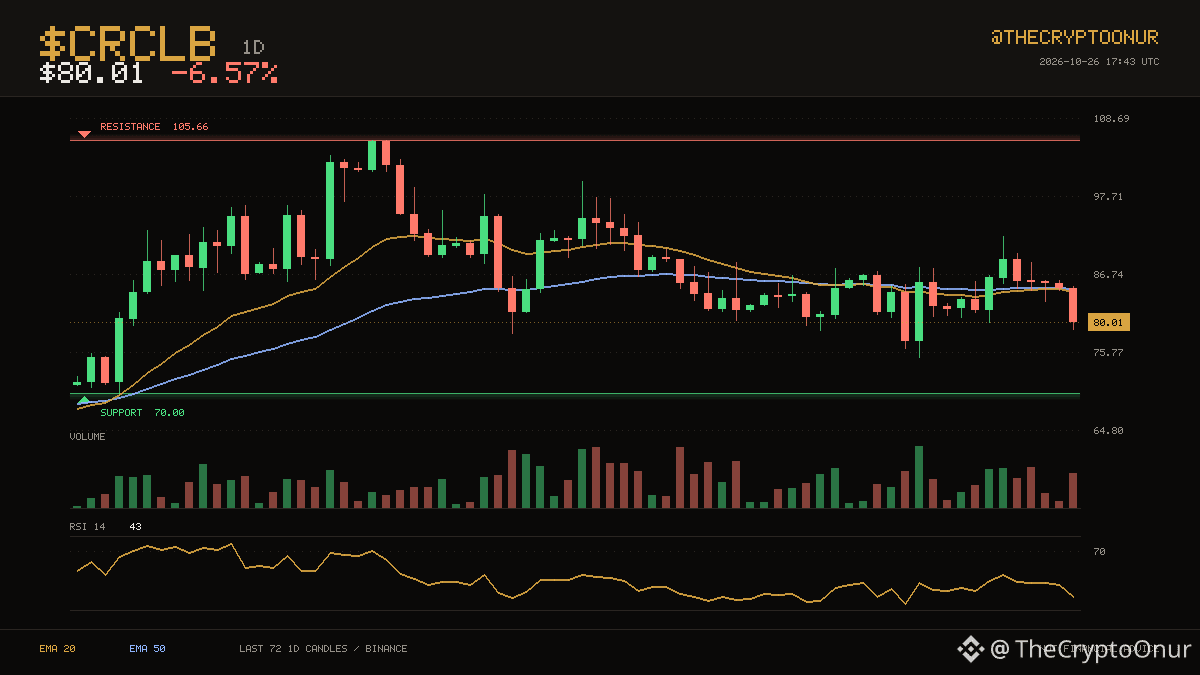
📉 $CRCLB · 1D
$CRCLB trades at $80.01, still on the weak side of its daily averages. The two month range runs from $70.00 up to $105.66. Price is down in the lower third of that range. The floor is 12.5% away and the ceiling is nowhere close. The 20 has stayed below the 50 for only 19 candles. RSI at 43 is neutral, so momentum is not blocking a move either way. Over the past day it has traded between $79.00 and $85.70, sitting near the bottom of it now. Turnover is unremarkable, running 1.5x the recent average. Down 6.6% over 24 hours.
DYOR
$CRCLB #Trading
📉 $CRCLB · 1D
$CRCLB trades at $80.01, still on the weak side of its daily averages. The two month range runs from $70.00 up to $105.66. Price is down in the lower third of that range. The floor is 12.5% away and the ceiling is nowhere close. The 20 has stayed below the 50 for only 19 candles. RSI at 43 is neutral, so momentum is not blocking a move either way. Over the past day it has traded between $79.00 and $85.70, sitting near the bottom of it now. Turnover is unremarkable, running 1.5x the recent average. Down 6.6% over 24 hours.
DYOR
$CRCLB #Trading
$CRCLB trades at $80.01, still on the weak side of its daily averages. The two month range runs from $70.00 up to $105.66. Price is down in the lower third of that range. The floor is 12.5% away and the ceiling is nowhere close. The 20 has stayed below the 50 for only 19 candles. RSI at 43 is neutral, so momentum is not blocking a move either way. Over the past day it has traded between $79.00 and $85.70, sitting near the bottom of it now. Turnover is unremarkable, running 1.5x the recent average. Down 6.6% over 24 hours.
DYOR
$CRCLB #Trading
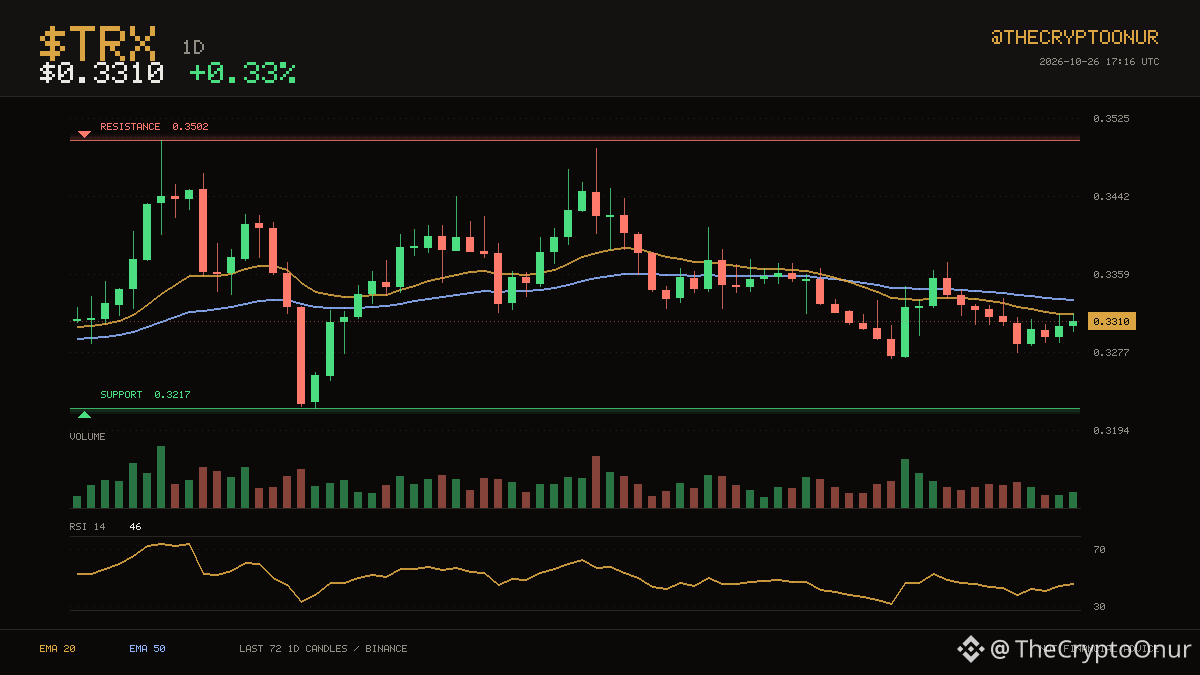
📈 $TRX · 1D
$TRX trades at $0.3310, still on the weak side of its daily averages. The two month range runs from $0.3217 up to $0.3502. It is sitting in the bottom third of the range. Resistance sits 5.8% above and support 2.8% below. Averages have been ordered the same way for only 17 candles, with the 20 below the 50. Momentum is mid range with RSI at 46. The 24 hour range runs $0.3299 to $0.3317, and price is around the middle of it. Volume is close to normal at 0.8x the recent average. Those averages sit at $0.3318 and $0.3333 respectively. Up 0.3% over 24 hours.
DYOR
$TRX #Crypto
📈 $TRX · 1D
$TRX trades at $0.3310, still on the weak side of its daily averages. The two month range runs from $0.3217 up to $0.3502. It is sitting in the bottom third of the range. Resistance sits 5.8% above and support 2.8% below. Averages have been ordered the same way for only 17 candles, with the 20 below the 50. Momentum is mid range with RSI at 46. The 24 hour range runs $0.3299 to $0.3317, and price is around the middle of it. Volume is close to normal at 0.8x the recent average. Those averages sit at $0.3318 and $0.3333 respectively. Up 0.3% over 24 hours.
DYOR
$TRX #Crypto
$TRX trades at $0.3310, still on the weak side of its daily averages. The two month range runs from $0.3217 up to $0.3502. It is sitting in the bottom third of the range. Resistance sits 5.8% above and support 2.8% below. Averages have been ordered the same way for only 17 candles, with the 20 below the 50. Momentum is mid range with RSI at 46. The 24 hour range runs $0.3299 to $0.3317, and price is around the middle of it. Volume is close to normal at 0.8x the recent average. Those averages sit at $0.3318 and $0.3333 respectively. Up 0.3% over 24 hours.
DYOR
$TRX #Crypto
5
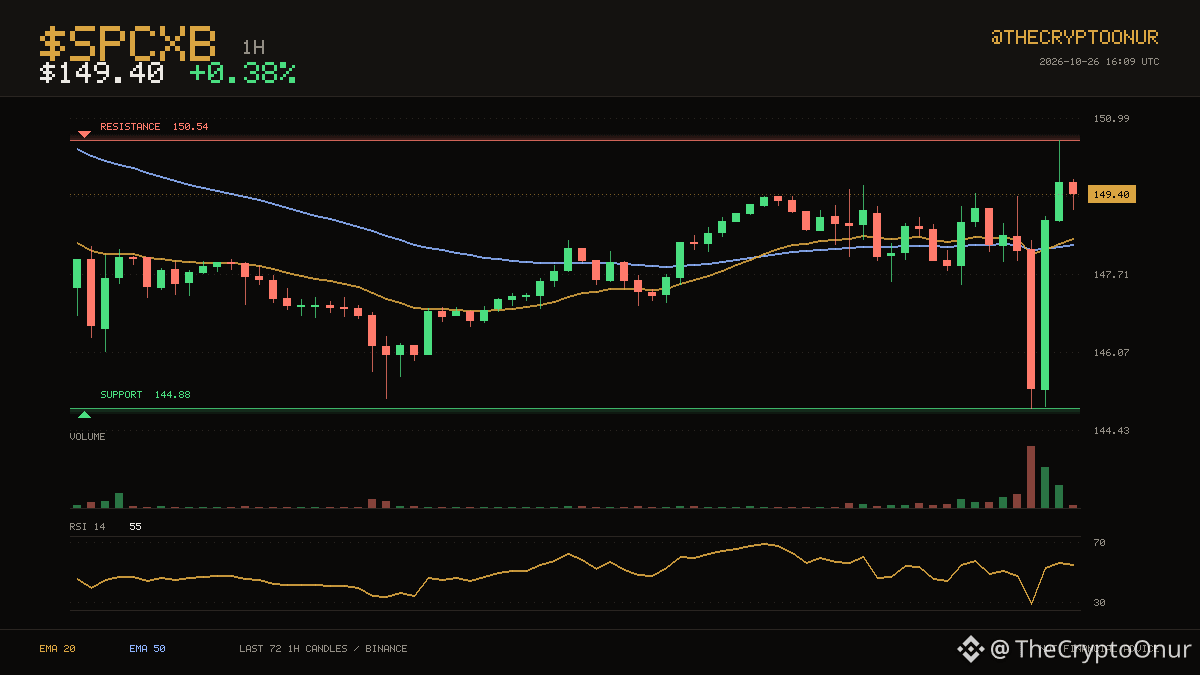
📈 $SPCXB · 1H
$SPCXB sits at $149.40, with the 20 and 50 hourly averages both below price. The three day range runs from $144.88 up to $150.54. Price is holding in the upper third of that range. That leaves just 0.8% to the ceiling. The 20 crossed above the 50 recently, for only 2 candles, so this leg is still young. RSI at 55 is neutral, so momentum is not blocking a move either way. Over the past day it has traded between $144.88 and $150.54, sitting near the top of it now. Turnover is unremarkable, running 0.9x the recent average. Up 0.4% over 24 hours.
DYOR
$SPCXB #Trading
📈 $SPCXB · 1H
$SPCXB sits at $149.40, with the 20 and 50 hourly averages both below price. The three day range runs from $144.88 up to $150.54. Price is holding in the upper third of that range. That leaves just 0.8% to the ceiling. The 20 crossed above the 50 recently, for only 2 candles, so this leg is still young. RSI at 55 is neutral, so momentum is not blocking a move either way. Over the past day it has traded between $144.88 and $150.54, sitting near the top of it now. Turnover is unremarkable, running 0.9x the recent average. Up 0.4% over 24 hours.
DYOR
$SPCXB #Trading
$SPCXB sits at $149.40, with the 20 and 50 hourly averages both below price. The three day range runs from $144.88 up to $150.54. Price is holding in the upper third of that range. That leaves just 0.8% to the ceiling. The 20 crossed above the 50 recently, for only 2 candles, so this leg is still young. RSI at 55 is neutral, so momentum is not blocking a move either way. Over the past day it has traded between $144.88 and $150.54, sitting near the top of it now. Turnover is unremarkable, running 0.9x the recent average. Up 0.4% over 24 hours.
DYOR
$SPCXB #Trading
11
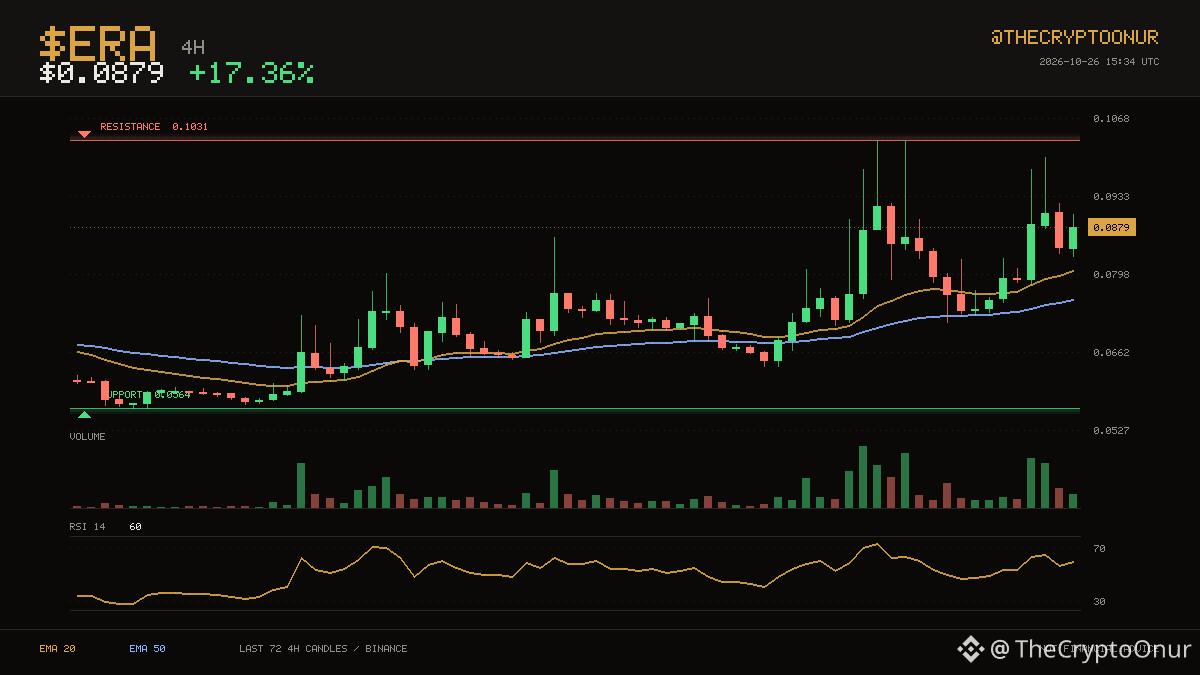
📈 $ERA · 4H
The action has stayed between $0.0564 and $0.1031 over the last two weeks. $ERA is trading at $0.0879, above both its 20 and 50 4-hour averages. Price is holding in the upper third of that range. Price is a long way from both ends of this range. The 20 has stayed above the 50 for 47 candles. RSI at 60 is neutral, so momentum is not blocking a move either way. Over the past day it has traded between $0.0748 and $0.1001, sitting around the middle of it now. The last 24 hours carried roughly 2.8x normal volume. Up 17.4% over 24 hours.
DYOR
$ERA #Binance
📈 $ERA · 4H
The action has stayed between $0.0564 and $0.1031 over the last two weeks. $ERA is trading at $0.0879, above both its 20 and 50 4-hour averages. Price is holding in the upper third of that range. Price is a long way from both ends of this range. The 20 has stayed above the 50 for 47 candles. RSI at 60 is neutral, so momentum is not blocking a move either way. Over the past day it has traded between $0.0748 and $0.1001, sitting around the middle of it now. The last 24 hours carried roughly 2.8x normal volume. Up 17.4% over 24 hours.
DYOR
$ERA #Binance
The action has stayed between $0.0564 and $0.1031 over the last two weeks. $ERA is trading at $0.0879, above both its 20 and 50 4-hour averages. Price is holding in the upper third of that range. Price is a long way from both ends of this range. The 20 has stayed above the 50 for 47 candles. RSI at 60 is neutral, so momentum is not blocking a move either way. Over the past day it has traded between $0.0748 and $0.1001, sitting around the middle of it now. The last 24 hours carried roughly 2.8x normal volume. Up 17.4% over 24 hours.
DYOR
$ERA #Binance
11
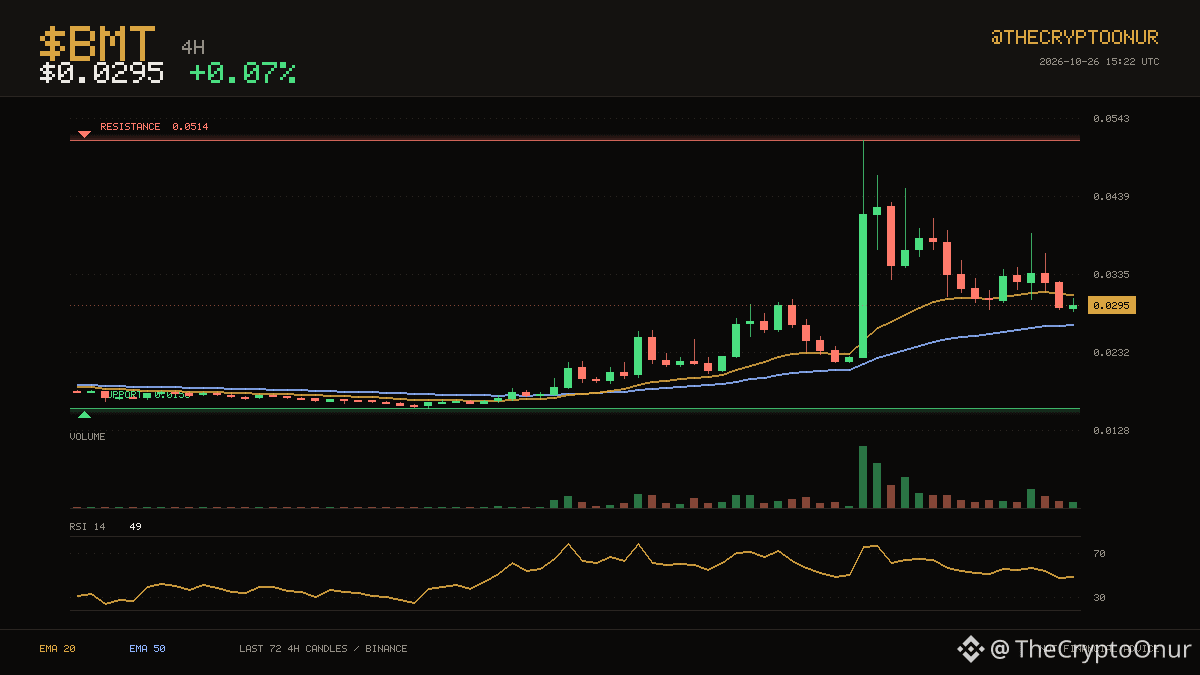
📈 $BMT · 4H
The action has stayed between $0.0156 and $0.0514 over the last two weeks. $BMT is caught between its averages at $0.0295. Price is roughly mid range here. Both edges of the range are far from here, so neither is in play yet. Averages have been ordered the same way for 35 candles, with the 20 above the 50. Momentum is mid range with RSI at 49. The 24 hour range runs $0.0286 to $0.0390, and price is near the bottom of it. Volume over the past day is running about 11.8x the recent average, so there is real participation behind this. Flat over the past 24 hours.
Binance spot data. DYOR
$BMT #Binance
📈 $BMT · 4H
The action has stayed between $0.0156 and $0.0514 over the last two weeks. $BMT is caught between its averages at $0.0295. Price is roughly mid range here. Both edges of the range are far from here, so neither is in play yet. Averages have been ordered the same way for 35 candles, with the 20 above the 50. Momentum is mid range with RSI at 49. The 24 hour range runs $0.0286 to $0.0390, and price is near the bottom of it. Volume over the past day is running about 11.8x the recent average, so there is real participation behind this. Flat over the past 24 hours.
Binance spot data. DYOR
$BMT #Binance
The action has stayed between $0.0156 and $0.0514 over the last two weeks. $BMT is caught between its averages at $0.0295. Price is roughly mid range here. Both edges of the range are far from here, so neither is in play yet. Averages have been ordered the same way for 35 candles, with the 20 above the 50. Momentum is mid range with RSI at 49. The 24 hour range runs $0.0286 to $0.0390, and price is near the bottom of it. Volume over the past day is running about 11.8x the recent average, so there is real participation behind this. Flat over the past 24 hours.
Binance spot data. DYOR
$BMT #Binance
6
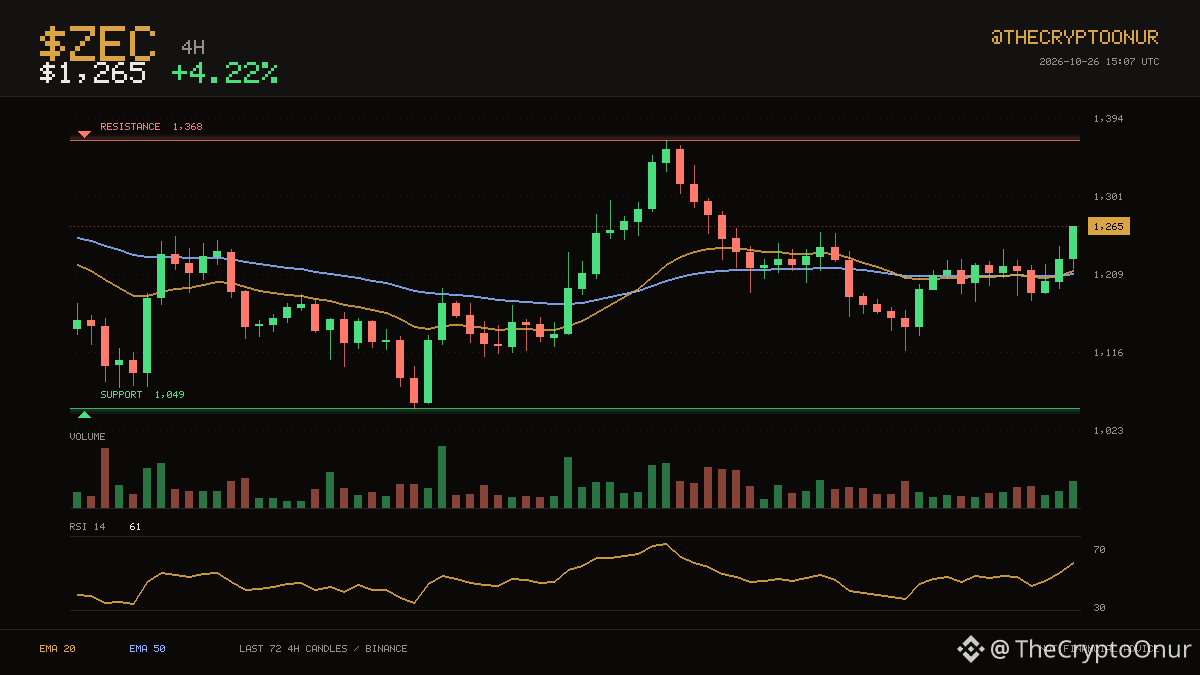
📈 $ZEC · 4H
$ZEC sits at $1,265, with the 20 and 50 4-hour averages both below price. The two week range runs from $1,049 up to $1,368. Price is holding in the upper third of that range. The ceiling is 8.2% away while the floor sits well below current levels. The 20 crossed above the 50 recently, for only 1 candles, so this leg is still young. RSI at 61 is neutral, so momentum is not blocking a move either way. Over the past day it has traded between $1,178 and $1,266, sitting near the top of it now. Turnover is unremarkable, running 0.8x the recent average. Up 4.2% over 24 hours.
DYOR
$ZEC #Trading
📈 $ZEC · 4H
$ZEC sits at $1,265, with the 20 and 50 4-hour averages both below price. The two week range runs from $1,049 up to $1,368. Price is holding in the upper third of that range. The ceiling is 8.2% away while the floor sits well below current levels. The 20 crossed above the 50 recently, for only 1 candles, so this leg is still young. RSI at 61 is neutral, so momentum is not blocking a move either way. Over the past day it has traded between $1,178 and $1,266, sitting near the top of it now. Turnover is unremarkable, running 0.8x the recent average. Up 4.2% over 24 hours.
DYOR
$ZEC #Trading
$ZEC sits at $1,265, with the 20 and 50 4-hour averages both below price. The two week range runs from $1,049 up to $1,368. Price is holding in the upper third of that range. The ceiling is 8.2% away while the floor sits well below current levels. The 20 crossed above the 50 recently, for only 1 candles, so this leg is still young. RSI at 61 is neutral, so momentum is not blocking a move either way. Over the past day it has traded between $1,178 and $1,266, sitting near the top of it now. Turnover is unremarkable, running 0.8x the recent average. Up 4.2% over 24 hours.
DYOR
$ZEC #Trading
14
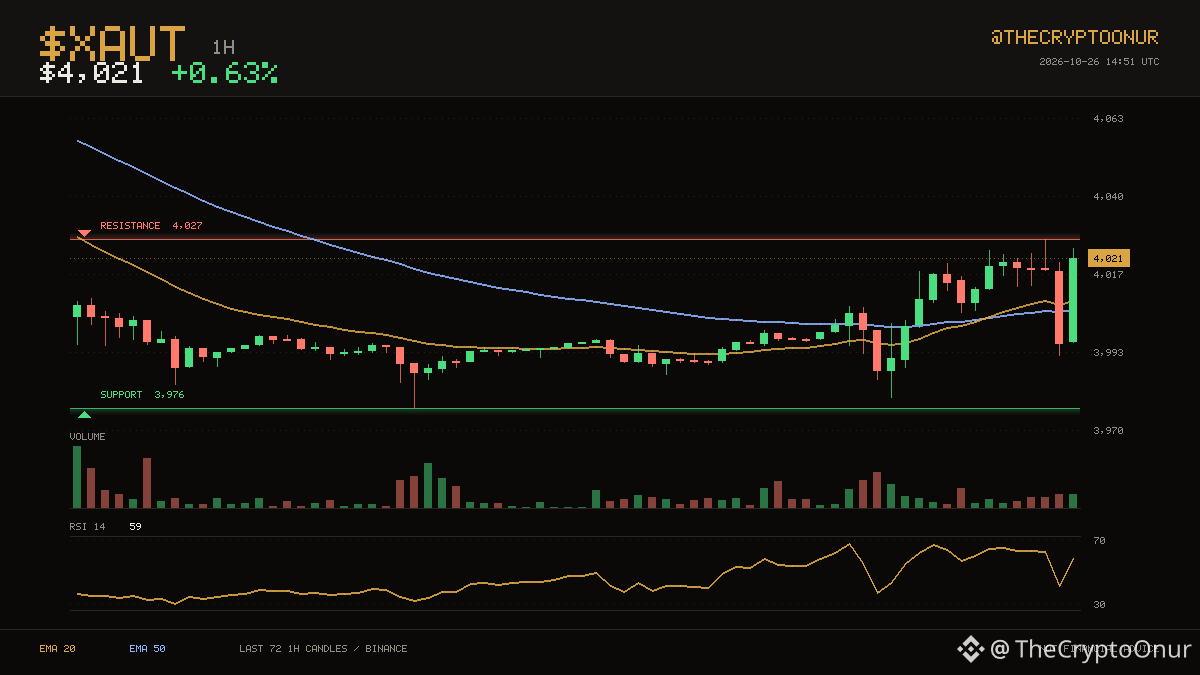
🟢 $XAUT · 1H
$4,021 keeps $XAUT on the stronger side of its hourly averages. The last three days topped out near $4,027, and price is pressing that area again. It is trading in the top third of the range right now. Resistance is only 0.1% away, so there is not much room before it matters. This shift is fresh: the 20 has been above the 50 for only 7 candles. Momentum is mid range with RSI at 59. The 24 hour range runs $3,980 to $4,027, and price is near the top of it. Volume is thin, around 0.6x the recent average, so moves here are easier to fade. Up 0.6% over 24 hours.
DYOR
$XAUT #Crypto
🟢 $XAUT · 1H
$4,021 keeps $XAUT on the stronger side of its hourly averages. The last three days topped out near $4,027, and price is pressing that area again. It is trading in the top third of the range right now. Resistance is only 0.1% away, so there is not much room before it matters. This shift is fresh: the 20 has been above the 50 for only 7 candles. Momentum is mid range with RSI at 59. The 24 hour range runs $3,980 to $4,027, and price is near the top of it. Volume is thin, around 0.6x the recent average, so moves here are easier to fade. Up 0.6% over 24 hours.
DYOR
$XAUT #Crypto
$4,021 keeps $XAUT on the stronger side of its hourly averages. The last three days topped out near $4,027, and price is pressing that area again. It is trading in the top third of the range right now. Resistance is only 0.1% away, so there is not much room before it matters. This shift is fresh: the 20 has been above the 50 for only 7 candles. Momentum is mid range with RSI at 59. The 24 hour range runs $3,980 to $4,027, and price is near the top of it. Volume is thin, around 0.6x the recent average, so moves here are easier to fade. Up 0.6% over 24 hours.
DYOR
$XAUT #Crypto
6
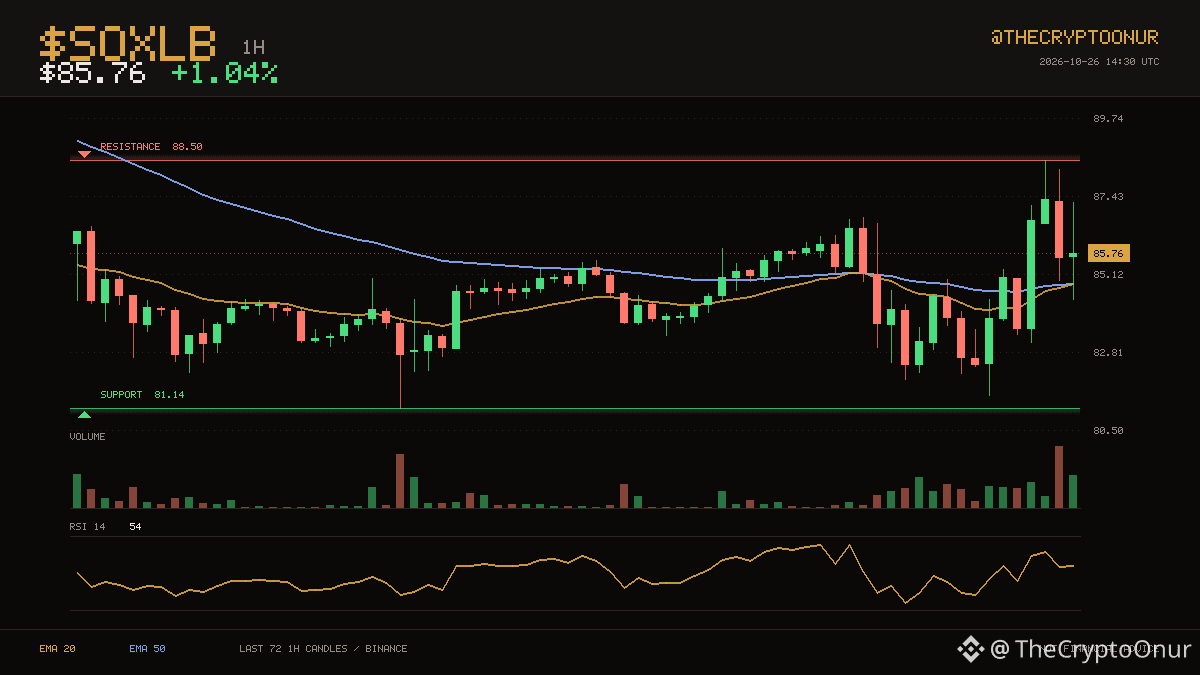
📈 $SOXLB · 1H
The action has stayed between $81.14 and $88.50 over the last three days. $SOXLB is trading at $85.76, above both its 20 and 50 hourly averages. Price is roughly mid range here. Resistance sits 3.2% above and support 5.4% below. Averages have been ordered the same way for a long stretch now, with the 20 below the 50. Momentum is mid range with RSI at 54. The 24 hour range runs $81.54 to $88.50, and price is around the middle of it. Volume is close to normal at 0.8x the recent average. Up 1.0% over 24 hours.
Binance spot data. DYOR
$SOXLB #Binance
📈 $SOXLB · 1H
The action has stayed between $81.14 and $88.50 over the last three days. $SOXLB is trading at $85.76, above both its 20 and 50 hourly averages. Price is roughly mid range here. Resistance sits 3.2% above and support 5.4% below. Averages have been ordered the same way for a long stretch now, with the 20 below the 50. Momentum is mid range with RSI at 54. The 24 hour range runs $81.54 to $88.50, and price is around the middle of it. Volume is close to normal at 0.8x the recent average. Up 1.0% over 24 hours.
Binance spot data. DYOR
$SOXLB #Binance
The action has stayed between $81.14 and $88.50 over the last three days. $SOXLB is trading at $85.76, above both its 20 and 50 hourly averages. Price is roughly mid range here. Resistance sits 3.2% above and support 5.4% below. Averages have been ordered the same way for a long stretch now, with the 20 below the 50. Momentum is mid range with RSI at 54. The 24 hour range runs $81.54 to $88.50, and price is around the middle of it. Volume is close to normal at 0.8x the recent average. Up 1.0% over 24 hours.
Binance spot data. DYOR
$SOXLB #Binance
8
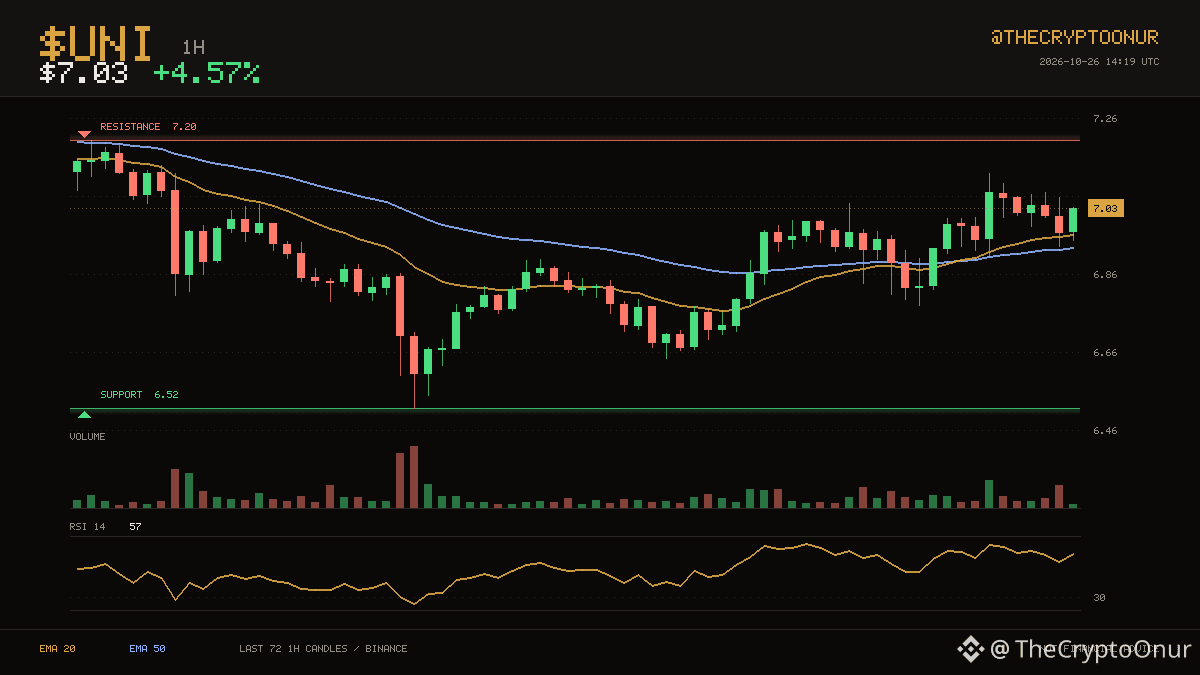
🟢 $UNI · 1H
$7.03 keeps $UNI on the stronger side of its hourly averages. $6.52 on the low side and $7.20 on the high side have contained the last three days. Price is holding in the upper third of that range. That is 2.5% to the ceiling and 7.3% to the floor. The 20 crossed above the 50 recently, for only 9 candles, so this leg is still young. RSI at 57 is neutral, so momentum is not blocking a move either way. Over the past day it has traded between $6.71 and $7.12, sitting near the top of it now. Participation is light at about 0.7x average volume. Up 4.6% over 24 hours.
DYOR
$UNI #TechnicalAnalysis
🟢 $UNI · 1H
$7.03 keeps $UNI on the stronger side of its hourly averages. $6.52 on the low side and $7.20 on the high side have contained the last three days. Price is holding in the upper third of that range. That is 2.5% to the ceiling and 7.3% to the floor. The 20 crossed above the 50 recently, for only 9 candles, so this leg is still young. RSI at 57 is neutral, so momentum is not blocking a move either way. Over the past day it has traded between $6.71 and $7.12, sitting near the top of it now. Participation is light at about 0.7x average volume. Up 4.6% over 24 hours.
DYOR
$UNI #TechnicalAnalysis
$7.03 keeps $UNI on the stronger side of its hourly averages. $6.52 on the low side and $7.20 on the high side have contained the last three days. Price is holding in the upper third of that range. That is 2.5% to the ceiling and 7.3% to the floor. The 20 crossed above the 50 recently, for only 9 candles, so this leg is still young. RSI at 57 is neutral, so momentum is not blocking a move either way. Over the past day it has traded between $6.71 and $7.12, sitting near the top of it now. Participation is light at about 0.7x average volume. Up 4.6% over 24 hours.
DYOR
$UNI #TechnicalAnalysis
16
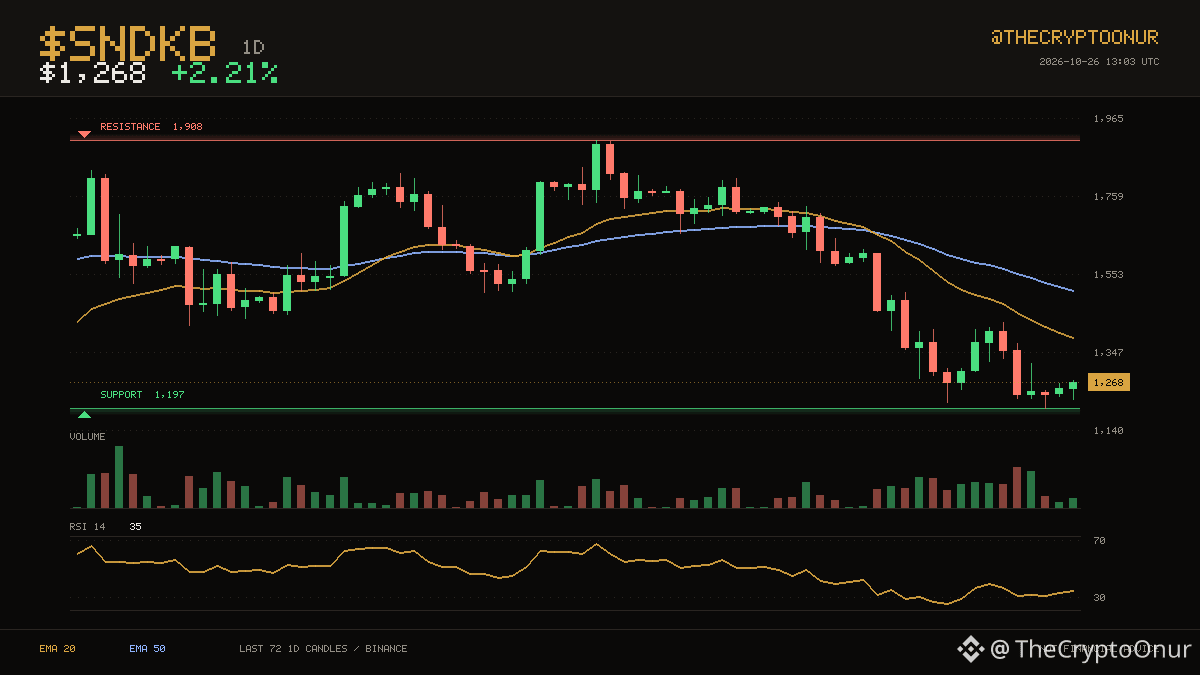
📈 $SNDKB · 1D
$SNDKB trades at $1,268, still on the weak side of its daily averages. The $1,197 area held twice over the last two months and is being tested again. Price is down in the lower third of that range. The floor is 5.6% away and the ceiling is nowhere close. The 20 has stayed below the 50 for only 15 candles. RSI at 35 is neutral, so momentum is not blocking a move either way. Over the past day it has traded between $1,223 and $1,273, sitting near the top of it now. Turnover is unremarkable, running 1.1x the recent average. Up 2.2% over 24 hours.
DYOR
$SNDKB #Trading
📈 $SNDKB · 1D
$SNDKB trades at $1,268, still on the weak side of its daily averages. The $1,197 area held twice over the last two months and is being tested again. Price is down in the lower third of that range. The floor is 5.6% away and the ceiling is nowhere close. The 20 has stayed below the 50 for only 15 candles. RSI at 35 is neutral, so momentum is not blocking a move either way. Over the past day it has traded between $1,223 and $1,273, sitting near the top of it now. Turnover is unremarkable, running 1.1x the recent average. Up 2.2% over 24 hours.
DYOR
$SNDKB #Trading
$SNDKB trades at $1,268, still on the weak side of its daily averages. The $1,197 area held twice over the last two months and is being tested again. Price is down in the lower third of that range. The floor is 5.6% away and the ceiling is nowhere close. The 20 has stayed below the 50 for only 15 candles. RSI at 35 is neutral, so momentum is not blocking a move either way. Over the past day it has traded between $1,223 and $1,273, sitting near the top of it now. Turnover is unremarkable, running 1.1x the recent average. Up 2.2% over 24 hours.
DYOR
$SNDKB #Trading
72
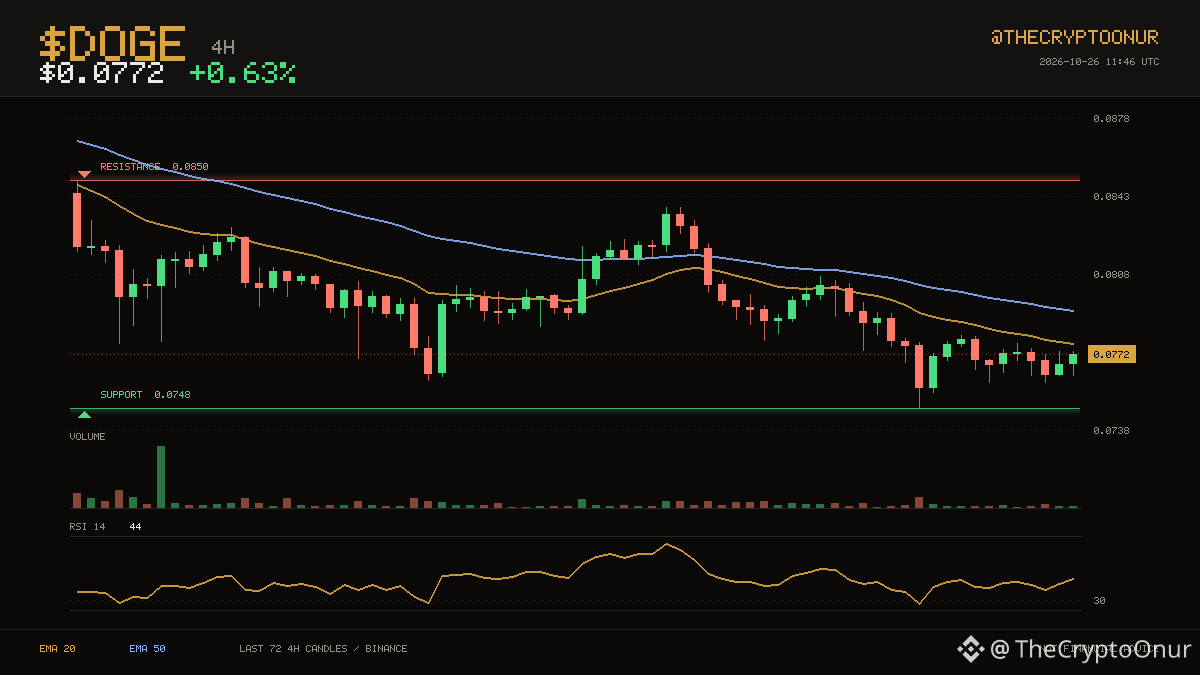
🟢 $DOGE · 4H
Price is $0.0772 and $DOGE remains below the averages that capped it earlier. $0.0748 on the low side and $0.0850 on the high side have contained the last two weeks. It is sitting in the bottom third of the range. Resistance sits 10.1% above and support 3.1% below. Averages have been ordered the same way for a long stretch now, with the 20 below the 50. Momentum is mid range with RSI at 44. The 24 hour range runs $0.0760 to $0.0777, and price is near the top of it. Volume is thin, around 0.5x the recent average, so moves here are easier to fade. Up 0.6% over 24 hours.
DYOR
$DOGE #Crypto
🟢 $DOGE · 4H
Price is $0.0772 and $DOGE remains below the averages that capped it earlier. $0.0748 on the low side and $0.0850 on the high side have contained the last two weeks. It is sitting in the bottom third of the range. Resistance sits 10.1% above and support 3.1% below. Averages have been ordered the same way for a long stretch now, with the 20 below the 50. Momentum is mid range with RSI at 44. The 24 hour range runs $0.0760 to $0.0777, and price is near the top of it. Volume is thin, around 0.5x the recent average, so moves here are easier to fade. Up 0.6% over 24 hours.
DYOR
$DOGE #Crypto
Price is $0.0772 and $DOGE remains below the averages that capped it earlier. $0.0748 on the low side and $0.0850 on the high side have contained the last two weeks. It is sitting in the bottom third of the range. Resistance sits 10.1% above and support 3.1% below. Averages have been ordered the same way for a long stretch now, with the 20 below the 50. Momentum is mid range with RSI at 44. The 24 hour range runs $0.0760 to $0.0777, and price is near the top of it. Volume is thin, around 0.5x the recent average, so moves here are easier to fade. Up 0.6% over 24 hours.
DYOR
$DOGE #Crypto
32
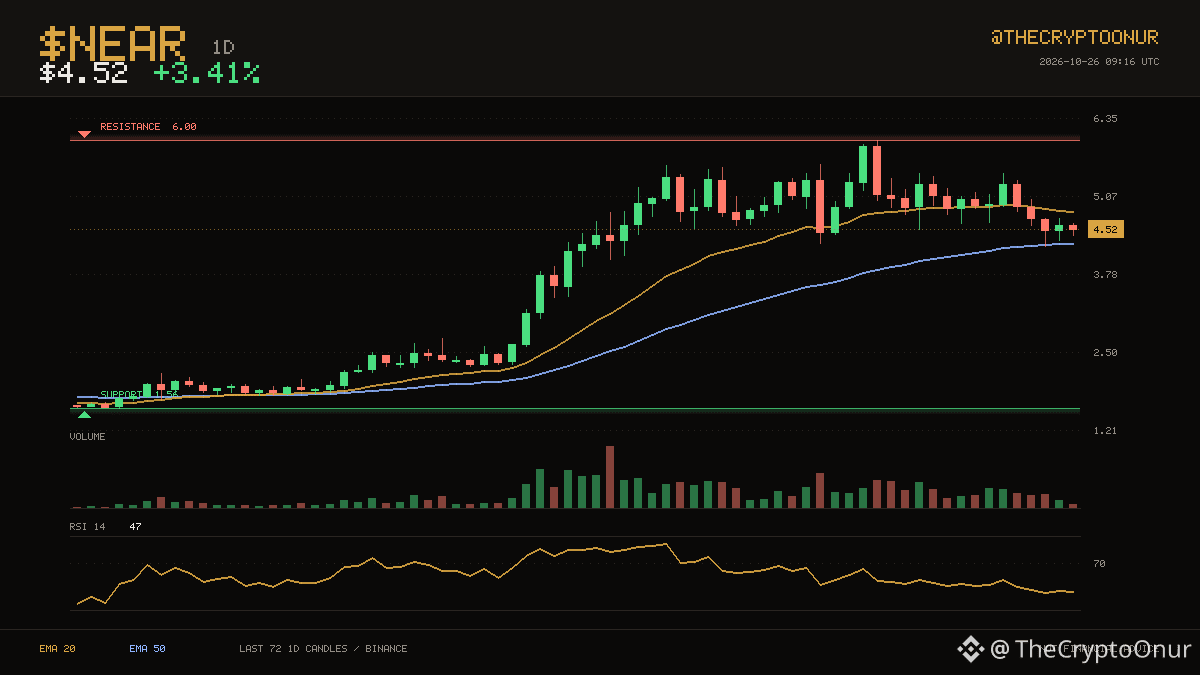
📈 $NEAR · 1D
$NEAR is at $4.52, with one average above price and one below. The two month range runs from $1.56 up to $6.00. Price is holding in the upper third of that range. Price is a long way from both ends of this range. The 20 has stayed above the 50 for a long stretch now. RSI at 47 is neutral, so momentum is not blocking a move either way. Over the past day it has traded between $4.35 and $4.70, sitting around the middle of it now. The last 24 hours carried roughly 2.2x normal volume. The 20 average is at $4.81 and the 50 at $4.29. Up 3.4% over 24 hours.
DYOR
$NEAR #Trading
📈 $NEAR · 1D
$NEAR is at $4.52, with one average above price and one below. The two month range runs from $1.56 up to $6.00. Price is holding in the upper third of that range. Price is a long way from both ends of this range. The 20 has stayed above the 50 for a long stretch now. RSI at 47 is neutral, so momentum is not blocking a move either way. Over the past day it has traded between $4.35 and $4.70, sitting around the middle of it now. The last 24 hours carried roughly 2.2x normal volume. The 20 average is at $4.81 and the 50 at $4.29. Up 3.4% over 24 hours.
DYOR
$NEAR #Trading
$NEAR is at $4.52, with one average above price and one below. The two month range runs from $1.56 up to $6.00. Price is holding in the upper third of that range. Price is a long way from both ends of this range. The 20 has stayed above the 50 for a long stretch now. RSI at 47 is neutral, so momentum is not blocking a move either way. Over the past day it has traded between $4.35 and $4.70, sitting around the middle of it now. The last 24 hours carried roughly 2.2x normal volume. The 20 average is at $4.81 and the 50 at $4.29. Up 3.4% over 24 hours.
DYOR
$NEAR #Trading
21
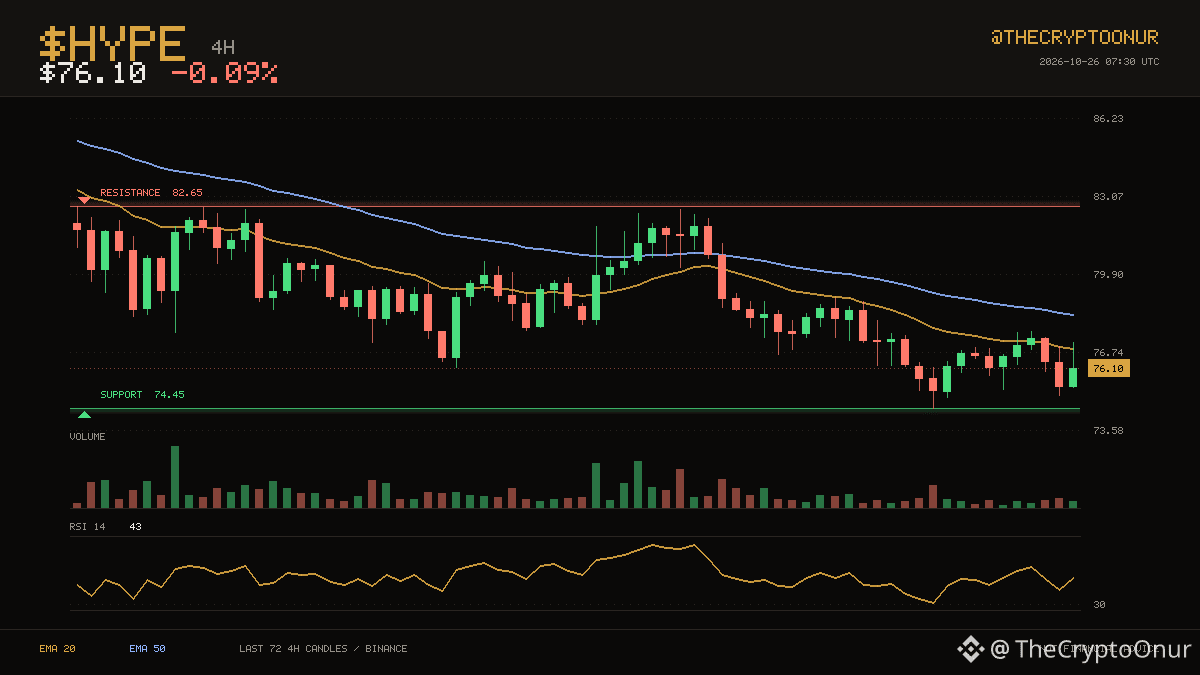
📉 $HYPE · 4H
$HYPE trades at $76.10, still on the weak side of its 4-hour averages. The two week range runs from $74.45 up to $82.65. It is sitting in the bottom third of the range. Resistance sits 8.6% above and support 2.2% below. Averages have been ordered the same way for a long stretch now, with the 20 below the 50. Momentum is mid range with RSI at 43. The 24 hour range runs $74.99 to $77.60, and price is around the middle of it. Volume is thin, around 0.6x the recent average, so moves here are easier to fade. Flat over the past 24 hours.
DYOR
$HYPE #Crypto
📉 $HYPE · 4H
$HYPE trades at $76.10, still on the weak side of its 4-hour averages. The two week range runs from $74.45 up to $82.65. It is sitting in the bottom third of the range. Resistance sits 8.6% above and support 2.2% below. Averages have been ordered the same way for a long stretch now, with the 20 below the 50. Momentum is mid range with RSI at 43. The 24 hour range runs $74.99 to $77.60, and price is around the middle of it. Volume is thin, around 0.6x the recent average, so moves here are easier to fade. Flat over the past 24 hours.
DYOR
$HYPE #Crypto
$HYPE trades at $76.10, still on the weak side of its 4-hour averages. The two week range runs from $74.45 up to $82.65. It is sitting in the bottom third of the range. Resistance sits 8.6% above and support 2.2% below. Averages have been ordered the same way for a long stretch now, with the 20 below the 50. Momentum is mid range with RSI at 43. The 24 hour range runs $74.99 to $77.60, and price is around the middle of it. Volume is thin, around 0.6x the recent average, so moves here are easier to fade. Flat over the past 24 hours.
DYOR
$HYPE #Crypto
12
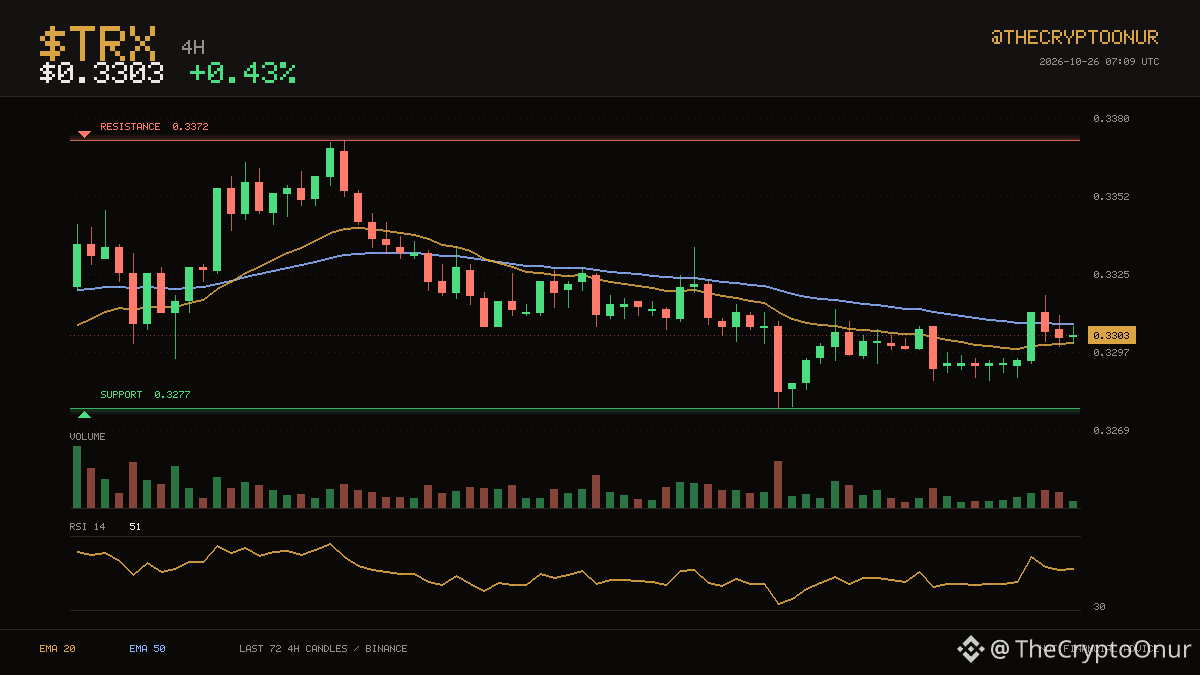
🟢 $TRX · 4H
At $0.3303, $TRX is sitting right in the middle of its 4-hour averages. $0.3277 on the low side and $0.3372 on the high side have contained the last two weeks. It is sitting in the bottom third of the range. Support is 0.8% below, which is close enough to be tested quickly. Averages have been ordered the same way for 42 candles, with the 20 below the 50. Momentum is mid range with RSI at 51. The 24 hour range runs $0.3288 to $0.3317, and price is around the middle of it. Volume is close to normal at 0.8x the recent average. Up 0.4% over 24 hours.
DYOR
$TRX #Crypto
🟢 $TRX · 4H
At $0.3303, $TRX is sitting right in the middle of its 4-hour averages. $0.3277 on the low side and $0.3372 on the high side have contained the last two weeks. It is sitting in the bottom third of the range. Support is 0.8% below, which is close enough to be tested quickly. Averages have been ordered the same way for 42 candles, with the 20 below the 50. Momentum is mid range with RSI at 51. The 24 hour range runs $0.3288 to $0.3317, and price is around the middle of it. Volume is close to normal at 0.8x the recent average. Up 0.4% over 24 hours.
DYOR
$TRX #Crypto
At $0.3303, $TRX is sitting right in the middle of its 4-hour averages. $0.3277 on the low side and $0.3372 on the high side have contained the last two weeks. It is sitting in the bottom third of the range. Support is 0.8% below, which is close enough to be tested quickly. Averages have been ordered the same way for 42 candles, with the 20 below the 50. Momentum is mid range with RSI at 51. The 24 hour range runs $0.3288 to $0.3317, and price is around the middle of it. Volume is close to normal at 0.8x the recent average. Up 0.4% over 24 hours.
DYOR
$TRX #Crypto
20
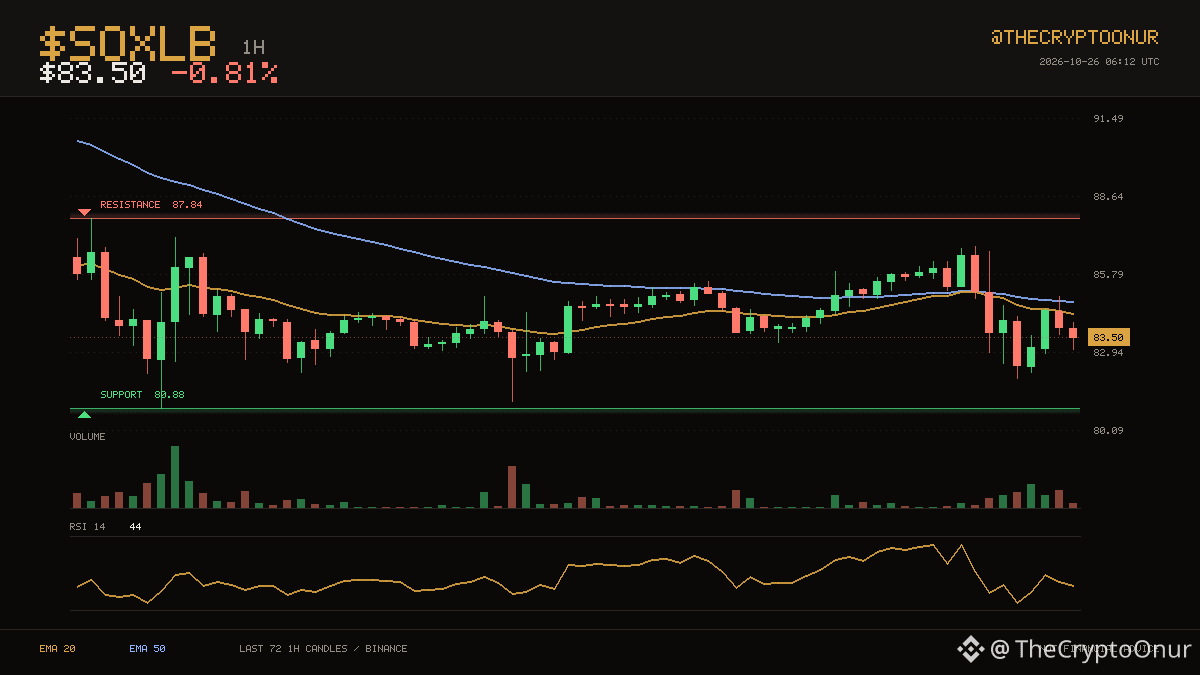
📉 $SOXLB · 1H
$SOXLB trades at $83.50, still on the weak side of its hourly averages. The three day range runs from $80.88 up to $87.84. Price is roughly mid range here. Resistance sits 5.2% above and support 3.1% below. Averages have been ordered the same way for a long stretch now, with the 20 below the 50. Momentum is mid range with RSI at 44. The 24 hour range runs $82.00 to $86.80, and price is around the middle of it. Volume is thin, around 0.4x the recent average, so moves here are easier to fade. Down 0.8% over 24 hours.
DYOR
$SOXLB #Crypto
📉 $SOXLB · 1H
$SOXLB trades at $83.50, still on the weak side of its hourly averages. The three day range runs from $80.88 up to $87.84. Price is roughly mid range here. Resistance sits 5.2% above and support 3.1% below. Averages have been ordered the same way for a long stretch now, with the 20 below the 50. Momentum is mid range with RSI at 44. The 24 hour range runs $82.00 to $86.80, and price is around the middle of it. Volume is thin, around 0.4x the recent average, so moves here are easier to fade. Down 0.8% over 24 hours.
DYOR
$SOXLB #Crypto
$SOXLB trades at $83.50, still on the weak side of its hourly averages. The three day range runs from $80.88 up to $87.84. Price is roughly mid range here. Resistance sits 5.2% above and support 3.1% below. Averages have been ordered the same way for a long stretch now, with the 20 below the 50. Momentum is mid range with RSI at 44. The 24 hour range runs $82.00 to $86.80, and price is around the middle of it. Volume is thin, around 0.4x the recent average, so moves here are easier to fade. Down 0.8% over 24 hours.
DYOR
$SOXLB #Crypto
4
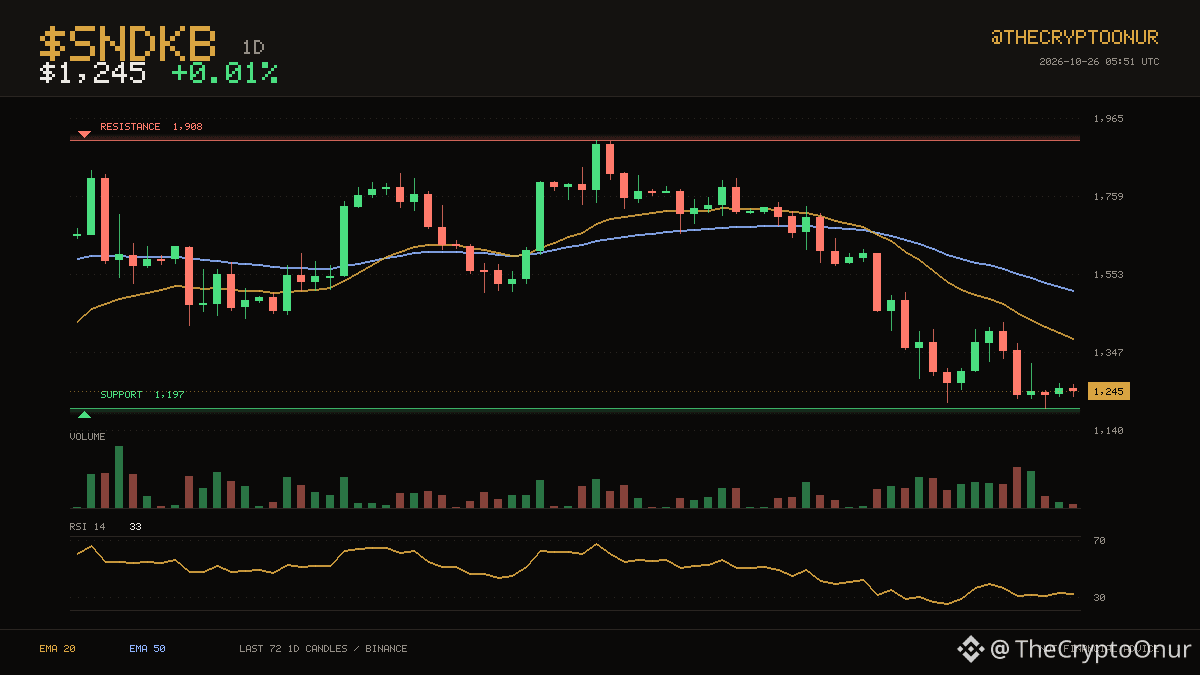
🟢 $SNDKB · 1D
Price is $1,245 and $SNDKB remains below the averages that capped it earlier. Buyers have been showing up around $1,197, which is where price is sitting now. It is sitting in the bottom third of the range. Support is the near one at 3.8% below; the range high is far above. Averages have been ordered the same way for only 15 candles, with the 20 below the 50. Momentum is mid range with RSI at 33. The 24 hour range runs $1,230 to $1,265, and price is around the middle of it. Volume is close to normal at 1.1x the recent average. Flat over the past 24 hours.
DYOR
$SNDKB #Crypto
🟢 $SNDKB · 1D
Price is $1,245 and $SNDKB remains below the averages that capped it earlier. Buyers have been showing up around $1,197, which is where price is sitting now. It is sitting in the bottom third of the range. Support is the near one at 3.8% below; the range high is far above. Averages have been ordered the same way for only 15 candles, with the 20 below the 50. Momentum is mid range with RSI at 33. The 24 hour range runs $1,230 to $1,265, and price is around the middle of it. Volume is close to normal at 1.1x the recent average. Flat over the past 24 hours.
DYOR
$SNDKB #Crypto
Price is $1,245 and $SNDKB remains below the averages that capped it earlier. Buyers have been showing up around $1,197, which is where price is sitting now. It is sitting in the bottom third of the range. Support is the near one at 3.8% below; the range high is far above. Averages have been ordered the same way for only 15 candles, with the 20 below the 50. Momentum is mid range with RSI at 33. The 24 hour range runs $1,230 to $1,265, and price is around the middle of it. Volume is close to normal at 1.1x the recent average. Flat over the past 24 hours.
DYOR
$SNDKB #Crypto
5
Log in to explore more content
Join global crypto users on Binance Square
⚡️ Get latest and useful information about crypto.
💬 Trusted by the world’s largest crypto exchange.
👍 Discover real insights from verified creators.
Email / Phone number