
trader_280
93 Posts

trader_280
Report
Block User
check posts Follow for best signals
Open Trade
Frequent Trader
5.5 Years
13 Following
148 Followers
168 Liked
Posts
Portfolio
All
Quotes
·
--
Bearish
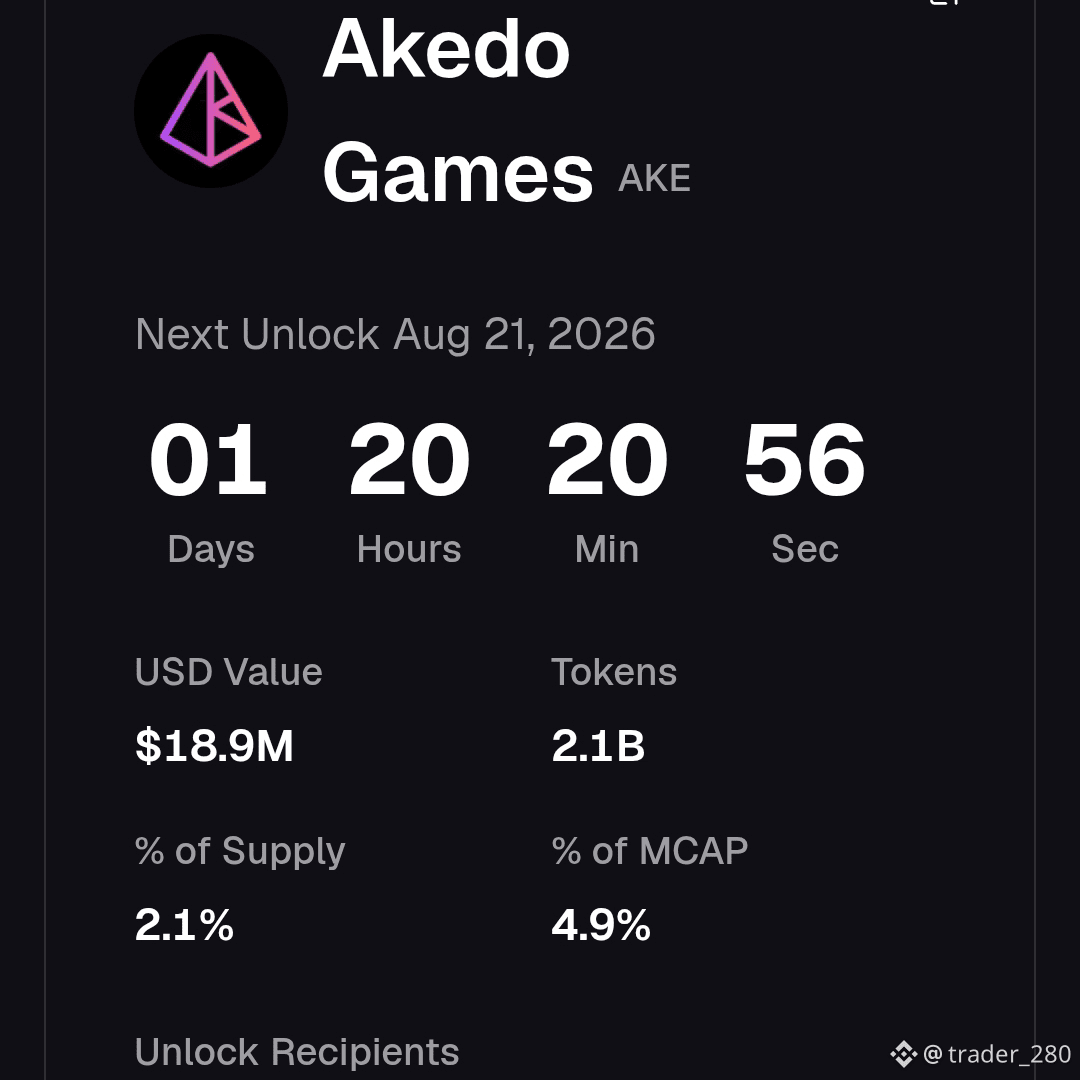
$AKE Holder be careful brother don't long $AKE short and hold for 1 weak tanks me later
$AKE Holder be careful brother don't long $AKE short and hold for 1 weak tanks me later
2
248
·
--
Bearish
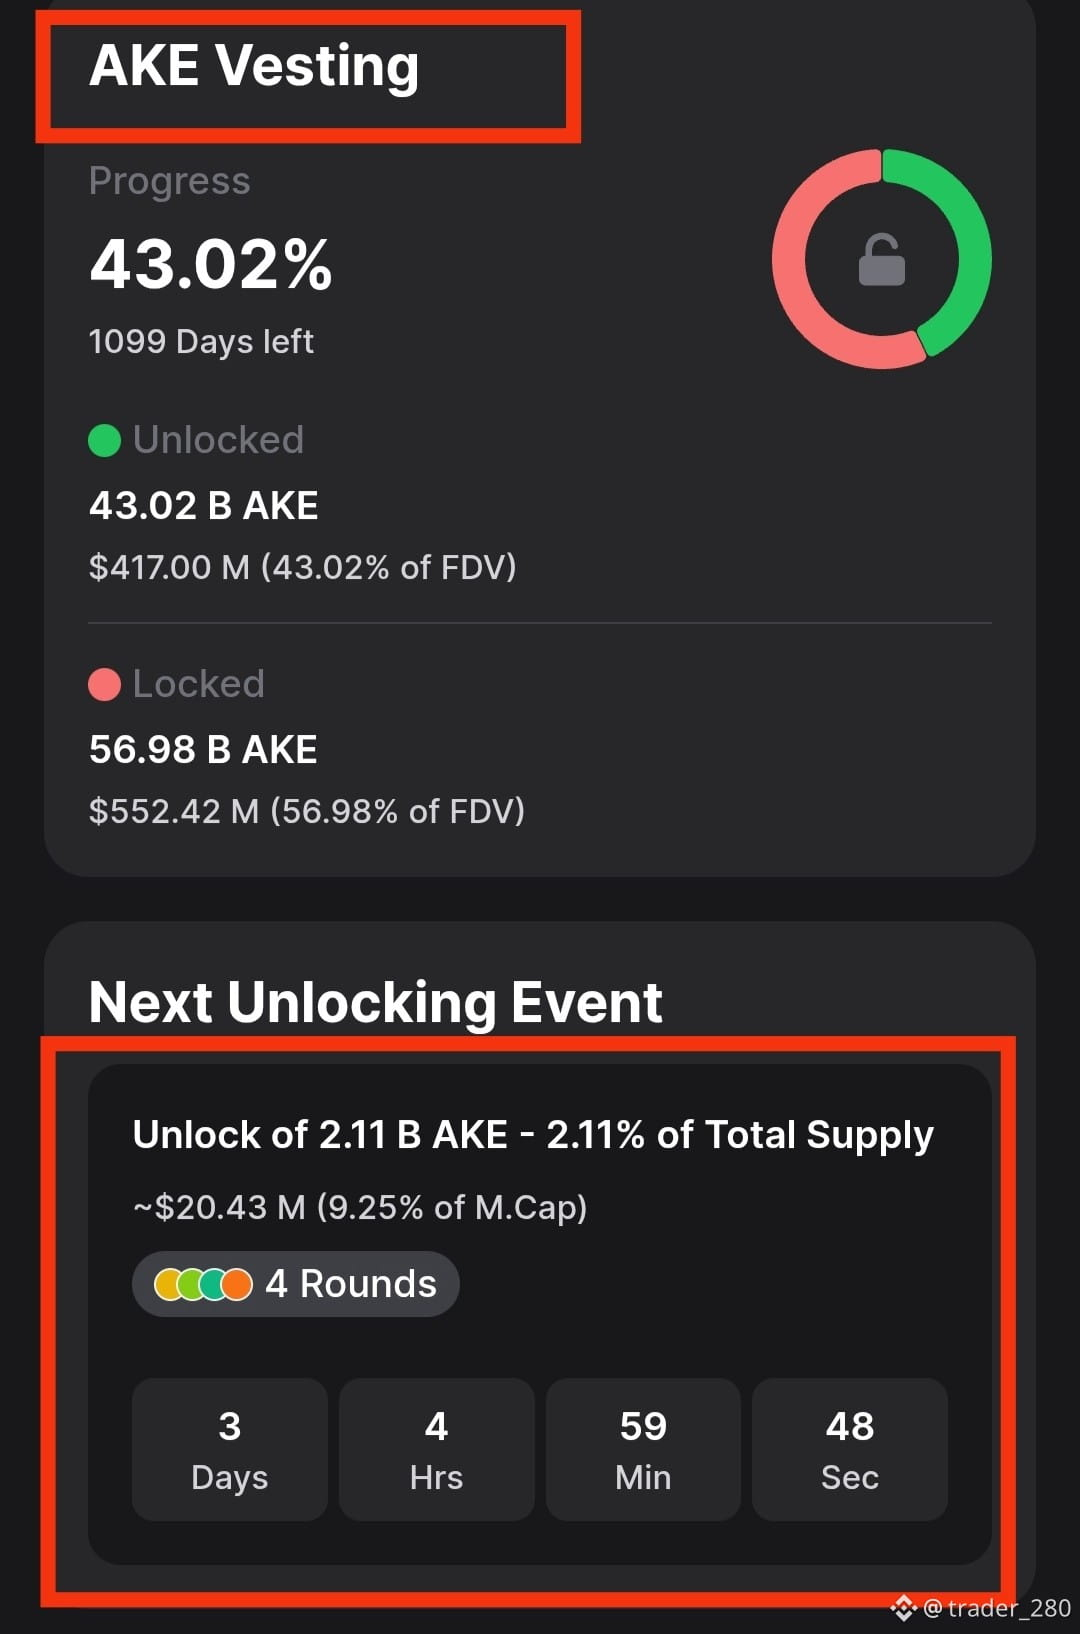
$AKE holder be careful ..im going to open big short and i will hold for 3 days ..DUOR
$AKE holder be careful ..im going to open big short and i will hold for 3 days ..DUOR
259
·
--
Bearish
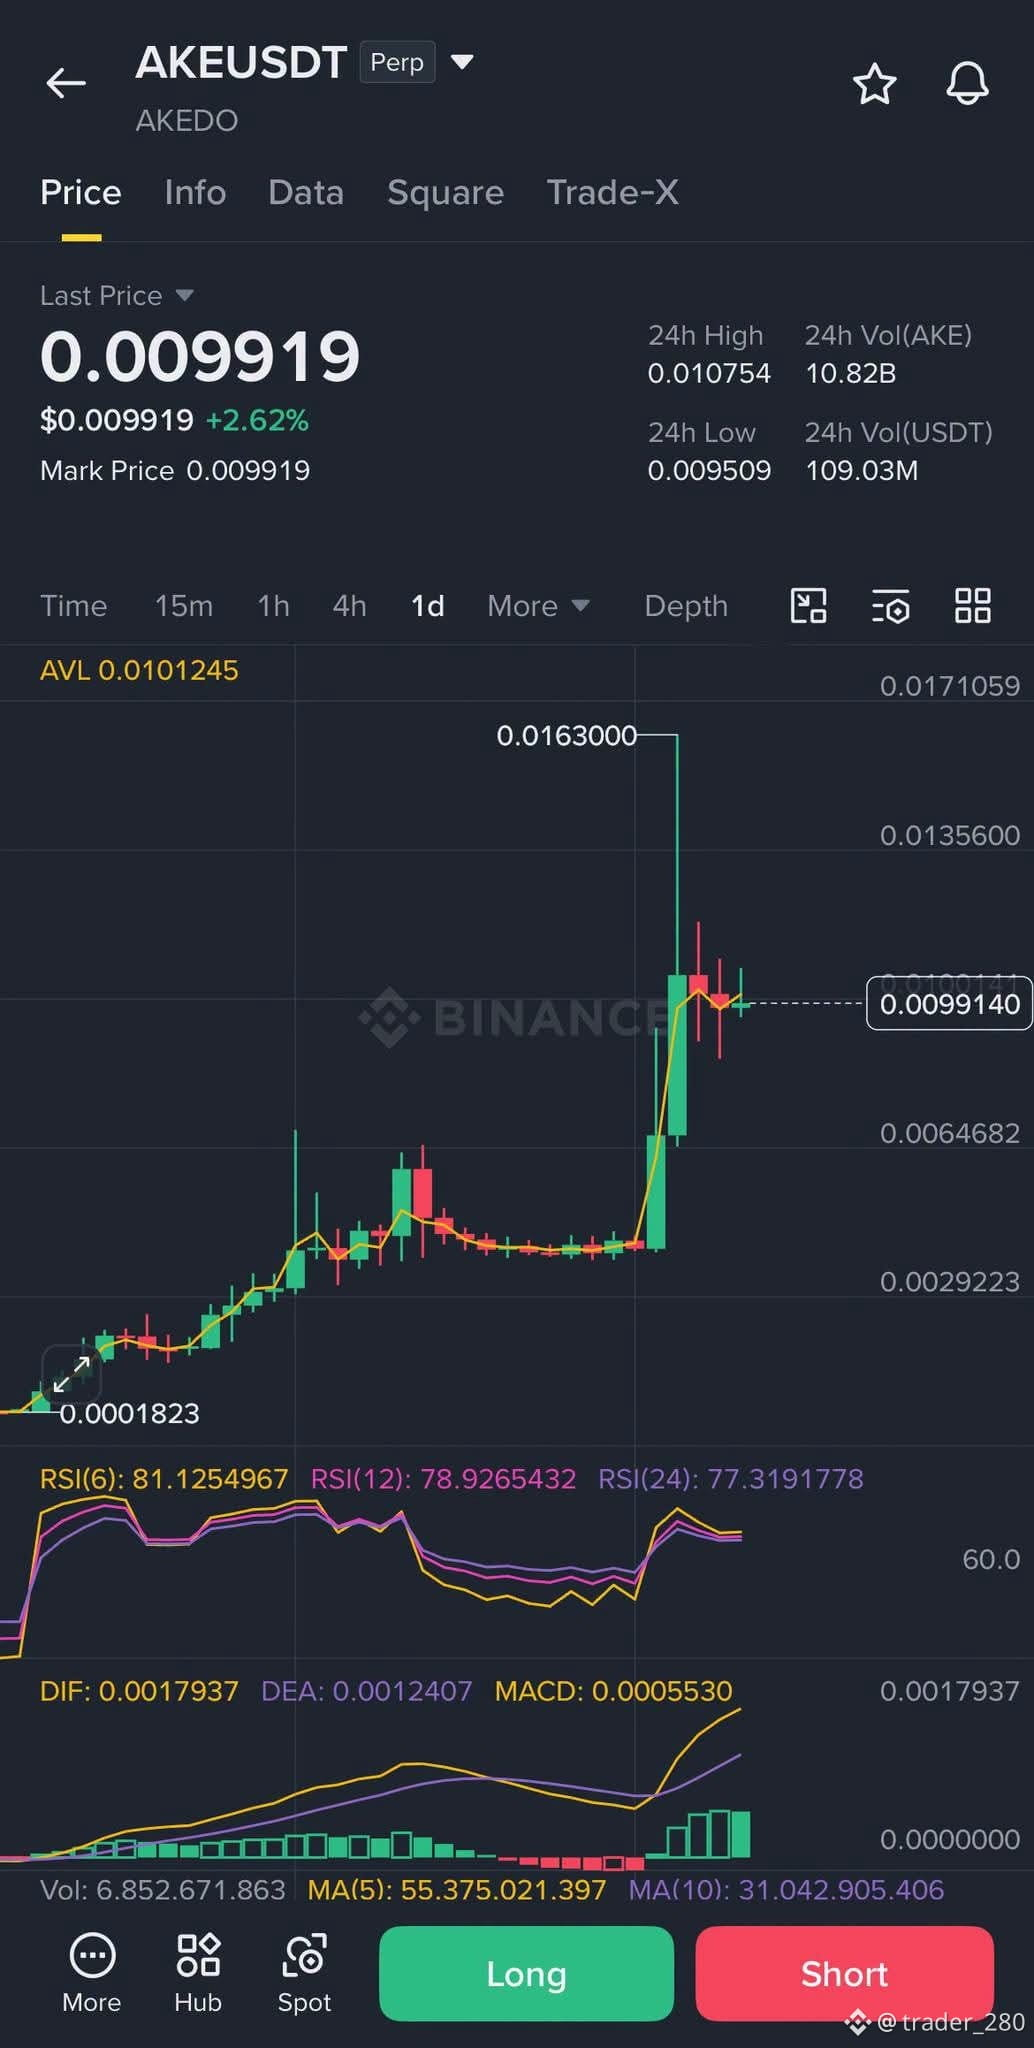
$AKE dumped 5 days before its last unlock in April.
We're now 5 days out from the next one. August 21. Roughly 2.1 billion $AKE hitting the market.
History loves to repeat itself in this game.
But this time feels different. The market's had time to price this one in. Everybody who watched April knows what's coming. That alone changes the setup.
Still, time is ticking. 5 days is close enough that anyone holding should be paying attention, not hoping.
Would I short right now? Nah. Not without confirmation on a real breakdown.
Do you see $AKE dumping before the 21st, or do you think it will pull another rally to trick shorts and trap buyers?
$AKE dumped 5 days before its last unlock in April.
We're now 5 days out from the next one. August 21. Roughly 2.1 billion $AKE hitting the market.
History loves to repeat itself in this game.
But this time feels different. The market's had time to price this one in. Everybody who watched April knows what's coming. That alone changes the setup.
Still, time is ticking. 5 days is close enough that anyone holding should be paying attention, not hoping.
Would I short right now? Nah. Not without confirmation on a real breakdown.
Do you see $AKE dumping before the 21st, or do you think it will pull another rally to trick shorts and trap buyers?
We're now 5 days out from the next one. August 21. Roughly 2.1 billion $AKE hitting the market.
History loves to repeat itself in this game.
But this time feels different. The market's had time to price this one in. Everybody who watched April knows what's coming. That alone changes the setup.
Still, time is ticking. 5 days is close enough that anyone holding should be paying attention, not hoping.
Would I short right now? Nah. Not without confirmation on a real breakdown.
Do you see $AKE dumping before the 21st, or do you think it will pull another rally to trick shorts and trap buyers?
71
·
--
Bearish
$AKE going down slowly keep shorting this coin will surprise you 🚨🚨🚨🚨🚨🚨
$AKE going down slowly keep shorting this coin will surprise you 🚨🚨🚨🚨🚨🚨
trader_280
·
--
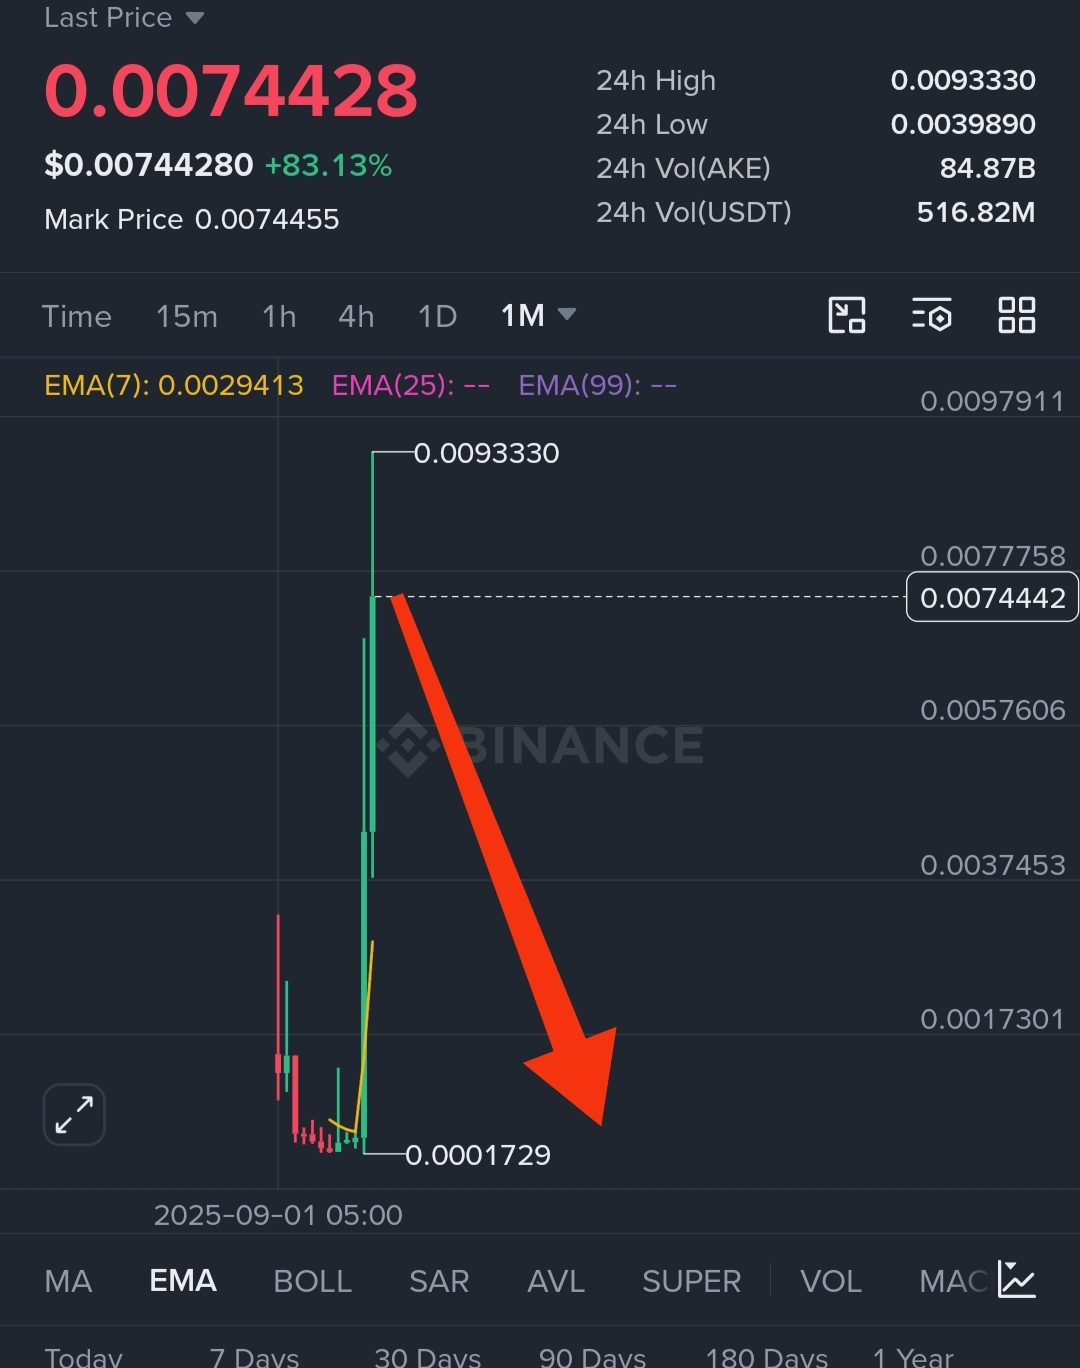
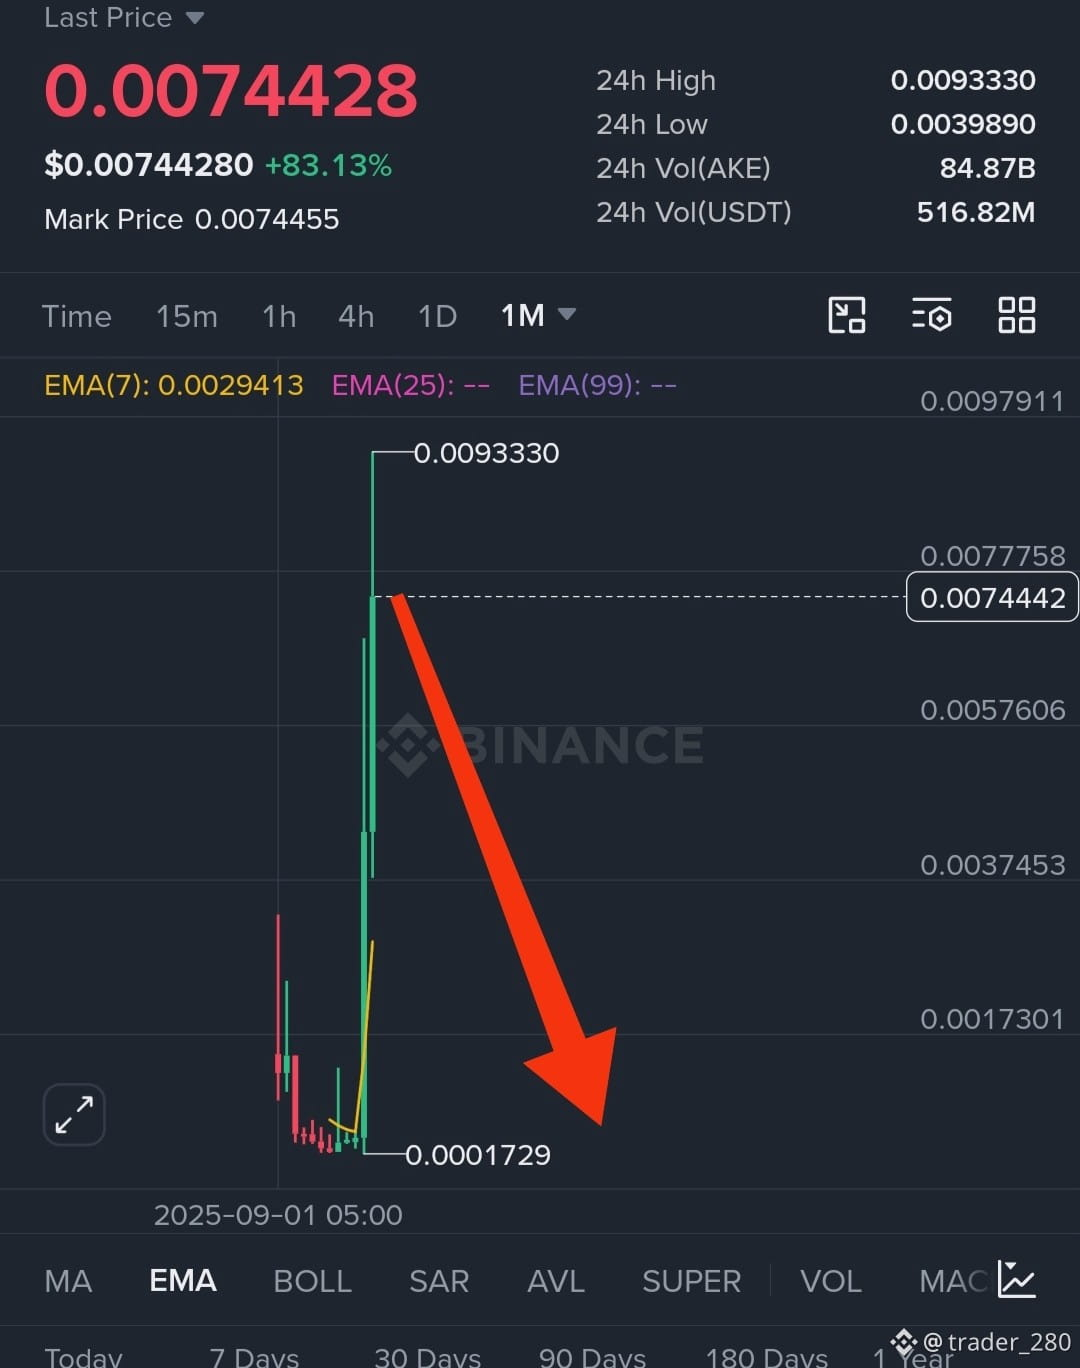
BearishShort $AKE now or regret later
2
210
·
--
Bearish
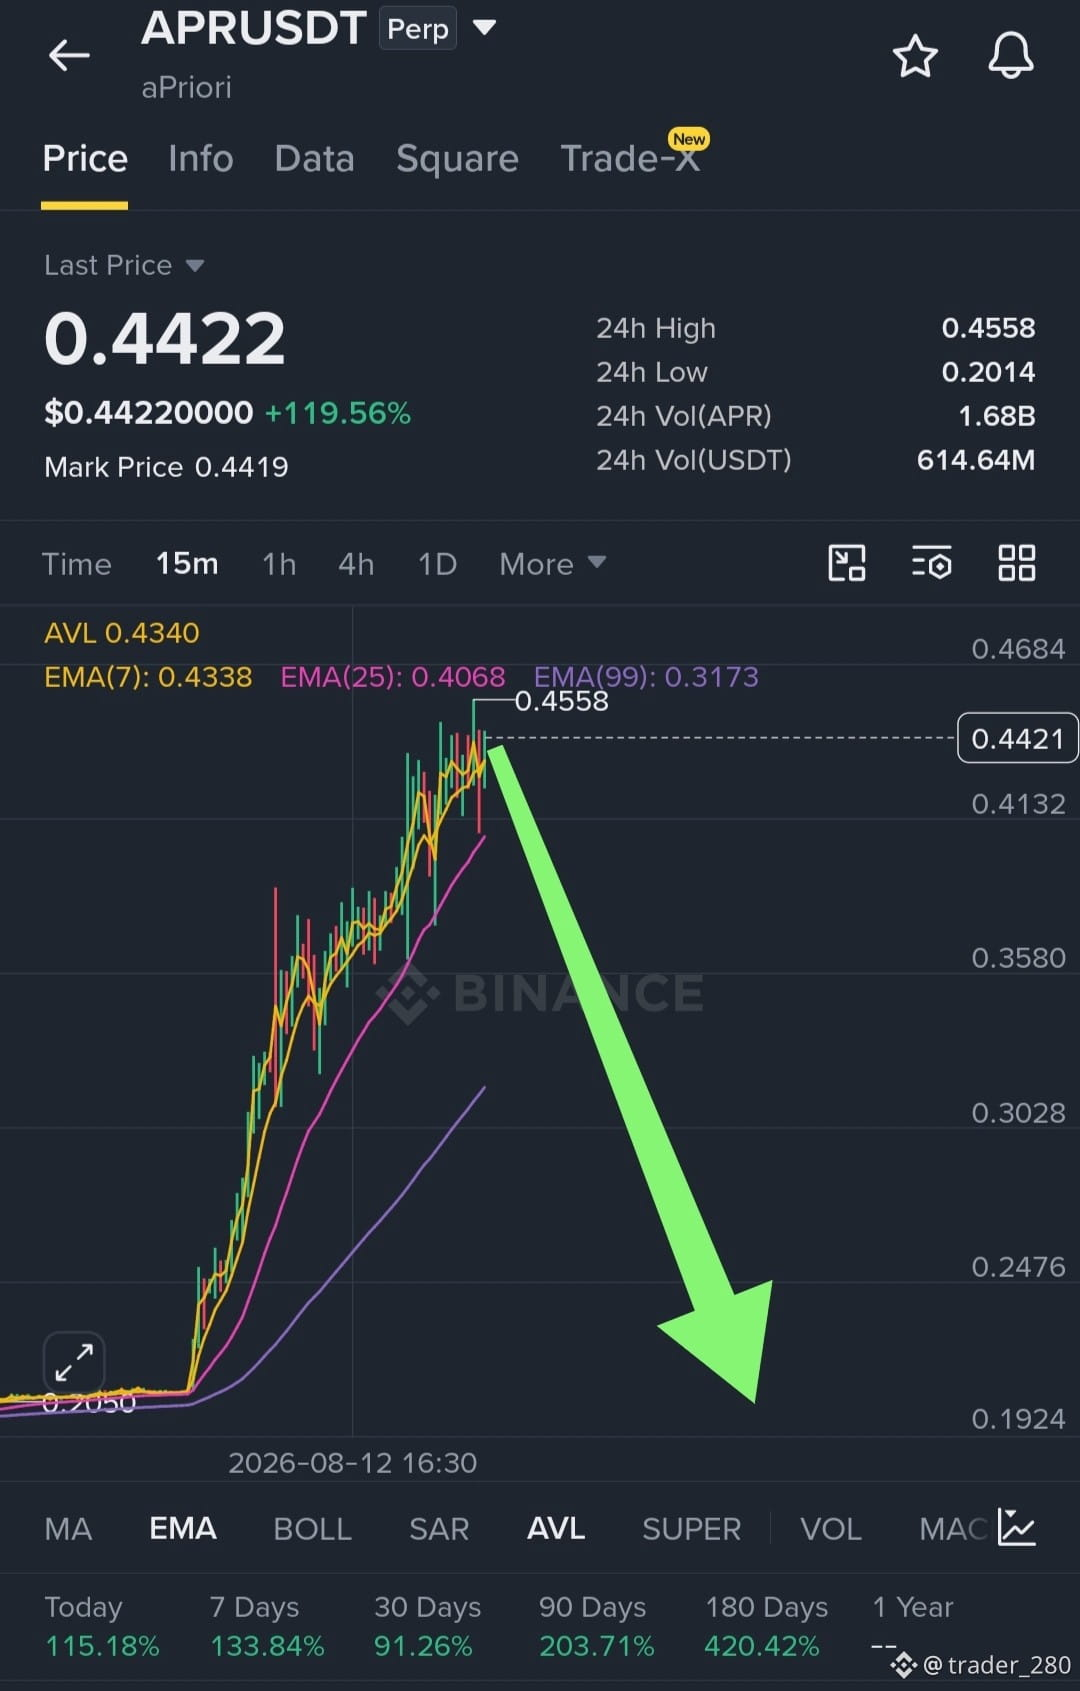
$APR is not looking good ..big dumb on the way ...
$APR is not looking good ..big dumb on the way ...
174
·
--
Bearish
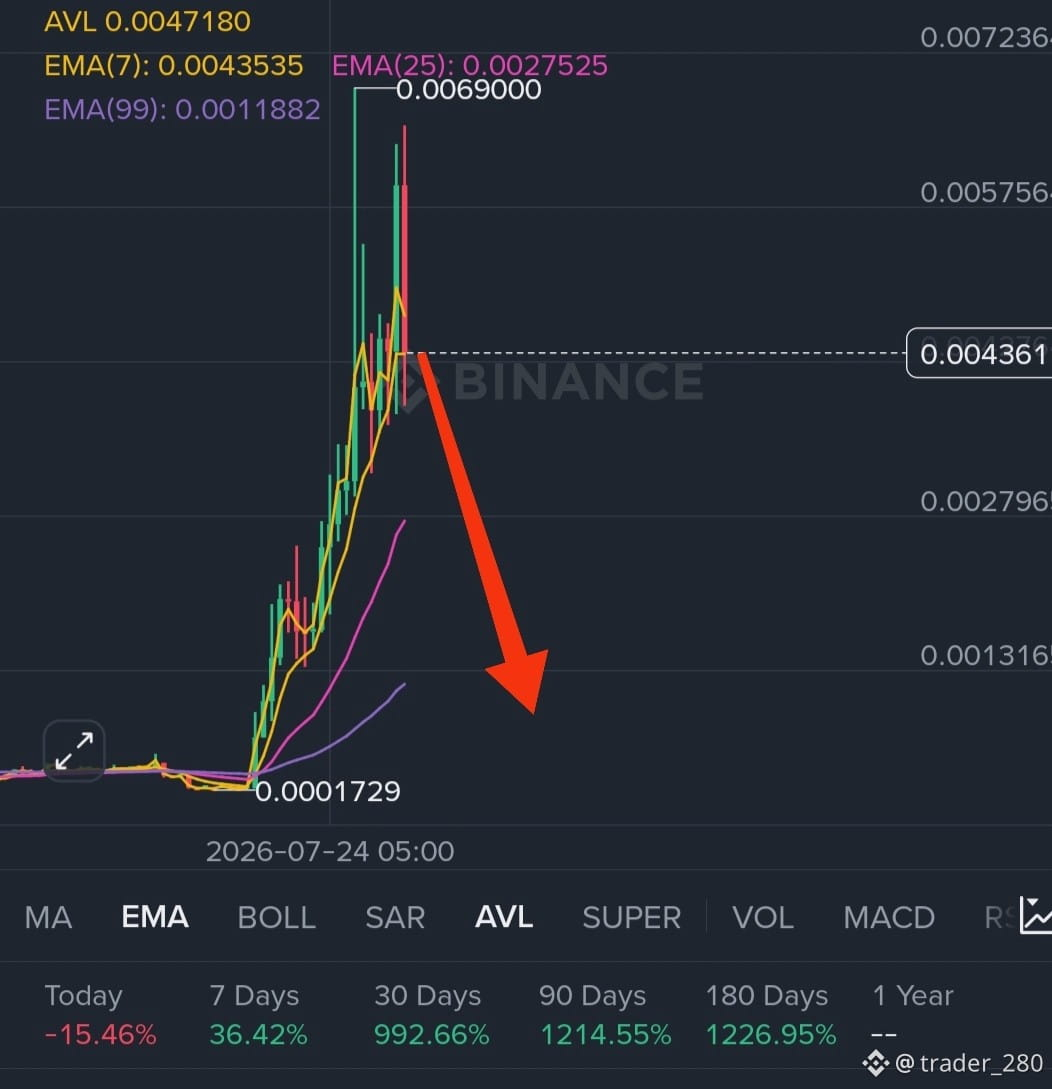
i cannot provide investment advice or analysis on the future price movements of specific cryptocurrency $AKE 🚨🚨🚨
However, a fundamental principle of risk management when evaluating charts is to understand that extremely rapid price spikes are often speculative and may not be sustainable. If you are examining a recent large increase, it is important to be aware of the concept of volatility. High volatility implies the potential for quick and significant price drops.
Before making any financial decisions, you should conduct thorough research and consider consulting with a qualified professional.🚨🚨🚨🚨
i cannot provide investment advice or analysis on the future price movements of specific cryptocurrency $AKE 🚨🚨🚨
However, a fundamental principle of risk management when evaluating charts is to understand that extremely rapid price spikes are often speculative and may not be sustainable. If you are examining a recent large increase, it is important to be aware of the concept of volatility. High volatility implies the potential for quick and significant price drops.
Before making any financial decisions, you should conduct thorough research and consider consulting with a qualified professional.🚨🚨🚨🚨
However, a fundamental principle of risk management when evaluating charts is to understand that extremely rapid price spikes are often speculative and may not be sustainable. If you are examining a recent large increase, it is important to be aware of the concept of volatility. High volatility implies the potential for quick and significant price drops.
Before making any financial decisions, you should conduct thorough research and consider consulting with a qualified professional.🚨🚨🚨🚨
184
·
--
Bearish
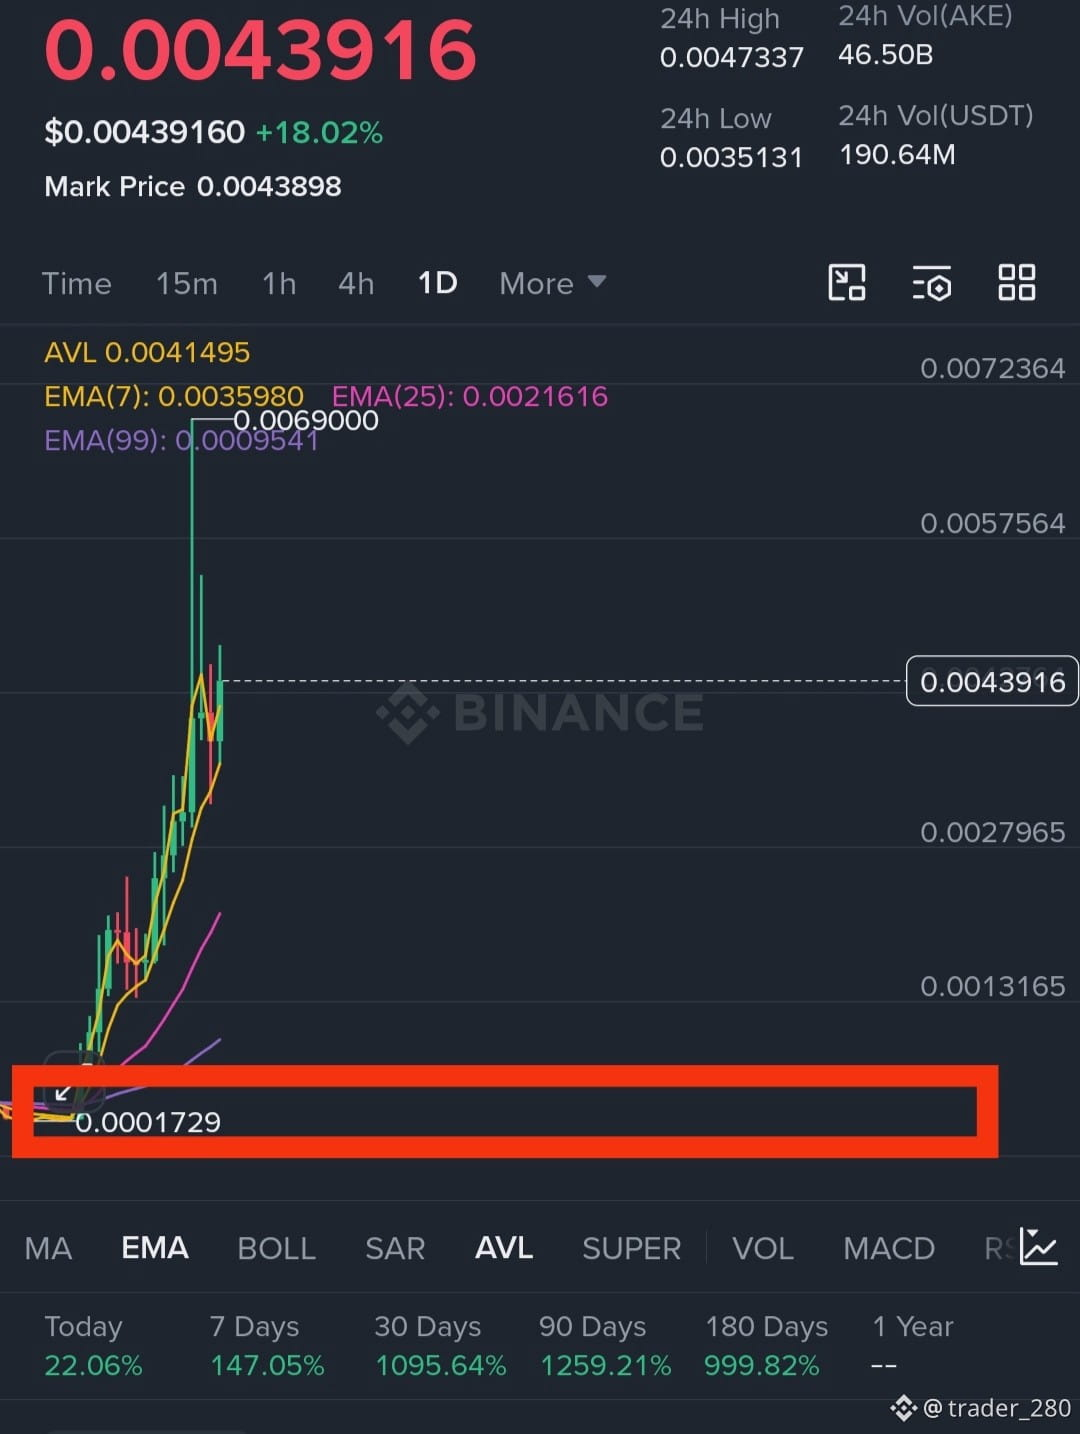
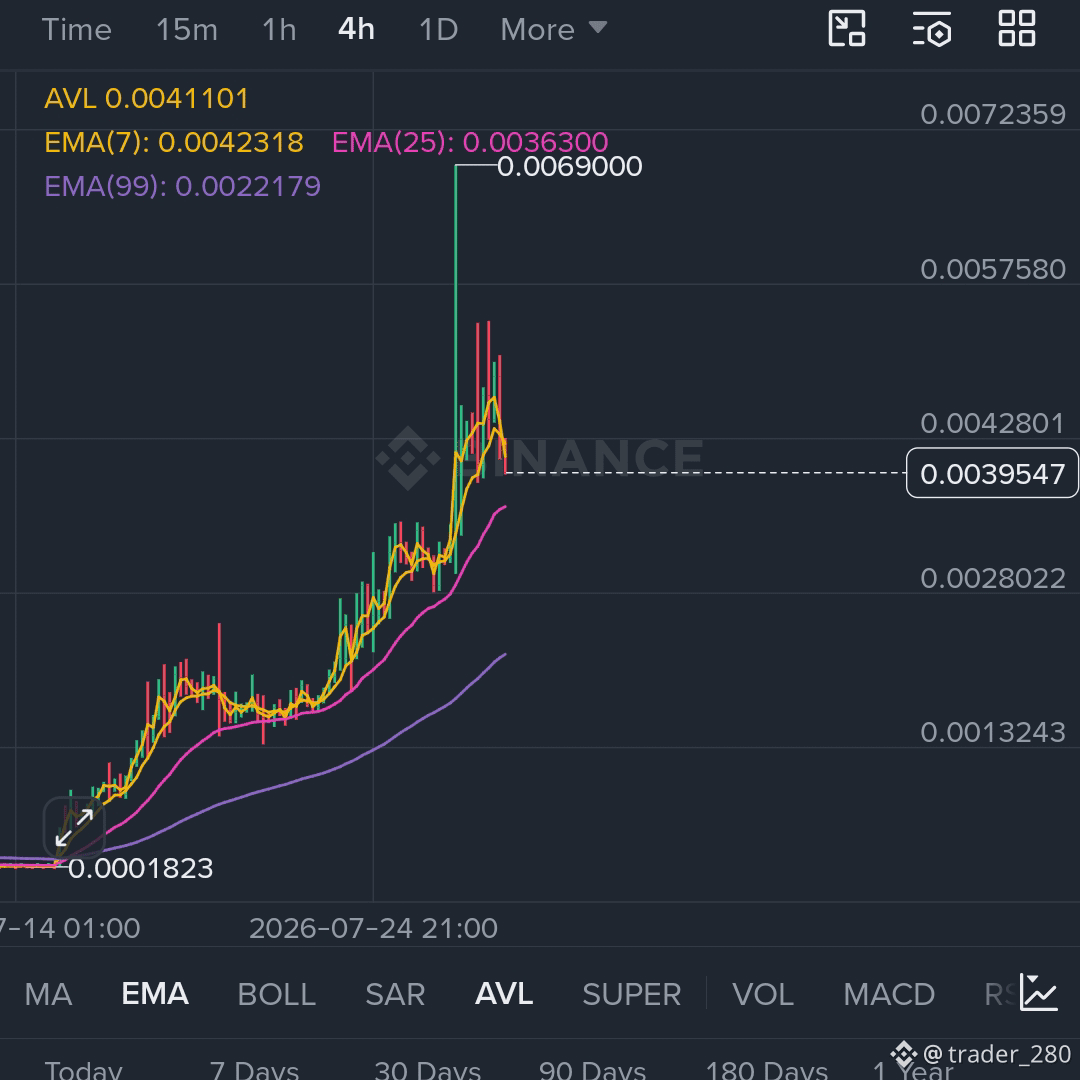
I had previously talked about Bankcoin and $AKE coin in my post. Bankcoin has already sunk, now it is the turn of $AKE ..short the ake coin don't long
I had previously talked about Bankcoin and $AKE coin in my post. Bankcoin has already sunk, now it is the turn of $AKE ..short the ake coin don't long
1.1k
·
--
Bearish
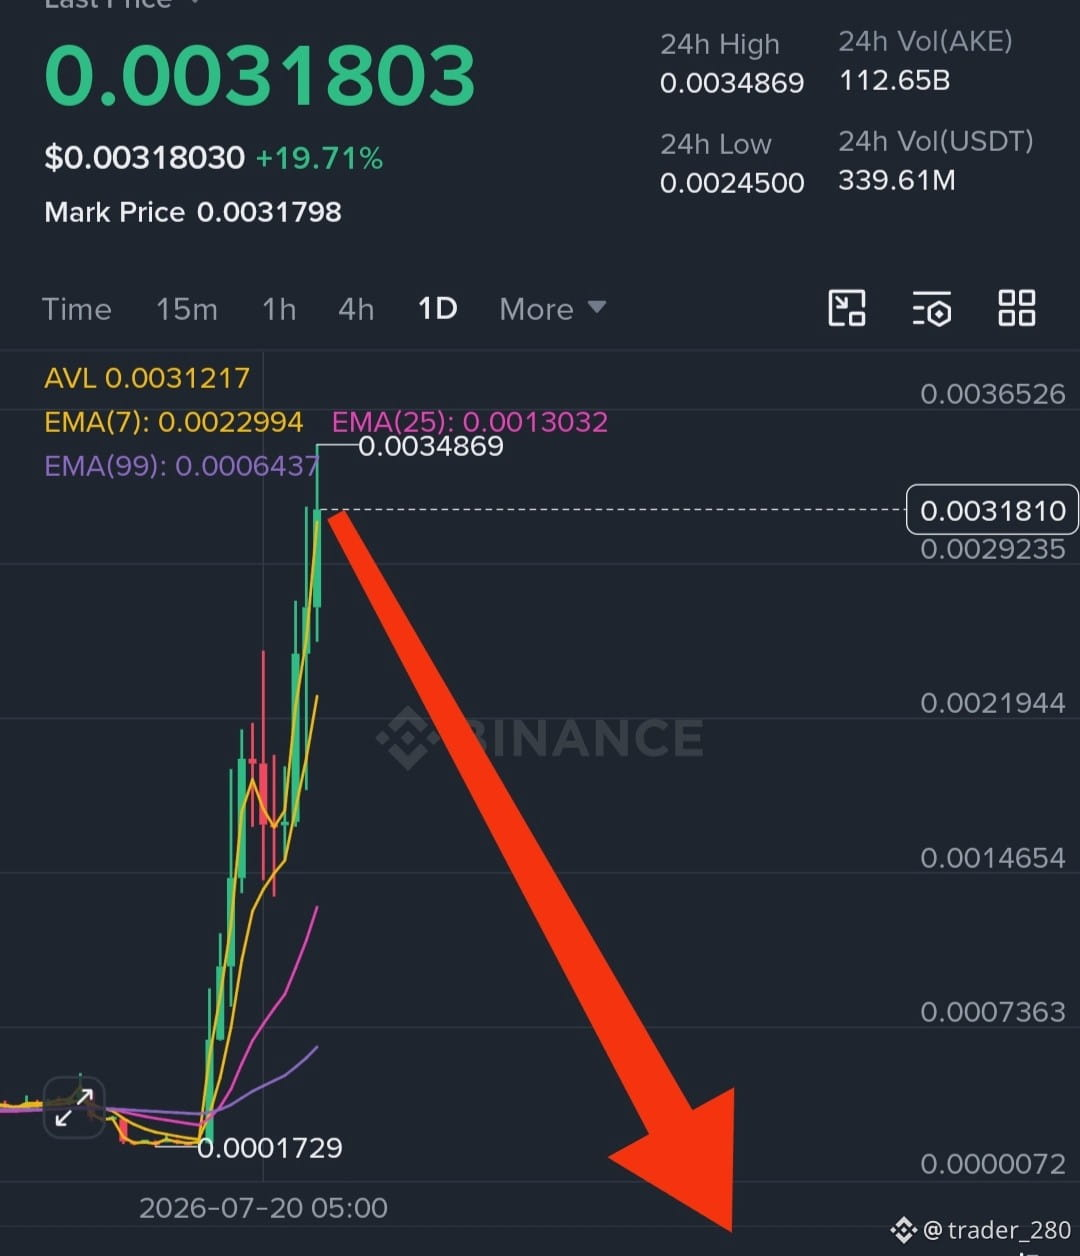
$AKE e is not looking ..be careful don't long if u want your money safe ..short time thanks me later #akedo
$AKE e is not looking ..be careful don't long if u want your money safe ..short time thanks me later #akedo
169
·
--
already told you after my post $AKE Going down 🚨🚨
already told you after my post $AKE Going down 🚨🚨
trader_280
·
--
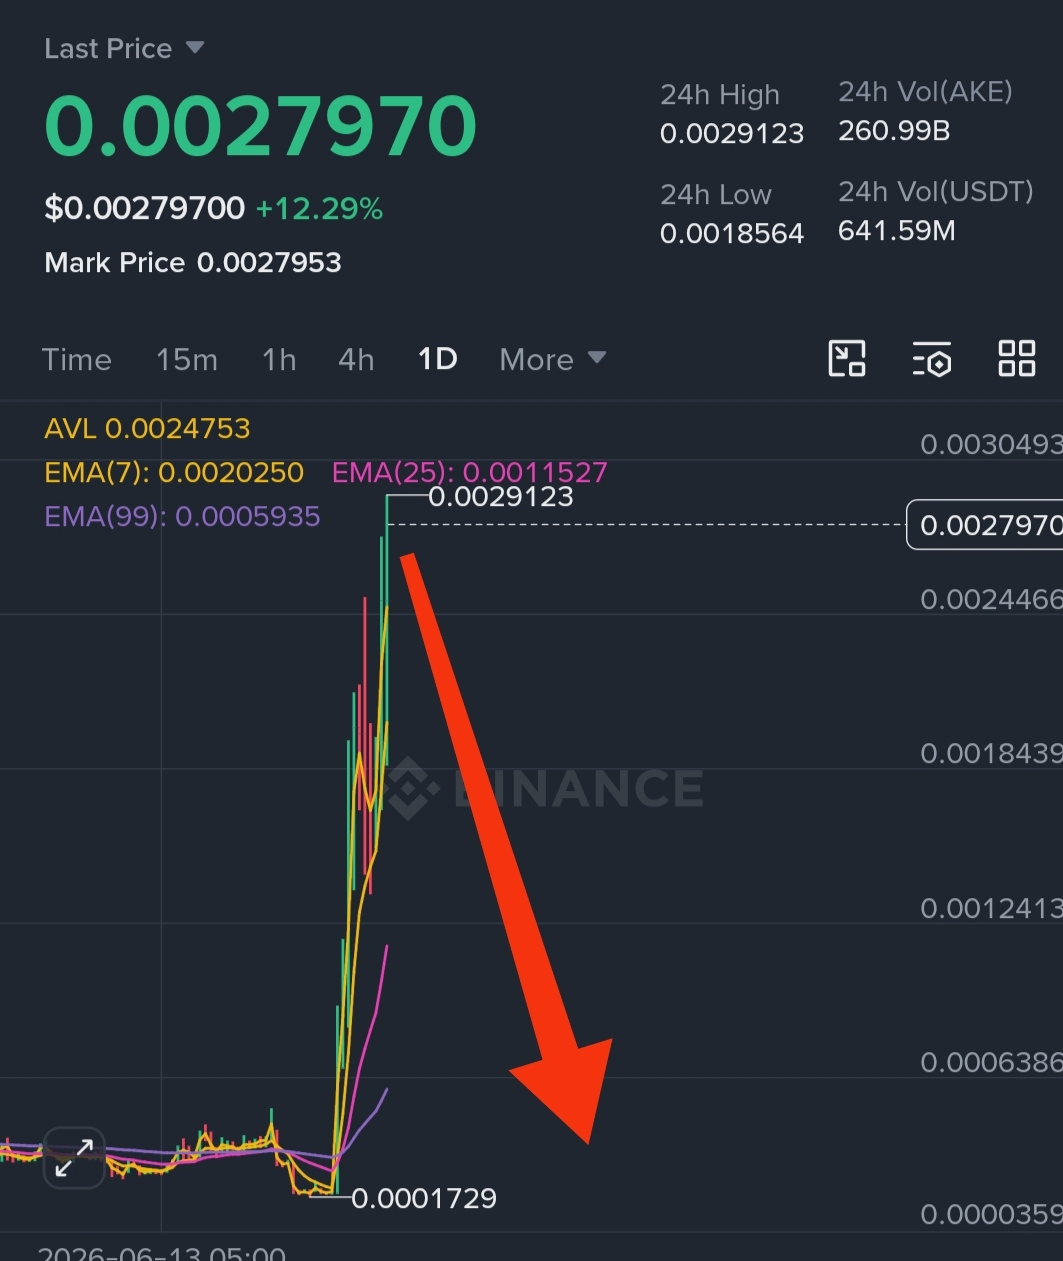
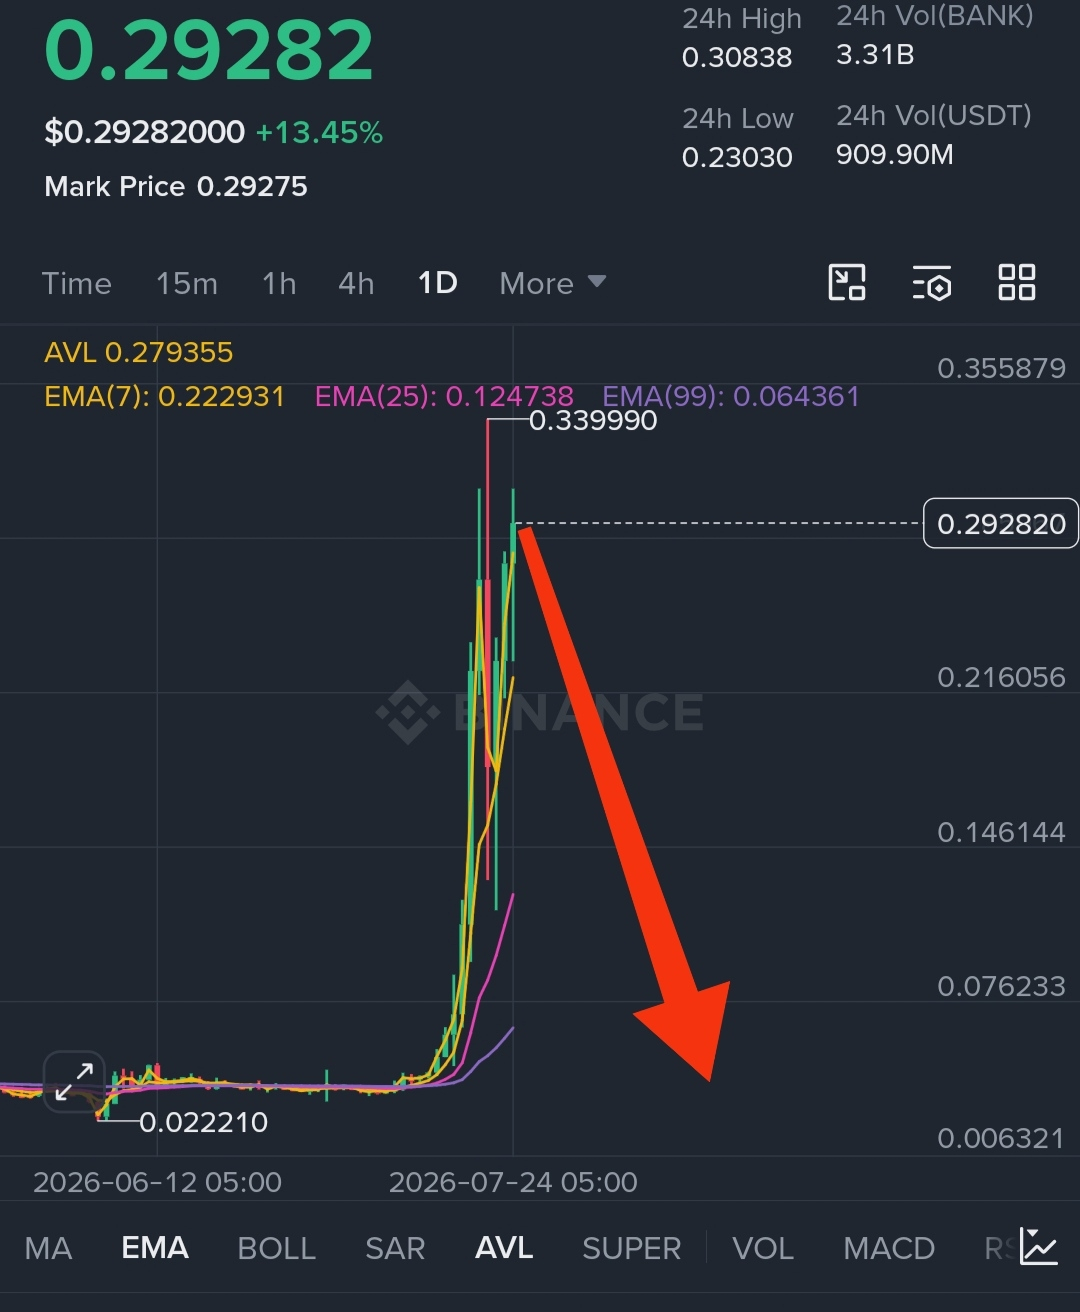
BearishSs My post $AKE and $BANK will be like Lab coin mark my words ..🚨🚨🚨
332
·
--
Bearish
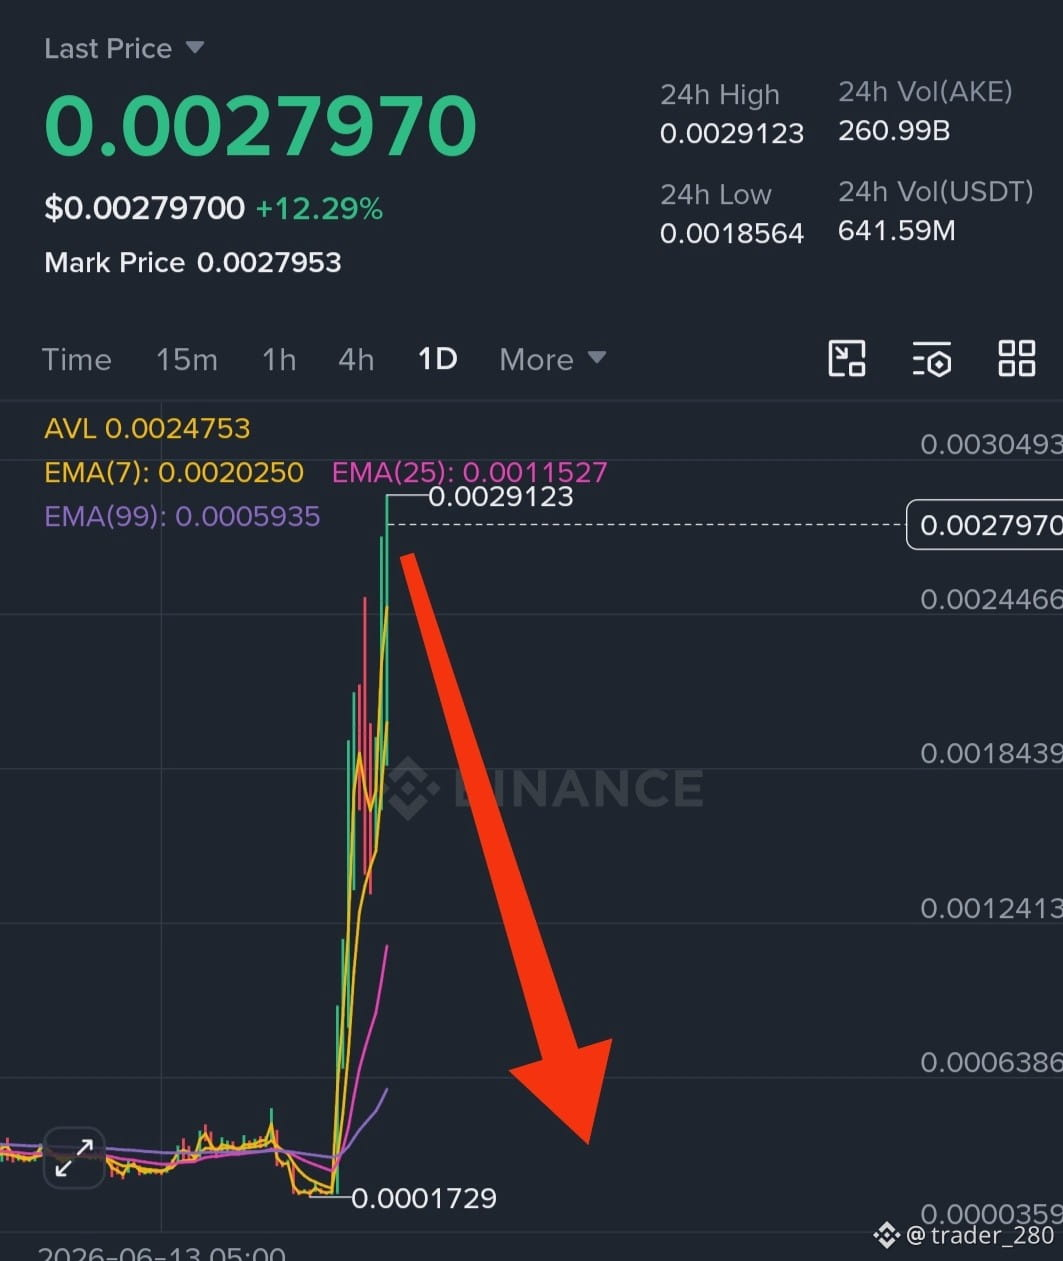
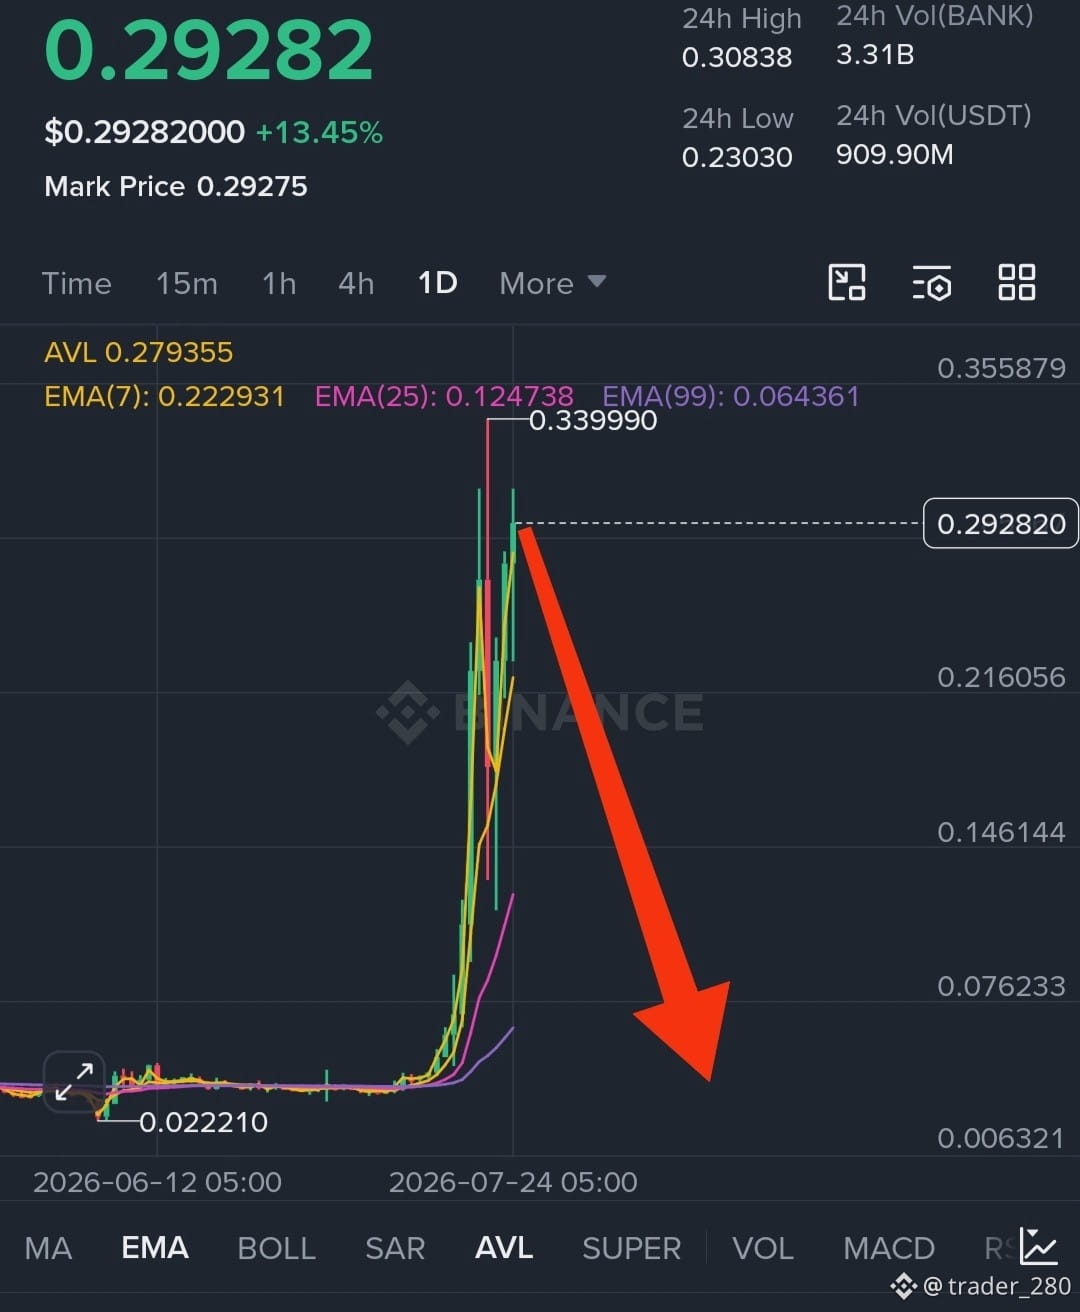
Ss My post $AKE and $BANK will be like Lab coin mark my words ..🚨🚨🚨
Ss My post $AKE and $BANK will be like Lab coin mark my words ..🚨🚨🚨
13
1
9
5.9k
·
--
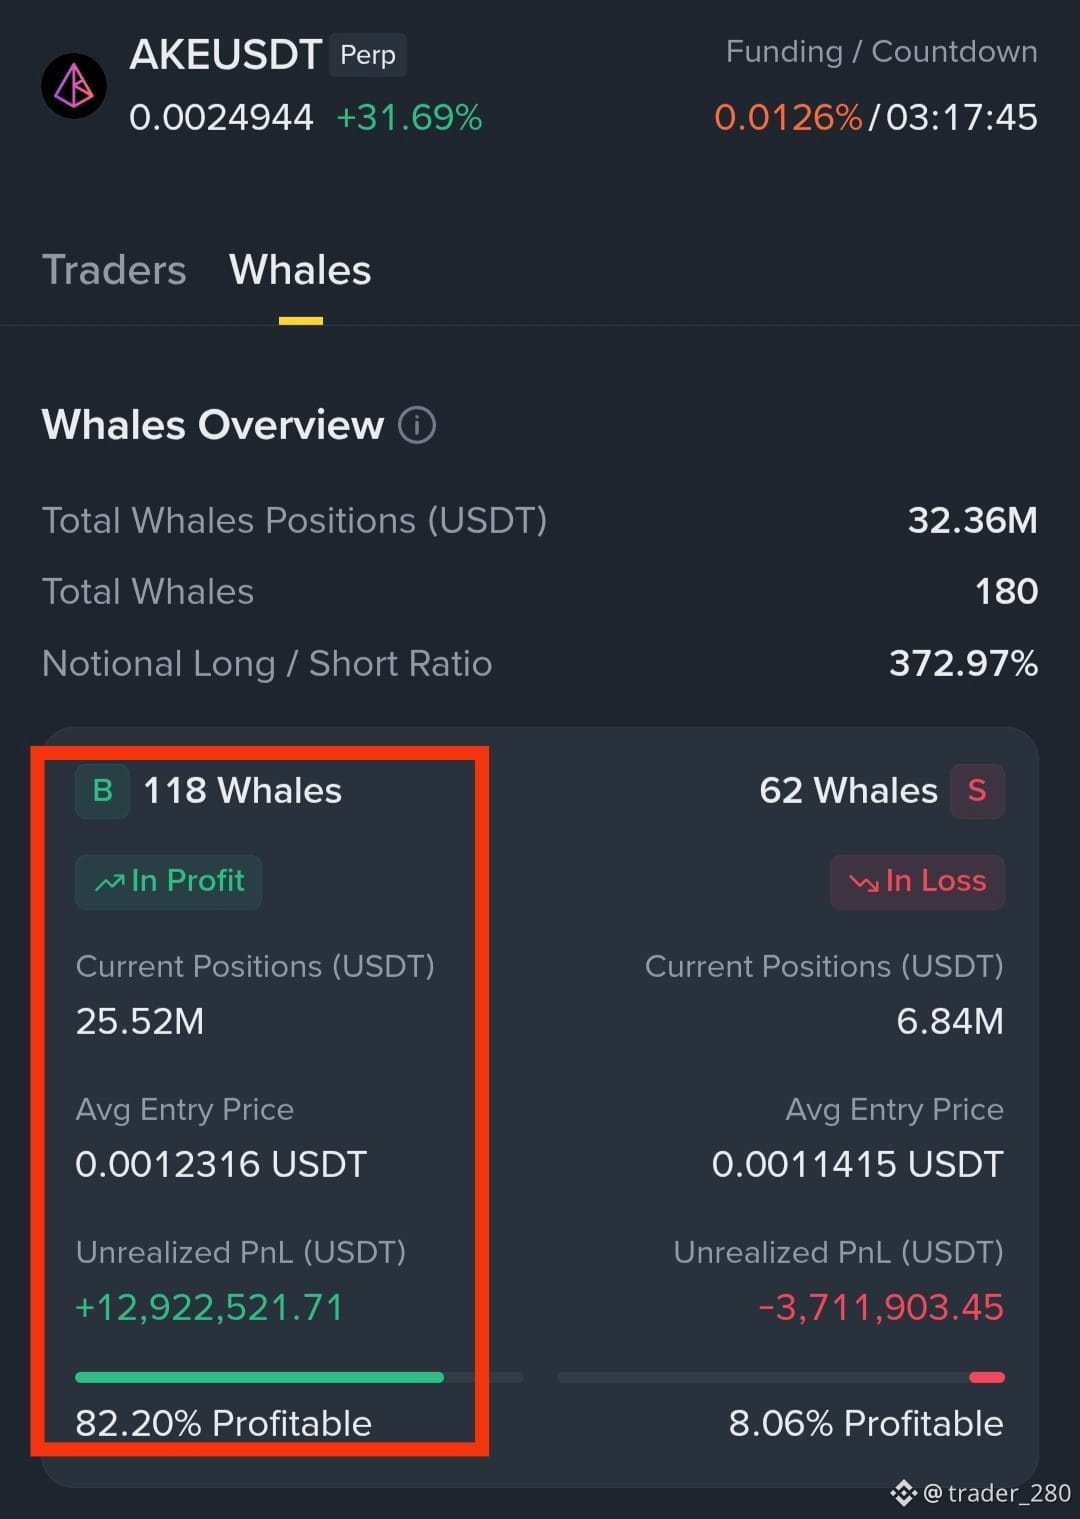
118 whales holding $AKE coin When they run out, this coin will become junk. 🚨🚨🚨 short and hold .. check my others posts #KazakhstanApprovesStrategicDigitalMiningProgram #BitMEXToCloseExchangeSep23
118 whales holding $AKE coin When they run out, this coin will become junk. 🚨🚨🚨 short and hold .. check my others posts #KazakhstanApprovesStrategicDigitalMiningProgram #BitMEXToCloseExchangeSep23
2
517
·
--
don't follow me 😎😎😎 .. check my yesterday post $BANK
don't follow me 😎😎😎 .. check my yesterday post $BANK
trader_280
·
--
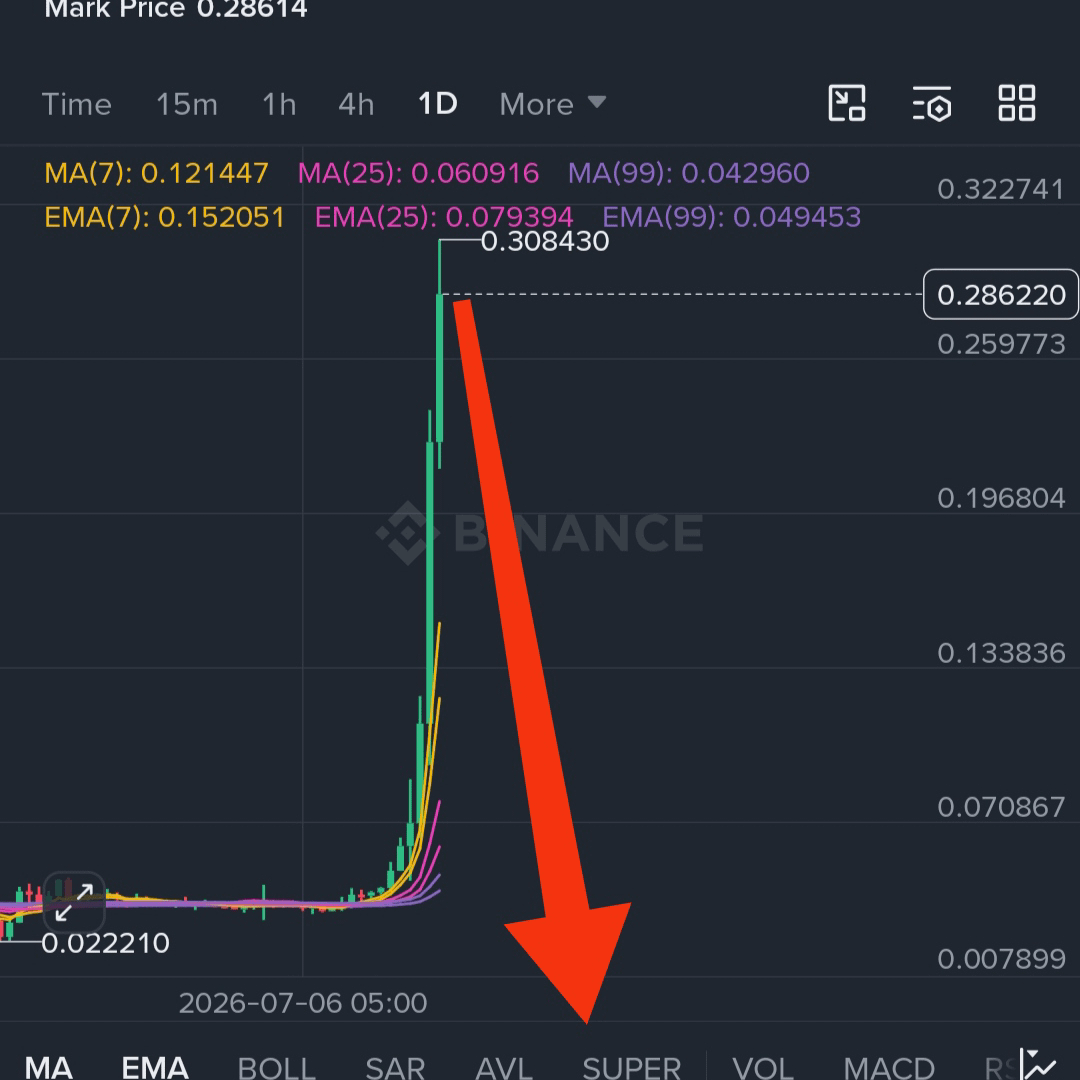
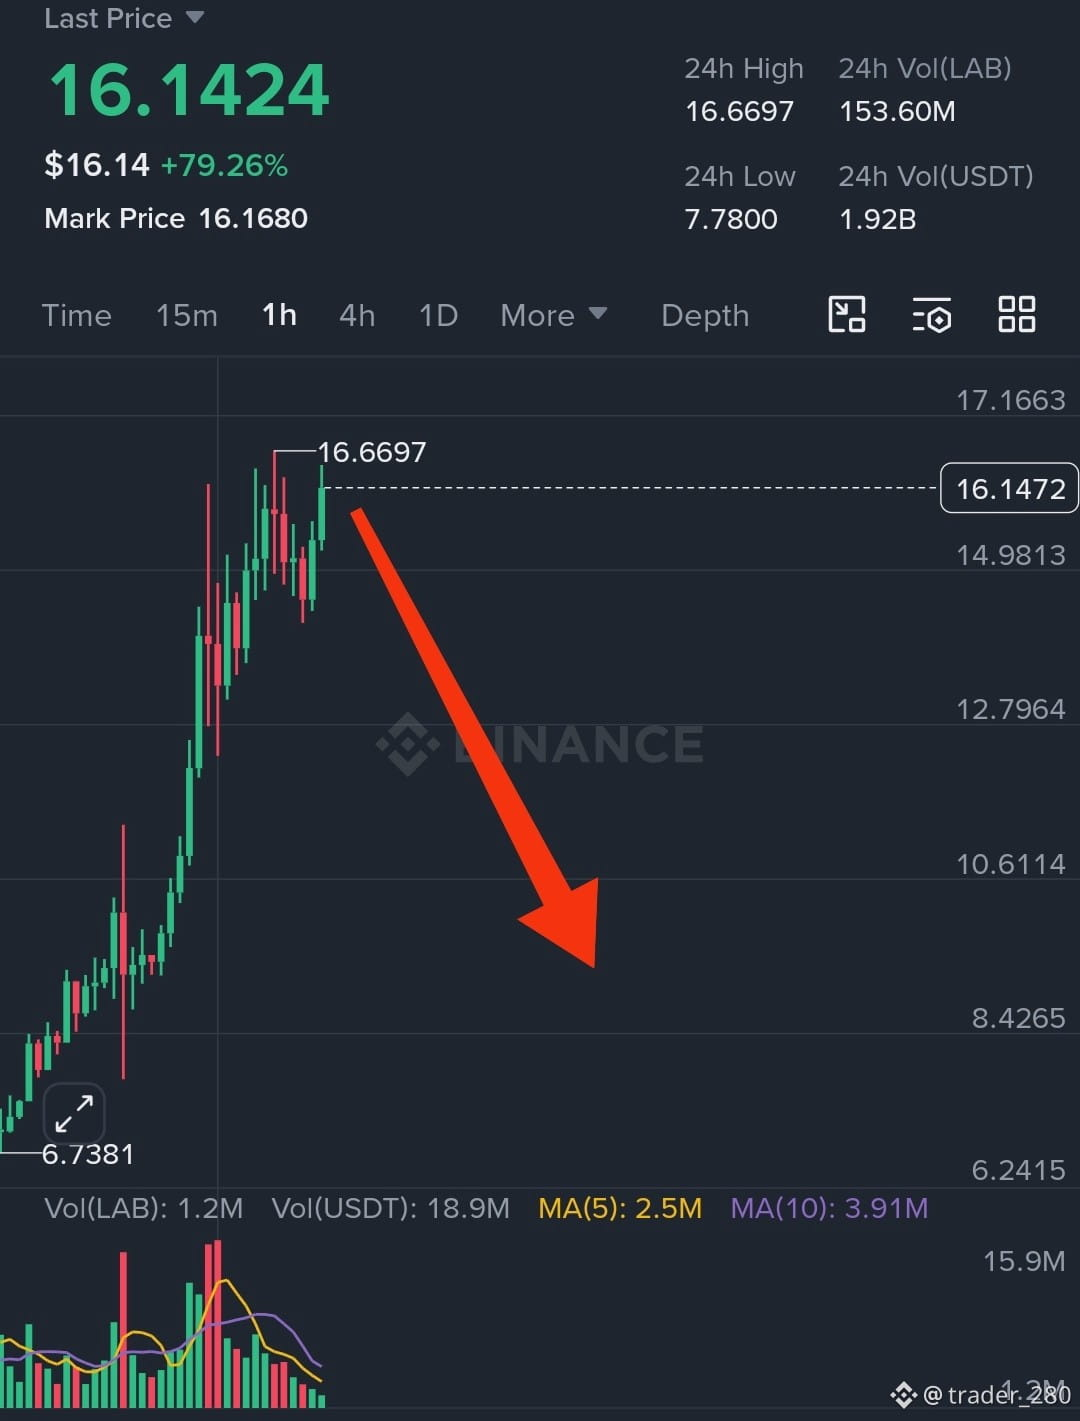
Ss my this post $BANK will be down like my red arrow soon 🚨🚨🚨🚨 short or regret
61
·
--
Ss my this post $BANK will be down like my red arrow soon 🚨🚨🚨🚨 short or regret
Ss my this post $BANK will be down like my red arrow soon 🚨🚨🚨🚨 short or regret
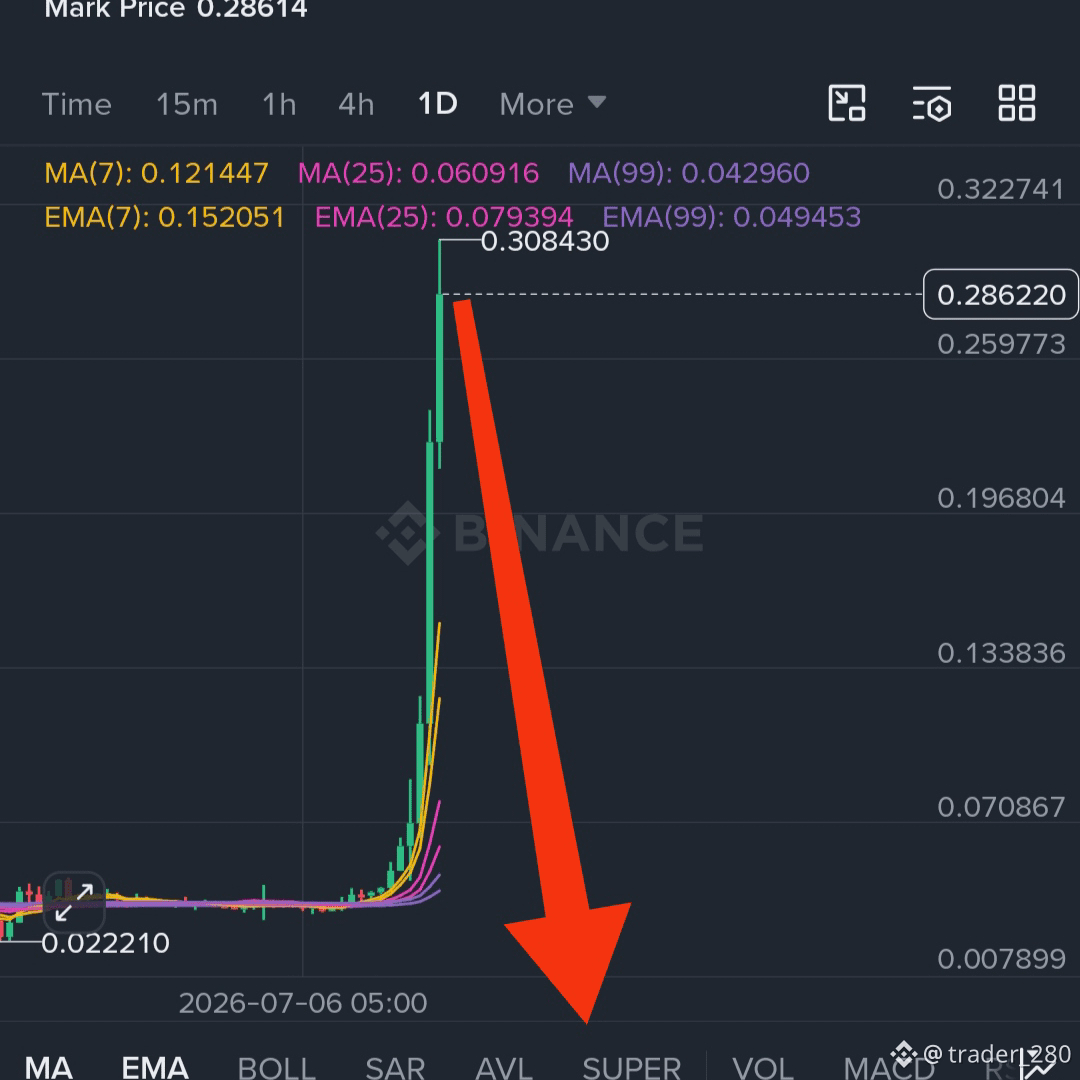
1
175
·
--
$AKE looking bad don't long 🚨🚨🚨🚨 short the coin
$AKE looking bad don't long 🚨🚨🚨🚨 short the coin
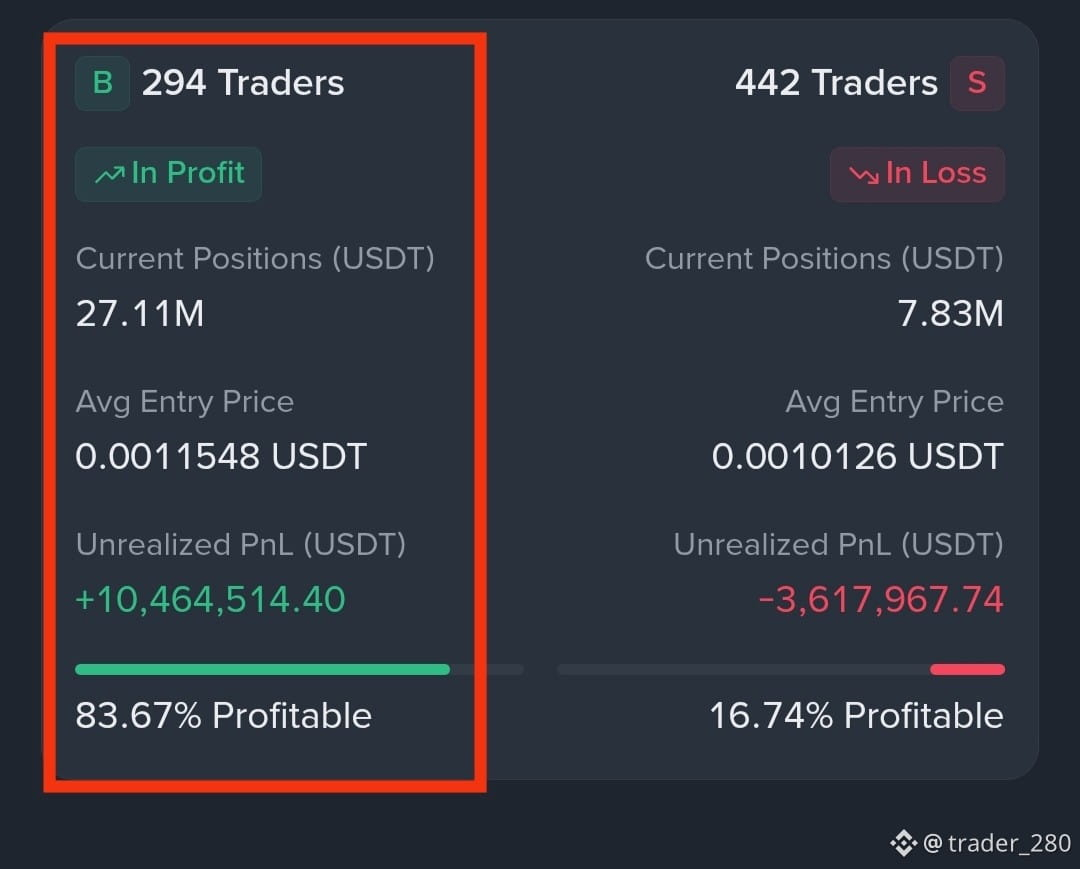
1
395

·
--
Bearish
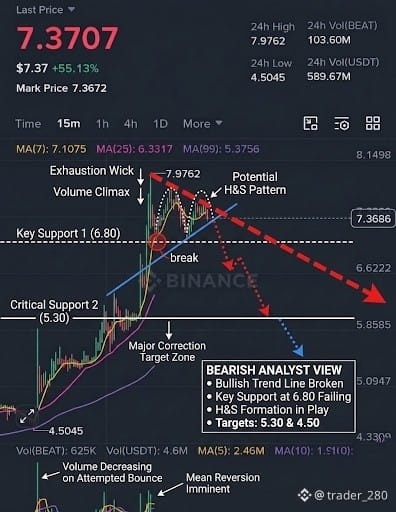
15-minute (15m) chart provided for the $BEAT token, here is a technical breakdown of the current price action and whether it points toward a bearish turn.
1. Key Metrics & Price Action
Current Last Price:7.3707 (Up massive at +55.13\%)
Recent Peak:T$he price hit a local high of 7.9762 before hitting sharp resistance
The Candlesticks:The most recent candles show a rejection at the top.After tapping 7.97a red candle pushed back down, and the current live candle is consolidating just below 7.37.
2. Moving Averages (MA) Analysis
The moving averages are currently arranged in a classic bullish structure.but they also highlight how overextended this rally is
MA(7).Yellow (7.1075):The price is still trading above the 7-period moving average, which is providing immediate short-term support.
MA(25).Pink (6.3317):The gap between the current price (7.37) and the MA(25) is quite wide.
MA(99).Purple (5.3756).The asset is severely overextended relative to its long-term average$
3. Indicators Suggesting a Potential "Bearish" Pullback
While a single 15-minute chart can't predict a macro "bear market," there are strong technical signs of an impending short-term bearish reversal or sharp correction
Blow-off Top Characteristics:The almost vertical green surge followed by a long upper wick near 7.97 suggests buyers exhausted themselves.
Mean Reversion Risk: When an asset spikes over 55% in a short window, it inevitably needs to look for a higher low. If the price breaks down below the MA(7) at 7.10 a swift drop toward the MA(25) near 6.33 is highly likely.
Volume Clues:The volume bars at the bottom show massive spikes during the vertical push, but if buying volume starts drying up on the next few candles while the price stalls.the sellers will easily take control
Technical Summary
This is not a macro bear market asset yet, but it is a highly volatile.overextended chart flashing exhaustion signs.
Crucial Levels to Watch:
Support: 7.10 (MA7). If this fails, the next major stop is 6.33
Resistance: 7.97. Buyers have to clear this high to keep the bullish momentum alive
15-minute (15m) chart provided for the $BEAT token, here is a technical breakdown of the current price action and whether it points toward a bearish turn.
1. Key Metrics & Price Action
Current Last Price:7.3707 (Up massive at +55.13\%)
Recent Peak:T$he price hit a local high of 7.9762 before hitting sharp resistance
The Candlesticks:The most recent candles show a rejection at the top.After tapping 7.97a red candle pushed back down, and the current live candle is consolidating just below 7.37.
2. Moving Averages (MA) Analysis
The moving averages are currently arranged in a classic bullish structure.but they also highlight how overextended this rally is
MA(7).Yellow (7.1075):The price is still trading above the 7-period moving average, which is providing immediate short-term support.
MA(25).Pink (6.3317):The gap between the current price (7.37) and the MA(25) is quite wide.
MA(99).Purple (5.3756).The asset is severely overextended relative to its long-term average$
3. Indicators Suggesting a Potential "Bearish" Pullback
While a single 15-minute chart can't predict a macro "bear market," there are strong technical signs of an impending short-term bearish reversal or sharp correction
Blow-off Top Characteristics:The almost vertical green surge followed by a long upper wick near 7.97 suggests buyers exhausted themselves.
Mean Reversion Risk: When an asset spikes over 55% in a short window, it inevitably needs to look for a higher low. If the price breaks down below the MA(7) at 7.10 a swift drop toward the MA(25) near 6.33 is highly likely.
Volume Clues:The volume bars at the bottom show massive spikes during the vertical push, but if buying volume starts drying up on the next few candles while the price stalls.the sellers will easily take control
Technical Summary
This is not a macro bear market asset yet, but it is a highly volatile.overextended chart flashing exhaustion signs.
Crucial Levels to Watch:
Support: 7.10 (MA7). If this fails, the next major stop is 6.33
Resistance: 7.97. Buyers have to clear this high to keep the bullish momentum alive
1. Key Metrics & Price Action
Current Last Price:7.3707 (Up massive at +55.13\%)
Recent Peak:T$he price hit a local high of 7.9762 before hitting sharp resistance
The Candlesticks:The most recent candles show a rejection at the top.After tapping 7.97a red candle pushed back down, and the current live candle is consolidating just below 7.37.
2. Moving Averages (MA) Analysis
The moving averages are currently arranged in a classic bullish structure.but they also highlight how overextended this rally is
MA(7).Yellow (7.1075):The price is still trading above the 7-period moving average, which is providing immediate short-term support.
MA(25).Pink (6.3317):The gap between the current price (7.37) and the MA(25) is quite wide.
MA(99).Purple (5.3756).The asset is severely overextended relative to its long-term average$
3. Indicators Suggesting a Potential "Bearish" Pullback
While a single 15-minute chart can't predict a macro "bear market," there are strong technical signs of an impending short-term bearish reversal or sharp correction
Blow-off Top Characteristics:The almost vertical green surge followed by a long upper wick near 7.97 suggests buyers exhausted themselves.
Mean Reversion Risk: When an asset spikes over 55% in a short window, it inevitably needs to look for a higher low. If the price breaks down below the MA(7) at 7.10 a swift drop toward the MA(25) near 6.33 is highly likely.
Volume Clues:The volume bars at the bottom show massive spikes during the vertical push, but if buying volume starts drying up on the next few candles while the price stalls.the sellers will easily take control
Technical Summary
This is not a macro bear market asset yet, but it is a highly volatile.overextended chart flashing exhaustion signs.
Crucial Levels to Watch:
Support: 7.10 (MA7). If this fails, the next major stop is 6.33
Resistance: 7.97. Buyers have to clear this high to keep the bullish momentum alive
330
Log in to explore more content
Join global crypto users on Binance Square
⚡️ Get latest and useful information about crypto.
💬 Trusted by the world’s largest crypto exchange.
👍 Discover real insights from verified creators.
Email / Phone number
Trending Topics
BinanceIncidentReport
11,987 views
313 Discussing
29 October 2026 Binance Security Incident: Initial Findings and Response Update
Binance Blog
·171 Likes
·481.9k views
BinanceReopensWithdrawalsForMoreAssets
107,880 views
1,590 Discussing
BinanceHourlyDepositsExceedWithdrawals
51,811 views
697 Discussing