

Niru Pon Chakma
630 Posts

Niru Pon Chakma
Report
Block User
The future belongs to those who understand crypto before the world does.
3 Following
509 Followers
1.2K+ Liked
Posts
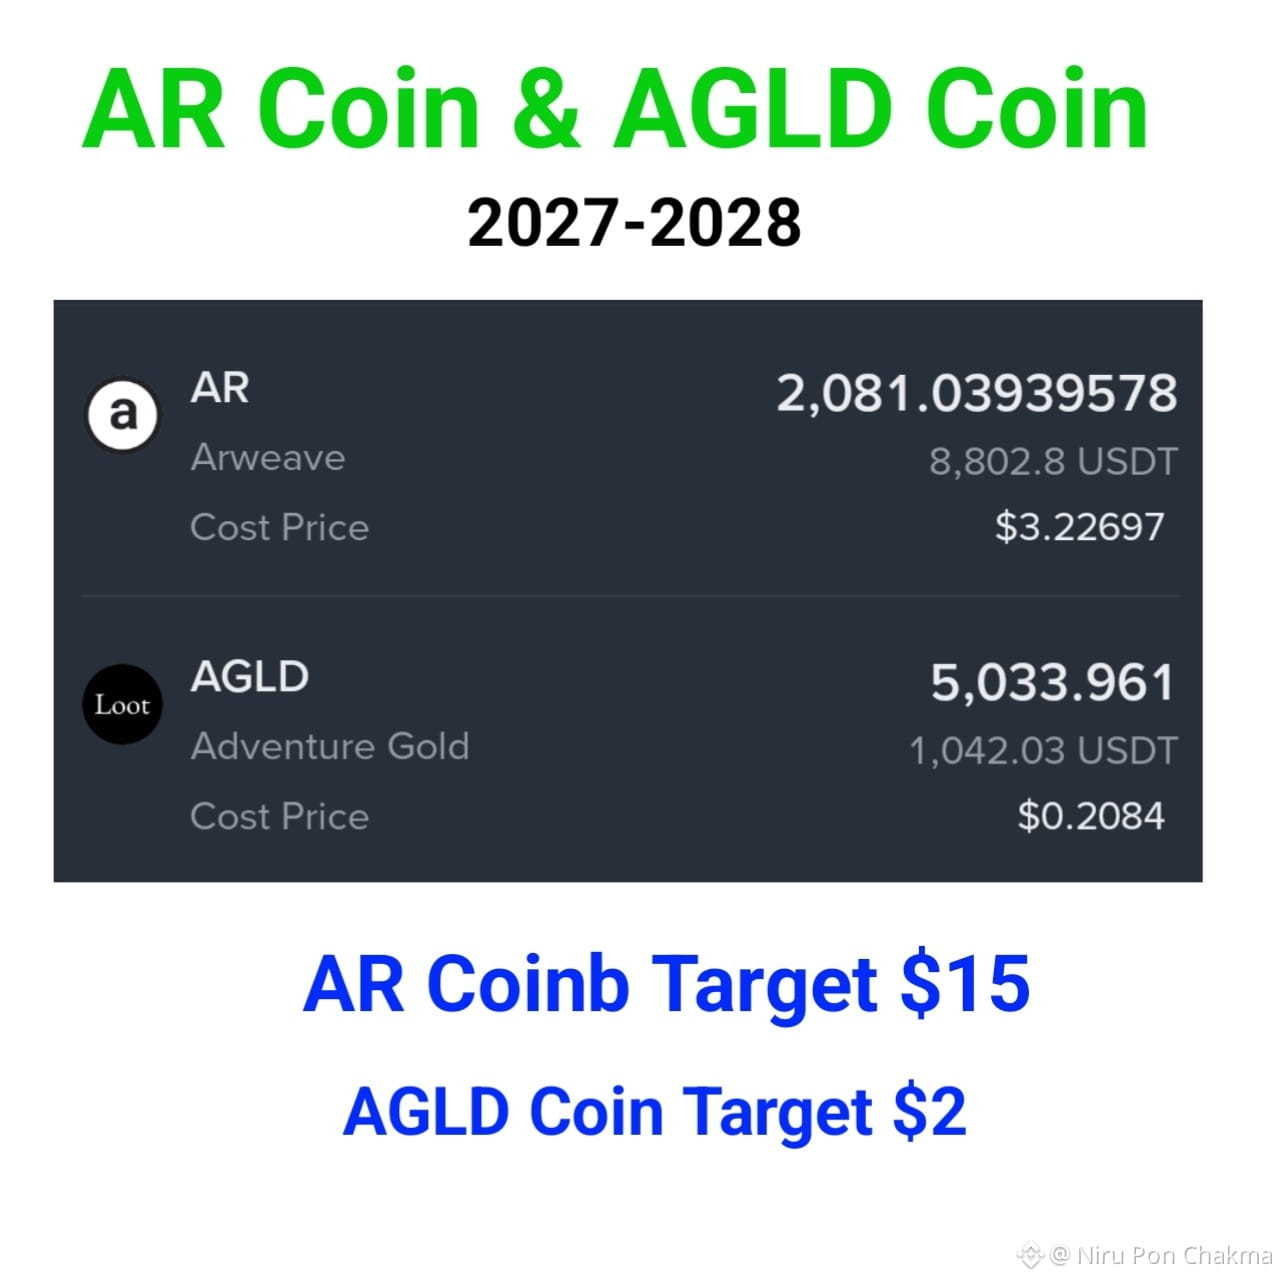
$NEAR just woke up from the exact zone everyone ignored.
For almost 2 years, every move into $1–$2 was treated like another opportunity to sell.
Now look at the reaction.
This is why I love charts like this.
The real opportunity usually looks boring, dead
and completely uninteresting before the expansion starts.
$NEAR already printed $20+ once.
If this pump zone was the macro bottom
I’m watching a return to ATH first
and potentially $25+ after that.
That’s roughly +1,500% from the bottom.
Most people will become bullish at $15.
I’d rather pay attention at $5.
$NEAR just woke up from the exact zone everyone ignored.
For almost 2 years, every move into $1–$2 was treated like another opportunity to sell.
Now look at the reaction.
This is why I love charts like this.
The real opportunity usually looks boring, dead
and completely uninteresting before the expansion starts.
$NEAR already printed $20+ once.
If this pump zone was the macro bottom
I’m watching a return to ATH first
and potentially $25+ after that.
That’s roughly +1,500% from the bottom.
Most people will become bullish at $15.
I’d rather pay attention at $5.
For almost 2 years, every move into $1–$2 was treated like another opportunity to sell.
Now look at the reaction.
This is why I love charts like this.
The real opportunity usually looks boring, dead
and completely uninteresting before the expansion starts.
$NEAR already printed $20+ once.
If this pump zone was the macro bottom
I’m watching a return to ATH first
and potentially $25+ after that.
That’s roughly +1,500% from the bottom.
Most people will become bullish at $15.
I’d rather pay attention at $5.
2
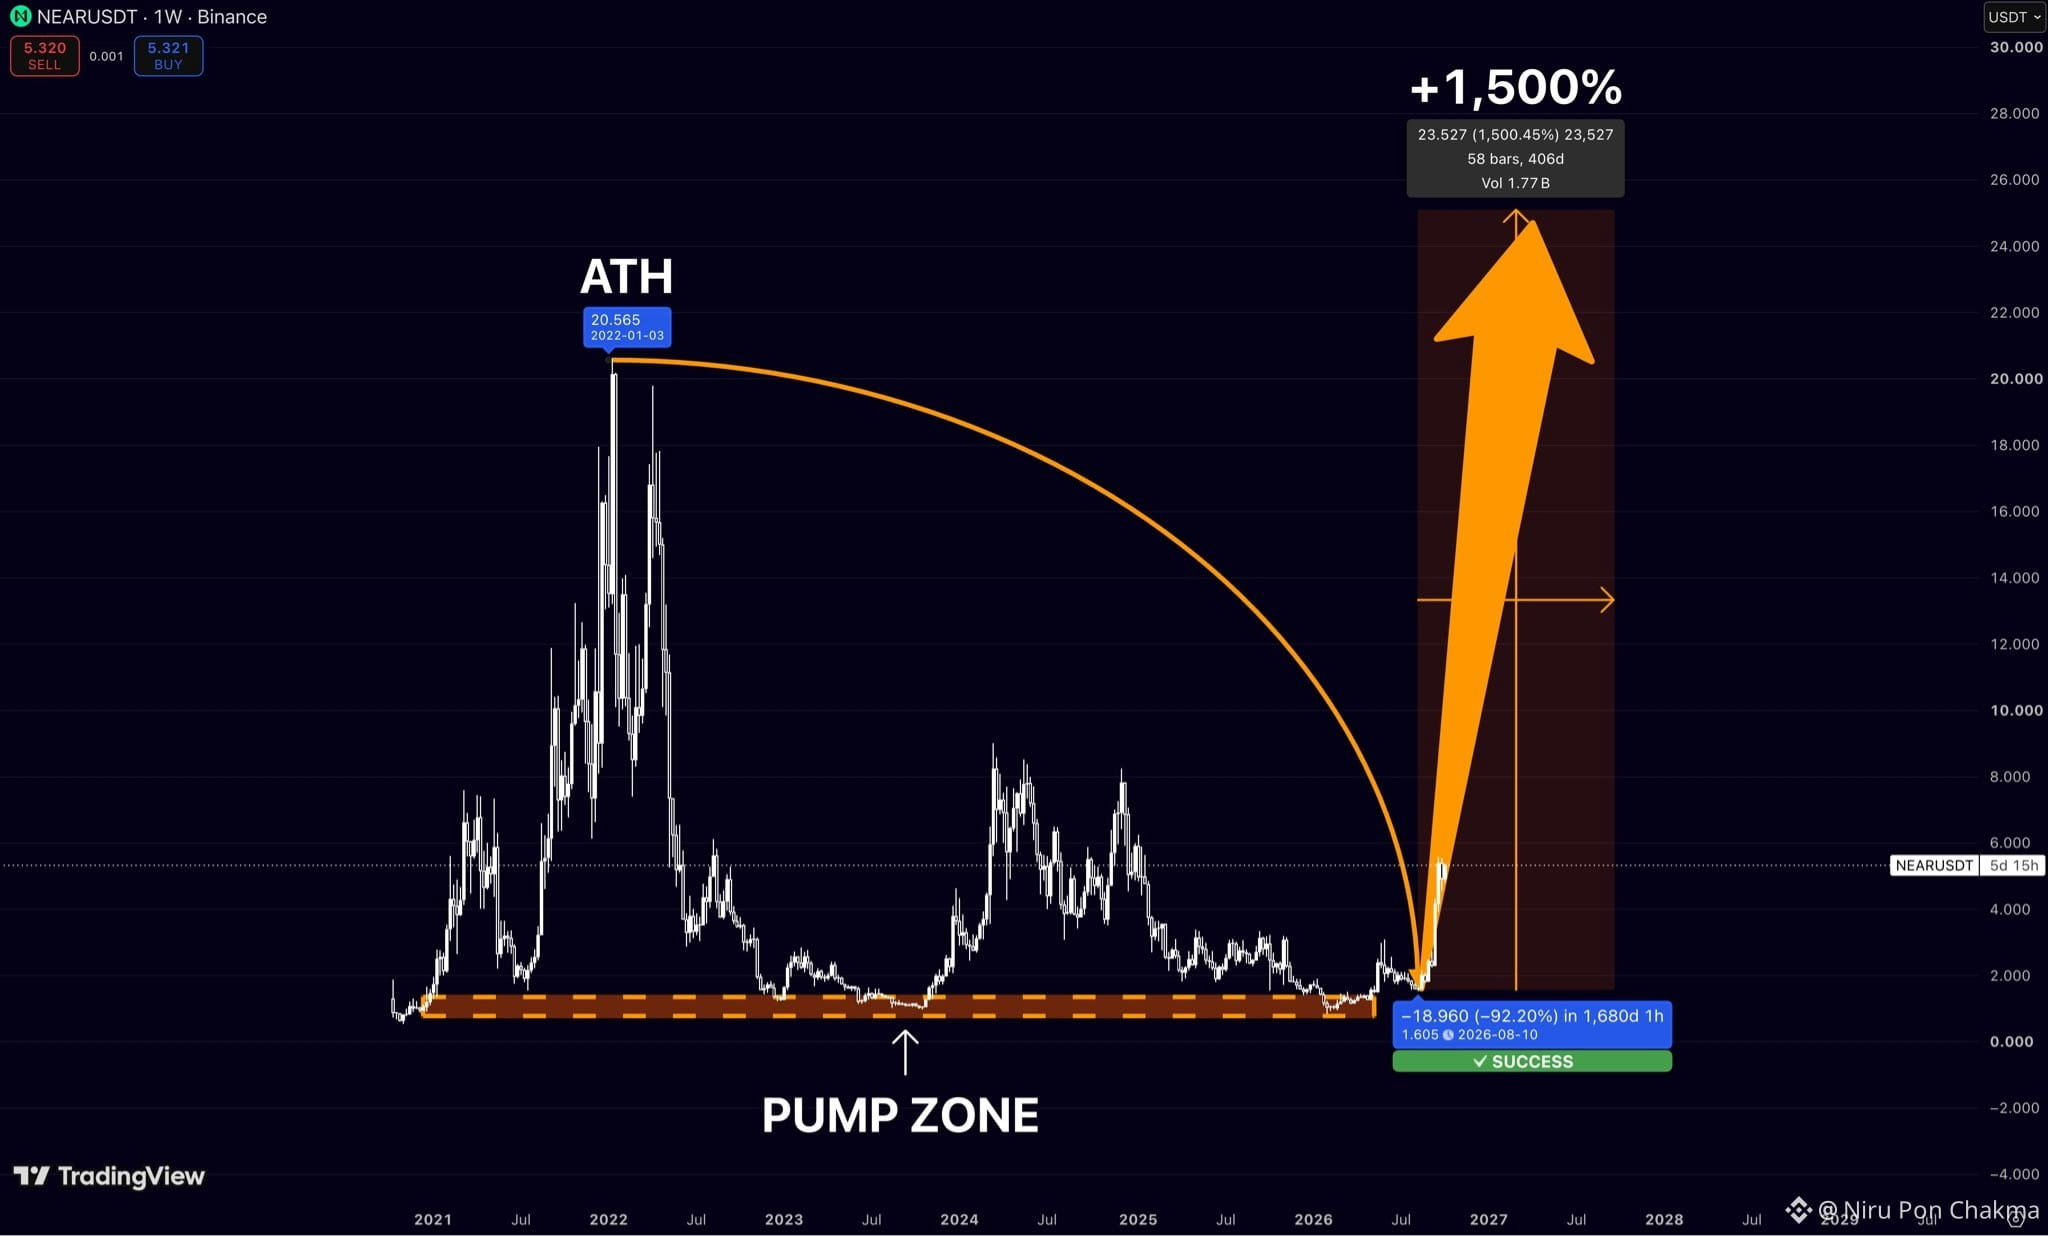
$INJ is waking up again.
This thing is still down more than 90% from its ATH.
Most people see that and think it’s finished.
I see the exact opposite.
$INJ spent almost 3 years bleeding back into the same zone
where the entire previous expansion started.
And now price is finally reacting.
The old ATH sits around $53.
If $INJ gets anywhere close to repeating its previous cycle
we’re talking about roughly +1,400% from the bottom.
Sounds insane when price is at $7.
It won’t sound insane if price is back above $30.
That’s how these moves always feel.
$INJ is waking up again.
This thing is still down more than 90% from its ATH.
Most people see that and think it’s finished.
I see the exact opposite.
$INJ spent almost 3 years bleeding back into the same zone
where the entire previous expansion started.
And now price is finally reacting.
The old ATH sits around $53.
If $INJ gets anywhere close to repeating its previous cycle
we’re talking about roughly +1,400% from the bottom.
Sounds insane when price is at $7.
It won’t sound insane if price is back above $30.
That’s how these moves always feel.
This thing is still down more than 90% from its ATH.
Most people see that and think it’s finished.
I see the exact opposite.
$INJ spent almost 3 years bleeding back into the same zone
where the entire previous expansion started.
And now price is finally reacting.
The old ATH sits around $53.
If $INJ gets anywhere close to repeating its previous cycle
we’re talking about roughly +1,400% from the bottom.
Sounds insane when price is at $7.
It won’t sound insane if price is back above $30.
That’s how these moves always feel.
2
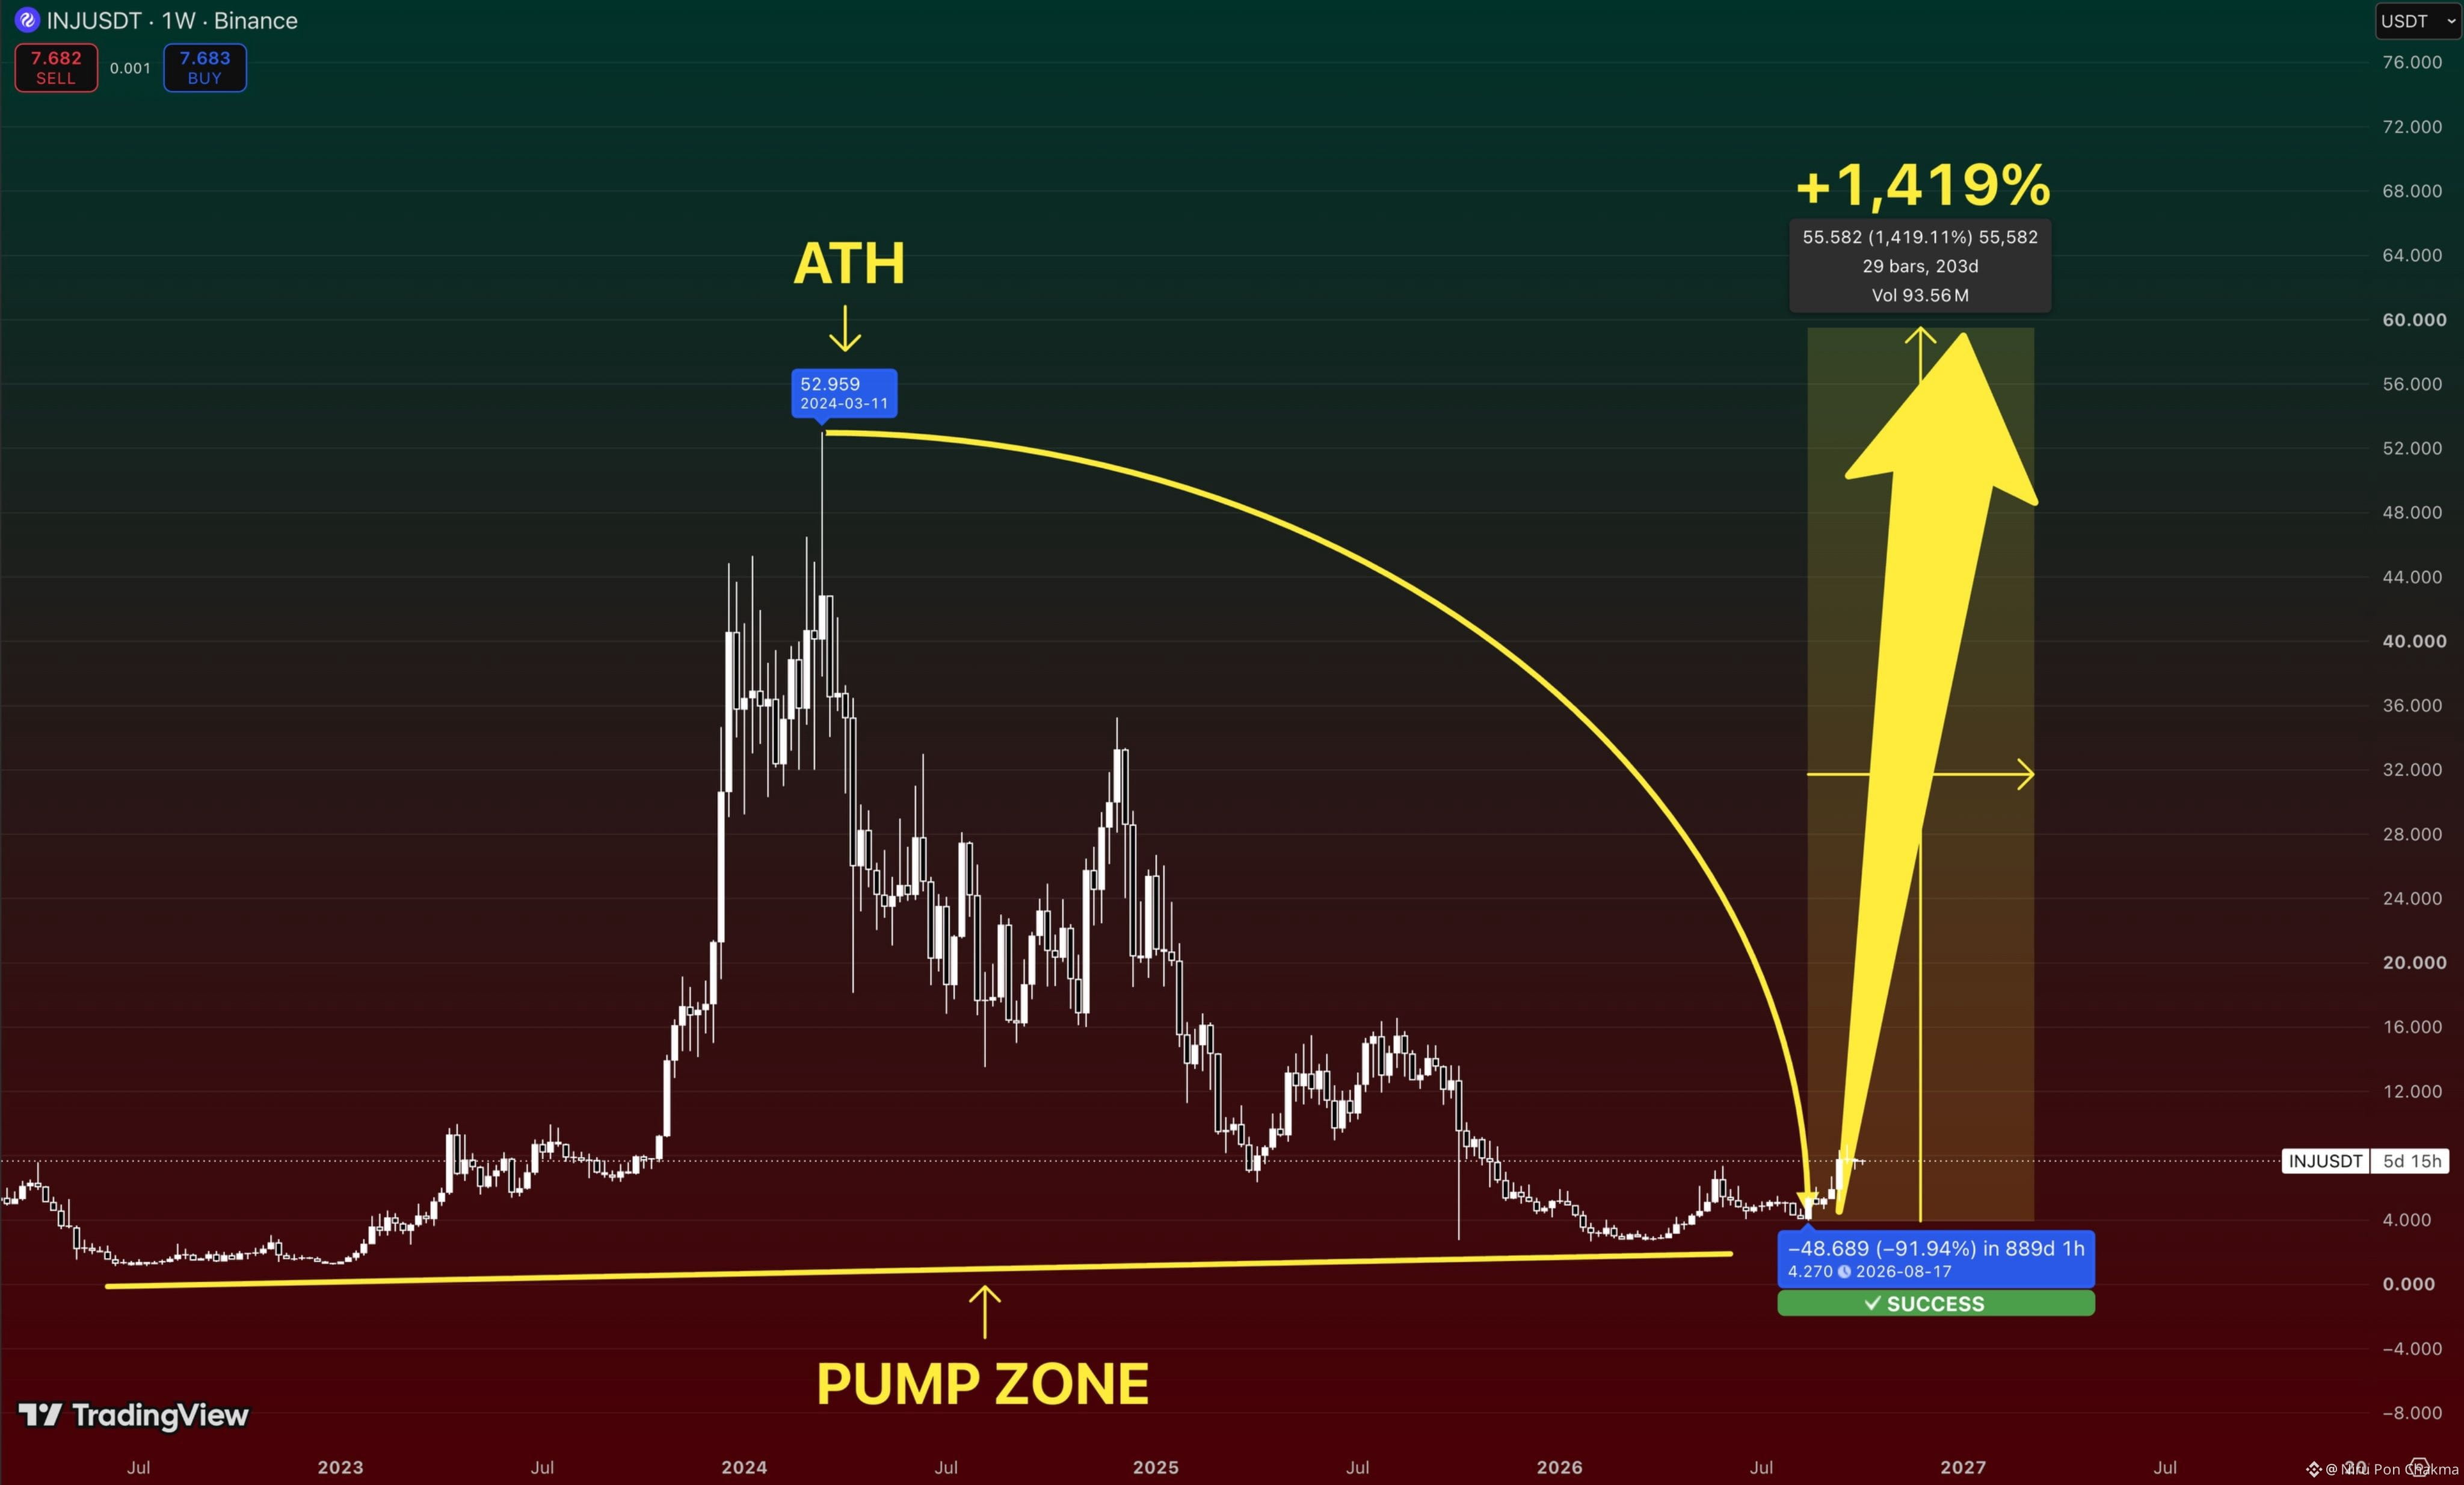
$CYBER — SOMETHING BIG IS BREWING. 👀🔥
After months of pressure, $CYBER is testing a major descending resistance.
The structure is tightening and momentum is starting to build. 🚀
A clean breakout could open the door for a much bigger move.
📈 +100% potential on the chart.
Breakout = opportunity. 🎯
Keep $CYBER on your radar. 👀
$CYBER — SOMETHING BIG IS BREWING. 👀🔥
After months of pressure, $CYBER is testing a major descending resistance.
The structure is tightening and momentum is starting to build. 🚀
A clean breakout could open the door for a much bigger move.
📈 +100% potential on the chart.
Breakout = opportunity. 🎯
Keep $CYBER on your radar. 👀
After months of pressure, $CYBER is testing a major descending resistance.
The structure is tightening and momentum is starting to build. 🚀
A clean breakout could open the door for a much bigger move.
📈 +100% potential on the chart.
Breakout = opportunity. 🎯
Keep $CYBER on your radar. 👀
11
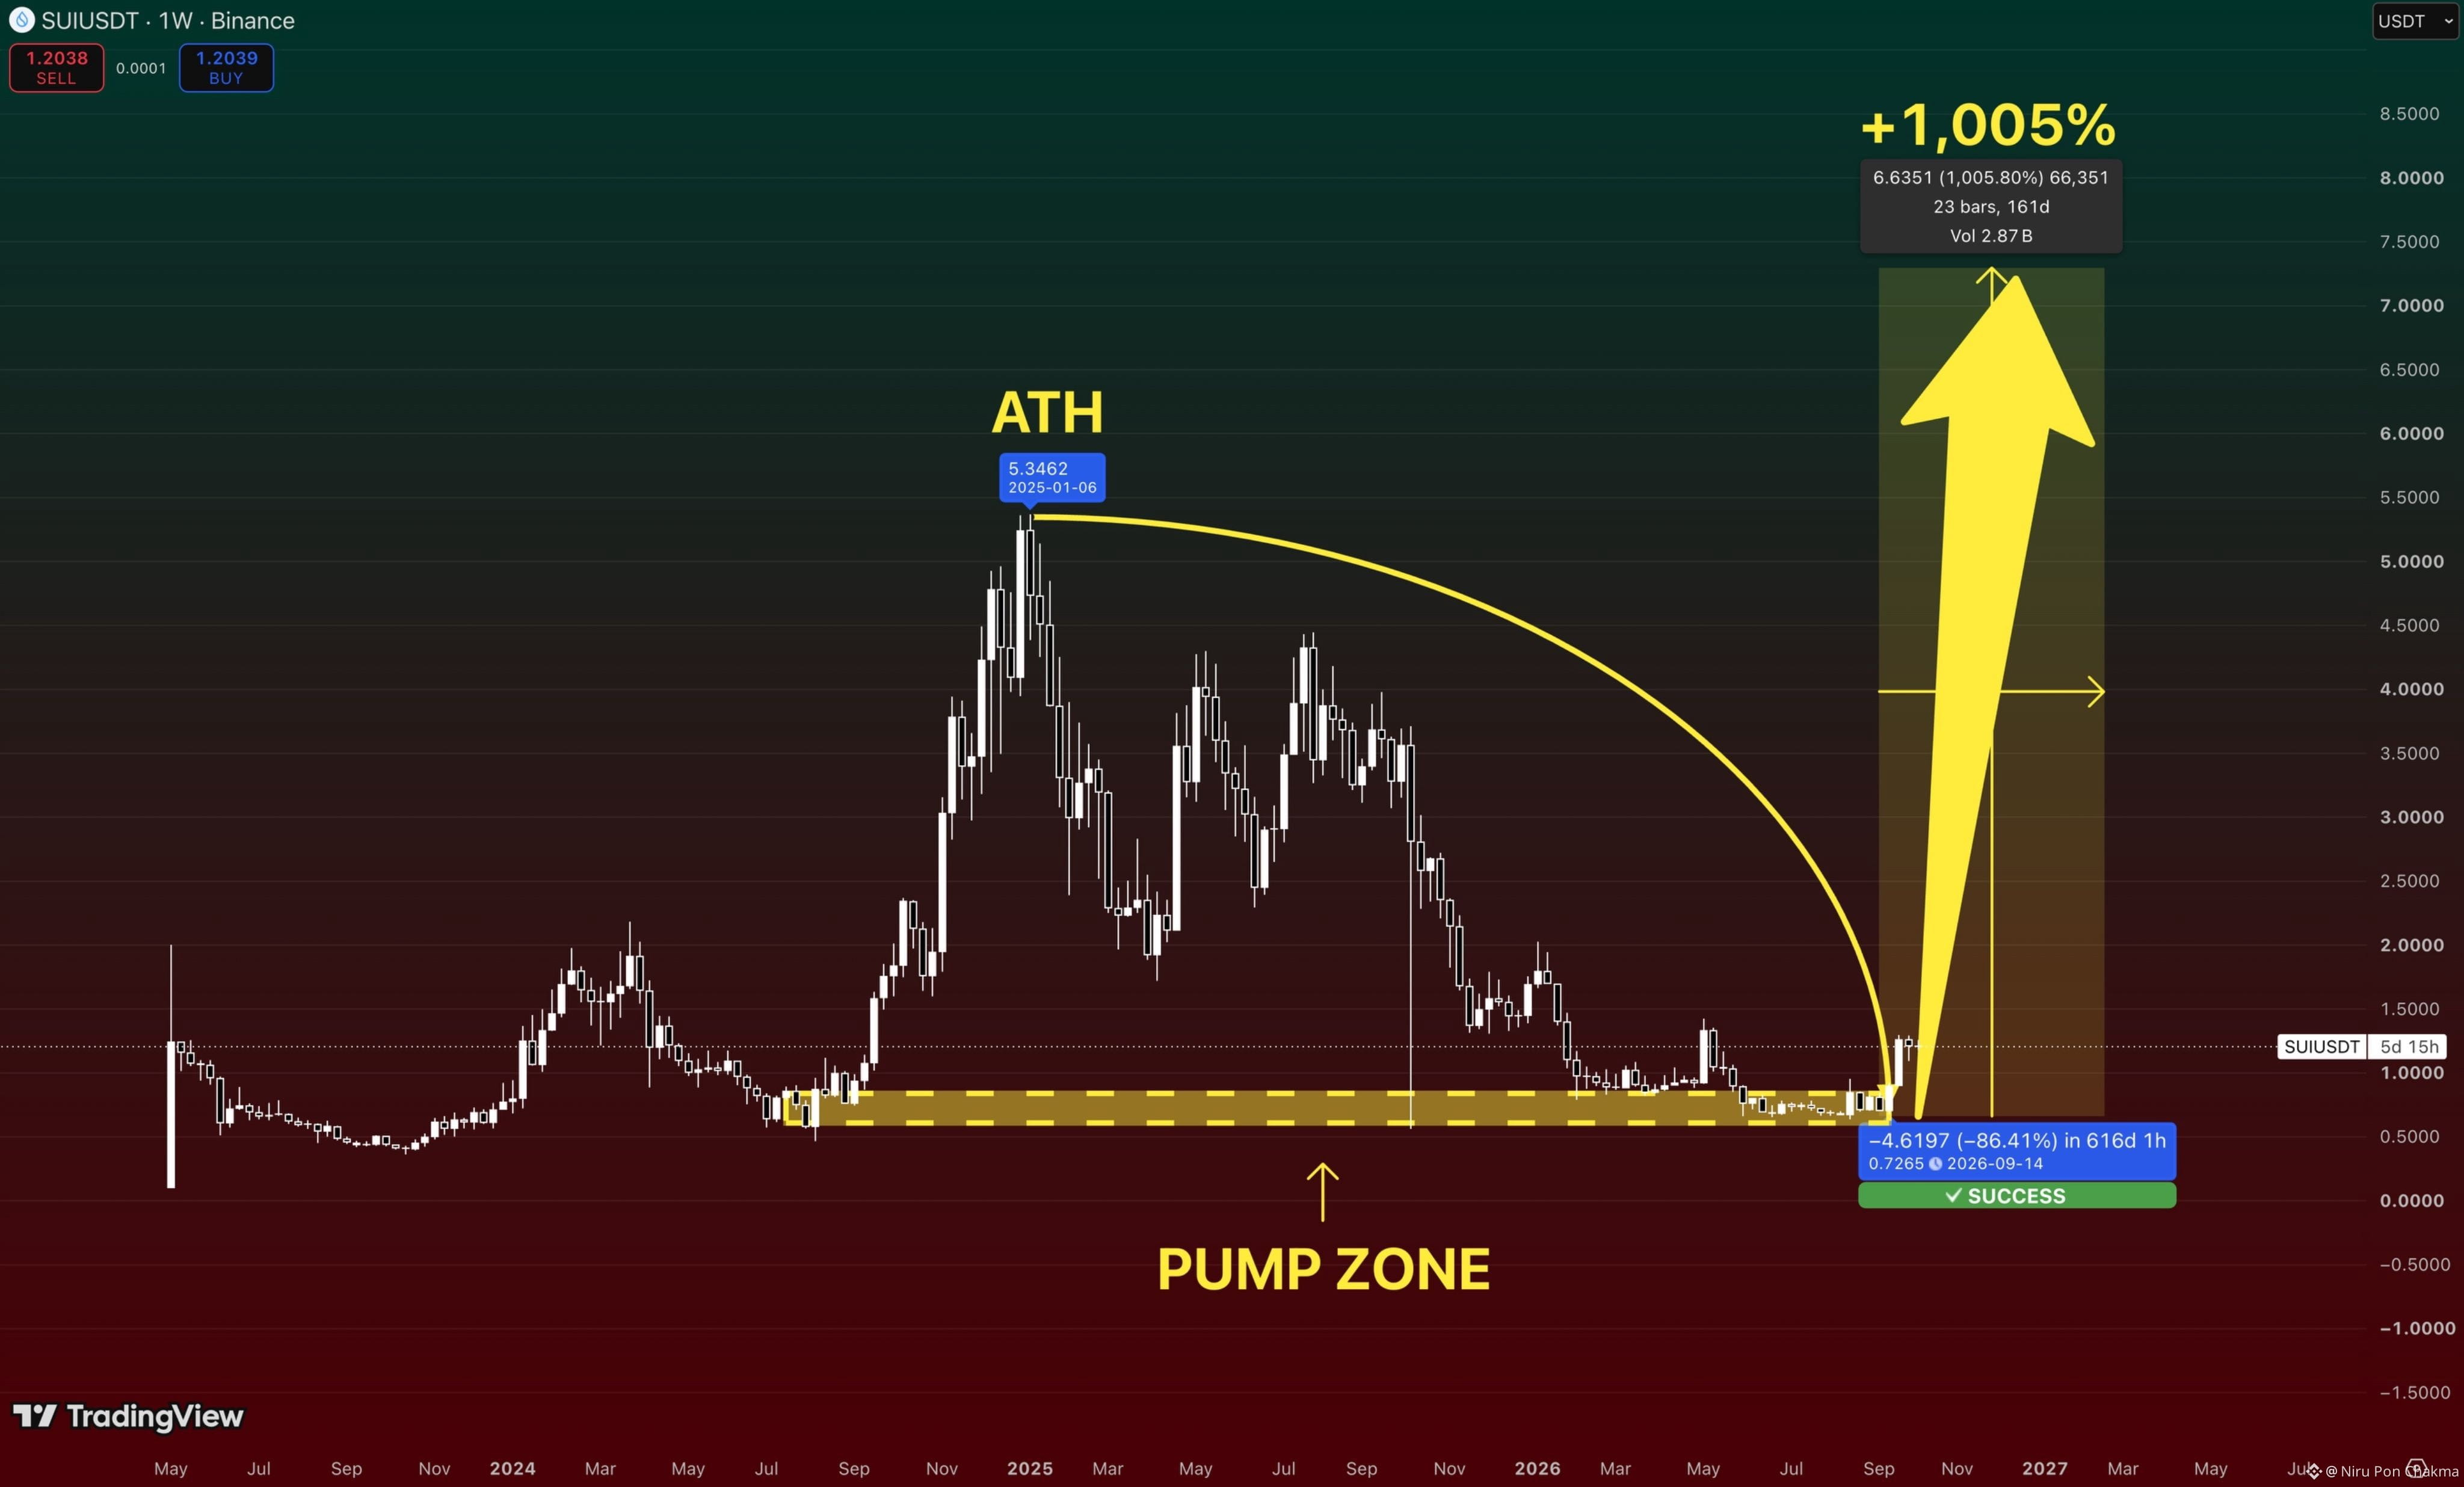
$SUI is waking up again.
This thing lost 86% from the top.
And after months of doing absolutely nothing
it’s finally pushing out of the same zone that has been holding since 2024.
That’s the part I care about.
Because when a coin spends this long getting murdered near the lows
the first real expansion usually happens when almost nobody wants to touch it anymore.
ATH sits around $5.35.
But I don’t think ATH is necessarily the endgame here.
If $SUI gets a proper altcoin cycle, I’m watching $7–8.
That’s roughly +1,000% from the bottom.
Sounds ridiculous now.
That’s usually how these charts look before they stop being ridiculous.
$SUI is waking up again.
This thing lost 86% from the top.
And after months of doing absolutely nothing
it’s finally pushing out of the same zone that has been holding since 2024.
That’s the part I care about.
Because when a coin spends this long getting murdered near the lows
the first real expansion usually happens when almost nobody wants to touch it anymore.
ATH sits around $5.35.
But I don’t think ATH is necessarily the endgame here.
If $SUI gets a proper altcoin cycle, I’m watching $7–8.
That’s roughly +1,000% from the bottom.
Sounds ridiculous now.
That’s usually how these charts look before they stop being ridiculous.
This thing lost 86% from the top.
And after months of doing absolutely nothing
it’s finally pushing out of the same zone that has been holding since 2024.
That’s the part I care about.
Because when a coin spends this long getting murdered near the lows
the first real expansion usually happens when almost nobody wants to touch it anymore.
ATH sits around $5.35.
But I don’t think ATH is necessarily the endgame here.
If $SUI gets a proper altcoin cycle, I’m watching $7–8.
That’s roughly +1,000% from the bottom.
Sounds ridiculous now.
That’s usually how these charts look before they stop being ridiculous.
23
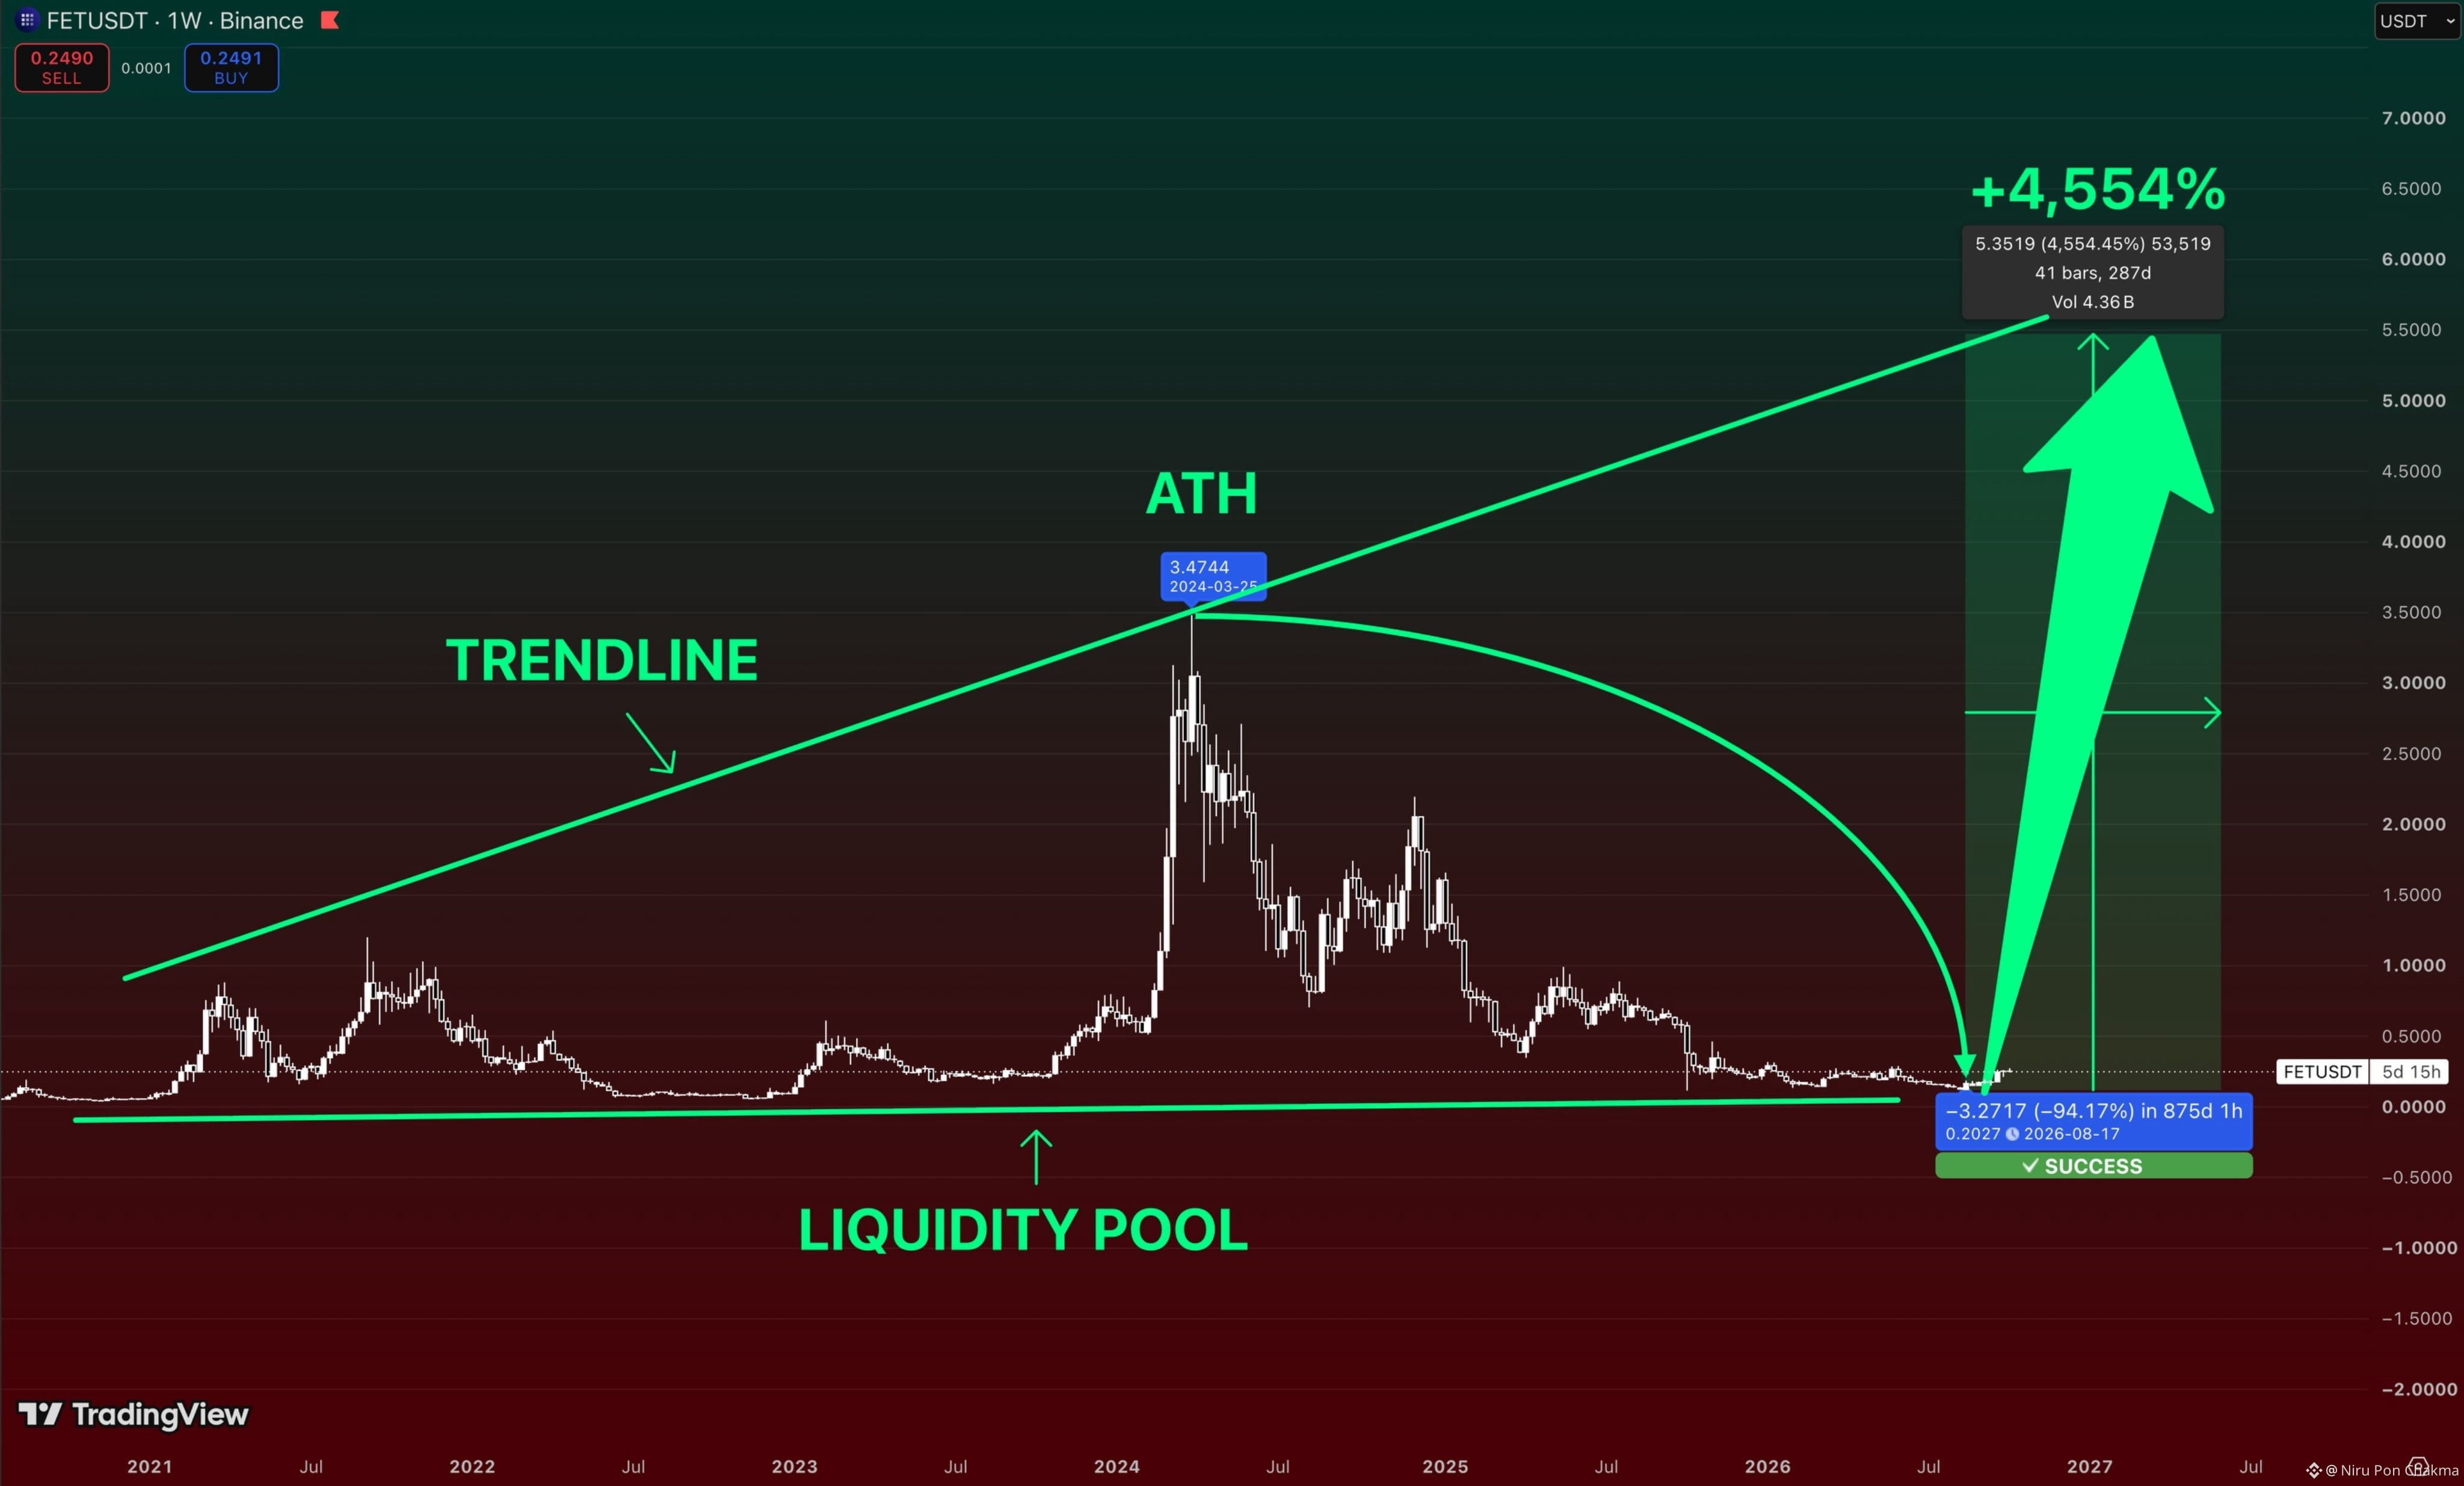
$FET has been absolutely destroyed.
From $3.47 to $0.20.
That’s a 94% wipeout.
And weirdly enough, this is exactly where I start paying attention.
Look at the bigger picture.
Every major #Fet expansion started from this same liquidity area.
Price comes back, everyone loses interest, the chart looks completely dead…
Then the violence starts.
First I’m watching the old ATH around $3.47.
But if $FET actually enters another full expansion cycle
my bigger target is around $5.5.
From the bottom?
That’s roughly +4,500%.
AI hype made $FET one of the hottest coins on the market once.
I wouldn’t bet on the market forgetting it forever.
$FET has been absolutely destroyed.
From $3.47 to $0.20.
That’s a 94% wipeout.
And weirdly enough, this is exactly where I start paying attention.
Look at the bigger picture.
Every major #Fet expansion started from this same liquidity area.
Price comes back, everyone loses interest, the chart looks completely dead…
Then the violence starts.
First I’m watching the old ATH around $3.47.
But if $FET actually enters another full expansion cycle
my bigger target is around $5.5.
From the bottom?
That’s roughly +4,500%.
AI hype made $FET one of the hottest coins on the market once.
I wouldn’t bet on the market forgetting it forever.
From $3.47 to $0.20.
That’s a 94% wipeout.
And weirdly enough, this is exactly where I start paying attention.
Look at the bigger picture.
Every major #Fet expansion started from this same liquidity area.
Price comes back, everyone loses interest, the chart looks completely dead…
Then the violence starts.
First I’m watching the old ATH around $3.47.
But if $FET actually enters another full expansion cycle
my bigger target is around $5.5.
From the bottom?
That’s roughly +4,500%.
AI hype made $FET one of the hottest coins on the market once.
I wouldn’t bet on the market forgetting it forever.
41
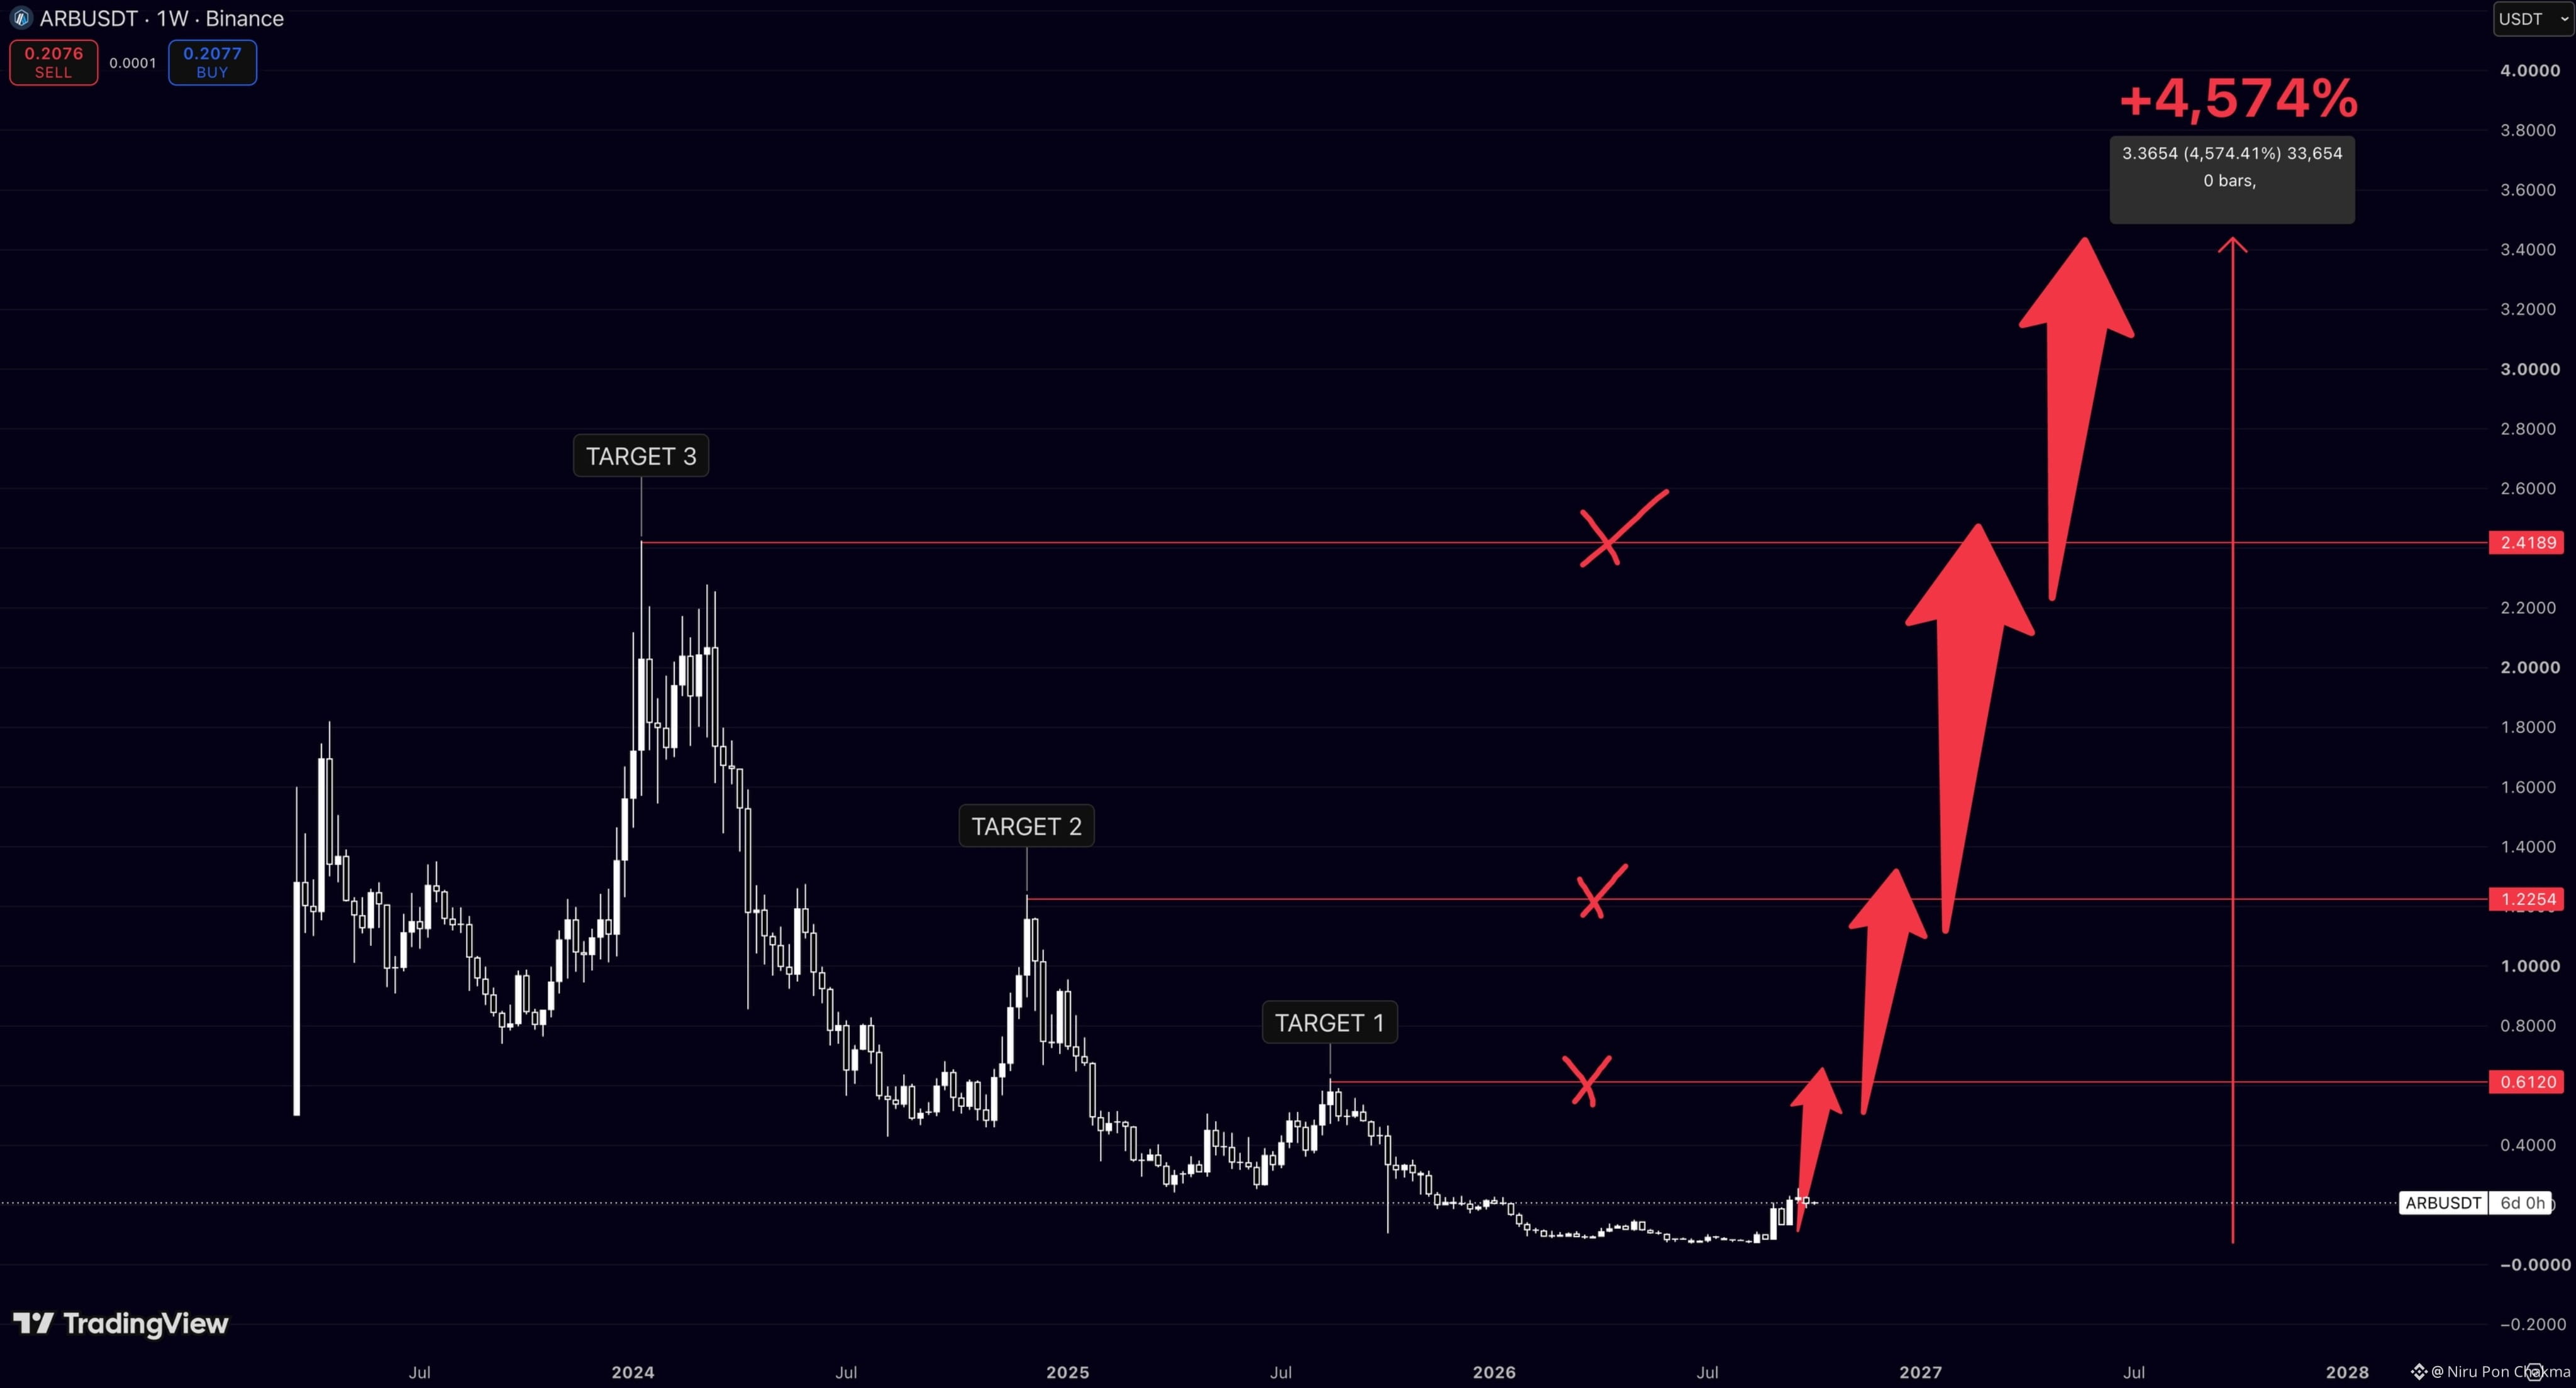
$ARB is trading like nobody wants it anymore.
That’s exactly why I’m interested.
After years of bleeding, price is finally trying to wake up from the lows.
The levels I’m watching:
$0.61 → $1.22 → $2.42
And if this turns into a real altseason move
my full scenario extends toward $3.50+.
That’s roughly +4,574% from the bottom.
Everyone wants alts after they pump.
I want them while the chart still looks disgusting.
$ARB is trading like nobody wants it anymore.
That’s exactly why I’m interested.
After years of bleeding, price is finally trying to wake up from the lows.
The levels I’m watching:
$0.61 → $1.22 → $2.42
And if this turns into a real altseason move
my full scenario extends toward $3.50+.
That’s roughly +4,574% from the bottom.
Everyone wants alts after they pump.
I want them while the chart still looks disgusting.
That’s exactly why I’m interested.
After years of bleeding, price is finally trying to wake up from the lows.
The levels I’m watching:
$0.61 → $1.22 → $2.42
And if this turns into a real altseason move
my full scenario extends toward $3.50+.
That’s roughly +4,574% from the bottom.
Everyone wants alts after they pump.
I want them while the chart still looks disgusting.
61
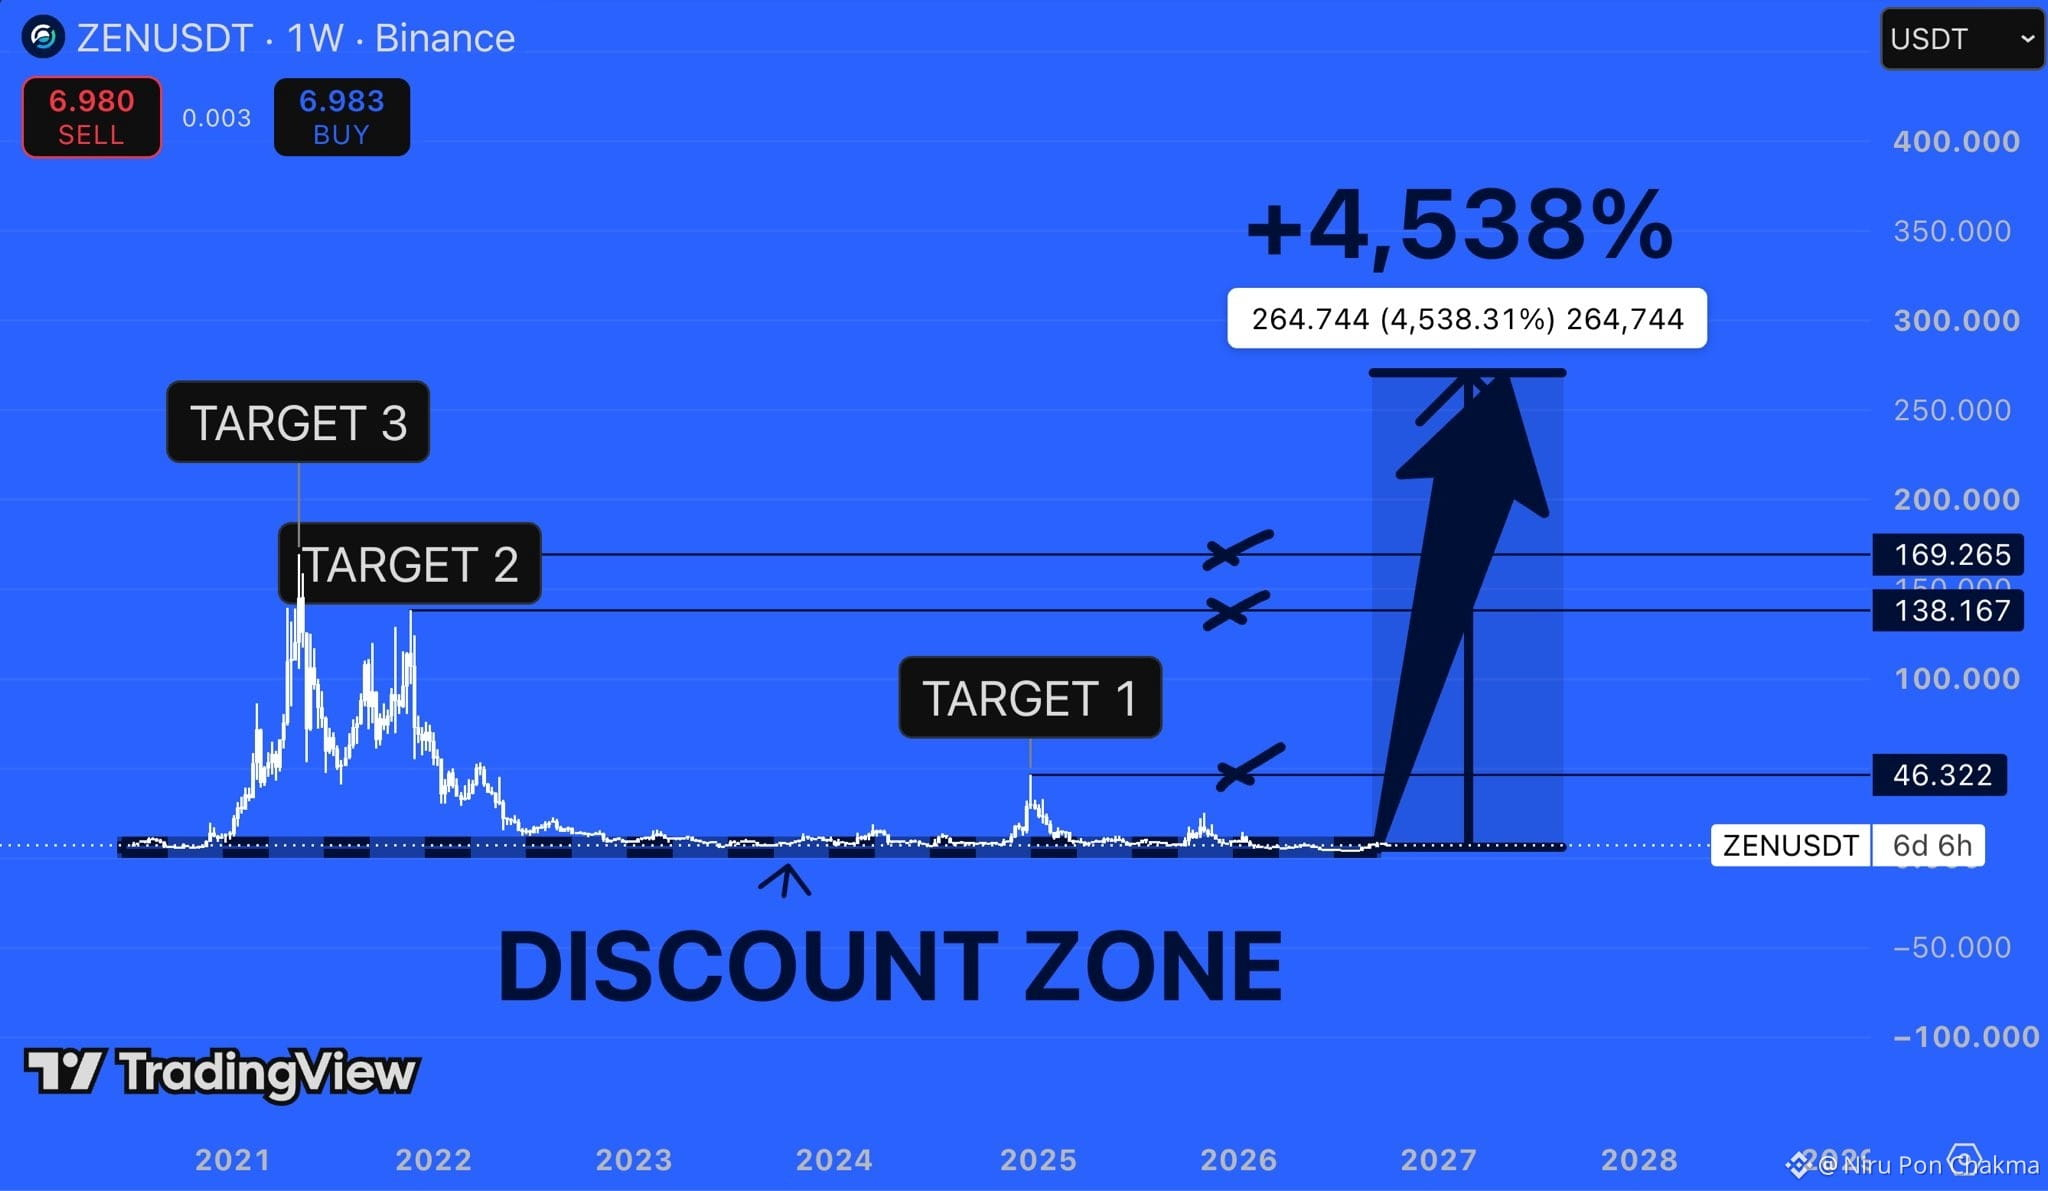
$ZEN has basically been forgotten by the market.
And that’s exactly why I’m watching it.
It spent years bleeding back into the same discount zone
while everyone moved on to newer narratives.
Now look at what sits above:
$46 → $138 → $169
And from current levels, a full expansion would mean roughly +4,500%.
Sounds completely delusional.
But the best asymmetric trades always look stupid before the crowd starts chasing them.
I’d rather watch $ZEN at $7 than suddenly discover it again at $50.
$ZEN has basically been forgotten by the market.
And that’s exactly why I’m watching it.
It spent years bleeding back into the same discount zone
while everyone moved on to newer narratives.
Now look at what sits above:
$46 → $138 → $169
And from current levels, a full expansion would mean roughly +4,500%.
Sounds completely delusional.
But the best asymmetric trades always look stupid before the crowd starts chasing them.
I’d rather watch $ZEN at $7 than suddenly discover it again at $50.
And that’s exactly why I’m watching it.
It spent years bleeding back into the same discount zone
while everyone moved on to newer narratives.
Now look at what sits above:
$46 → $138 → $169
And from current levels, a full expansion would mean roughly +4,500%.
Sounds completely delusional.
But the best asymmetric trades always look stupid before the crowd starts chasing them.
I’d rather watch $ZEN at $7 than suddenly discover it again at $50.
59
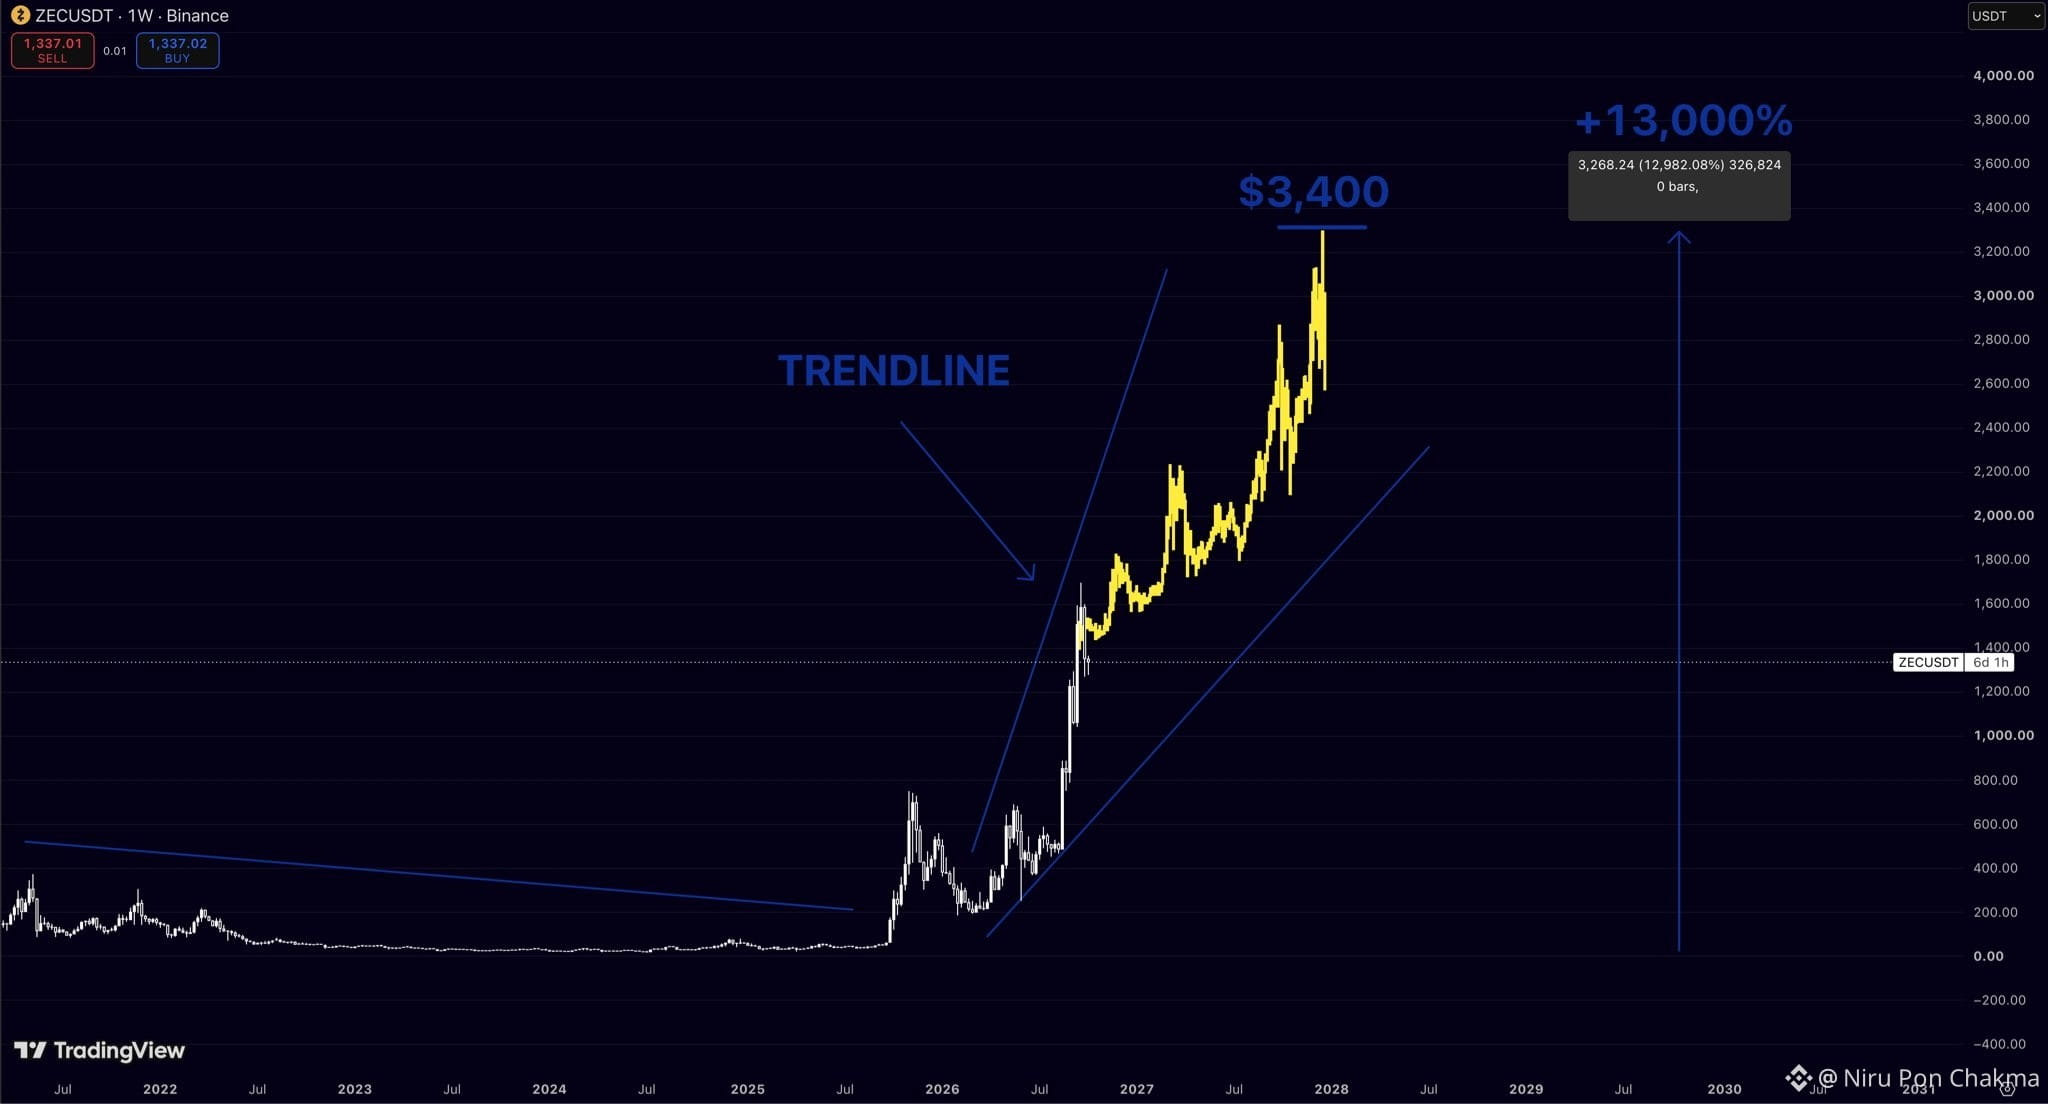
$ZEC is doing what most people said was impossible.
From basically forgotten… to $1,300+.
And the crazy part?
The structure still looks clean.
$ZEC broke the long-term trendline
and has been respecting this rising structure ever since.
I’m watching $3,400 as the next major target.
From the bottom, that entire move would be roughly +13,000%.
Crypto is funny.
Everyone wants a 100x.
Almost nobody has the patience to hold the chart that can actually do it.
$ZEC is doing what most people said was impossible.
From basically forgotten… to $1,300+.
And the crazy part?
The structure still looks clean.
$ZEC broke the long-term trendline
and has been respecting this rising structure ever since.
I’m watching $3,400 as the next major target.
From the bottom, that entire move would be roughly +13,000%.
Crypto is funny.
Everyone wants a 100x.
Almost nobody has the patience to hold the chart that can actually do it.
From basically forgotten… to $1,300+.
And the crazy part?
The structure still looks clean.
$ZEC broke the long-term trendline
and has been respecting this rising structure ever since.
I’m watching $3,400 as the next major target.
From the bottom, that entire move would be roughly +13,000%.
Crypto is funny.
Everyone wants a 100x.
Almost nobody has the patience to hold the chart that can actually do it.
155
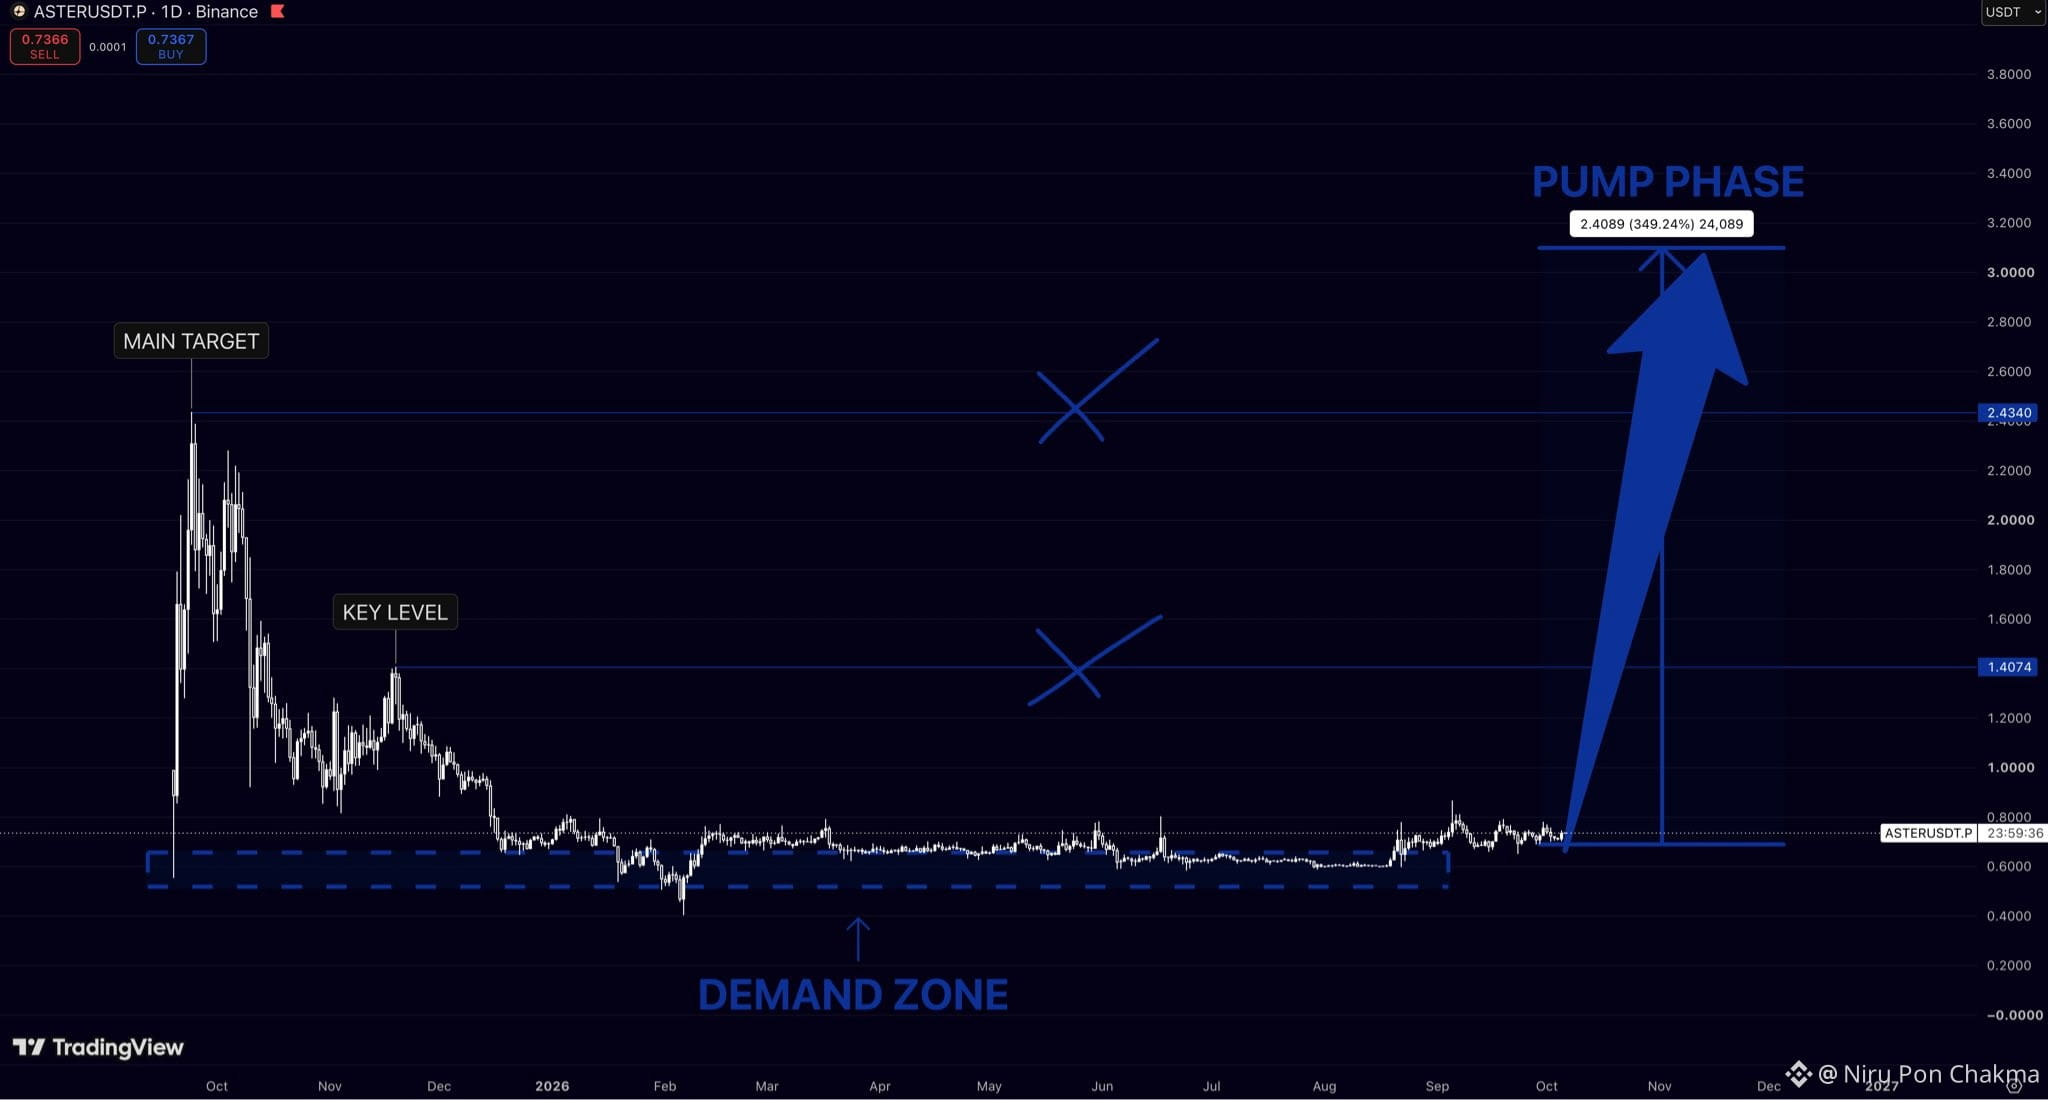
$ASTER has been sitting in the same demand zone for months.
And people are already bored of it.
That’s usually when I start paying attention.
As long as this zone holds, my first key level is $1.40.
Above that, the main target sits around $2.43.
If momentum really kicks in
a full pump phase toward $3+ would mean roughly +350% from here.
The chart looks dead.
Until suddenly it doesn’t.
$ASTER has been sitting in the same demand zone for months.
And people are already bored of it.
That’s usually when I start paying attention.
As long as this zone holds, my first key level is $1.40.
Above that, the main target sits around $2.43.
If momentum really kicks in
a full pump phase toward $3+ would mean roughly +350% from here.
The chart looks dead.
Until suddenly it doesn’t.
And people are already bored of it.
That’s usually when I start paying attention.
As long as this zone holds, my first key level is $1.40.
Above that, the main target sits around $2.43.
If momentum really kicks in
a full pump phase toward $3+ would mean roughly +350% from here.
The chart looks dead.
Until suddenly it doesn’t.
82
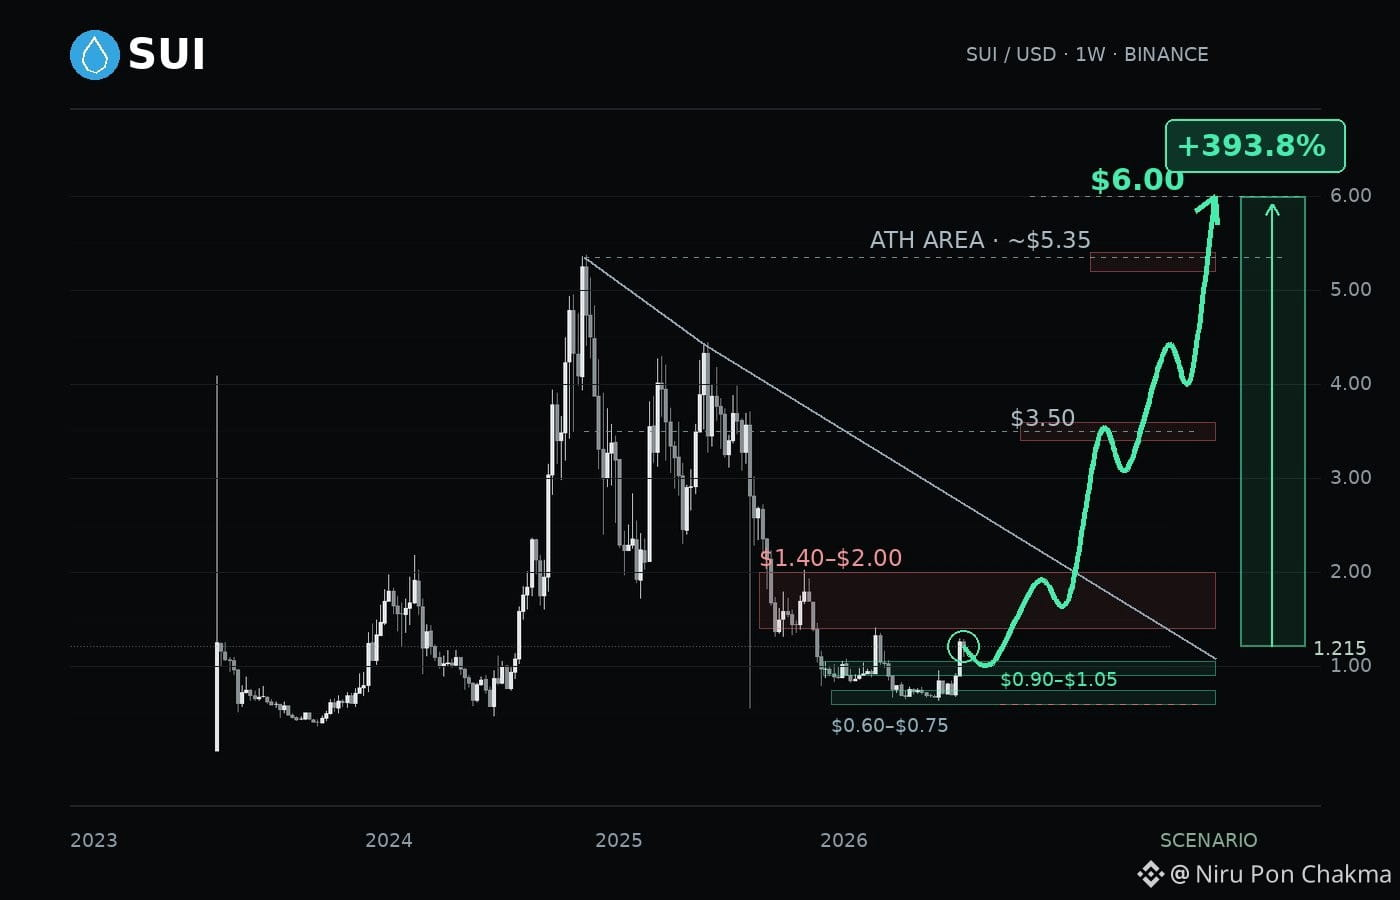
🌊 $SUI A $6 COMEBACK STARTS WITH THIS RECLAIM
$SUI is bouncing from its summer base, but the weekly recovery still needs confirmation.
Holding $0.90–$1.05 and reclaiming $1.40–$2.00 would strengthen my bullish scenario.
Then I’m watching $3.50, the historical high near $5.35, and potentially $6.00. That final target sits roughly 394% above the chart’s $1.215 price.
The green path allows for pullbacks and retests. A weekly close below $0.60 invalidates the broader recovery setup.
🌊 $SUI A $6 COMEBACK STARTS WITH THIS RECLAIM
$SUI is bouncing from its summer base, but the weekly recovery still needs confirmation.
Holding $0.90–$1.05 and reclaiming $1.40–$2.00 would strengthen my bullish scenario.
Then I’m watching $3.50, the historical high near $5.35, and potentially $6.00. That final target sits roughly 394% above the chart’s $1.215 price.
The green path allows for pullbacks and retests. A weekly close below $0.60 invalidates the broader recovery setup.
$SUI is bouncing from its summer base, but the weekly recovery still needs confirmation.
Holding $0.90–$1.05 and reclaiming $1.40–$2.00 would strengthen my bullish scenario.
Then I’m watching $3.50, the historical high near $5.35, and potentially $6.00. That final target sits roughly 394% above the chart’s $1.215 price.
The green path allows for pullbacks and retests. A weekly close below $0.60 invalidates the broader recovery setup.
6
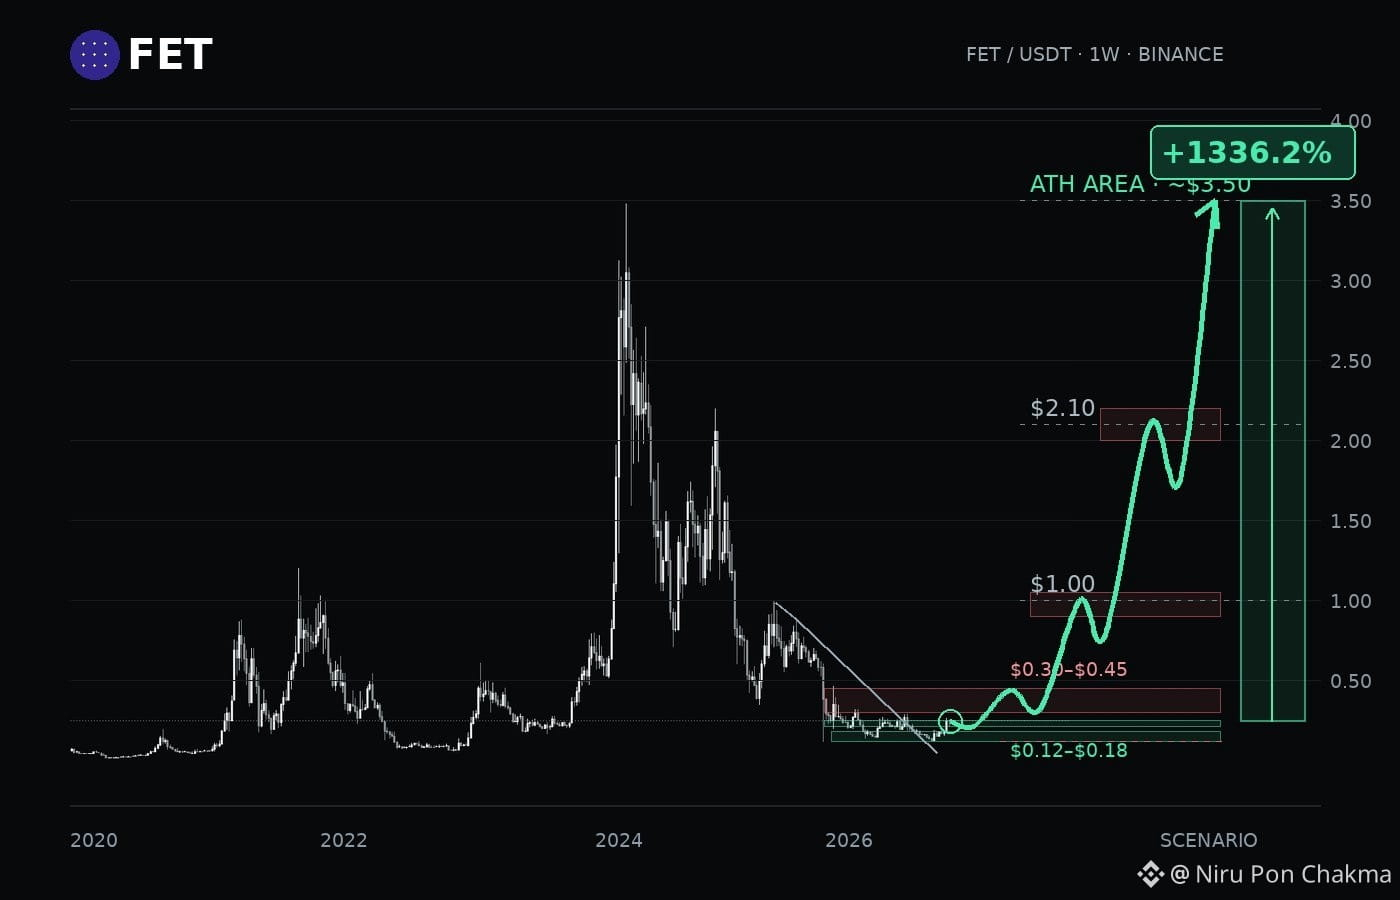
🧠 $FET THE DISTANCE BACK TO THE TOP IS ENORMOUS
$FET is attempting to recover from its weekly base. The first real test is reclaiming $0.30–$0.45 and holding it through a retest.
In a sustained bullish reversal, I’m watching $1.00, $2.10, then the historical high near $3.50.
That final level sits roughly 1,336% above the chart’s $0.2437 price. It requires a full trend recovery, not just a bounce.
A weekly close below $0.12 invalidates this recovery scenario.
🧠 $FET THE DISTANCE BACK TO THE TOP IS ENORMOUS
$FET is attempting to recover from its weekly base. The first real test is reclaiming $0.30–$0.45 and holding it through a retest.
In a sustained bullish reversal, I’m watching $1.00, $2.10, then the historical high near $3.50.
That final level sits roughly 1,336% above the chart’s $0.2437 price. It requires a full trend recovery, not just a bounce.
A weekly close below $0.12 invalidates this recovery scenario.
$FET is attempting to recover from its weekly base. The first real test is reclaiming $0.30–$0.45 and holding it through a retest.
In a sustained bullish reversal, I’m watching $1.00, $2.10, then the historical high near $3.50.
That final level sits roughly 1,336% above the chart’s $0.2437 price. It requires a full trend recovery, not just a bounce.
A weekly close below $0.12 invalidates this recovery scenario.
12
32
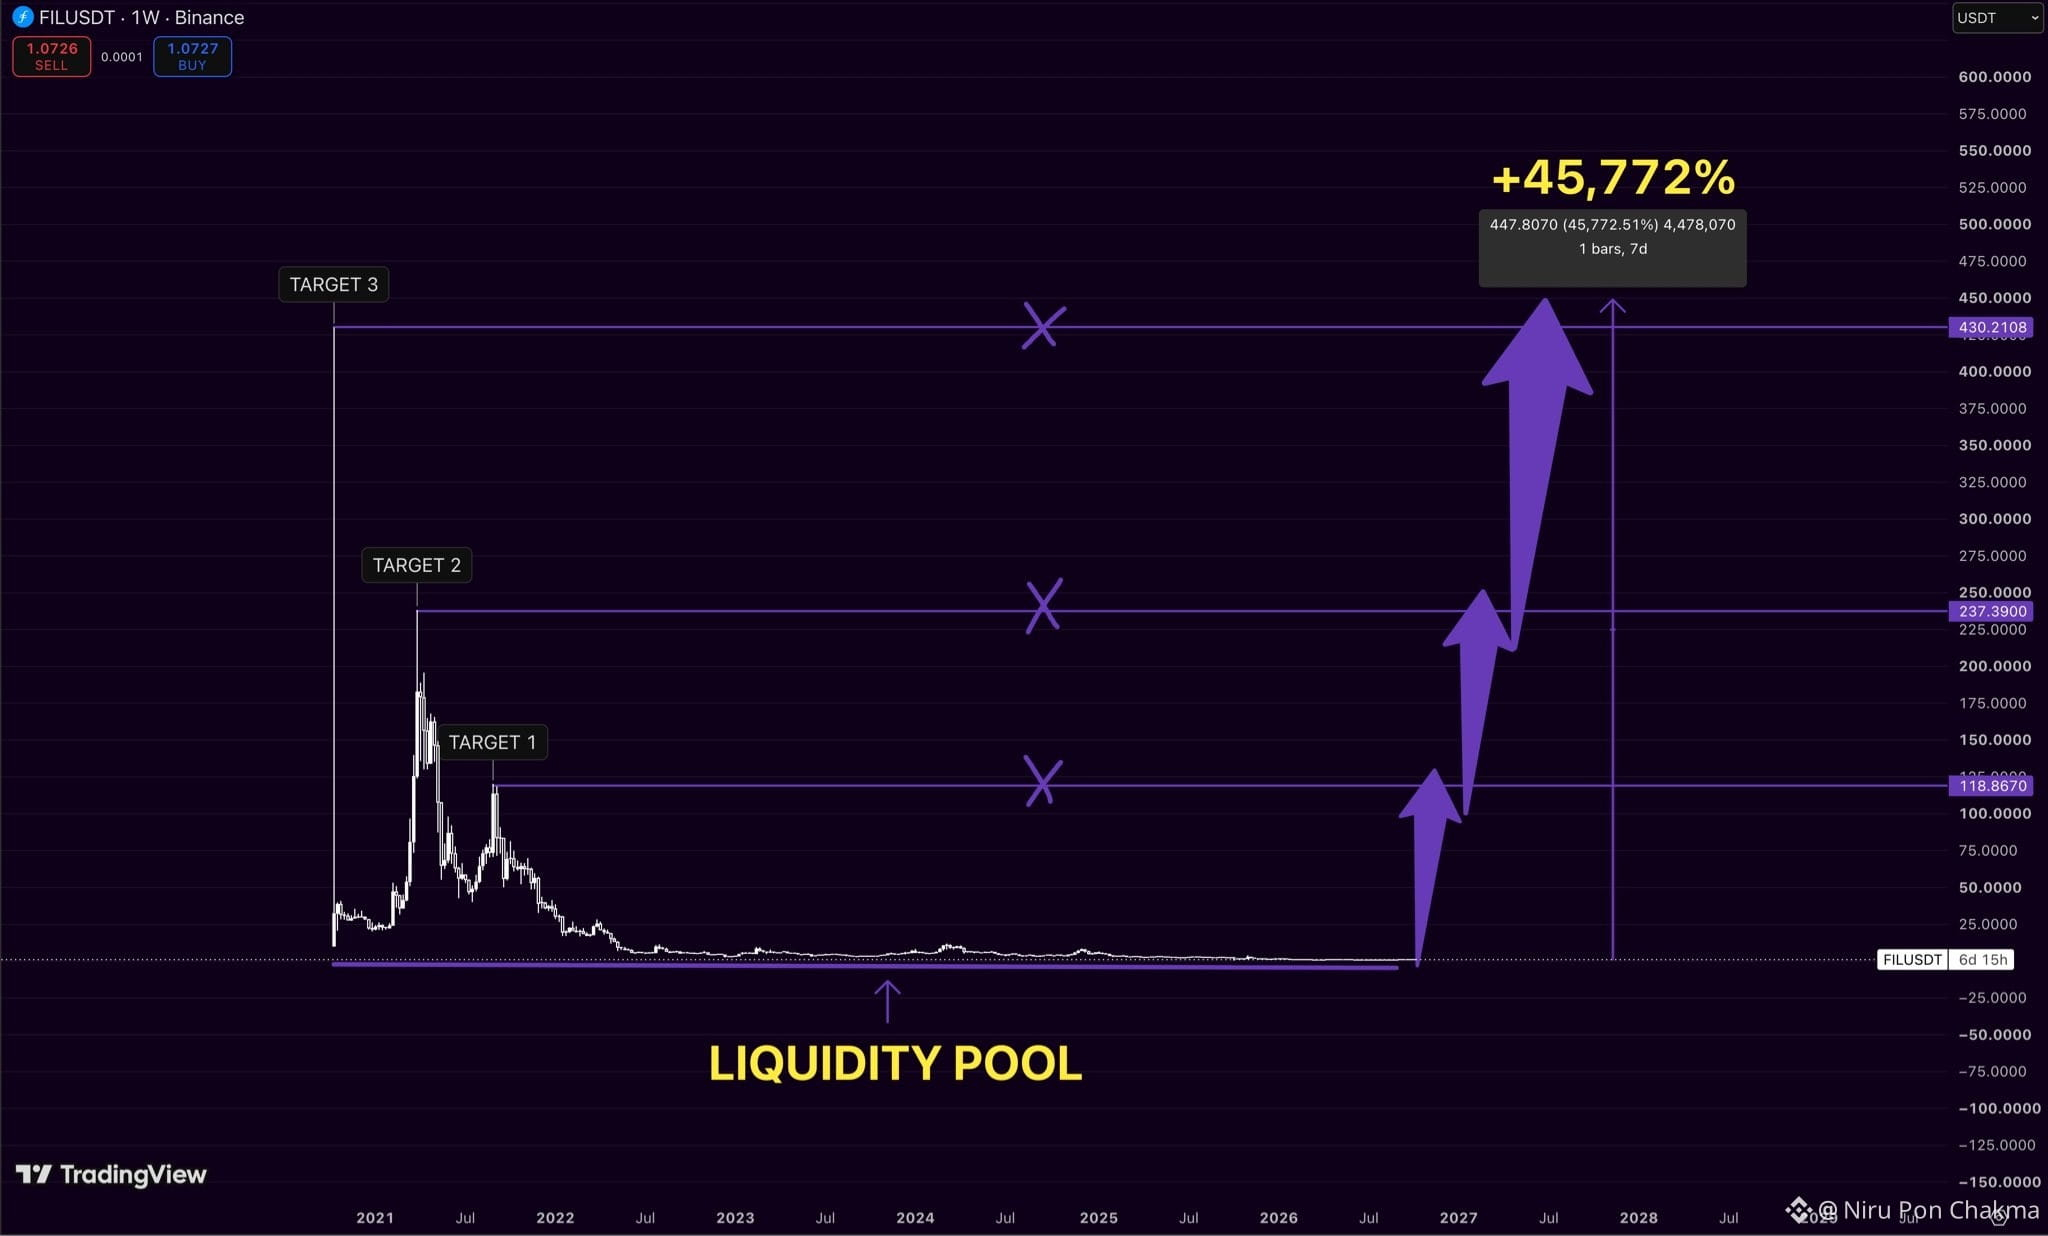
$FIL is basically being priced for death right now.
That’s exactly why I’m watching it.
After years of bleeding, price is sitting on the same massive liquidity floor
while the upside levels are still untouched.
My targets:
$118 → $237 → $430
That last target would mean roughly +45,000% from the lows.
Ridiculous number. Ridiculous chart.
But crypto has taught me one thing
dead alts can become very alive, very fast.
$FIL is basically being priced for death right now.
That’s exactly why I’m watching it.
After years of bleeding, price is sitting on the same massive liquidity floor
while the upside levels are still untouched.
My targets:
$118 → $237 → $430
That last target would mean roughly +45,000% from the lows.
Ridiculous number. Ridiculous chart.
But crypto has taught me one thing
dead alts can become very alive, very fast.
That’s exactly why I’m watching it.
After years of bleeding, price is sitting on the same massive liquidity floor
while the upside levels are still untouched.
My targets:
$118 → $237 → $430
That last target would mean roughly +45,000% from the lows.
Ridiculous number. Ridiculous chart.
But crypto has taught me one thing
dead alts can become very alive, very fast.
37
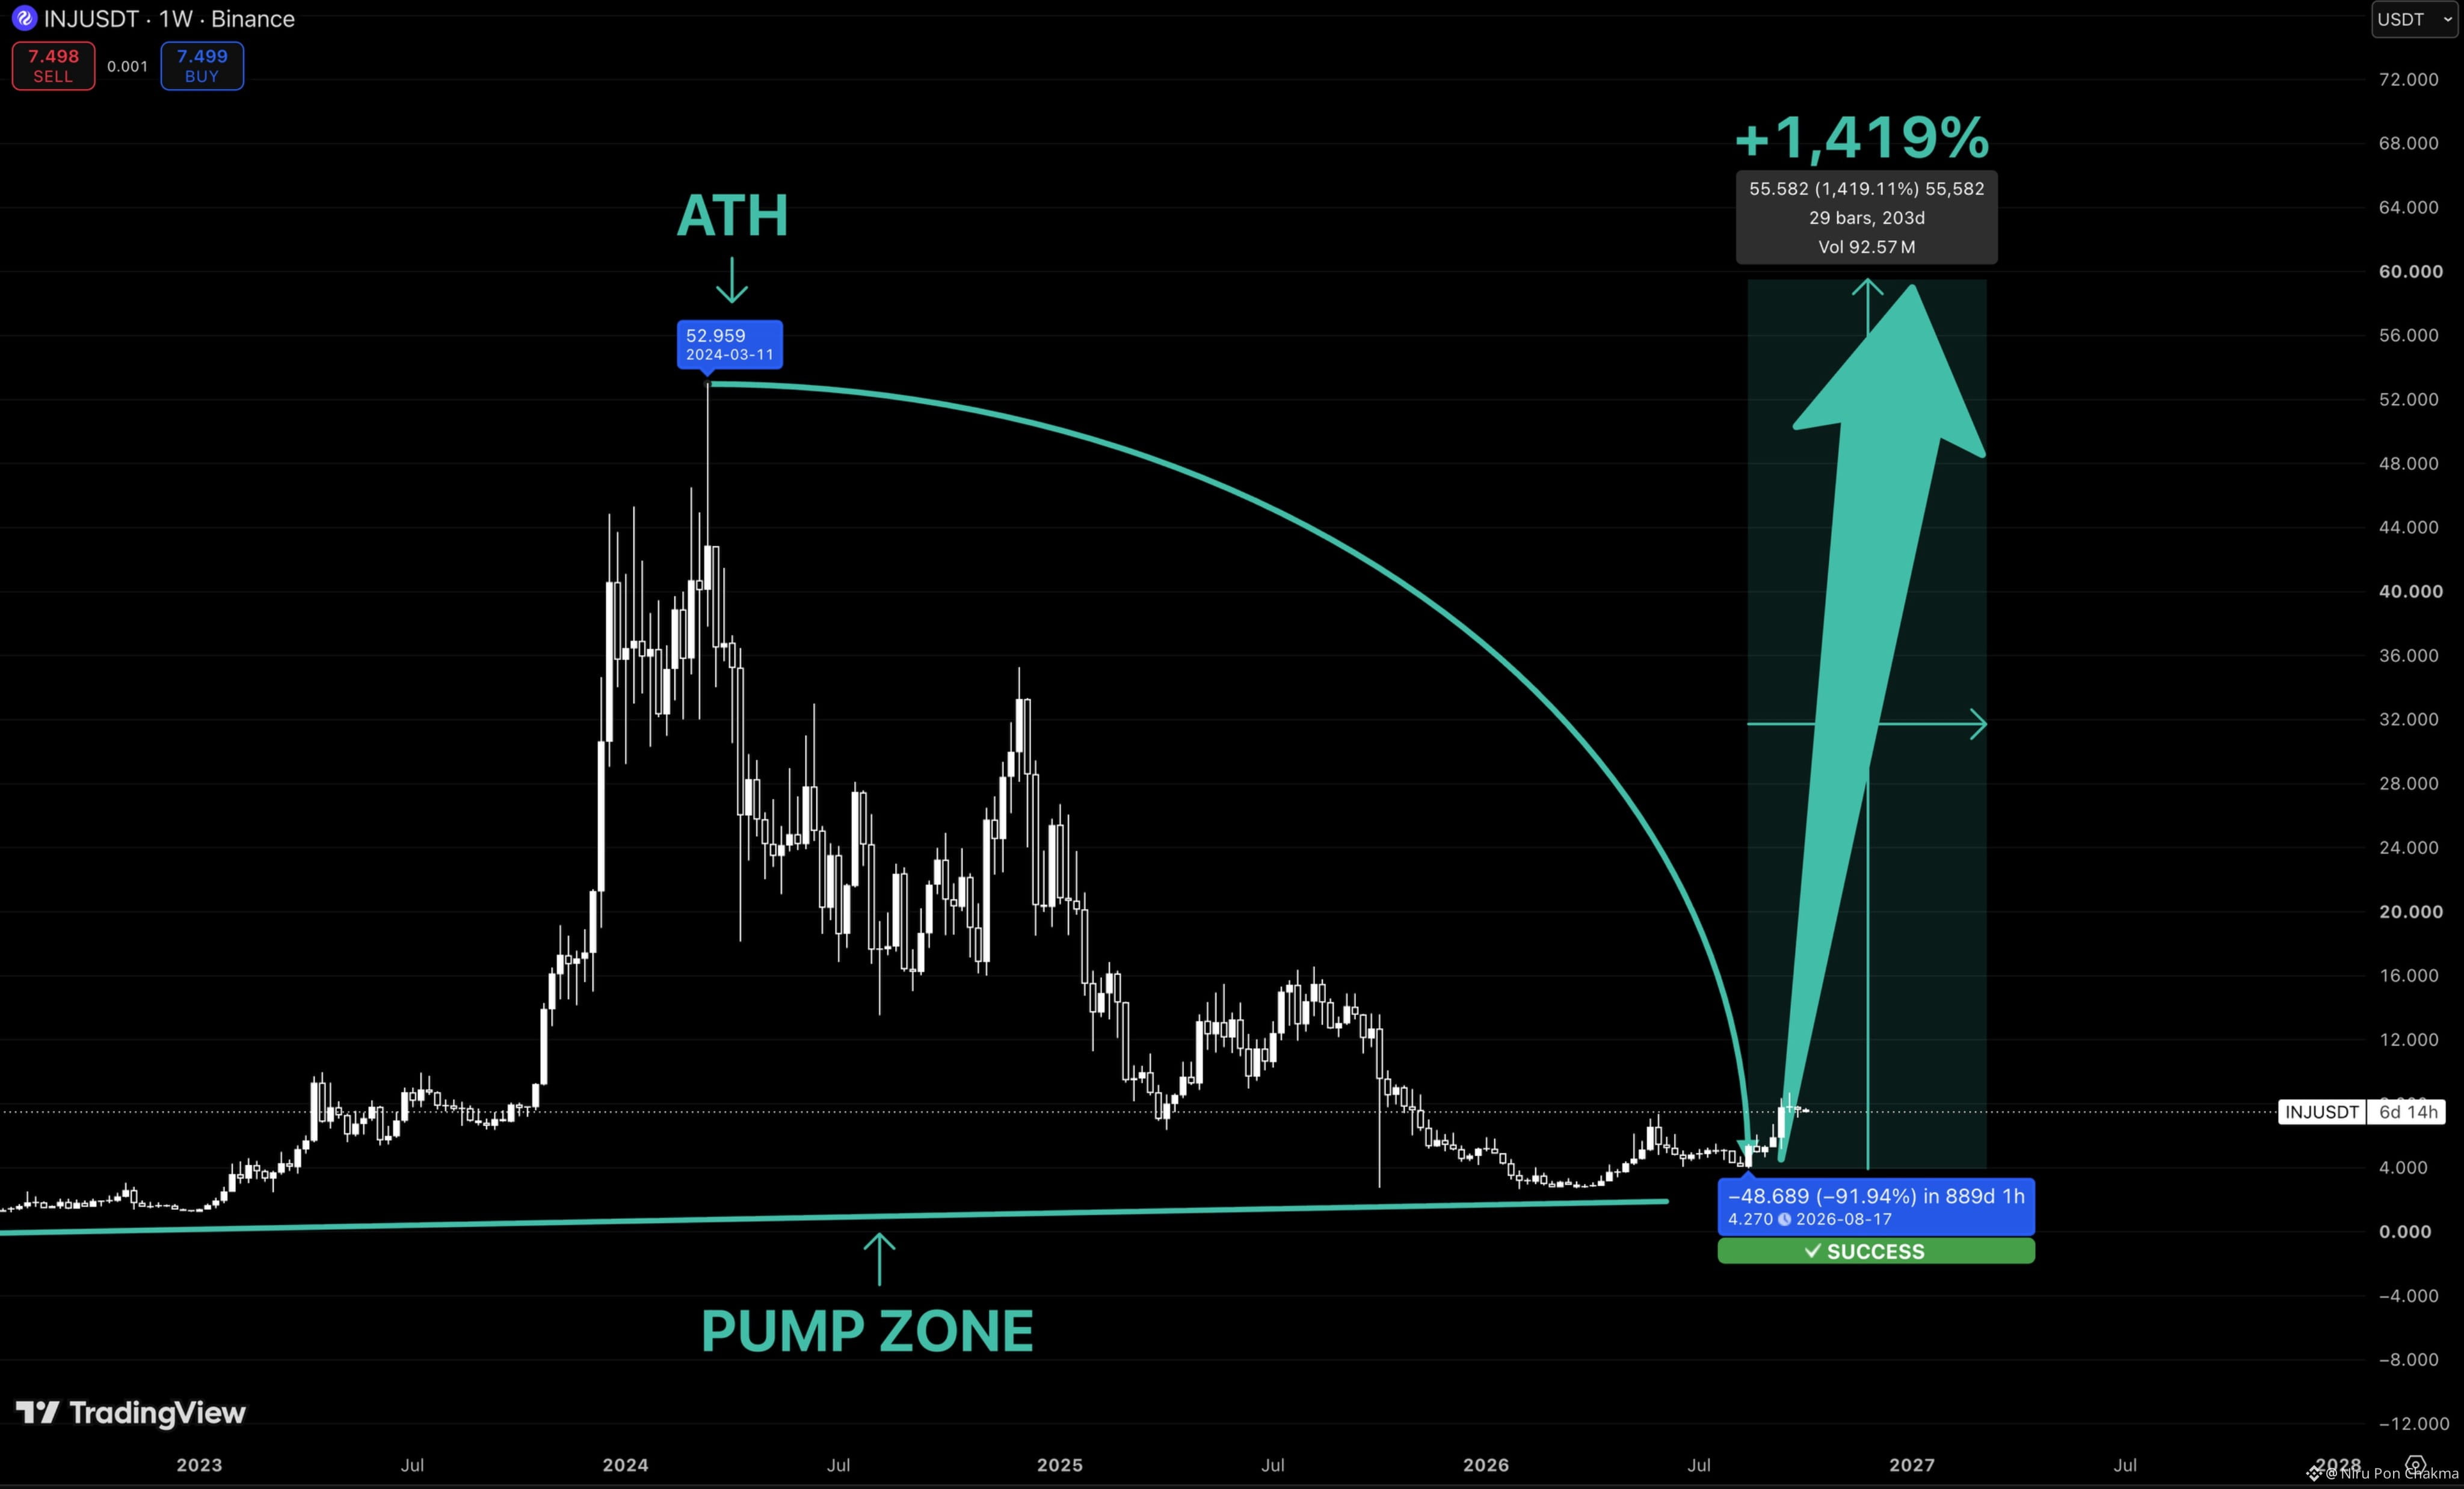
$INJ already gave the signal most people will notice way too late.
It spent months dying around the $4–5 zone.
Now it’s finally pushing out of that base.
The previous ATH sits around $53
and that’s the level I care about.
If $INJ actually completes this cycle back toward the highs
we’re talking about roughly +1,400% from the bottom.
The funny part?
At $50 everyone will want $INJ.
Around $7–8, they’re still scared of it.
$INJ already gave the signal most people will notice way too late.
It spent months dying around the $4–5 zone.
Now it’s finally pushing out of that base.
The previous ATH sits around $53
and that’s the level I care about.
If $INJ actually completes this cycle back toward the highs
we’re talking about roughly +1,400% from the bottom.
The funny part?
At $50 everyone will want $INJ .
Around $7–8, they’re still scared of it.
It spent months dying around the $4–5 zone.
Now it’s finally pushing out of that base.
The previous ATH sits around $53
and that’s the level I care about.
If $INJ actually completes this cycle back toward the highs
we’re talking about roughly +1,400% from the bottom.
The funny part?
At $50 everyone will want $INJ .
Around $7–8, they’re still scared of it.
24
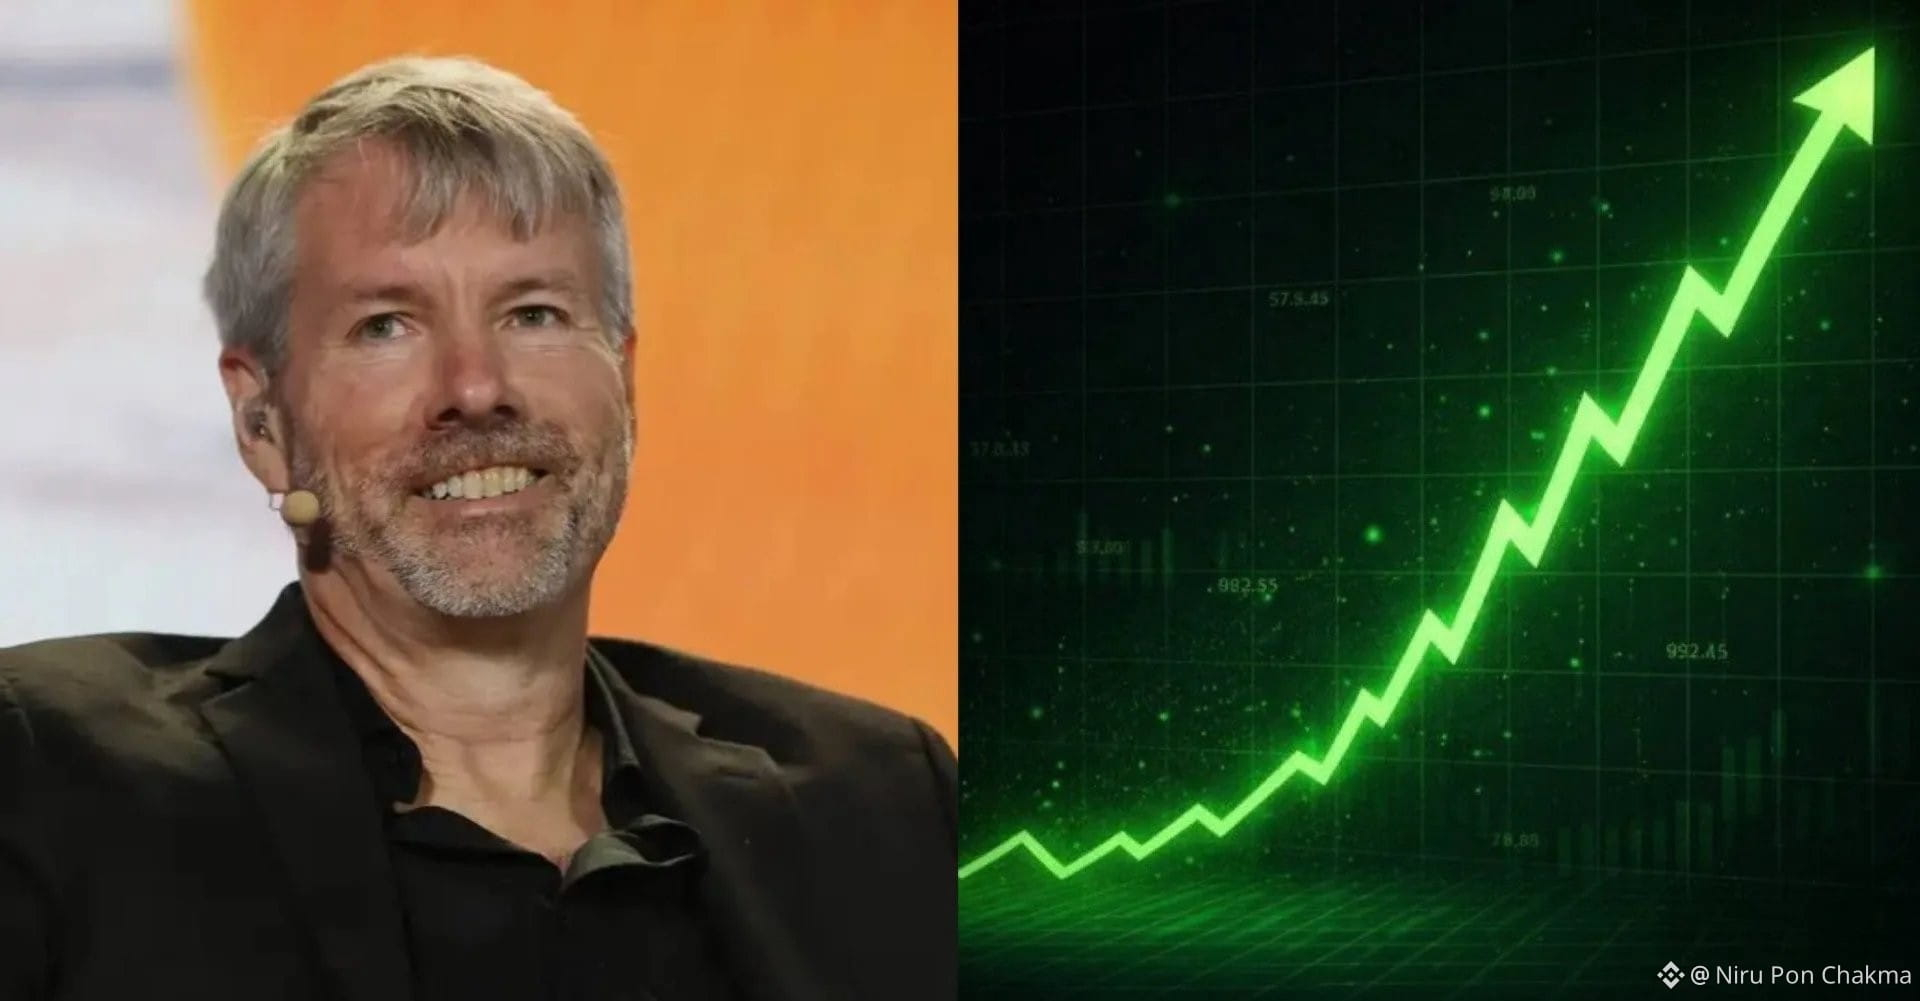
BREAKING: 🇺🇸 Michael Saylor's Strategy just bought $29 Million worth of Bitcoin.
They have bought $14.29 billion worth of Bitcoin in 2026.
$BTC $ETH $SOL
BREAKING: 🇺🇸 Michael Saylor's Strategy just bought $29 Million worth of Bitcoin.
They have bought $14.29 billion worth of Bitcoin in 2026.
$BTC $ETH $SOL
They have bought $14.29 billion worth of Bitcoin in 2026.
$BTC $ETH $SOL
23
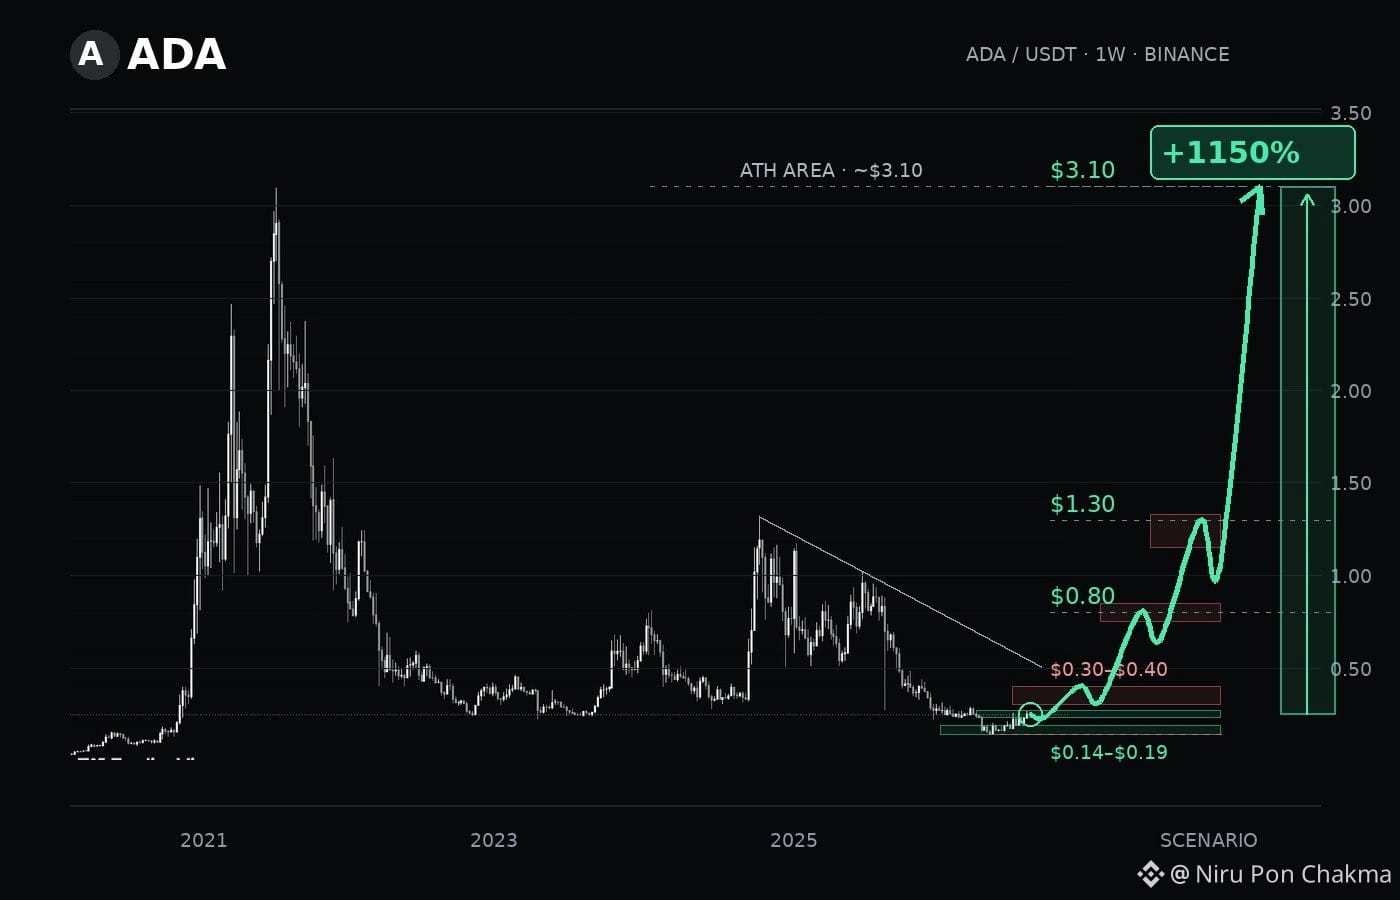
🔵 $ADA CAN CARDANO REBUILD TOWARD $3.10?
The weekly chart shows ADA attempting a recovery from its recent lows.
My bullish scenario starts with holding $0.23–$0.27 and reclaiming $0.30–$0.40. Breaking the descending resistance and holding the retest would strengthen the setup.
Then I’m watching $0.80 and $1.30. Clearing both could open a longer-term move toward the historical high near $3.10.
That final target is 1,150% above the chart’s $0.248 price, conditional on those breakouts.
A weekly close below $0.14 invalidates this recovery scenario.
🔵 $ADA CAN CARDANO REBUILD TOWARD $3.10?
The weekly chart shows ADA attempting a recovery from its recent lows.
My bullish scenario starts with holding $0.23–$0.27 and reclaiming $0.30–$0.40. Breaking the descending resistance and holding the retest would strengthen the setup.
Then I’m watching $0.80 and $1.30. Clearing both could open a longer-term move toward the historical high near $3.10.
That final target is 1,150% above the chart’s $0.248 price, conditional on those breakouts.
A weekly close below $0.14 invalidates this recovery scenario.
The weekly chart shows ADA attempting a recovery from its recent lows.
My bullish scenario starts with holding $0.23–$0.27 and reclaiming $0.30–$0.40. Breaking the descending resistance and holding the retest would strengthen the setup.
Then I’m watching $0.80 and $1.30. Clearing both could open a longer-term move toward the historical high near $3.10.
That final target is 1,150% above the chart’s $0.248 price, conditional on those breakouts.
A weekly close below $0.14 invalidates this recovery scenario.
21
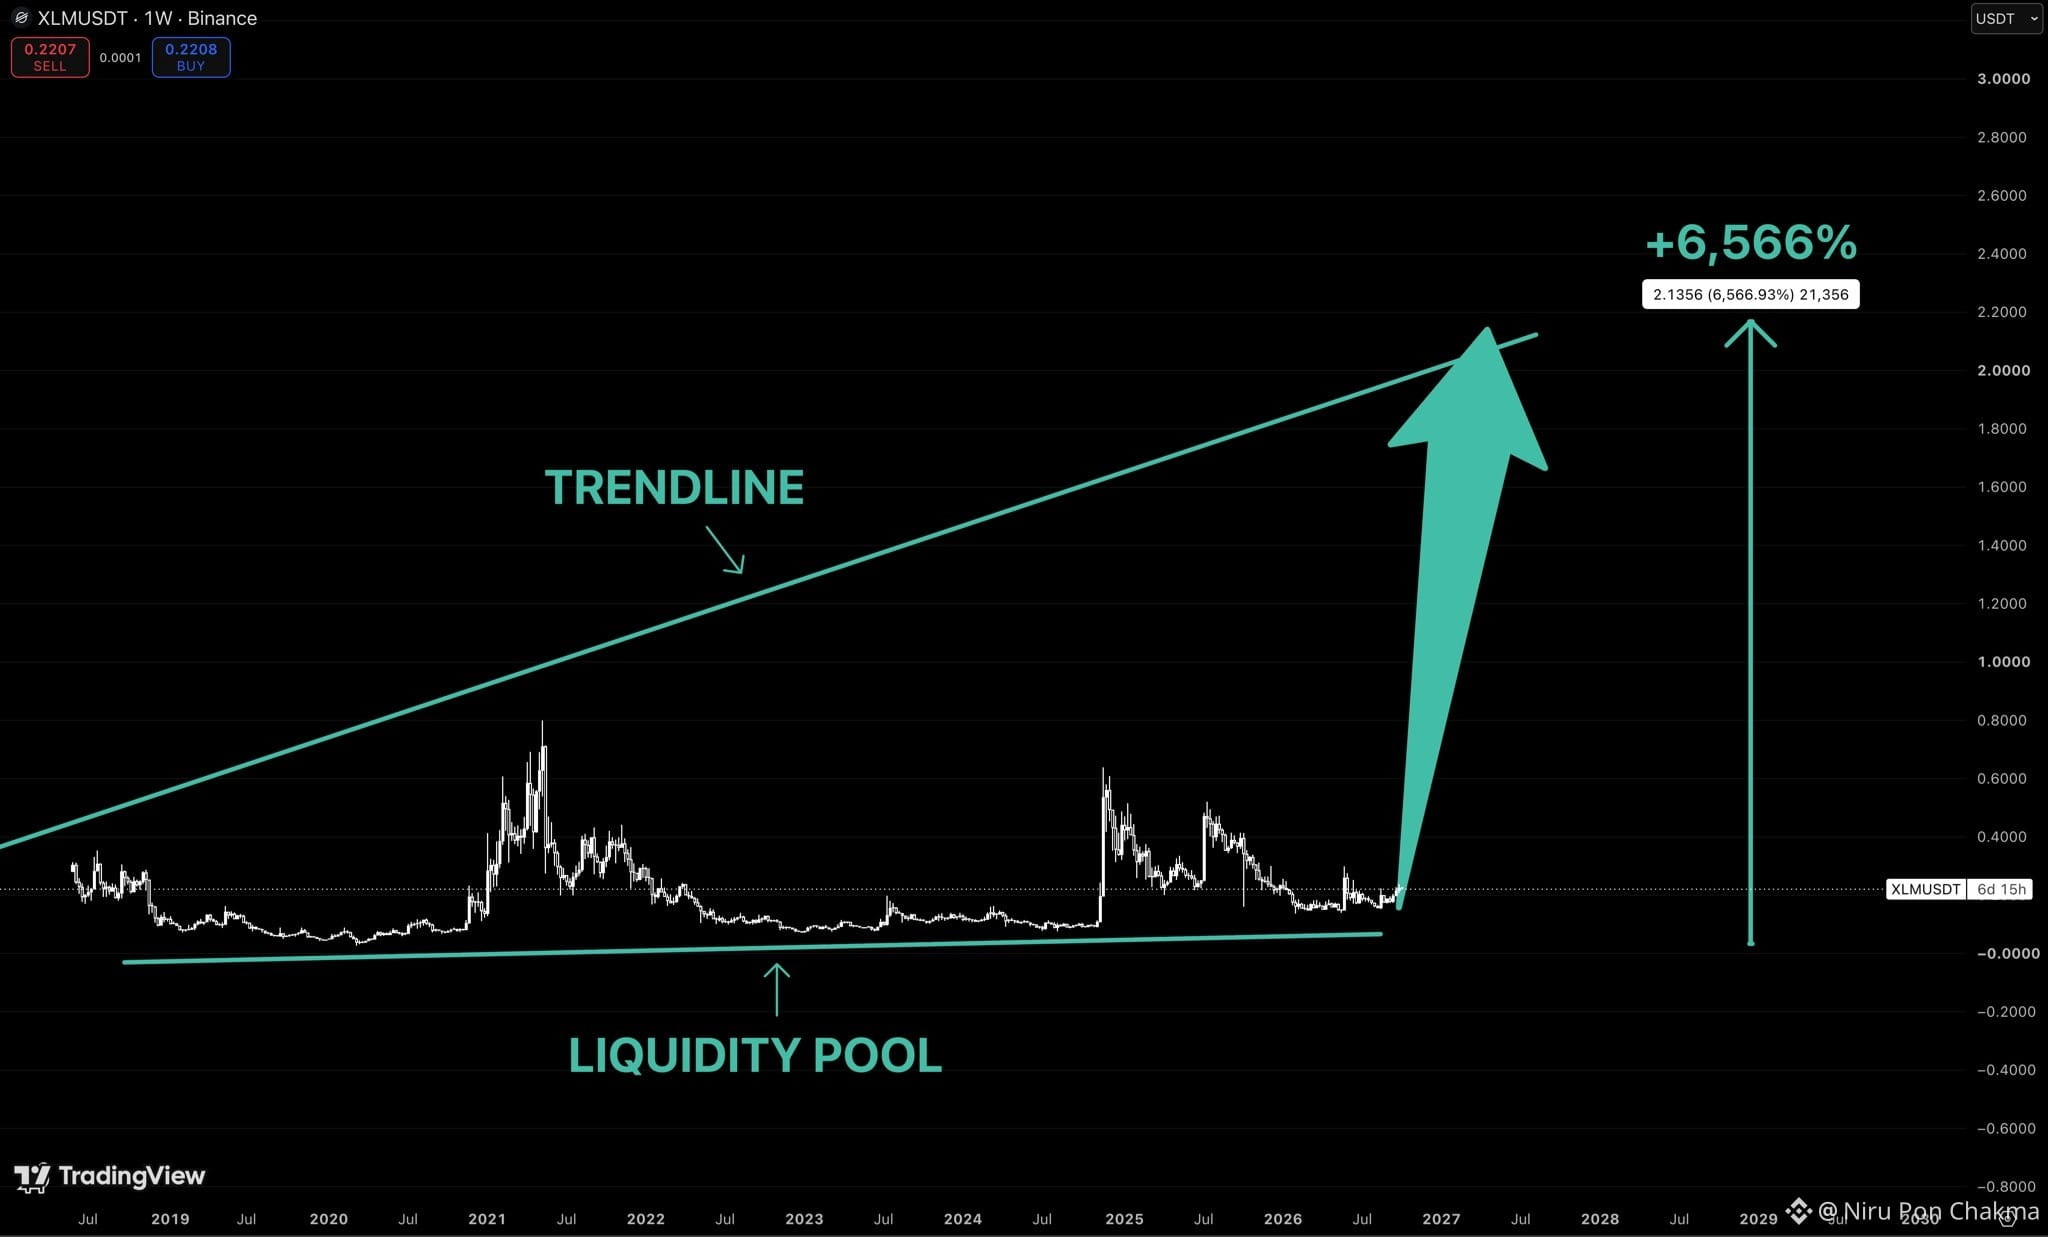
$XLM has spent almost 8 years doing absolutely nothing.
And that’s exactly why this chart is interesting.
Every major spike got sold back into the same liquidity zone.
But the floor keeps holding.
If $XLM finally enters a real expansion phase
I’m looking toward the $2+ region.
That’s roughly +6,500% from the lows.
Years of boredom can get repriced very quickly.
I wouldn’t sleep on $XLM here.
$XLM has spent almost 8 years doing absolutely nothing.
And that’s exactly why this chart is interesting.
Every major spike got sold back into the same liquidity zone.
But the floor keeps holding.
If $XLM finally enters a real expansion phase
I’m looking toward the $2+ region.
That’s roughly +6,500% from the lows.
Years of boredom can get repriced very quickly.
I wouldn’t sleep on $XLM here.
And that’s exactly why this chart is interesting.
Every major spike got sold back into the same liquidity zone.
But the floor keeps holding.
If $XLM finally enters a real expansion phase
I’m looking toward the $2+ region.
That’s roughly +6,500% from the lows.
Years of boredom can get repriced very quickly.
I wouldn’t sleep on $XLM here.
14
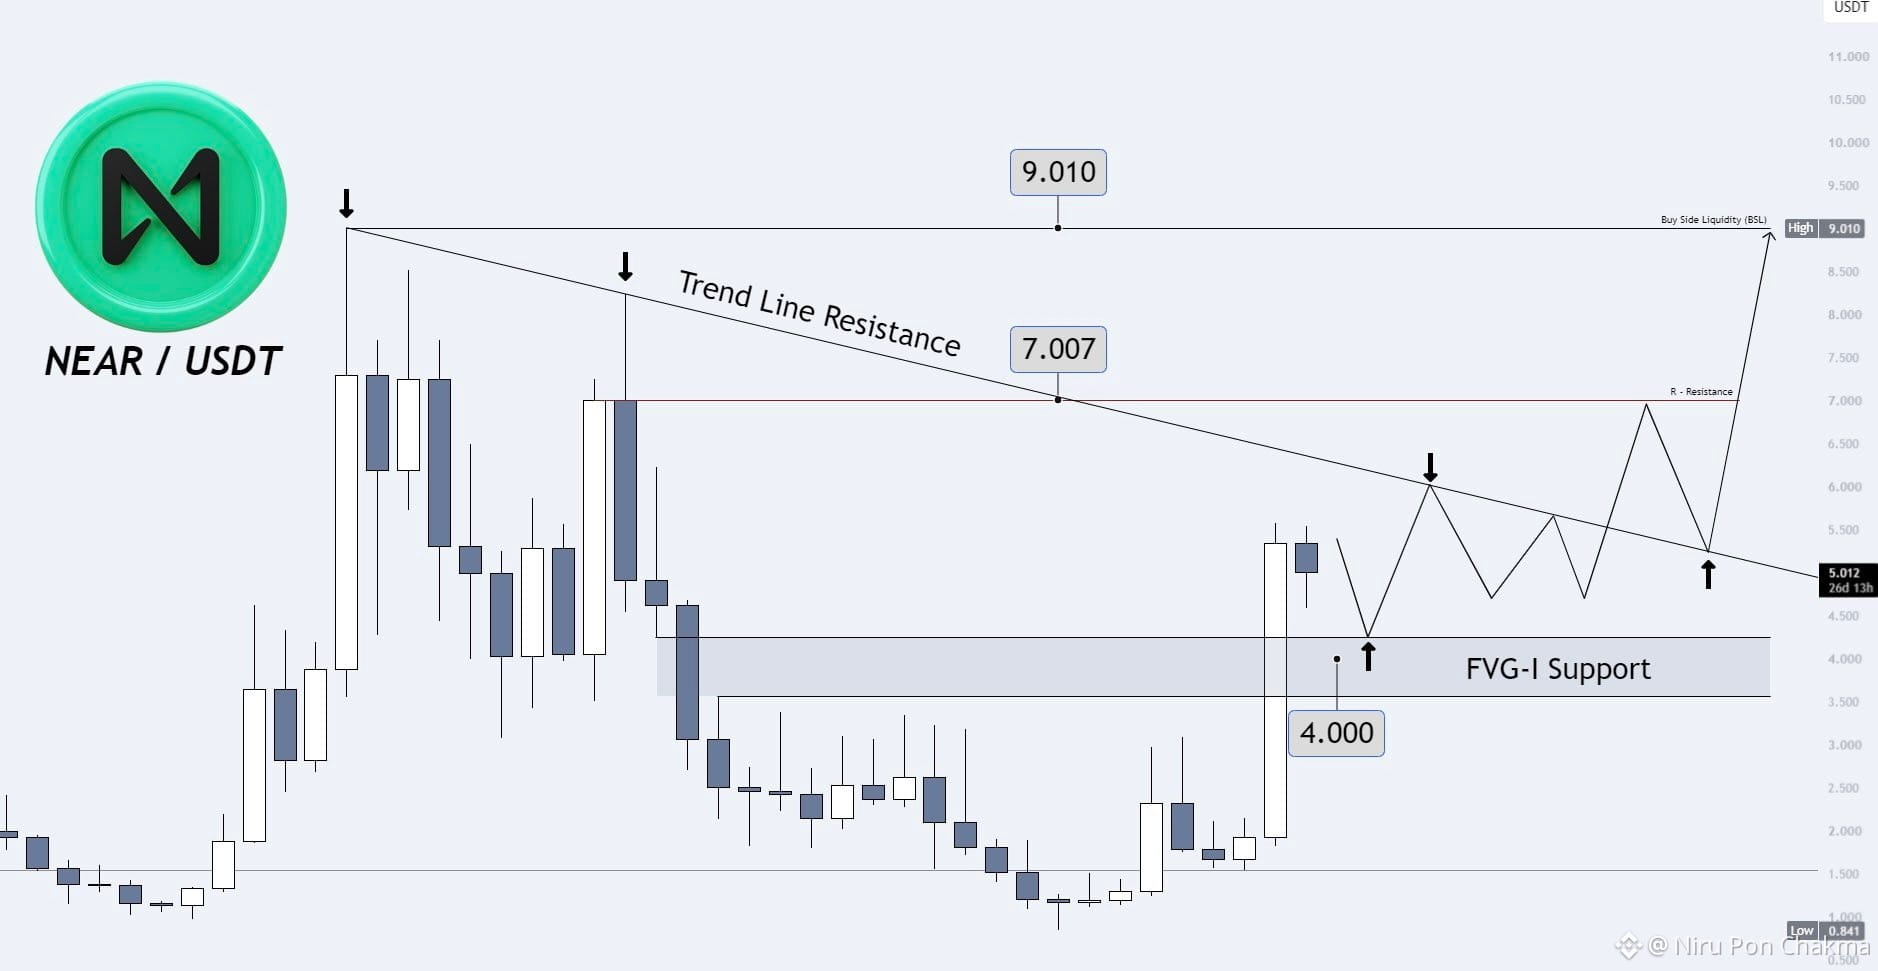
$NEAR Protocol continues to remain one of the most interesting narratives, while still maintaining clear growth potential!
From a global perspective, my targets for NEAR are: 7.00$ 9.010$ 20.597$
After the monthly candle closed above the FVG level, we formed a strong support zone at 4.200$ - 3.600$
This zone will be considered as an additional area for building a position, with the targets I mentioned above!
$NEAR Protocol continues to remain one of the most interesting narratives, while still maintaining clear growth potential!
From a global perspective, my targets for NEAR are: 7.00$ 9.010$ 20.597$
After the monthly candle closed above the FVG level, we formed a strong support zone at 4.200$ - 3.600$
This zone will be considered as an additional area for building a position, with the targets I mentioned above!
From a global perspective, my targets for NEAR are: 7.00$ 9.010$ 20.597$
After the monthly candle closed above the FVG level, we formed a strong support zone at 4.200$ - 3.600$
This zone will be considered as an additional area for building a position, with the targets I mentioned above!
58
Log in to explore more content
Join global crypto users on Binance Square
⚡️ Get latest and useful information about crypto.
💬 Trusted by the world’s largest crypto exchange.
👍 Discover real insights from verified creators.
Email / Phone number
Trending Topics
BinanceLaunchesBinanceIntelligence
165,419 views
1,515 Discussing
#BinanceLaunchesBinanceIntelligence
👉 WHEN AI STOPS JUST TALKING
For years, AI in crypto felt like a smart voice beside the chart. Useful, fast, sometimes impressive, but still separate from the actual machinery of trading.
Binance Intelligence feels like a different chapter.🧠
Binance AI brings market research closer to the user, while AI Pro can turn a plain-language trading idea into a structured workflow that can be tested before deployment. Agent OS pushes the idea further, connecting AI agents with market data, account information and supported trading capabilities. It has already passed 280,000 daily calls.
That creates a new sequence:
Think → research → design → test → approve → execute.
And that final word matters most.
Because the moment AI moves from explaining a market to interacting with it, the conversation changes from intelligence to trust.
A good AI can process information faster than I can. But faster does not automatically mean wiser.
Markets punish mistakes in real time.
So the question I find more interesting than “Can AI trade?” is:
How much authority should we ever give an algorithm over our money? 🤖📊
MoonlitQueen
·1 Likes
·232 views
StriveBuys2000BTCFor$169M
6,858 views
72 Discussing
EvernorthXRPTreasuryCompletesSPACMerger
95,942 views
932 Discussing