
Signal Community group
26.9k Posts

Signal Community group
Report
Block User
8.7K+ Following
1.7K+ Followers
2.1K+ Liked
Posts
All
Quotes
Videos
Live
IRYS is struggling below resistance, hinting at another leg down in the coming hours.
📍 @ 0.01833 | Volume: 1.41M USD
RSI 19 | EMA20: 0.0204149 USD
📈 Trade Plan:
📈 Entry: 0.0181738 – 0.0184862
🛑 Stop Loss: 0.0191112
🎯 TP1: 0.0178092
🎯 TP2: 0.0172885
🎯 TP3: 0.0167677
Waiting for confirmation, then riding the downtrend.
👉 $IRYS
{future}(IRYSUSDT)
👈 Catch it
IRYS is struggling below resistance, hinting at another leg down in the coming hours.
📍 @ 0.01833 | Volume: 1.41M USD
RSI 19 | EMA20: 0.0204149 USD
📈 Trade Plan:
📈 Entry: 0.0181738 – 0.0184862
🛑 Stop Loss: 0.0191112
🎯 TP1: 0.0178092
🎯 TP2: 0.0172885
🎯 TP3: 0.0167677
Waiting for confirmation, then riding the downtrend.
👉 $IRYS
👈 Catch it
📍 @ 0.01833 | Volume: 1.41M USD
RSI 19 | EMA20: 0.0204149 USD
📈 Trade Plan:
📈 Entry: 0.0181738 – 0.0184862
🛑 Stop Loss: 0.0191112
🎯 TP1: 0.0178092
🎯 TP2: 0.0172885
🎯 TP3: 0.0167677
Waiting for confirmation, then riding the downtrend.
👉 $IRYS
👈 Catch it
9
$AVAX · 1H
The price is $6.15, and $AVAX remains below the averages that previously capped its rise. The $6.07 level held twice over the past three days and is being tested again now. The price is in the lower third of this range. It is 1.4% from the lower bound, while the upper bound is still a long way off. The 20 has remained below the 50 for quite some time. An RSI of 22 indicates deeply oversold conditions. Over the past 24 hours, the price fluctuated between $6.07 and $6.97, and is now closer to the lower bound. Trading volume is unremarkable, at 1.4x the recent average. Down 10.0% in 24 hours.
⚠️ Do your own research
$AVAX
{future}(AVAXUSDT)
#TechnicalAnalysis
$AVAX · 1H
The price is $6.15, and $AVAX remains below the averages that previously capped its rise. The $6.07 level held twice over the past three days and is being tested again now. The price is in the lower third of this range. It is 1.4% from the lower bound, while the upper bound is still a long way off. The 20 has remained below the 50 for quite some time. An RSI of 22 indicates deeply oversold conditions. Over the past 24 hours, the price fluctuated between $6.07 and $6.97, and is now closer to the lower bound. Trading volume is unremarkable, at 1.4x the recent average. Down 10.0% in 24 hours.
⚠️ Do your own research
$AVAX
#TechnicalAnalysis
The price is $6.15, and $AVAX remains below the averages that previously capped its rise. The $6.07 level held twice over the past three days and is being tested again now. The price is in the lower third of this range. It is 1.4% from the lower bound, while the upper bound is still a long way off. The 20 has remained below the 50 for quite some time. An RSI of 22 indicates deeply oversold conditions. Over the past 24 hours, the price fluctuated between $6.07 and $6.97, and is now closer to the lower bound. Trading volume is unremarkable, at 1.4x the recent average. Down 10.0% in 24 hours.
⚠️ Do your own research
$AVAX
#TechnicalAnalysis
15
BLESS is showing a clear upward trend: buyers are becoming more active and pushing the price higher.
📍 @ 0.014917 | Volume: 1.11M USD
RSI 69 | EMA20: 0.014134 USD
📈 Trade plan:
📈 Entry: 0.0147877 – 0.0150463
🛑 Stop-loss: 0.0142707
🎯 TP1: 0.0153478
🎯 TP2: 0.0157787
🎯 TP3: 0.0162095
We’ll wait for a retest, then follow the upward trend.
👉 $BLESS
{future}(BLESSUSDT)
👈 Don’t miss it
BLESS is showing a clear upward trend: buyers are becoming more active and pushing the price higher.
📍 @ 0.014917 | Volume: 1.11M USD
RSI 69 | EMA20: 0.014134 USD
📈 Trade plan:
📈 Entry: 0.0147877 – 0.0150463
🛑 Stop-loss: 0.0142707
🎯 TP1: 0.0153478
🎯 TP2: 0.0157787
🎯 TP3: 0.0162095
We’ll wait for a retest, then follow the upward trend.
👉 $BLESS
👈 Don’t miss it
📍 @ 0.014917 | Volume: 1.11M USD
RSI 69 | EMA20: 0.014134 USD
📈 Trade plan:
📈 Entry: 0.0147877 – 0.0150463
🛑 Stop-loss: 0.0142707
🎯 TP1: 0.0153478
🎯 TP2: 0.0157787
🎯 TP3: 0.0162095
We’ll wait for a retest, then follow the upward trend.
👉 $BLESS
👈 Don’t miss it
20
NAORIS has just formed a strong bullish candle, signaling increasing pressure for further upside.
📍 @ 0.0315 | Volume: 0.44M USD
RSI 59 | EMA20: 0.0307779 USD
📈 Trade plan:
📈 Entry: 0.0313041 – 0.0316959
🛑 Stop-loss: 0.0305203
🎯 TP1: 0.0321531
🎯 TP2: 0.0328063
🎯 TP3: 0.0334594
Wait for a retest, then follow the uptrend.
👉 $NAORIS
{future}(NAORISUSDT)
👈 Don’t miss out
NAORIS has just formed a strong bullish candle, signaling increasing pressure for further upside.
📍 @ 0.0315 | Volume: 0.44M USD
RSI 59 | EMA20: 0.0307779 USD
📈 Trade plan:
📈 Entry: 0.0313041 – 0.0316959
🛑 Stop-loss: 0.0305203
🎯 TP1: 0.0321531
🎯 TP2: 0.0328063
🎯 TP3: 0.0334594
Wait for a retest, then follow the uptrend.
👉 $NAORIS
👈 Don’t miss out
📍 @ 0.0315 | Volume: 0.44M USD
RSI 59 | EMA20: 0.0307779 USD
📈 Trade plan:
📈 Entry: 0.0313041 – 0.0316959
🛑 Stop-loss: 0.0305203
🎯 TP1: 0.0321531
🎯 TP2: 0.0328063
🎯 TP3: 0.0334594
Wait for a retest, then follow the uptrend.
👉 $NAORIS
👈 Don’t miss out
26
$BARD is losing momentum fast as volume rises and price breaks below key support.
📍 @ 0.0888 | Volume: 1.06M USD
RSI 42 | EMA20: 0.0904482 USD
📈 Trade Plan:
📈 Entry: 0.0882887 – 0.0893113
🛑 Stop Loss: 0.0913563
🎯 TP1: 0.0870958
🎯 TP2: 0.0853916
🎯 TP3: 0.0836874
Waiting for confirmation, then riding the downtrend.
👉 $BARD
{future}(BARDUSDT)
👈 Catch it
$BARD is losing momentum fast as volume rises and price breaks below key support.
📍 @ 0.0888 | Volume: 1.06M USD
RSI 42 | EMA20: 0.0904482 USD
📈 Trade Plan:
📈 Entry: 0.0882887 – 0.0893113
🛑 Stop Loss: 0.0913563
🎯 TP1: 0.0870958
🎯 TP2: 0.0853916
🎯 TP3: 0.0836874
Waiting for confirmation, then riding the downtrend.
👉 $BARD
👈 Catch it
📍 @ 0.0888 | Volume: 1.06M USD
RSI 42 | EMA20: 0.0904482 USD
📈 Trade Plan:
📈 Entry: 0.0882887 – 0.0893113
🛑 Stop Loss: 0.0913563
🎯 TP1: 0.0870958
🎯 TP2: 0.0853916
🎯 TP3: 0.0836874
Waiting for confirmation, then riding the downtrend.
👉 $BARD
👈 Catch it
1
44
🎙️ The currency has fallen, but we still have to keep striving!

End
01 h 57 m 59 s
1.1k
10
9
$USELESS
{future}(USELESSUSDT)
is struggling below resistance, hinting at another leg down in the coming hours.
📍 @ 0.07179 | Volume: 0.28M USD
RSI 33 | EMA20: 0.0744404 USD
📈 Trade Plan:
📈 Entry: 0.0714163 – 0.0721637
🛑 Stop Loss: 0.0736586
🎯 TP1: 0.0705443
🎯 TP2: 0.0692986
🎯 TP3: 0.0680529
Waiting for confirmation, then riding the downtrend.
$USELESS
is struggling below resistance, hinting at another leg down in the coming hours.
📍 @ 0.07179 | Volume: 0.28M USD
RSI 33 | EMA20: 0.0744404 USD
📈 Trade Plan:
📈 Entry: 0.0714163 – 0.0721637
🛑 Stop Loss: 0.0736586
🎯 TP1: 0.0705443
🎯 TP2: 0.0692986
🎯 TP3: 0.0680529
Waiting for confirmation, then riding the downtrend.
is struggling below resistance, hinting at another leg down in the coming hours.
📍 @ 0.07179 | Volume: 0.28M USD
RSI 33 | EMA20: 0.0744404 USD
📈 Trade Plan:
📈 Entry: 0.0714163 – 0.0721637
🛑 Stop Loss: 0.0736586
🎯 TP1: 0.0705443
🎯 TP2: 0.0692986
🎯 TP3: 0.0680529
Waiting for confirmation, then riding the downtrend.
45
what is happening here $BTC 😱
what is happening here $BTC 😱
63
HBAR just printed a strong bearish candle, signaling more downside pressure building right now.
📍 @ 0.05079 | Volume: 0.18M USD
RSI 39 | EMA20: 0.0512079 USD
📈 Trade Plan:
📈 Entry: 0.0506961 – 0.0508839
🛑 Stop Loss: 0.0512593
🎯 TP1: 0.0504771
🎯 TP2: 0.0501643
🎯 TP3: 0.0498514
Waiting for confirmation, then riding the downtrend.
👉 $HBAR
{future}(HBARUSDT)
👈 Catch it
HBAR just printed a strong bearish candle, signaling more downside pressure building right now.
📍 @ 0.05079 | Volume: 0.18M USD
RSI 39 | EMA20: 0.0512079 USD
📈 Trade Plan:
📈 Entry: 0.0506961 – 0.0508839
🛑 Stop Loss: 0.0512593
🎯 TP1: 0.0504771
🎯 TP2: 0.0501643
🎯 TP3: 0.0498514
Waiting for confirmation, then riding the downtrend.
👉 $HBAR
👈 Catch it
📍 @ 0.05079 | Volume: 0.18M USD
RSI 39 | EMA20: 0.0512079 USD
📈 Trade Plan:
📈 Entry: 0.0506961 – 0.0508839
🛑 Stop Loss: 0.0512593
🎯 TP1: 0.0504771
🎯 TP2: 0.0501643
🎯 TP3: 0.0498514
Waiting for confirmation, then riding the downtrend.
👉 $HBAR
👈 Catch it
67
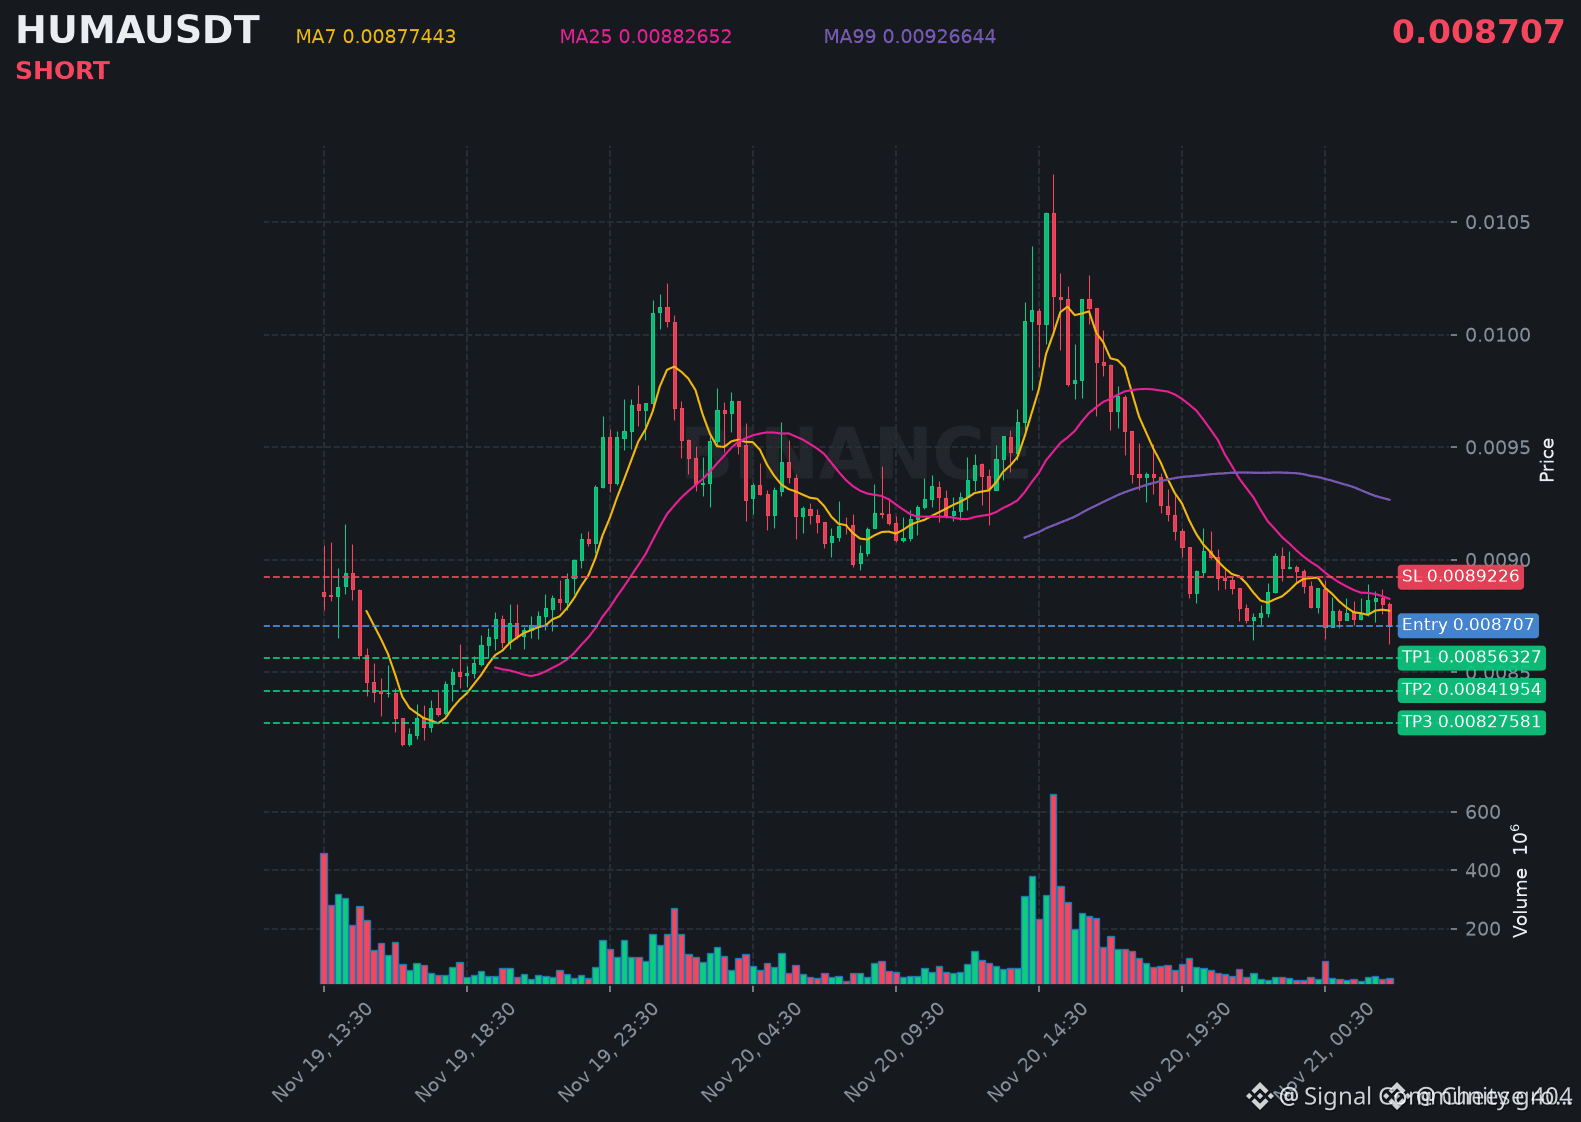
HUMA is struggling below resistance, hinting at another leg down in the coming hours.
📍 @ 0.008707 | Volume: 0.25M USD
RSI 39 | EMA20: 0.00884255 USD
📈 Trade Plan:
📈 Entry: 0.00866388 – 0.00875012
🛑 Stop Loss: 0.0089226
🎯 TP1: 0.00856327
🎯 TP2: 0.00841954
🎯 TP3: 0.00827581
Waiting for confirmation, then riding the downtrend.
👉 $HUMA
{future}(HUMAUSDT)
👈 Catch it
HUMA is struggling below resistance, hinting at another leg down in the coming hours.
📍 @ 0.008707 | Volume: 0.25M USD
RSI 39 | EMA20: 0.00884255 USD
📈 Trade Plan:
📈 Entry: 0.00866388 – 0.00875012
🛑 Stop Loss: 0.0089226
🎯 TP1: 0.00856327
🎯 TP2: 0.00841954
🎯 TP3: 0.00827581
Waiting for confirmation, then riding the downtrend.
👉 $HUMA
👈 Catch it
📍 @ 0.008707 | Volume: 0.25M USD
RSI 39 | EMA20: 0.00884255 USD
📈 Trade Plan:
📈 Entry: 0.00866388 – 0.00875012
🛑 Stop Loss: 0.0089226
🎯 TP1: 0.00856327
🎯 TP2: 0.00841954
🎯 TP3: 0.00827581
Waiting for confirmation, then riding the downtrend.
👉 $HUMA
👈 Catch it
95
SKY is gaining strong bullish momentum as volume rises and the price breaks through a key resistance level.
📍 @ 0.04309 | Volume: 1.46M USD
RSI 50 | EMA20: 0.043004 USD
📈 Trading plan:
📈 Entry: 0.0429024 – 0.0432776
🛑 Stop-loss: 0.0421521
🎯 TP1: 0.0437153
🎯 TP2: 0.0443406
🎯 TP3: 0.0449659
We’re waiting for a retest of the level, then following the uptrend.
👉 $SKY
{future}(SKYUSDT)
👈 Don’t miss out
SKY is gaining strong bullish momentum as volume rises and the price breaks through a key resistance level.
📍 @ 0.04309 | Volume: 1.46M USD
RSI 50 | EMA20: 0.043004 USD
📈 Trading plan:
📈 Entry: 0.0429024 – 0.0432776
🛑 Stop-loss: 0.0421521
🎯 TP1: 0.0437153
🎯 TP2: 0.0443406
🎯 TP3: 0.0449659
We’re waiting for a retest of the level, then following the uptrend.
👉 $SKY
👈 Don’t miss out
📍 @ 0.04309 | Volume: 1.46M USD
RSI 50 | EMA20: 0.043004 USD
📈 Trading plan:
📈 Entry: 0.0429024 – 0.0432776
🛑 Stop-loss: 0.0421521
🎯 TP1: 0.0437153
🎯 TP2: 0.0443406
🎯 TP3: 0.0449659
We’re waiting for a retest of the level, then following the uptrend.
👉 $SKY
👈 Don’t miss out
34
BTW | LONG 🟢 | Bullish trend | 15m
24h: +10.64% | Volume: 58.4M USDT
Why long: price above EMA200; EMA20/50/200 aligned for a long; RSI14 63.1; MACD histogram positive; ADX14 14.8; volume — 0.48x the average over 20 candles; pullback/trend continuation.
Entry: 0.6615
SL: 0.618305
TP1: 0.715493 | TP2: 0.747889 | TP3: 0.791084
For entry guidance only; don't chase the price. Setup is invalid at SL.
Technical analysis only. Not financial advice.
$BTW
{future}(BTWUSDT)
BTW | LONG 🟢 | Bullish trend | 15m
24h: +10.64% | Volume: 58.4M USDT
Why long: price above EMA200; EMA20/50/200 aligned for a long; RSI14 63.1; MACD histogram positive; ADX14 14.8; volume — 0.48x the average over 20 candles; pullback/trend continuation.
Entry: 0.6615
SL: 0.618305
TP1: 0.715493 | TP2: 0.747889 | TP3: 0.791084
For entry guidance only; don't chase the price. Setup is invalid at SL.
Technical analysis only. Not financial advice.
$BTW
24h: +10.64% | Volume: 58.4M USDT
Why long: price above EMA200; EMA20/50/200 aligned for a long; RSI14 63.1; MACD histogram positive; ADX14 14.8; volume — 0.48x the average over 20 candles; pullback/trend continuation.
Entry: 0.6615
SL: 0.618305
TP1: 0.715493 | TP2: 0.747889 | TP3: 0.791084
For entry guidance only; don't chase the price. Setup is invalid at SL.
Technical analysis only. Not financial advice.
$BTW
49
LIT looks ready for further decline, and bears firmly control the trend.
📍 @ 2.308 | Volume: 0.98M USD
RSI 22 | EMA20: 2.41327 USD
📈 Trade plan:
📈 Entry: 2.2972 – 2.3188
🛑 Stop-loss: 2.36201
🎯 TP1: 2.27199
🎯 TP2: 2.23599
🎯 TP3: 2.19998
We’ll wait for confirmation, then follow the downtrend.
👉 $LIT
{future}(LITUSDT)
👈 Don’t miss it
LIT looks ready for further decline, and bears firmly control the trend.
📍 @ 2.308 | Volume: 0.98M USD
RSI 22 | EMA20: 2.41327 USD
📈 Trade plan:
📈 Entry: 2.2972 – 2.3188
🛑 Stop-loss: 2.36201
🎯 TP1: 2.27199
🎯 TP2: 2.23599
🎯 TP3: 2.19998
We’ll wait for confirmation, then follow the downtrend.
👉 $LIT
👈 Don’t miss it
📍 @ 2.308 | Volume: 0.98M USD
RSI 22 | EMA20: 2.41327 USD
📈 Trade plan:
📈 Entry: 2.2972 – 2.3188
🛑 Stop-loss: 2.36201
🎯 TP1: 2.27199
🎯 TP2: 2.23599
🎯 TP3: 2.19998
We’ll wait for confirmation, then follow the downtrend.
👉 $LIT
👈 Don’t miss it
1
70
HMSTR just printed a strong bearish candle, signaling more downside pressure building right now.
📍 @ 0.0001466 | Volume: 0.44M USD
RSI 47 | EMA20: 0.000147471 USD
📈 Trade Plan:
📈 Entry: 0.000145688 – 0.000147512
🛑 Stop Loss: 0.000151162
🎯 TP1: 0.000143559
🎯 TP2: 0.000140517
🎯 TP3: 0.000137476
Waiting for confirmation, then riding the downtrend.
👉 $HMSTR
{future}(HMSTRUSDT)
HMSTR just printed a strong bearish candle, signaling more downside pressure building right now.
📍 @ 0.0001466 | Volume: 0.44M USD
RSI 47 | EMA20: 0.000147471 USD
📈 Trade Plan:
📈 Entry: 0.000145688 – 0.000147512
🛑 Stop Loss: 0.000151162
🎯 TP1: 0.000143559
🎯 TP2: 0.000140517
🎯 TP3: 0.000137476
Waiting for confirmation, then riding the downtrend.
👉 $HMSTR
📍 @ 0.0001466 | Volume: 0.44M USD
RSI 47 | EMA20: 0.000147471 USD
📈 Trade Plan:
📈 Entry: 0.000145688 – 0.000147512
🛑 Stop Loss: 0.000151162
🎯 TP1: 0.000143559
🎯 TP2: 0.000140517
🎯 TP3: 0.000137476
Waiting for confirmation, then riding the downtrend.
👉 $HMSTR
1
42
$SUI is showing a clear uptrend, with buyers stepping in and pushing the price higher.
📍 @ 0.6583 | Volume: 4.19M USD
RSI 42 | EMA20: 0.661736 USD
📈 Trade Plan:
📈 Entry: 0.656317 – 0.660283
🛑 Stop Loss: 0.648383
🎯 TP1: 0.664911
🎯 TP2: 0.671523
🎯 TP3: 0.678134
Waiting for a retest, then riding the uptrend.
👉 $SUI
{spot}(SUIUSDT)
👈 Catch it
$SUI is showing a clear uptrend, with buyers stepping in and pushing the price higher.
📍 @ 0.6583 | Volume: 4.19M USD
RSI 42 | EMA20: 0.661736 USD
📈 Trade Plan:
📈 Entry: 0.656317 – 0.660283
🛑 Stop Loss: 0.648383
🎯 TP1: 0.664911
🎯 TP2: 0.671523
🎯 TP3: 0.678134
Waiting for a retest, then riding the uptrend.
👉 $SUI
👈 Catch it
📍 @ 0.6583 | Volume: 4.19M USD
RSI 42 | EMA20: 0.661736 USD
📈 Trade Plan:
📈 Entry: 0.656317 – 0.660283
🛑 Stop Loss: 0.648383
🎯 TP1: 0.664911
🎯 TP2: 0.671523
🎯 TP3: 0.678134
Waiting for a retest, then riding the uptrend.
👉 $SUI
👈 Catch it
48
MEGA is showing a confident decline, with sellers holding back every bounce.
📍 @ 0.04804 | Volume: 0.37M USD
RSI 34 | EMA20: 0.0495925 USD
📈 Trade plan:
📈 Entry: 0.0478101 – 0.0482699
🛑 Stop-loss: 0.0491893
🎯 TP1: 0.0472738
🎯 TP2: 0.0465076
🎯 TP3: 0.0457413
We’re waiting for confirmation, then we’ll follow the downtrend.
👉 $MEGA
{future}(MEGAUSDT)
👈 Don’t miss out
MEGA is showing a confident decline, with sellers holding back every bounce.
📍 @ 0.04804 | Volume: 0.37M USD
RSI 34 | EMA20: 0.0495925 USD
📈 Trade plan:
📈 Entry: 0.0478101 – 0.0482699
🛑 Stop-loss: 0.0491893
🎯 TP1: 0.0472738
🎯 TP2: 0.0465076
🎯 TP3: 0.0457413
We’re waiting for confirmation, then we’ll follow the downtrend.
👉 $MEGA
👈 Don’t miss out
📍 @ 0.04804 | Volume: 0.37M USD
RSI 34 | EMA20: 0.0495925 USD
📈 Trade plan:
📈 Entry: 0.0478101 – 0.0482699
🛑 Stop-loss: 0.0491893
🎯 TP1: 0.0472738
🎯 TP2: 0.0465076
🎯 TP3: 0.0457413
We’re waiting for confirmation, then we’ll follow the downtrend.
👉 $MEGA
👈 Don’t miss out
20
$CAP
{future}(CAPUSDT)
Bullish channel reversal — LONG
Direction: LONG
Entry zone: 0.0940 – 0.0970
Stop-loss: 0.0835
TP1: 0.1025
TP2: 0.1125
TP3: 0.12248
Why this scenario?
CAP rebounded strongly from the support level at 0.08484 after the descending channel cycle ended. The price is consolidating near 0.09620, and a breakout above the channel resistance is possible.
A confirmed breakout and successful retest could open the way to 0.1025, 0.1125, and 0.12248.
$CAP
Bullish channel reversal — LONG
Direction: LONG
Entry zone: 0.0940 – 0.0970
Stop-loss: 0.0835
TP1: 0.1025
TP2: 0.1125
TP3: 0.12248
Why this scenario?
CAP rebounded strongly from the support level at 0.08484 after the descending channel cycle ended. The price is consolidating near 0.09620, and a breakout above the channel resistance is possible.
A confirmed breakout and successful retest could open the way to 0.1025, 0.1125, and 0.12248.
Bullish channel reversal — LONG
Direction: LONG
Entry zone: 0.0940 – 0.0970
Stop-loss: 0.0835
TP1: 0.1025
TP2: 0.1125
TP3: 0.12248
Why this scenario?
CAP rebounded strongly from the support level at 0.08484 after the descending channel cycle ended. The price is consolidating near 0.09620, and a breakout above the channel resistance is possible.
A confirmed breakout and successful retest could open the way to 0.1025, 0.1125, and 0.12248.
23
BLESS | LONG 🟢 | Bullish trend | 15m
24h: +10.21% | Volume: 50.3M USDT
Why LONG: price above EMA200; EMA20/50/200 aligned bullishly; RSI14 61.4; MACD histogram positive; ADX14 44.4; volume is 6.83 times the 20-candle average; pullback/trend continuation.
Entry: 0.013309
SL: 0.0122045
TP1: 0.0146897 | TP2: 0.015518 | TP3: 0.0166226
Entry level is for guidance only; don't chase the price. If SL is hit, the setup becomes invalid.
Technical analysis only. Not financial advice.
$BLESS
{future}(BLESSUSDT)
BLESS | LONG 🟢 | Bullish trend | 15m
24h: +10.21% | Volume: 50.3M USDT
Why LONG: price above EMA200; EMA20/50/200 aligned bullishly; RSI14 61.4; MACD histogram positive; ADX14 44.4; volume is 6.83 times the 20-candle average; pullback/trend continuation.
Entry: 0.013309
SL: 0.0122045
TP1: 0.0146897 | TP2: 0.015518 | TP3: 0.0166226
Entry level is for guidance only; don't chase the price. If SL is hit, the setup becomes invalid.
Technical analysis only. Not financial advice.
$BLESS
24h: +10.21% | Volume: 50.3M USDT
Why LONG: price above EMA200; EMA20/50/200 aligned bullishly; RSI14 61.4; MACD histogram positive; ADX14 44.4; volume is 6.83 times the 20-candle average; pullback/trend continuation.
Entry: 0.013309
SL: 0.0122045
TP1: 0.0146897 | TP2: 0.015518 | TP3: 0.0166226
Entry level is for guidance only; don't chase the price. If SL is hit, the setup becomes invalid.
Technical analysis only. Not financial advice.
$BLESS
23
BTW Approaching an important level
Entry: 0.6064 | Stop-loss: 0.5733 Target 1: 0.6137 Target 2: 0.6270 Target 3: 0.6780
BTW is approaching the 0.6064 mark on the 4-hour chart — this level has been tested 6 times. The latest candle closed with volume 1.29 times higher than average, while buyers are increasing pressure near this level. The price rose by +14.4% over 24 hours. A close above 0.6064 will open the way for further gains.
Momentum is building near resistance. Buyers are watching this level!
Buy and trade $BTW
{future}(BTWUSDT)
BTW Approaching an important level
Entry: 0.6064 | Stop-loss: 0.5733 Target 1: 0.6137 Target 2: 0.6270 Target 3: 0.6780
BTW is approaching the 0.6064 mark on the 4-hour chart — this level has been tested 6 times. The latest candle closed with volume 1.29 times higher than average, while buyers are increasing pressure near this level. The price rose by +14.4% over 24 hours. A close above 0.6064 will open the way for further gains.
Momentum is building near resistance. Buyers are watching this level!
Buy and trade $BTW
Entry: 0.6064 | Stop-loss: 0.5733 Target 1: 0.6137 Target 2: 0.6270 Target 3: 0.6780
BTW is approaching the 0.6064 mark on the 4-hour chart — this level has been tested 6 times. The latest candle closed with volume 1.29 times higher than average, while buyers are increasing pressure near this level. The price rose by +14.4% over 24 hours. A close above 0.6064 will open the way for further gains.
Momentum is building near resistance. Buyers are watching this level!
Buy and trade $BTW
23
Log in to explore more content
Join global crypto users on Binance Square
⚡️ Get latest and useful information about crypto.
💬 Trusted by the world’s largest crypto exchange.
👍 Discover real insights from verified creators.
Email / Phone number
Trending Topics
CanBTCReboundAfterFallingBelow60K?
403,812 views
1,727 Discussing
Bitcoin News | Bitcoin Falls Below $60,000 for the First Time Since July as IBIT Posts Record $541 Million Outflow
Binance News
·55 Likes
·102.6k views
GlobalStocksFaceLongestLosingStreakSince2023
134,979 views
1,204 Discussing
BlackRockIBITPostsRecord$541MSingleDayOutflow
1,868 views
32 Discussing