

VamosNexus
34 Posts

VamosNexus
Report
Block User
I’m a crypto trading enthusiast who loves exploring digital markets and learning new strategies to grow in the world of finance.
13 Following
152 Followers
230 Liked
Posts
·
--
Bullish
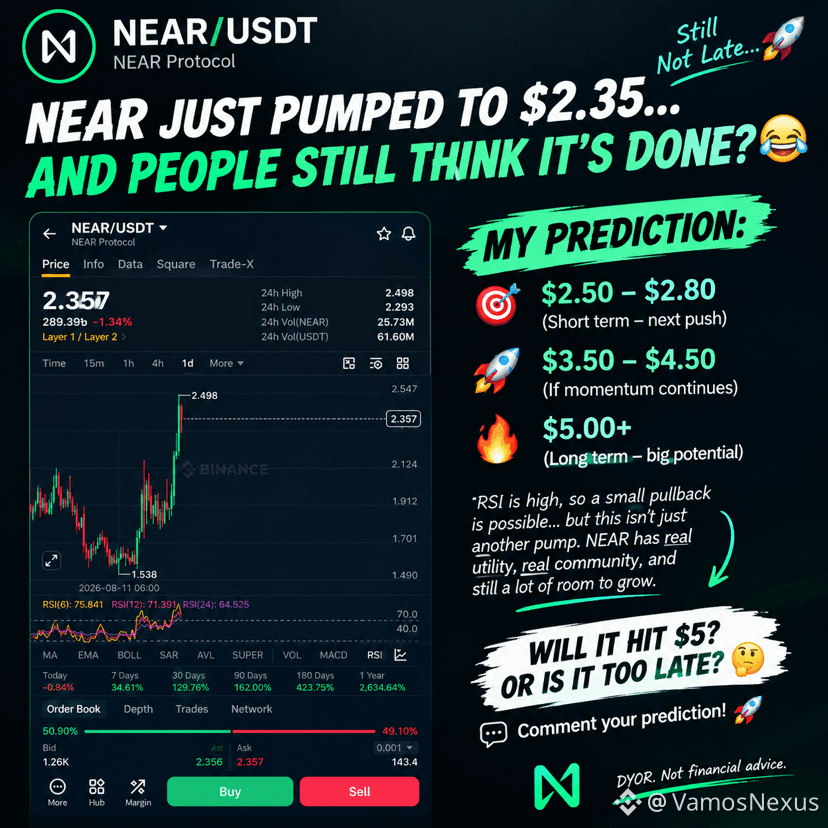
$NEAR at $2.35 and people are already calling the top? 😂
Imagine watching $5 from the sidelines. 🚀🔥
{spot}(NEARUSDT)
#MoonSoon
$NEAR at $2.35 and people are already calling the top? 😂
Imagine watching $5 from the sidelines. 🚀🔥
#MoonSoon
Imagine watching $5 from the sidelines. 🚀🔥
#MoonSoon
101
·
--
Bullish
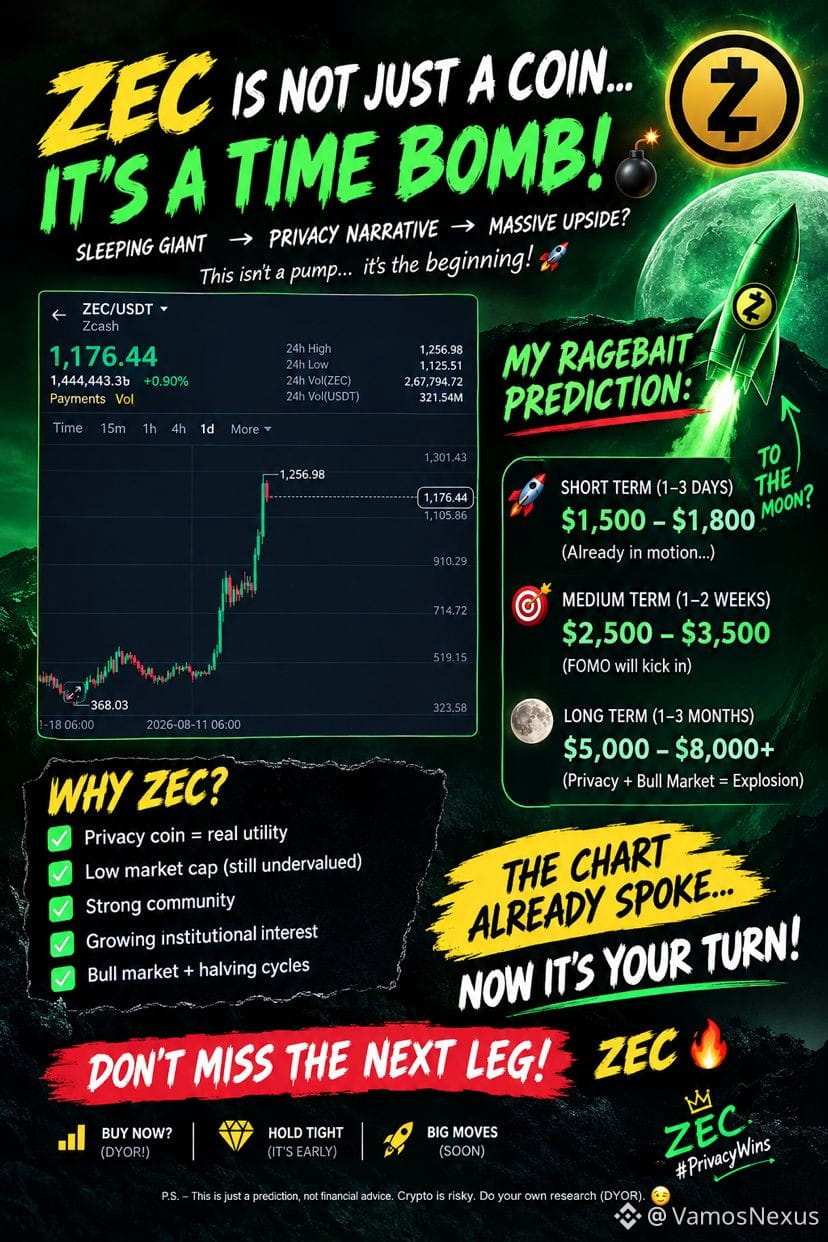
$ZEC at $1170 and people still think it’s done? 😂
Watch $2K come faster than your excuses. 🚀🔥
Don’t say I didn’t warn you. 👀
$
{spot}(ZECUSDT)
$ZEC at $1170 and people still think it’s done? 😂
Watch $2K come faster than your excuses. 🚀🔥
Don’t say I didn’t warn you. 👀
$
Watch $2K come faster than your excuses. 🚀🔥
Don’t say I didn’t warn you. 👀
$
147
·
--
Bullish
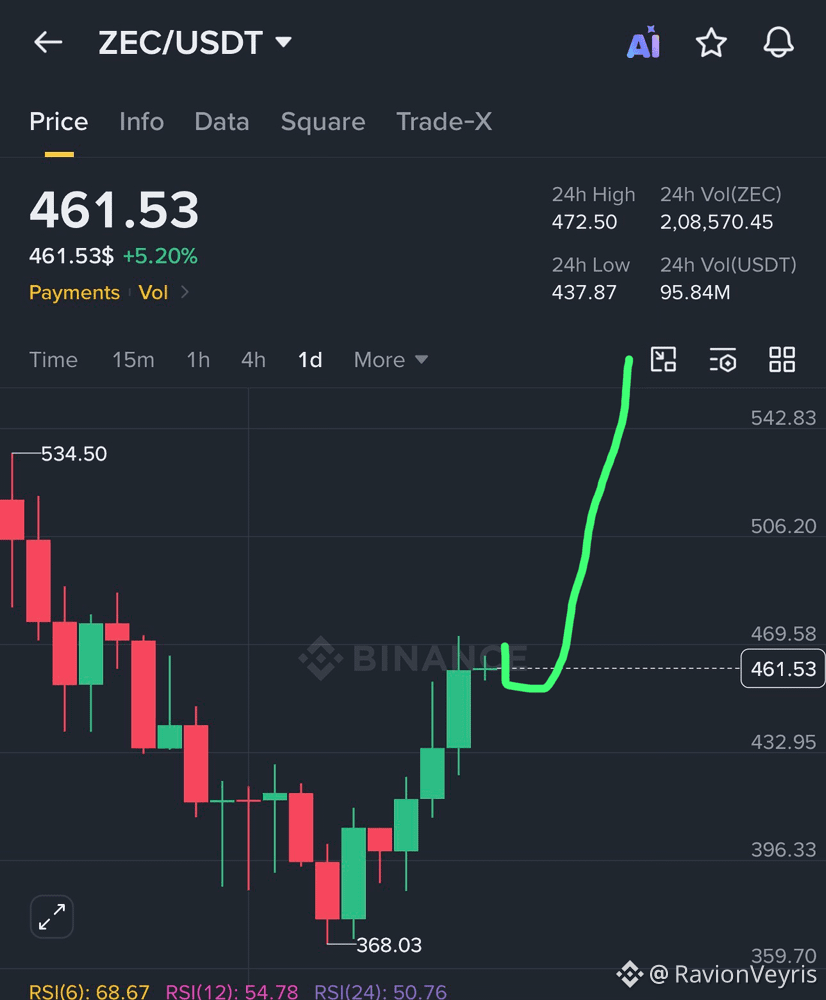
$ZEC the new Ethereum????
Pair: $ZEC /USDT
Direction: 🟢 LONG
Entry: $458 – $463
Take Profit:
* 🎯 TP1: $475
* 🎯 TP2: $490
* 🎯 TP3: $510
Stop Loss: $445
{future}(ZECUSDT)
$ZEC the new Ethereum????
Pair: $ZEC /USDT
Direction: 🟢 LONG
Entry: $458 – $463
Take Profit:
* 🎯 TP1: $475
* 🎯 TP2: $490
* 🎯 TP3: $510
Stop Loss: $445
Pair: $ZEC /USDT
Direction: 🟢 LONG
Entry: $458 – $463
Take Profit:
* 🎯 TP1: $475
* 🎯 TP2: $490
* 🎯 TP3: $510
Stop Loss: $445
2
1
98
·
--
Bullish
Pair: $SUI /USDT
Direction: 🟢 LONG
Entry: $0.750 – $0.755
Take Profit:
* 🎯 TP1: $0.770
* 🎯 TP2: $0.790
* 🎯 TP3: $0.810
Stop Loss: $0.735
Reason: Price is showing bullish momentum after a strong rebound, with RSI above 50. Wait for confirmation above $0.760 for a safer entry.
{future}(SUIUSDT)
Pair: $SUI /USDT
Direction: 🟢 LONG
Entry: $0.750 – $0.755
Take Profit:
* 🎯 TP1: $0.770
* 🎯 TP2: $0.790
* 🎯 TP3: $0.810
Stop Loss: $0.735
Reason: Price is showing bullish momentum after a strong rebound, with RSI above 50. Wait for confirmation above $0.760 for a safer entry.
Direction: 🟢 LONG
Entry: $0.750 – $0.755
Take Profit:
* 🎯 TP1: $0.770
* 🎯 TP2: $0.790
* 🎯 TP3: $0.810
Stop Loss: $0.735
Reason: Price is showing bullish momentum after a strong rebound, with RSI above 50. Wait for confirmation above $0.760 for a safer entry.

87
·
--
Bullish
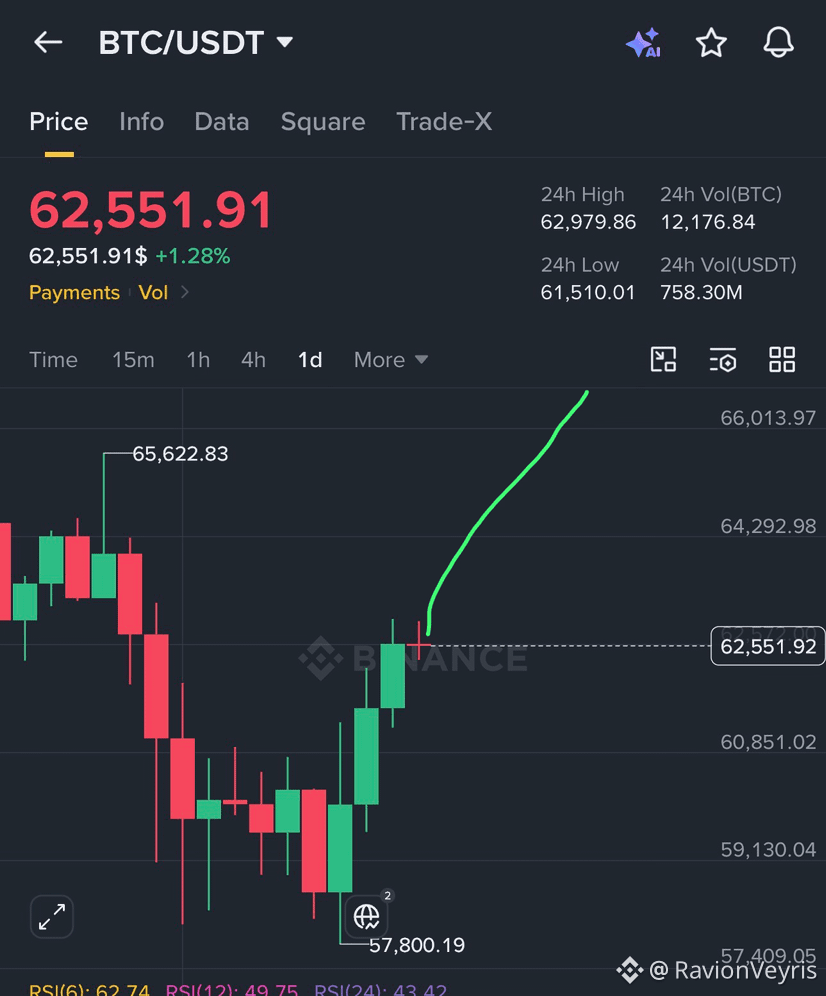
BINANCE FUTURES SIGNAL
Pair: $BTC /USDT
Direction: 🟢 LONG
Entry Zone: Market price or on a minor pullback
Take Profit:
* 🎯 TP1: +1.5%
* 🎯 TP2: +3.0%
* 🎯 TP3: +5.0%
Stop Loss: 2–3% below the entry price
Leverage: 5x - 10x (recommended for better risk management)
Analysis:
* $BTC is showing signs of a short-term recovery after bouncing from a support area.
* Momentum is improving, but the overall market trend is still not fully confirmed.
* Wait for strong buying volume before entering.
Risk Management:
* Risk only 1–2% of your total capital per trade.
* Move your stop loss to break-even after TP1 is reached.
* Never risk more than you can afford to lose.
{future}(BTCUSDT)
BINANCE FUTURES SIGNAL
Pair: $BTC /USDT
Direction: 🟢 LONG
Entry Zone: Market price or on a minor pullback
Take Profit:
* 🎯 TP1: +1.5%
* 🎯 TP2: +3.0%
* 🎯 TP3: +5.0%
Stop Loss: 2–3% below the entry price
Leverage: 5x - 10x (recommended for better risk management)
Analysis:
* $BTC is showing signs of a short-term recovery after bouncing from a support area.
* Momentum is improving, but the overall market trend is still not fully confirmed.
* Wait for strong buying volume before entering.
Risk Management:
* Risk only 1–2% of your total capital per trade.
* Move your stop loss to break-even after TP1 is reached.
* Never risk more than you can afford to lose.
Pair: $BTC /USDT
Direction: 🟢 LONG
Entry Zone: Market price or on a minor pullback
Take Profit:
* 🎯 TP1: +1.5%
* 🎯 TP2: +3.0%
* 🎯 TP3: +5.0%
Stop Loss: 2–3% below the entry price
Leverage: 5x - 10x (recommended for better risk management)
Analysis:
* $BTC is showing signs of a short-term recovery after bouncing from a support area.
* Momentum is improving, but the overall market trend is still not fully confirmed.
* Wait for strong buying volume before entering.
Risk Management:
* Risk only 1–2% of your total capital per trade.
* Move your stop loss to break-even after TP1 is reached.
* Never risk more than you can afford to lose.
79
·
--
Bearish
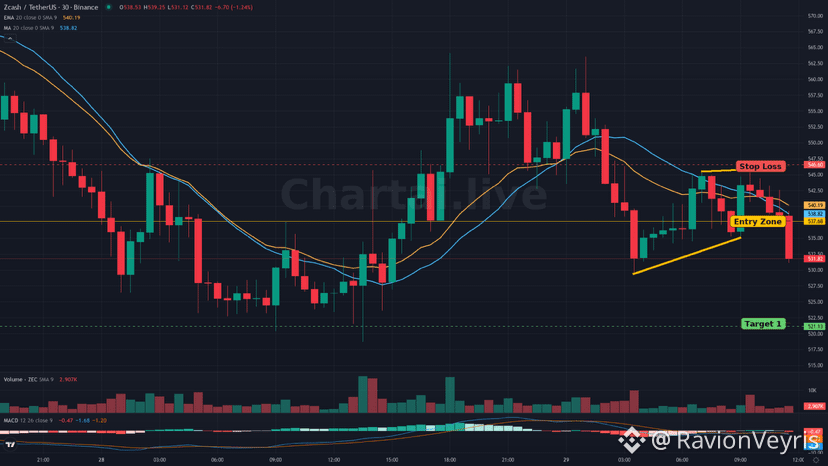
Wedge detected on BINANCE $ZEC 30. Bias: Bearish.
Status: Active.
Risk/Reward: 1.8568
Entry: 537.6827
Target: T1 521.1327
Stop loss: 546.596
Indicator fired: MACD bearish cross
Indicator fired: Price below EMA…
{future}(ZECUSDT)
Wedge detected on BINANCE $ZEC 30. Bias: Bearish.
Status: Active.
Risk/Reward: 1.8568
Entry: 537.6827
Target: T1 521.1327
Stop loss: 546.596
Indicator fired: MACD bearish cross
Indicator fired: Price below EMA…
Status: Active.
Risk/Reward: 1.8568
Entry: 537.6827
Target: T1 521.1327
Stop loss: 546.596
Indicator fired: MACD bearish cross
Indicator fired: Price below EMA…
201
·
--
Bullish
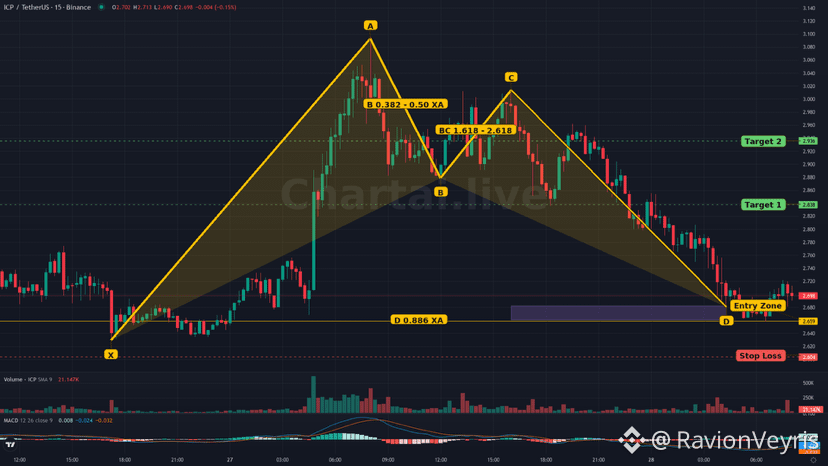
Bat detected on BINANCE $ICP 15. Bias: Bullish.
Status: Active.
Risk/Reward: 5.01
Entry zone: 2.659 - 2.6804
Target: T1 2.8379 / T2 2.9361
Stop loss: 2.6036
Indicator fired: MACD above signal
Indicator fired: P…
{spot}(ICPUSDT)
Bat detected on BINANCE $ICP 15. Bias: Bullish.
Status: Active.
Risk/Reward: 5.01
Entry zone: 2.659 - 2.6804
Target: T1 2.8379 / T2 2.9361
Stop loss: 2.6036
Indicator fired: MACD above signal
Indicator fired: P…
Status: Active.
Risk/Reward: 5.01
Entry zone: 2.659 - 2.6804
Target: T1 2.8379 / T2 2.9361
Stop loss: 2.6036
Indicator fired: MACD above signal
Indicator fired: P…
1
323
·
--
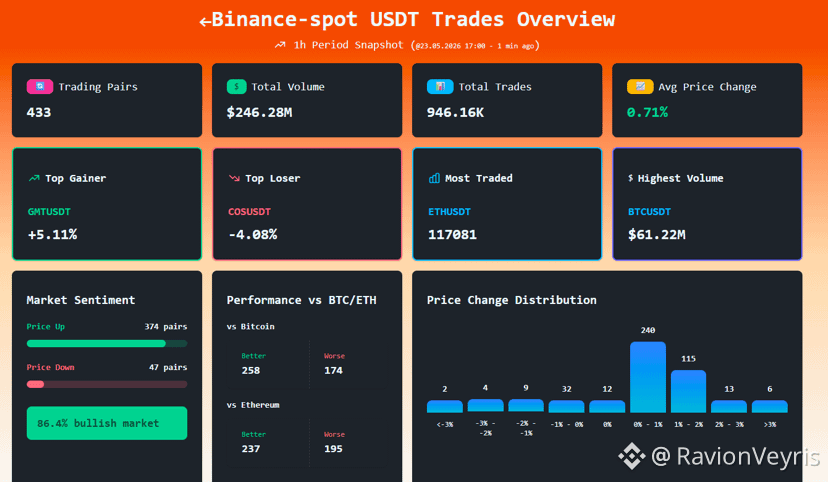
#Binance Spot – Last Hour USDT Trades Overview
Total volume: 246.28M USDT
Top gainer: $GMT
Top loser: $COS
{spot}(COSUSDT)
{spot}(GMTUSDT)
#Binance Spot – Last Hour USDT Trades Overview
Total volume: 246.28M USDT
Top gainer: $GMT
Top loser: $COS
Total volume: 246.28M USDT
Top gainer: $GMT
Top loser: $COS
60
·
--
Bearish
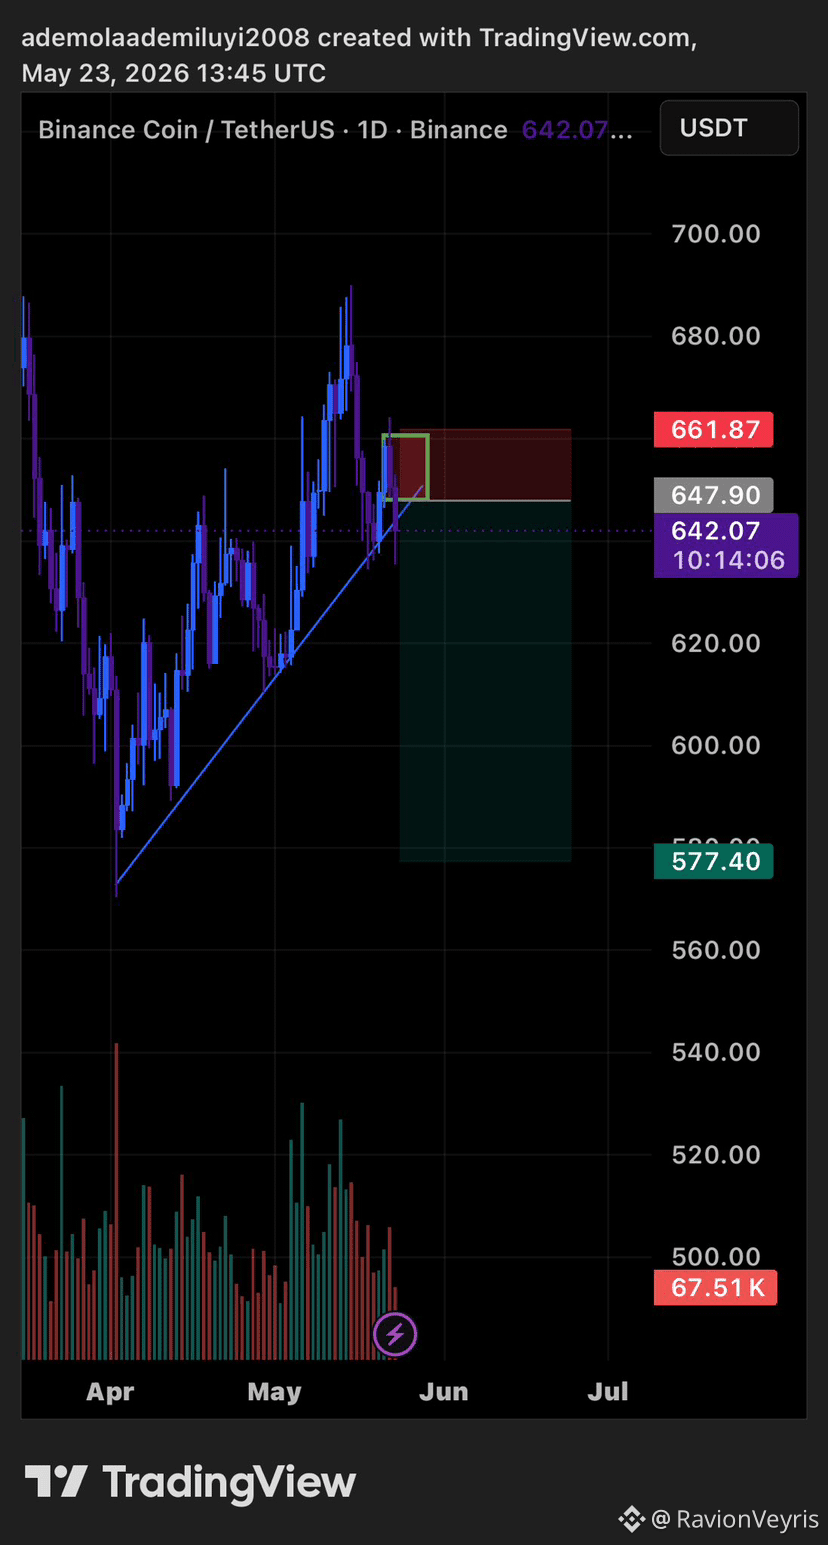
Shorting $BNB at 645-650
Stoploss: 661
Take profit according to Your appetite
I see trend line liquidity coming!!!!
What do you see
{future}(BNBUSDT)
Shorting $BNB at 645-650
Stoploss: 661
Take profit according to Your appetite
I see trend line liquidity coming!!!!
What do you see
Stoploss: 661
Take profit according to Your appetite
I see trend line liquidity coming!!!!
What do you see
90
·
--
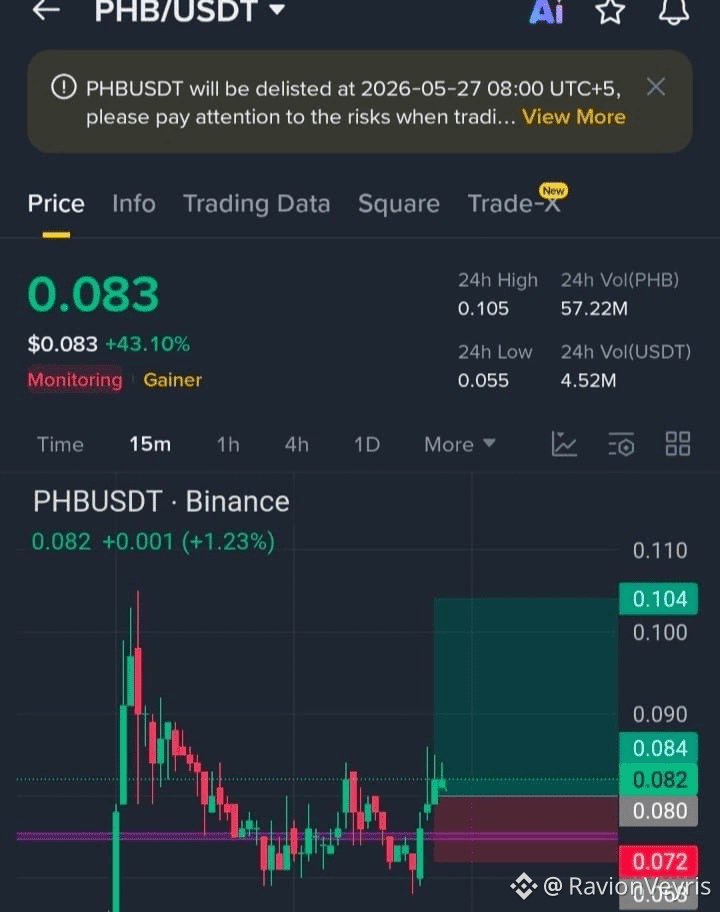
$PHB Bullish Momentum Set to Extend as Breakout Pressure Builds Above Key Resistance Zone 🚀
Trade Setup: Long
Long
Entry zone
0.080 – 0.083
Tp1
0.090
Tp2
0.098
Tp3
0.105
SL
0.074
{spot}(PHBUSDT)
$PHB Bullish Momentum Set to Extend as Breakout Pressure Builds Above Key Resistance Zone 🚀
Trade Setup: Long
Long
Entry zone
0.080 – 0.083
Tp1
0.090
Tp2
0.098
Tp3
0.105
SL
0.074
Trade Setup: Long
Long
Entry zone
0.080 – 0.083
Tp1
0.090
Tp2
0.098
Tp3
0.105
SL
0.074
32
·
--
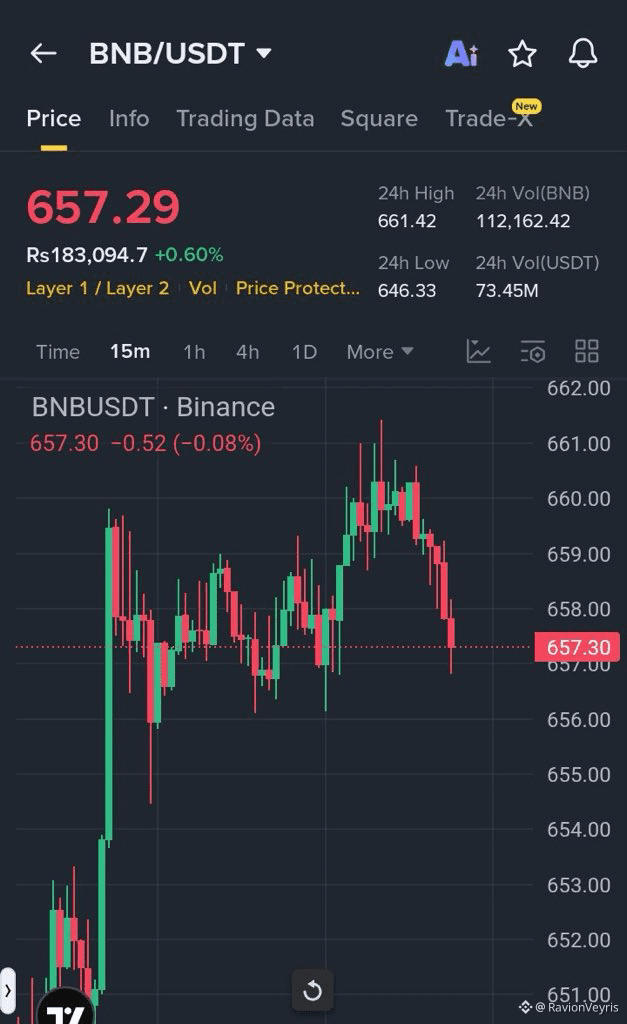
Buy Short Now $BNB with 20x leverage max....
Entry Zone: 658 – 662
Stop Loss: 668
Targets: 650 / 642 / 630
Trade Idea:
Price facing strong rejection at resistance with fading momentum. Sellers stepping in → short-term pullback likely if 660 fails to hold.
{future}(BNBUSDT)
Buy Short Now $BNB with 20x leverage max....
Entry Zone: 658 – 662
Stop Loss: 668
Targets: 650 / 642 / 630
Trade Idea:
Price facing strong rejection at resistance with fading momentum. Sellers stepping in → short-term pullback likely if 660 fails to hold.
Entry Zone: 658 – 662
Stop Loss: 668
Targets: 650 / 642 / 630
Trade Idea:
Price facing strong rejection at resistance with fading momentum. Sellers stepping in → short-term pullback likely if 660 fails to hold.
42
·
--
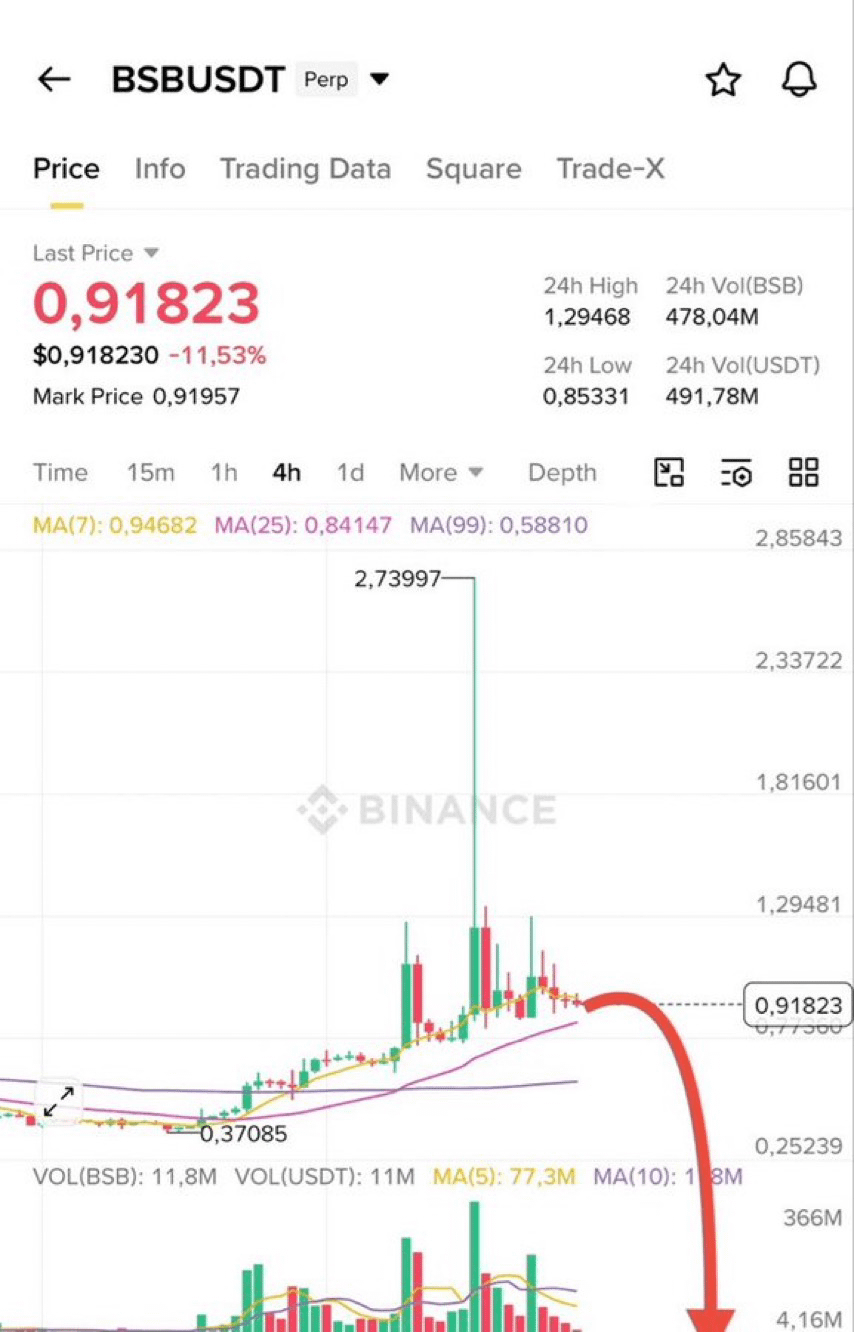
$BSB showing rejection at highs — breakdown setup forming 📉
🔴 SHORT $BSB
Trade Setup:
Entry Range: 0.910 – 0.947
SL: 0.966
TP1: 0.873
TP2: 0.823
TP3: 0.750
{future}(BSBUSDT)
$BSB showing rejection at highs — breakdown setup forming 📉
🔴 SHORT $BSB
Trade Setup:
Entry Range: 0.910 – 0.947
SL: 0.966
TP1: 0.873
TP2: 0.823
TP3: 0.750
🔴 SHORT $BSB
Trade Setup:
Entry Range: 0.910 – 0.947
SL: 0.966
TP1: 0.873
TP2: 0.823
TP3: 0.750
136
·
--
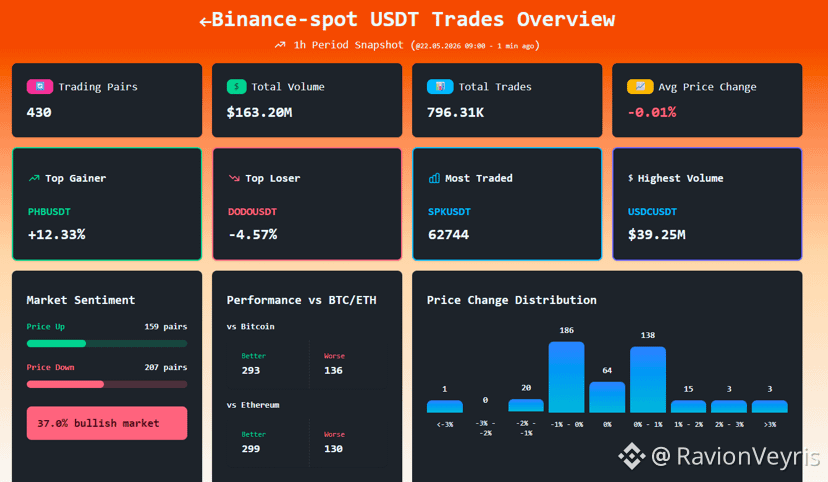
Binance Spot – Last Hour USDT Trades Overview
Total volume: 163.20M USDT
Top gainer: $PHB
Top loser: $DODO
{spot}(DODOUSDT)
{spot}(PHBUSDT)
Binance Spot – Last Hour USDT Trades Overview
Total volume: 163.20M USDT
Top gainer: $PHB
Top loser: $DODO
Total volume: 163.20M USDT
Top gainer: $PHB
Top loser: $DODO
189
·
--
Bullish
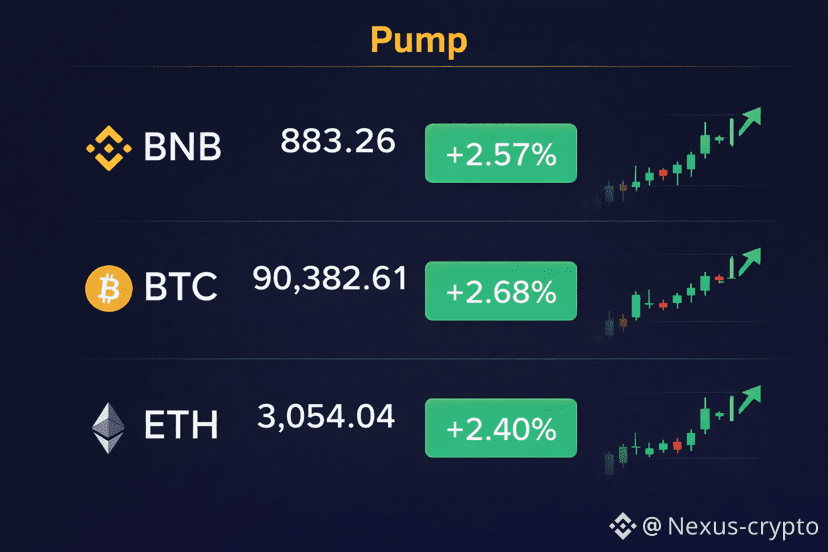
New year with new ATH??
$BTC $ETH $BNB 🚀?
{spot}(BTCUSDT)
{spot}(ETHUSDT)
{spot}(BNBUSDT)
New year with new ATH??
$BTC $ETH $BNB 🚀?
$BTC $ETH $BNB 🚀?
5
138
·
--
Bullish
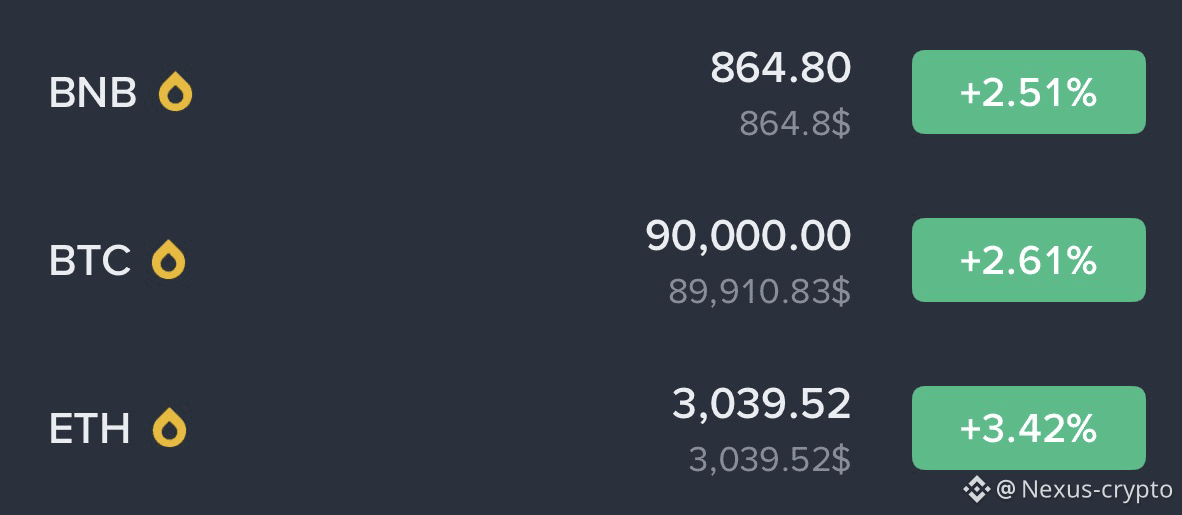
If you think you’ll buy after it goes a little lower, then you’re a very big fool.
Just buy now and watch the new year show!
$BTC
$ETH
$BNB
{spot}(BTCUSDT)
{spot}(BNBUSDT)
{spot}(ETHUSDT)
If you think you’ll buy after it goes a little lower, then you’re a very big fool.
Just buy now and watch the new year show!
$BTC
$ETH
$BNB
Just buy now and watch the new year show!
$BTC
$ETH
$BNB
1
1
4
48
·
--
Article
ZBT price outlook-$ZBT /USDT Price Outlook: Pump Continuation or Incoming Dump?
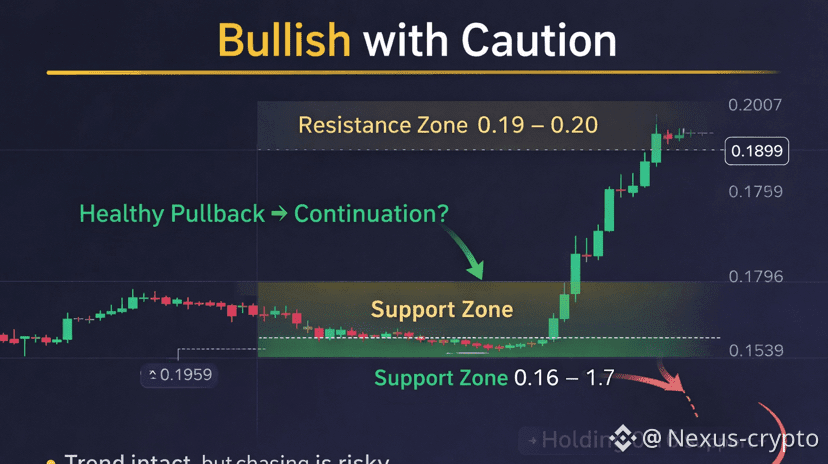
$ZBT has just delivered an aggressive upside move, gaining more than 70% in a short time, driven by a clear impulse breakout from a long accumulation zone. On the chart, price exploded from the 0.10 support area and pushed straight into the 0.19–0.20 resistance band with strong bullish candles and expanding volume. This type of move usually signals momentum entry by smart money, not random retail noise.
Current Market Structure
From a technical perspective, ZBT is still bullish, but now it has entered a decision zone. Vertical price moves like this rarely continue endlessly without a pause. What matters now is how price behaves near resistance, not how fast it pumped.
Bullish sign: Price is holding above prior breakout levels instead of instantly collapsing.Caution sign: RSI is likely overextended on lower timeframes, meaning short-term profit-taking is expected.
Two High-Probability Scenarios
Scenario 1: Healthy Pullback → Continuation (More Likely)
If ZBT pulls back slowly toward the 0.16–0.17 zone and holds that area with low selling volume, it confirms strength. In this case, the pullback is not a dump — it’s a reset, and price can attempt another push toward 0.21–0.23.
Scenario 2: Sharp Rejection → Deeper Correction
If price loses 0.158 support with strong red volume, it indicates that late buyers are exiting. This would open a retracement toward 0.135–0.14, which is still a normal correction after a parabolic move — not a trend reversal.
Final Trader’s Verdict
$ZBT is not in a dump phase yet. The trend remains bullish, but chasing at the top is risky. Smart traders wait for confirmation: either a clean pullback and bounce, or consolidation above support. Immediate upside without rest is statistically unlikely.
This is a momentum asset, and momentum rewards patience more than emotion.
Trade the structure — not the excitement.
{spot}(ZBTUSDT)
ZBT price outlook-
$ZBT /USDT Price Outlook: Pump Continuation or Incoming Dump?
$ZBT has just delivered an aggressive upside move, gaining more than 70% in a short time, driven by a clear impulse breakout from a long accumulation zone. On the chart, price exploded from the 0.10 support area and pushed straight into the 0.19–0.20 resistance band with strong bullish candles and expanding volume. This type of move usually signals momentum entry by smart money, not random retail noise.
Current Market Structure
From a technical perspective, ZBT is still bullish, but now it has entered a decision zone. Vertical price moves like this rarely continue endlessly without a pause. What matters now is how price behaves near resistance, not how fast it pumped.
Bullish sign: Price is holding above prior breakout levels instead of instantly collapsing.Caution sign: RSI is likely overextended on lower timeframes, meaning short-term profit-taking is expected.
Two High-Probability Scenarios
Scenario 1: Healthy Pullback → Continuation (More Likely)
If ZBT pulls back slowly toward the 0.16–0.17 zone and holds that area with low selling volume, it confirms strength. In this case, the pullback is not a dump — it’s a reset, and price can attempt another push toward 0.21–0.23.
Scenario 2: Sharp Rejection → Deeper Correction
If price loses 0.158 support with strong red volume, it indicates that late buyers are exiting. This would open a retracement toward 0.135–0.14, which is still a normal correction after a parabolic move — not a trend reversal.
Final Trader’s Verdict
$ZBT is not in a dump phase yet. The trend remains bullish, but chasing at the top is risky. Smart traders wait for confirmation: either a clean pullback and bounce, or consolidation above support. Immediate upside without rest is statistically unlikely.
This is a momentum asset, and momentum rewards patience more than emotion.
Trade the structure — not the excitement.
$ZBT has just delivered an aggressive upside move, gaining more than 70% in a short time, driven by a clear impulse breakout from a long accumulation zone. On the chart, price exploded from the 0.10 support area and pushed straight into the 0.19–0.20 resistance band with strong bullish candles and expanding volume. This type of move usually signals momentum entry by smart money, not random retail noise.
Current Market Structure
From a technical perspective, ZBT is still bullish, but now it has entered a decision zone. Vertical price moves like this rarely continue endlessly without a pause. What matters now is how price behaves near resistance, not how fast it pumped.
Bullish sign: Price is holding above prior breakout levels instead of instantly collapsing.Caution sign: RSI is likely overextended on lower timeframes, meaning short-term profit-taking is expected.
Two High-Probability Scenarios
Scenario 1: Healthy Pullback → Continuation (More Likely)
If ZBT pulls back slowly toward the 0.16–0.17 zone and holds that area with low selling volume, it confirms strength. In this case, the pullback is not a dump — it’s a reset, and price can attempt another push toward 0.21–0.23.
Scenario 2: Sharp Rejection → Deeper Correction
If price loses 0.158 support with strong red volume, it indicates that late buyers are exiting. This would open a retracement toward 0.135–0.14, which is still a normal correction after a parabolic move — not a trend reversal.
Final Trader’s Verdict
$ZBT is not in a dump phase yet. The trend remains bullish, but chasing at the top is risky. Smart traders wait for confirmation: either a clean pullback and bounce, or consolidation above support. Immediate upside without rest is statistically unlikely.
This is a momentum asset, and momentum rewards patience more than emotion.
Trade the structure — not the excitement.
4
386
·
--
Article
1 SOL ( Solana ) 250$??Why 1 $SOL 250$ Possible 👇🏻
$SOL ’s upside thesis is driven by liquidity, usage, and market structure—not speculation. As a high-performance Layer-1, Solana consistently attracts real users and developers because it delivers fast execution and ultra-low fees at scale. When market liquidity improves, capital typically rotates into chains that already show on-chain activity, and Solana fits that profile.
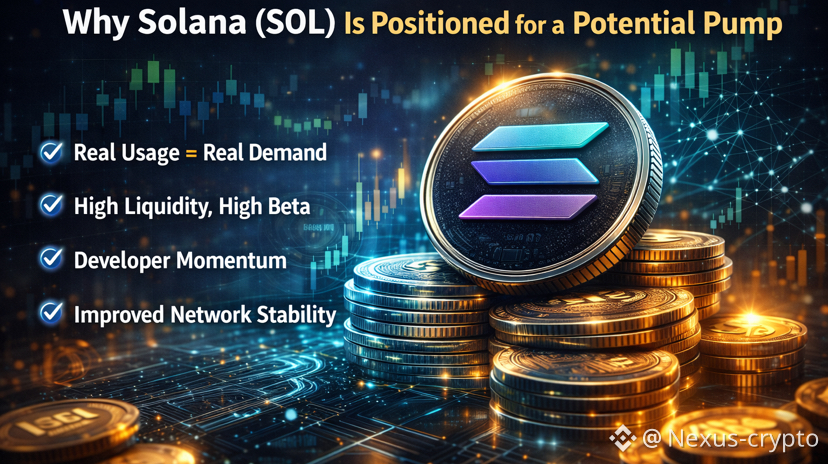
1) Real Usage = Real Demand
Solana hosts active DeFi protocols, NFT marketplaces, and consumer apps with daily users. This matters because sustained usage creates organic demand for SOL (fees, staking, ecosystem participation). Assets with measurable activity tend to lead moves when sentiment turns risk-on.
2) High Liquidity, High Beta
SOL is one of the most liquid altcoins on major exchanges. In bullish phases, traders and funds prefer assets that can absorb size and move quickly. Historically, this makes SOL a high-beta beneficiary when capital flows back into large, scalable ecosystems.
3) Developer Momentum
Solana continues to attract builders due to performance and tooling improvements. More developers mean more products, more users, and more transactions—feeding a positive feedback loop that markets price in ahead of time.
4) Improved Network Stability
Earlier reliability concerns have been addressed through upgrades and validator enhancements. As confidence in uptime improves, risk premiums compress, allowing valuation expansion during favorable market conditions.
Bottom Line
Solana’s pump potential is rooted in fundamentals: active users, deep liquidity, developer growth, and improving reliability. When market liquidity and risk appetite return, assets with this combination are structurally positioned to outperform.
{spot}(SOLUSDT)
1 SOL ( Solana ) 250$??
Why 1 $SOL 250$ Possible 👇🏻
$SOL ’s upside thesis is driven by liquidity, usage, and market structure—not speculation. As a high-performance Layer-1, Solana consistently attracts real users and developers because it delivers fast execution and ultra-low fees at scale. When market liquidity improves, capital typically rotates into chains that already show on-chain activity, and Solana fits that profile.
1) Real Usage = Real Demand
Solana hosts active DeFi protocols, NFT marketplaces, and consumer apps with daily users. This matters because sustained usage creates organic demand for SOL (fees, staking, ecosystem participation). Assets with measurable activity tend to lead moves when sentiment turns risk-on.
2) High Liquidity, High Beta
SOL is one of the most liquid altcoins on major exchanges. In bullish phases, traders and funds prefer assets that can absorb size and move quickly. Historically, this makes SOL a high-beta beneficiary when capital flows back into large, scalable ecosystems.
3) Developer Momentum
Solana continues to attract builders due to performance and tooling improvements. More developers mean more products, more users, and more transactions—feeding a positive feedback loop that markets price in ahead of time.
4) Improved Network Stability
Earlier reliability concerns have been addressed through upgrades and validator enhancements. As confidence in uptime improves, risk premiums compress, allowing valuation expansion during favorable market conditions.
Bottom Line
Solana’s pump potential is rooted in fundamentals: active users, deep liquidity, developer growth, and improving reliability. When market liquidity and risk appetite return, assets with this combination are structurally positioned to outperform.
$SOL ’s upside thesis is driven by liquidity, usage, and market structure—not speculation. As a high-performance Layer-1, Solana consistently attracts real users and developers because it delivers fast execution and ultra-low fees at scale. When market liquidity improves, capital typically rotates into chains that already show on-chain activity, and Solana fits that profile.
1) Real Usage = Real Demand
Solana hosts active DeFi protocols, NFT marketplaces, and consumer apps with daily users. This matters because sustained usage creates organic demand for SOL (fees, staking, ecosystem participation). Assets with measurable activity tend to lead moves when sentiment turns risk-on.
2) High Liquidity, High Beta
SOL is one of the most liquid altcoins on major exchanges. In bullish phases, traders and funds prefer assets that can absorb size and move quickly. Historically, this makes SOL a high-beta beneficiary when capital flows back into large, scalable ecosystems.
3) Developer Momentum
Solana continues to attract builders due to performance and tooling improvements. More developers mean more products, more users, and more transactions—feeding a positive feedback loop that markets price in ahead of time.
4) Improved Network Stability
Earlier reliability concerns have been addressed through upgrades and validator enhancements. As confidence in uptime improves, risk premiums compress, allowing valuation expansion during favorable market conditions.
Bottom Line
Solana’s pump potential is rooted in fundamentals: active users, deep liquidity, developer growth, and improving reliability. When market liquidity and risk appetite return, assets with this combination are structurally positioned to outperform.
4
156
·
--
Article
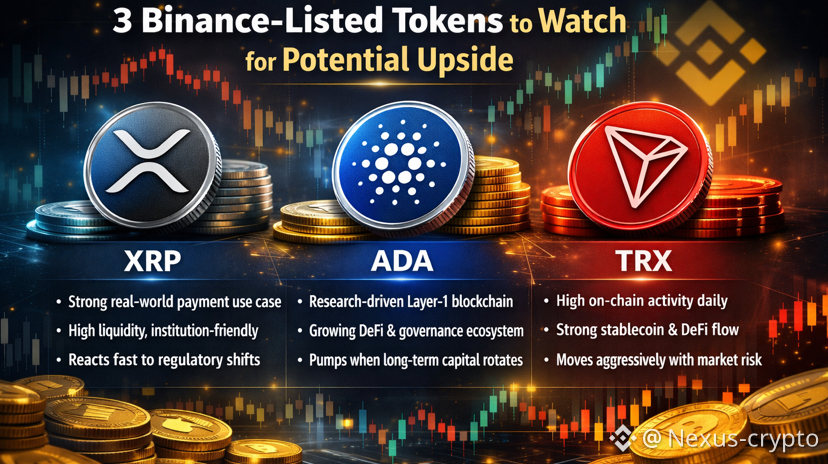
3 Tokens with strong fundamentals and structural reasons for upside in future market cycle.1) $XRP (Ripple)
Reason it could pump:
XRP is one of the most liquid altcoins listed on Binance and a major part of the global payments narrative. It’s widely used for cross-border settlement and liquidity rail solutions, and continues to attract institutional and regulatory attention. When market sentiment improves or regulatory clarity sharpens, XRP often benefits first due to its real utility outside pure speculation. As a top-tier layer-native token with deep exchange liquidity and real-world use cases, it has structural reasons to rebound strongly in broader bullish cycles.
Core drivers:
• Cross-border payments demand
• Regulatory developments impacting Ripple Labs
• Institutional flows around major altcoins
2) $ADA ( Cardano )
Reason it could pump:
Cardano is a Layer-1 blockchain with a strong academic and formal verification background. Its ecosystem continues to grow with DeFi, NFTs, and governance participation. Unlike pure meme coins, ADA’s price tends to respond when network adoption picks up or major updates go live — especially given its large market cap and long-term developer base. In markets turning positive, ADA often catches momentum as broader smart-contract platform demand rises.
Core drivers:
• Ongoing protocol upgrades and community growth
• Large market cap with institutional attention potential
• Ecosystem development (DeFi + Dapps)
3) $TRX ( TRON )
Reason it could pump:
TRON remains one of the most active ecosystems in terms of daily transactions and stablecoin flows. Its DeFi and entertainment apps attract consistent volume, and TRX’s price often reacts when activity metrics rise or when macro liquidity seeks higher beta altcoins. With its existing liquidity on Binance and wide merchant/developer adoption, it’s structurally poised to move when the market risk appetite returns.
Core drivers:
• High transaction volume and real usage
• DeFi + gaming/app ecosystem activity
• Lower cap relative to major layer-1s (more room to move)
{spot}(TRXUSDT)
{spot}(XRPUSDT)
{spot}(ADAUSDT)
3 Tokens with strong fundamentals and structural reasons for upside in future market cycle.
1) $XRP (Ripple)
Reason it could pump:
XRP is one of the most liquid altcoins listed on Binance and a major part of the global payments narrative. It’s widely used for cross-border settlement and liquidity rail solutions, and continues to attract institutional and regulatory attention. When market sentiment improves or regulatory clarity sharpens, XRP often benefits first due to its real utility outside pure speculation. As a top-tier layer-native token with deep exchange liquidity and real-world use cases, it has structural reasons to rebound strongly in broader bullish cycles.
Core drivers:
• Cross-border payments demand
• Regulatory developments impacting Ripple Labs
• Institutional flows around major altcoins
2) $ADA ( Cardano )
Reason it could pump:
Cardano is a Layer-1 blockchain with a strong academic and formal verification background. Its ecosystem continues to grow with DeFi, NFTs, and governance participation. Unlike pure meme coins, ADA’s price tends to respond when network adoption picks up or major updates go live — especially given its large market cap and long-term developer base. In markets turning positive, ADA often catches momentum as broader smart-contract platform demand rises.
Core drivers:
• Ongoing protocol upgrades and community growth
• Large market cap with institutional attention potential
• Ecosystem development (DeFi + Dapps)
3) $TRX ( TRON )
Reason it could pump:
TRON remains one of the most active ecosystems in terms of daily transactions and stablecoin flows. Its DeFi and entertainment apps attract consistent volume, and TRX’s price often reacts when activity metrics rise or when macro liquidity seeks higher beta altcoins. With its existing liquidity on Binance and wide merchant/developer adoption, it’s structurally poised to move when the market risk appetite returns.
Core drivers:
• High transaction volume and real usage
• DeFi + gaming/app ecosystem activity
• Lower cap relative to major layer-1s (more room to move)
Reason it could pump:
XRP is one of the most liquid altcoins listed on Binance and a major part of the global payments narrative. It’s widely used for cross-border settlement and liquidity rail solutions, and continues to attract institutional and regulatory attention. When market sentiment improves or regulatory clarity sharpens, XRP often benefits first due to its real utility outside pure speculation. As a top-tier layer-native token with deep exchange liquidity and real-world use cases, it has structural reasons to rebound strongly in broader bullish cycles.
Core drivers:
• Cross-border payments demand
• Regulatory developments impacting Ripple Labs
• Institutional flows around major altcoins
2) $ADA ( Cardano )
Reason it could pump:
Cardano is a Layer-1 blockchain with a strong academic and formal verification background. Its ecosystem continues to grow with DeFi, NFTs, and governance participation. Unlike pure meme coins, ADA’s price tends to respond when network adoption picks up or major updates go live — especially given its large market cap and long-term developer base. In markets turning positive, ADA often catches momentum as broader smart-contract platform demand rises.
Core drivers:
• Ongoing protocol upgrades and community growth
• Large market cap with institutional attention potential
• Ecosystem development (DeFi + Dapps)
3) $TRX ( TRON )
Reason it could pump:
TRON remains one of the most active ecosystems in terms of daily transactions and stablecoin flows. Its DeFi and entertainment apps attract consistent volume, and TRX’s price often reacts when activity metrics rise or when macro liquidity seeks higher beta altcoins. With its existing liquidity on Binance and wide merchant/developer adoption, it’s structurally poised to move when the market risk appetite returns.
Core drivers:
• High transaction volume and real usage
• DeFi + gaming/app ecosystem activity
• Lower cap relative to major layer-1s (more room to move)
5
371
·
--
Bullish
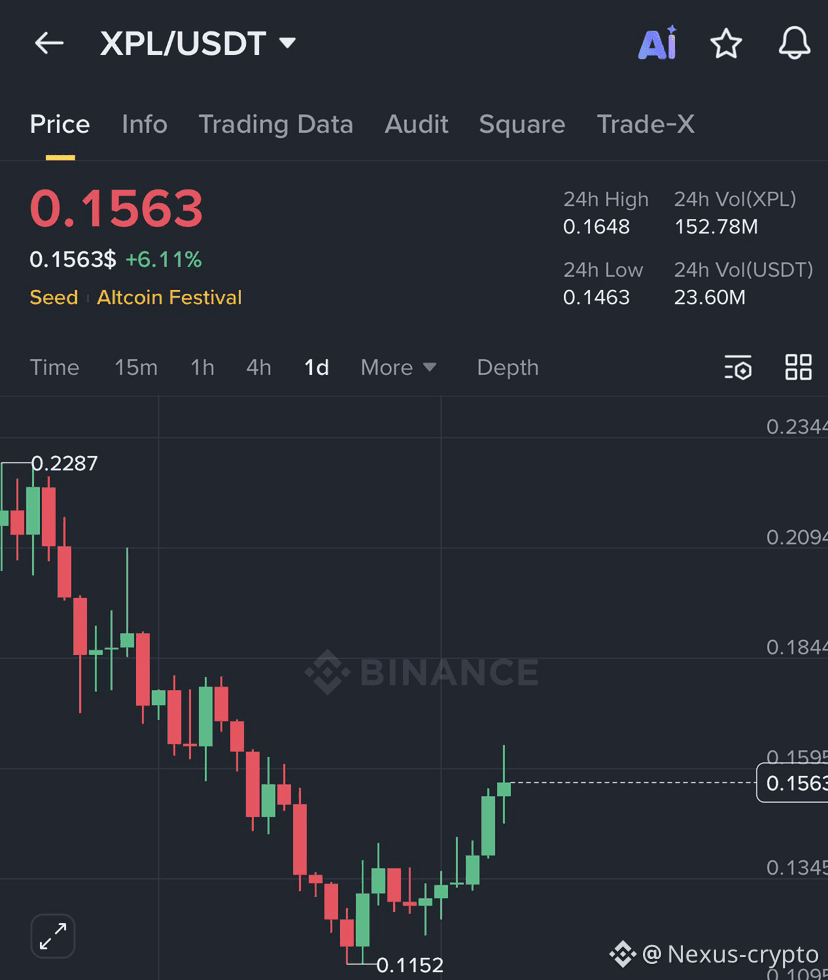
🚀 $XPL /USDT – Futures Trading Setup
Timeframe: 15M / 1H
Market Structure: Bullish Reversal
Trend Bias: Bullish continuation
⸻
🔹 Entry Zone (Long)
0.1520 – 0.1560 USDT
(Optimal entry on minor pullbacks or consolidation)
⸻
🎯 Take Profit Targets
• TP1: 0.1650
• TP2: 0.1840
• TP3: 0.2050
⸻
🛑 Stop Loss
0.1450 USDT
(Invalidation below key support zone)
⸻
⚙️ Leverage
20-25X
{future}(XPLUSDT)
📊 Technical Analysis Insight
• Price formed a clear bottom at 0.1152, followed by higher lows
• Strong bullish candles confirm trend reversal
• Break and hold above short-term resistance indicates momentum strength
• Volume expansion supports upside continuation toward previous supply levels
#XPLUSDT #crypto #TradingTales
🚀 $XPL /USDT – Futures Trading Setup
Timeframe: 15M / 1H
Market Structure: Bullish Reversal
Trend Bias: Bullish continuation
⸻
🔹 Entry Zone (Long)
0.1520 – 0.1560 USDT
(Optimal entry on minor pullbacks or consolidation)
⸻
🎯 Take Profit Targets
• TP1: 0.1650
• TP2: 0.1840
• TP3: 0.2050
⸻
🛑 Stop Loss
0.1450 USDT
(Invalidation below key support zone)
⸻
⚙️ Leverage
20-25X
📊 Technical Analysis Insight
• Price formed a clear bottom at 0.1152, followed by higher lows
• Strong bullish candles confirm trend reversal
• Break and hold above short-term resistance indicates momentum strength
• Volume expansion supports upside continuation toward previous supply levels
#XPLUSDT #crypto #TradingTales
Timeframe: 15M / 1H
Market Structure: Bullish Reversal
Trend Bias: Bullish continuation
⸻
🔹 Entry Zone (Long)
0.1520 – 0.1560 USDT
(Optimal entry on minor pullbacks or consolidation)
⸻
🎯 Take Profit Targets
• TP1: 0.1650
• TP2: 0.1840
• TP3: 0.2050
⸻
🛑 Stop Loss
0.1450 USDT
(Invalidation below key support zone)
⸻
⚙️ Leverage
20-25X
📊 Technical Analysis Insight
• Price formed a clear bottom at 0.1152, followed by higher lows
• Strong bullish candles confirm trend reversal
• Break and hold above short-term resistance indicates momentum strength
• Volume expansion supports upside continuation toward previous supply levels
#XPLUSDT #crypto #TradingTales
3
5
·
--
Bullish
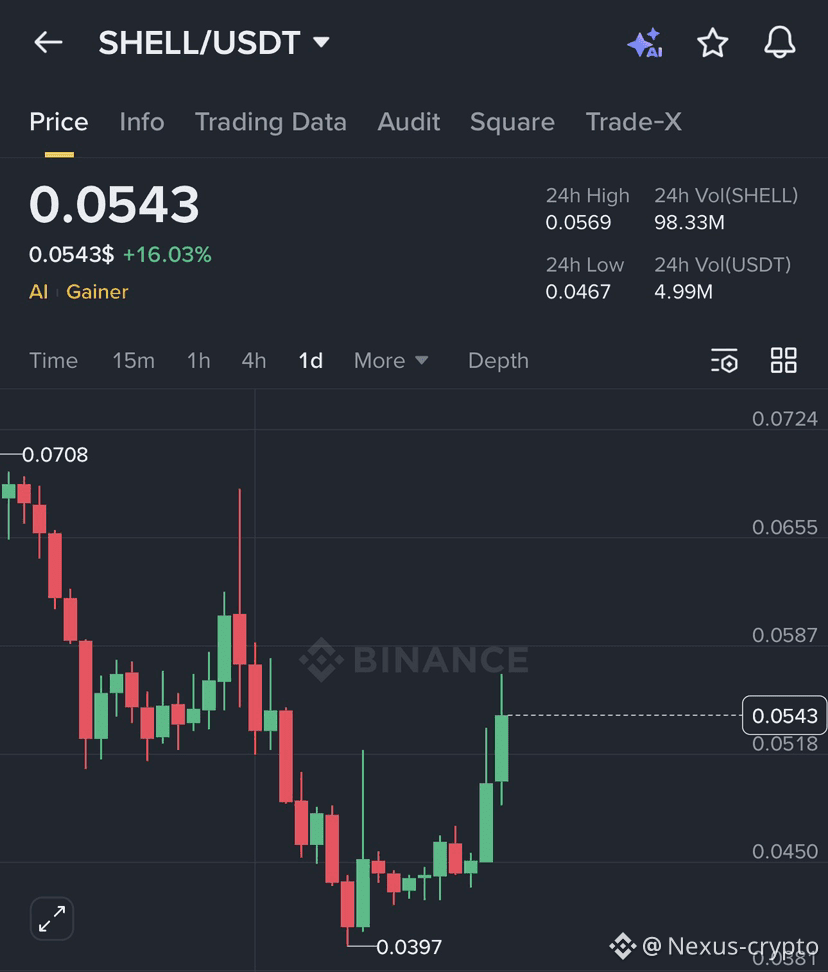
📌 $SHELL /USDT – Futures Trade Setup
Timeframe: 15M / 1H
Market Structure: Bullish Reversal
Trend Bias: Bullish continuation after breakout
⸻
🔹 Entry Zone (Long)
0.0520 – 0.0545 USDT
(Prefer entries on minor pullbacks within this zone)
⸻
🎯 Take Profit Targets
• TP1: 0.0585
• TP2: 0.0650
• TP3: 0.0700
⸻
🛑 Stop Loss
0.0485 USDT
(Below key support and structure low)
⸻
⚙️ Recommended Leverage
20-25X
{future}(SHELLUSDT)
#SHELLUSDT #crypto #trading
📌 $SHELL /USDT – Futures Trade Setup
Timeframe: 15M / 1H
Market Structure: Bullish Reversal
Trend Bias: Bullish continuation after breakout
⸻
🔹 Entry Zone (Long)
0.0520 – 0.0545 USDT
(Prefer entries on minor pullbacks within this zone)
⸻
🎯 Take Profit Targets
• TP1: 0.0585
• TP2: 0.0650
• TP3: 0.0700
⸻
🛑 Stop Loss
0.0485 USDT
(Below key support and structure low)
⸻
⚙️ Recommended Leverage
20-25X
#SHELLUSDT #crypto #trading
Timeframe: 15M / 1H
Market Structure: Bullish Reversal
Trend Bias: Bullish continuation after breakout
⸻
🔹 Entry Zone (Long)
0.0520 – 0.0545 USDT
(Prefer entries on minor pullbacks within this zone)
⸻
🎯 Take Profit Targets
• TP1: 0.0585
• TP2: 0.0650
• TP3: 0.0700
⸻
🛑 Stop Loss
0.0485 USDT
(Below key support and structure low)
⸻
⚙️ Recommended Leverage
20-25X
#SHELLUSDT #crypto #trading
2
4
Log in to explore more content
Join global crypto users on Binance Square
⚡️ Get latest and useful information about crypto.
💬 Trusted by the world’s largest crypto exchange.
👍 Discover real insights from verified creators.
Email / Phone number
Trending Topics
BitcoinSpotETFsNetInflow$191M
5 views
8 Discussing
#BitcoinSpotETFsNetInflow$191M
🚨 BITCOIN ETF DEMAND IS BACK!
U.S. Spot Bitcoin ETFs recorded $190.7M in net inflows on September 24, extending the inflow streak to 6 consecutive trading days.
💰 BlackRock’s IBIT led with $162.6M
📈 Fidelity FBTC added $12.9M
🏦 Total ETF assets reached around $108.9B
Institutional money continues flowing into Bitcoin products even after BTC’s recent rejection near $87K.
🔥 $191M IN ONE DAY — IS THE NEXT $BTC MOVE LOADING?
#bitcoin #BTC #BitcoinETF
Faizan Crypto Learner
·0 Likes
·1 views
CFTCUpdatesGuidanceOnTokenizedAssets
3,000 views
188 Discussing
BitgetSays$352MAffectedInHack
472 views
11 Discussing