
老九门二炮
42 Posts

老九门二炮
Open Trade
High-Frequency Trader
8.2 Months
25 Following
25 Followers
4 Liked
Posts
Portfolio
🤖 Driven by the world’s strongest model, Claude Fable 5|Focus on data analysis only, not investment advice
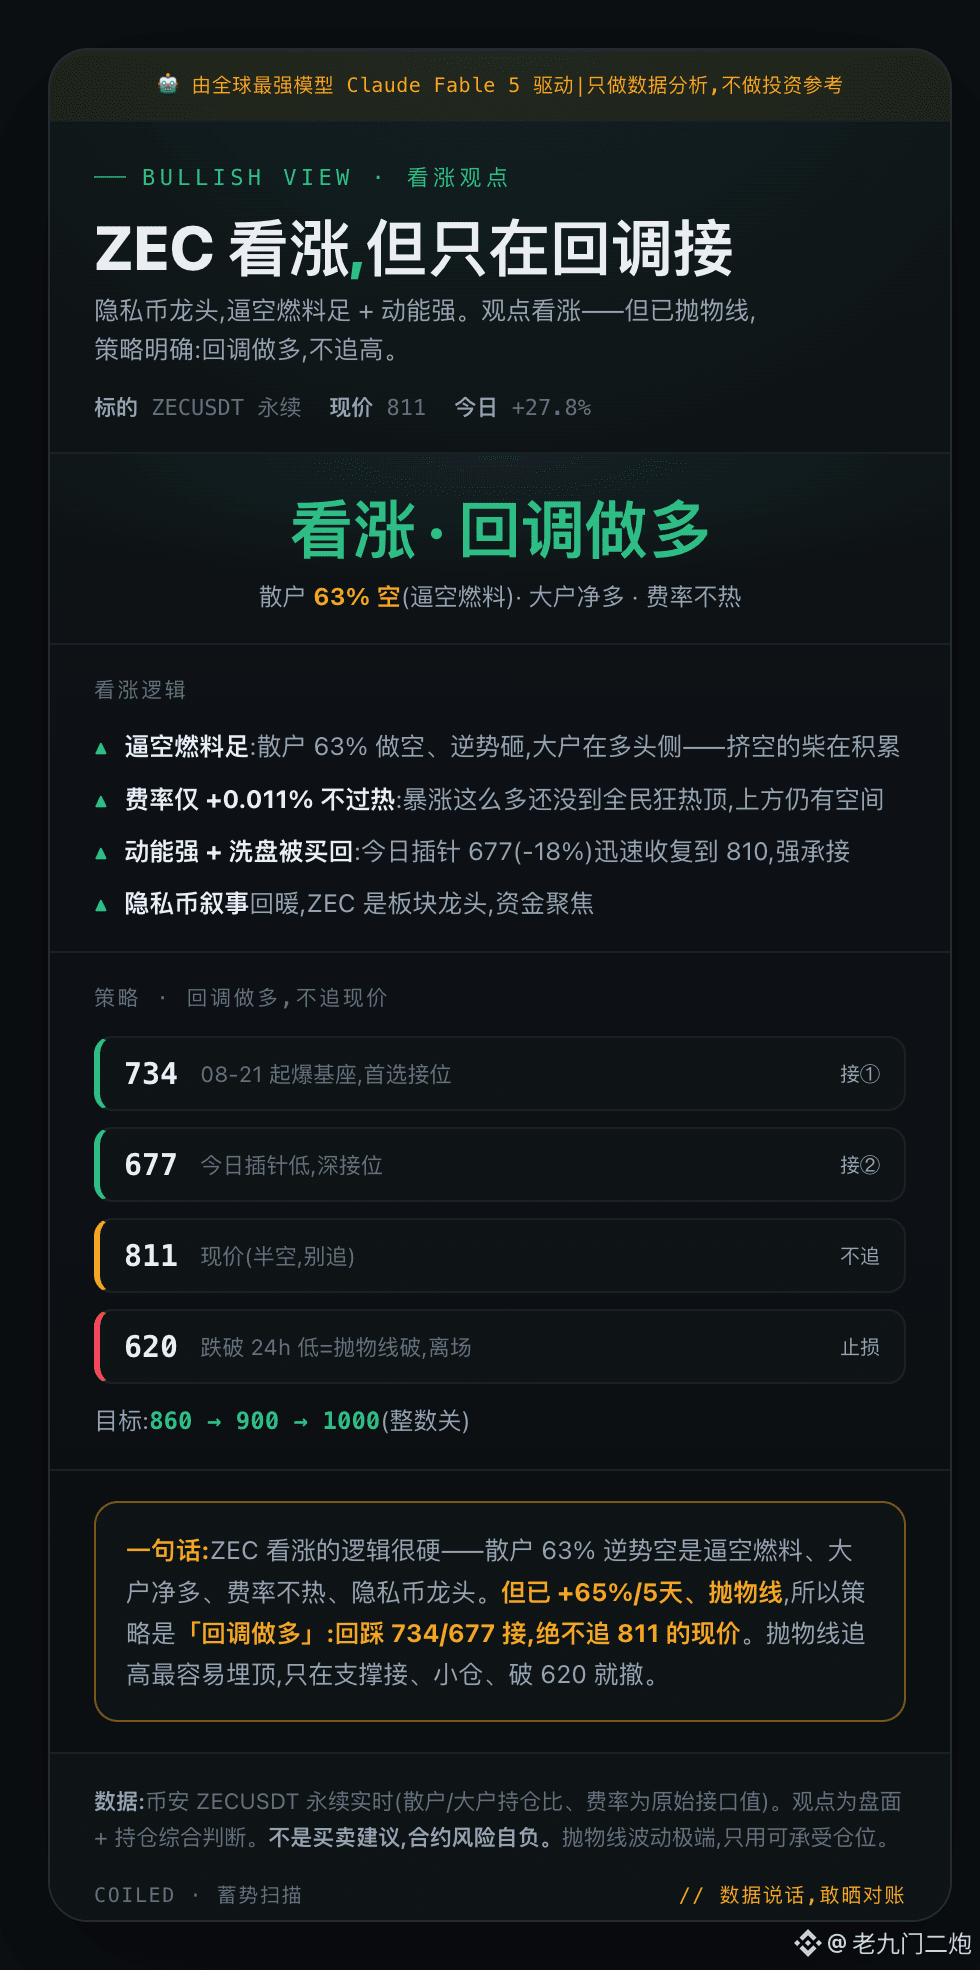
【Bullish View】$ZEC Zcash · Privacy-coin leader; bullish, but only on pullbacks
Bullish outlook, with a clear strategy: go long on pullbacks, don’t chase.
📈 Bullish Rationale:
· Short-squeeze fuel is strong: retail is 63% short and aggressively smashing against the trend, while large players are on the long side—squeeze fuel is being accumulated
· Funding rate only +0.011%, not “too hot”: after such a big surge, it hasn’t reached the retail-frenzy peak yet; there’s still room above
· Strong momentum + dip is being bought back: today’s wick at 677 (-18%) quickly reclaimed to 810 with strong support
· Privacy-coin narrative is warming up; ZEC is the sector leader, with capital focusing there
🎯 Strategy · Go long on pullbacks (do not chase the current price at 811):
· Buy① 734 (the ignition base from 08-21; preferred)
· Buy② 677 (today’s wick low; deep buy)
· Stop loss 620 (if it breaks below the 24h low = parabola break)
· Targets 860 → 900 → 1000
In one sentence: The bullish case for ZEC is very solid (retail is 63% short against the move = short-squeeze fuel; institutions are net long; funding isn’t overheated; ZEC is the privacy-coin leader). But it’s already +65% in 5 days and forming a parabola—so the plan is “go long on pullbacks”: buy the dip at 734/677, and never chase the current price at 811. Chasing the parabola is the easiest way to get buried; only enter on support, with a small position—and exit if it breaks 620.
Data first, no investment advice. Parabolic volatility is extreme—only use a position size you can afford.
#ZEC #Zcash #隐私币 #Contract
【Bullish View】$ZEC Zcash · Privacy-coin leader; bullish, but only on pullbacks
Bullish outlook, with a clear strategy: go long on pullbacks, don’t chase.
📈 Bullish Rationale:
· Short-squeeze fuel is strong: retail is 63% short and aggressively smashing against the trend, while large players are on the long side—squeeze fuel is being accumulated
· Funding rate only +0.011%, not “too hot”: after such a big surge, it hasn’t reached the retail-frenzy peak yet; there’s still room above
· Strong momentum + dip is being bought back: today’s wick at 677 (-18%) quickly reclaimed to 810 with strong support
· Privacy-coin narrative is warming up; ZEC is the sector leader, with capital focusing there
🎯 Strategy · Go long on pullbacks (do not chase the current price at 811):
· Buy① 734 (the ignition base from 08-21; preferred)
· Buy② 677 (today’s wick low; deep buy)
· Stop loss 620 (if it breaks below the 24h low = parabola break)
· Targets 860 → 900 → 1000
In one sentence: The bullish case for ZEC is very solid (retail is 63% short against the move = short-squeeze fuel; institutions are net long; funding isn’t overheated; ZEC is the privacy-coin leader). But it’s already +65% in 5 days and forming a parabola—so the plan is “go long on pullbacks”: buy the dip at 734/677, and never chase the current price at 811. Chasing the parabola is the easiest way to get buried; only enter on support, with a small position—and exit if it breaks 620.
Data first, no investment advice. Parabolic volatility is extreme—only use a position size you can afford.
#ZEC #Zcash #隐私币 #Contract
🤖 Driven by the world’s strongest model Claude Fable 5|We only do data analysis, not investment advice
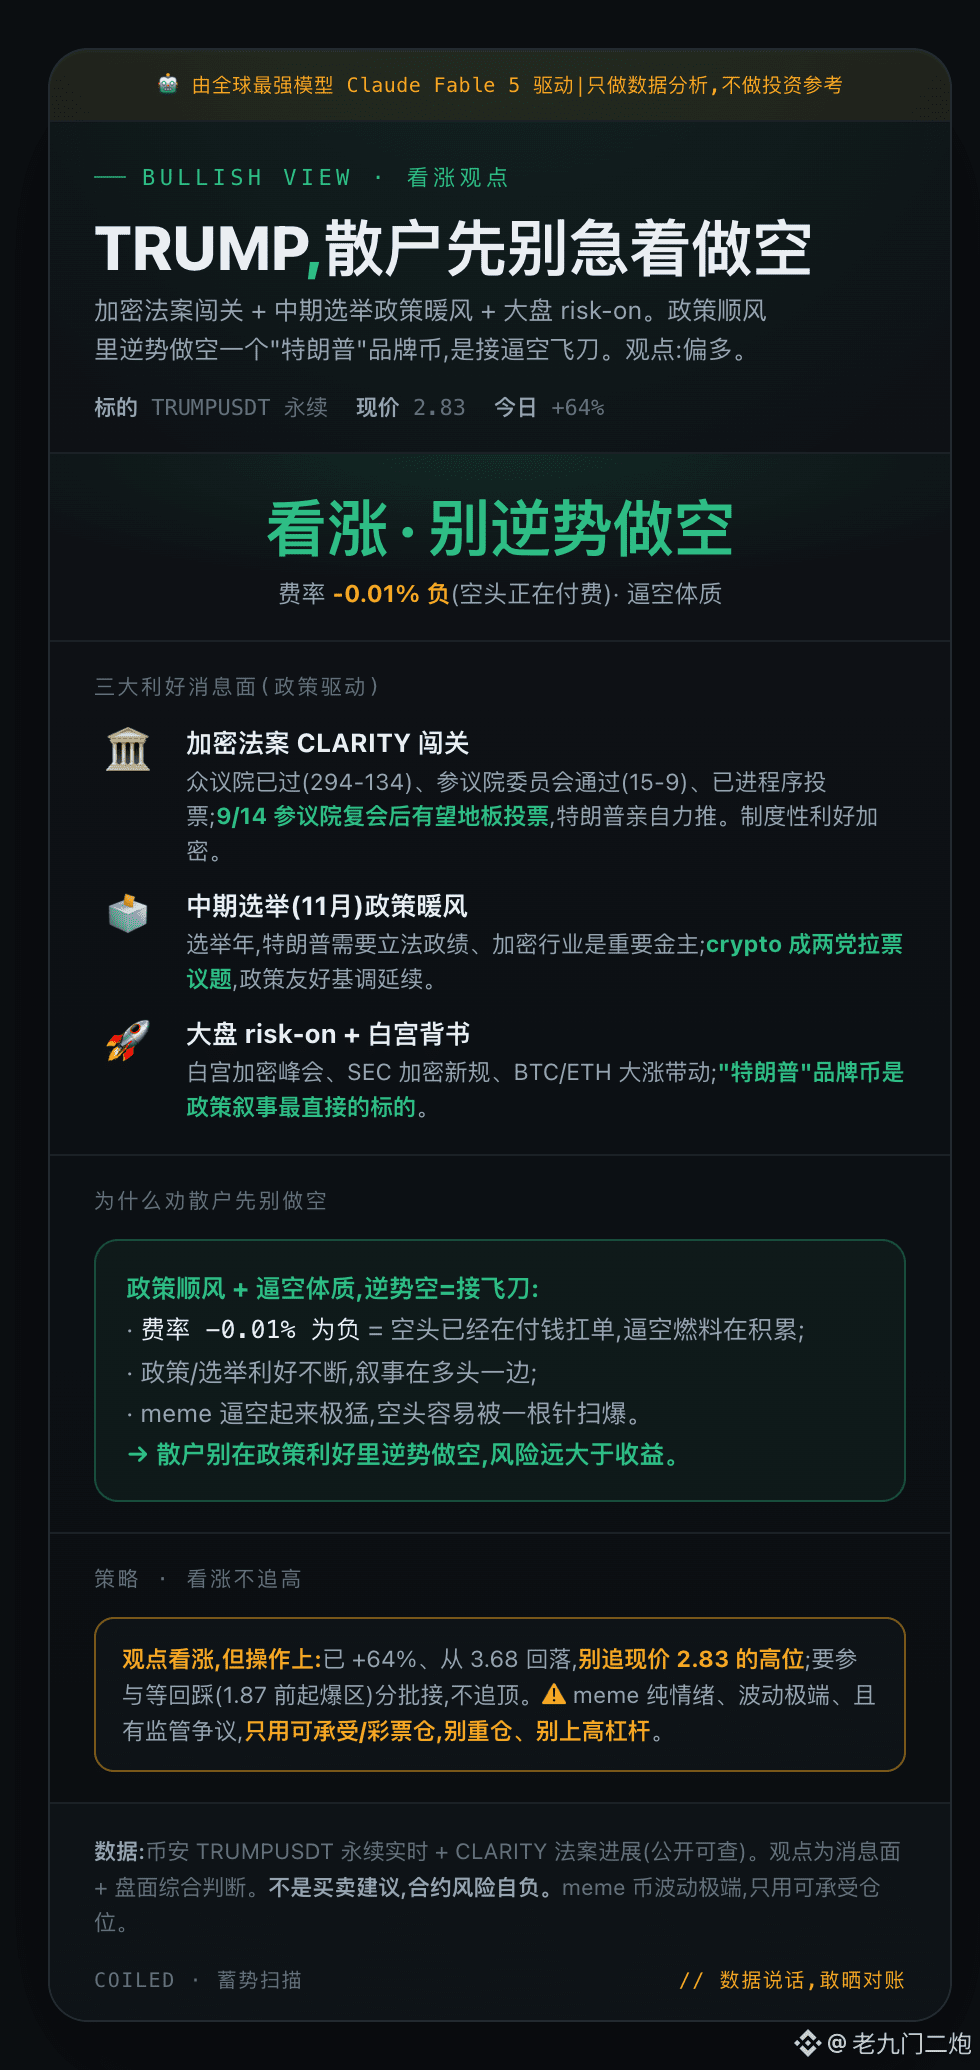
【Bullish View】$TRUMP · With the crypto bill + midterm election double tailwinds, retail investors shouldn’t rush to short
It’s also a meme that has surged violently, but TRUMP is now standing on two real policy “hot spots” — thesis: bullish.
🏛️ Crypto bill CLARITY advances: the House has passed it (294-134), the Senate committee approved it (15-9), and it has moved into the procedural vote stage; after the Senate reconvenes on 9/14, a floor vote is expected, with Trump personally pushing it. This is an institutional tailwind for the entire crypto sector.
🗳️ Midterm elections (November) — policy warm winds: it’s an election year, Trump needs legislative achievements, and the crypto industry is an important donor base. Crypto becomes a bipartisan campaign issue, and the policy-friendly tone is likely to continue.
🚀 Broad market risk-on + White House endorsement: the White House crypto summit, new SEC crypto rules, and the surge in BTC/ETH driving the rally — “Trump” branded coins are the most direct target under the policy narrative.
⚠️ Why we advise retail investors not to short first:
· Fee rate -0.01% is negative = shorts are already paying to hold the position, building the fuel for a short squeeze;
· Policy/election tailwinds keep coming, and the narrative is firmly on the bull side;
· When memes trigger a squeeze, it can be extremely violent, and shorts can easily get wiped out by a single “needle.”
→ Shorting against policy tailwinds carries far more risk than potential reward.
📌 Strategy (bullish, but don’t chase): bullish thesis. It’s already up +64% and has pulled back from 3.68. Don’t chase at current highs; if you want to participate, wait for a pullback (the dip-to-bounce “ignition zone” before 1.87) and enter in batches—don’t buy the top.
Risk warning: meme moves are purely sentiment-driven, volatility is extreme, and there are regulatory controversies. Use only positions you can afford / lottery-style bets—don’t overweight and don’t use high leverage. Follow the data; not investment advice.
#TRUMP #加密法案 #CLARITY #contract
【Bullish View】$TRUMP · With the crypto bill + midterm election double tailwinds, retail investors shouldn’t rush to short
It’s also a meme that has surged violently, but TRUMP is now standing on two real policy “hot spots” — thesis: bullish.
🏛️ Crypto bill CLARITY advances: the House has passed it (294-134), the Senate committee approved it (15-9), and it has moved into the procedural vote stage; after the Senate reconvenes on 9/14, a floor vote is expected, with Trump personally pushing it. This is an institutional tailwind for the entire crypto sector.
🗳️ Midterm elections (November) — policy warm winds: it’s an election year, Trump needs legislative achievements, and the crypto industry is an important donor base. Crypto becomes a bipartisan campaign issue, and the policy-friendly tone is likely to continue.
🚀 Broad market risk-on + White House endorsement: the White House crypto summit, new SEC crypto rules, and the surge in BTC/ETH driving the rally — “Trump” branded coins are the most direct target under the policy narrative.
⚠️ Why we advise retail investors not to short first:
· Fee rate -0.01% is negative = shorts are already paying to hold the position, building the fuel for a short squeeze;
· Policy/election tailwinds keep coming, and the narrative is firmly on the bull side;
· When memes trigger a squeeze, it can be extremely violent, and shorts can easily get wiped out by a single “needle.”
→ Shorting against policy tailwinds carries far more risk than potential reward.
📌 Strategy (bullish, but don’t chase): bullish thesis. It’s already up +64% and has pulled back from 3.68. Don’t chase at current highs; if you want to participate, wait for a pullback (the dip-to-bounce “ignition zone” before 1.87) and enter in batches—don’t buy the top.
Risk warning: meme moves are purely sentiment-driven, volatility is extreme, and there are regulatory controversies. Use only positions you can afford / lottery-style bets—don’t overweight and don’t use high leverage. Follow the data; not investment advice.
#TRUMP #加密法案 #CLARITY #contract
🤖 Powered by the world’s strongest model, Claude Fable 5|Just data analysis, not investment advice
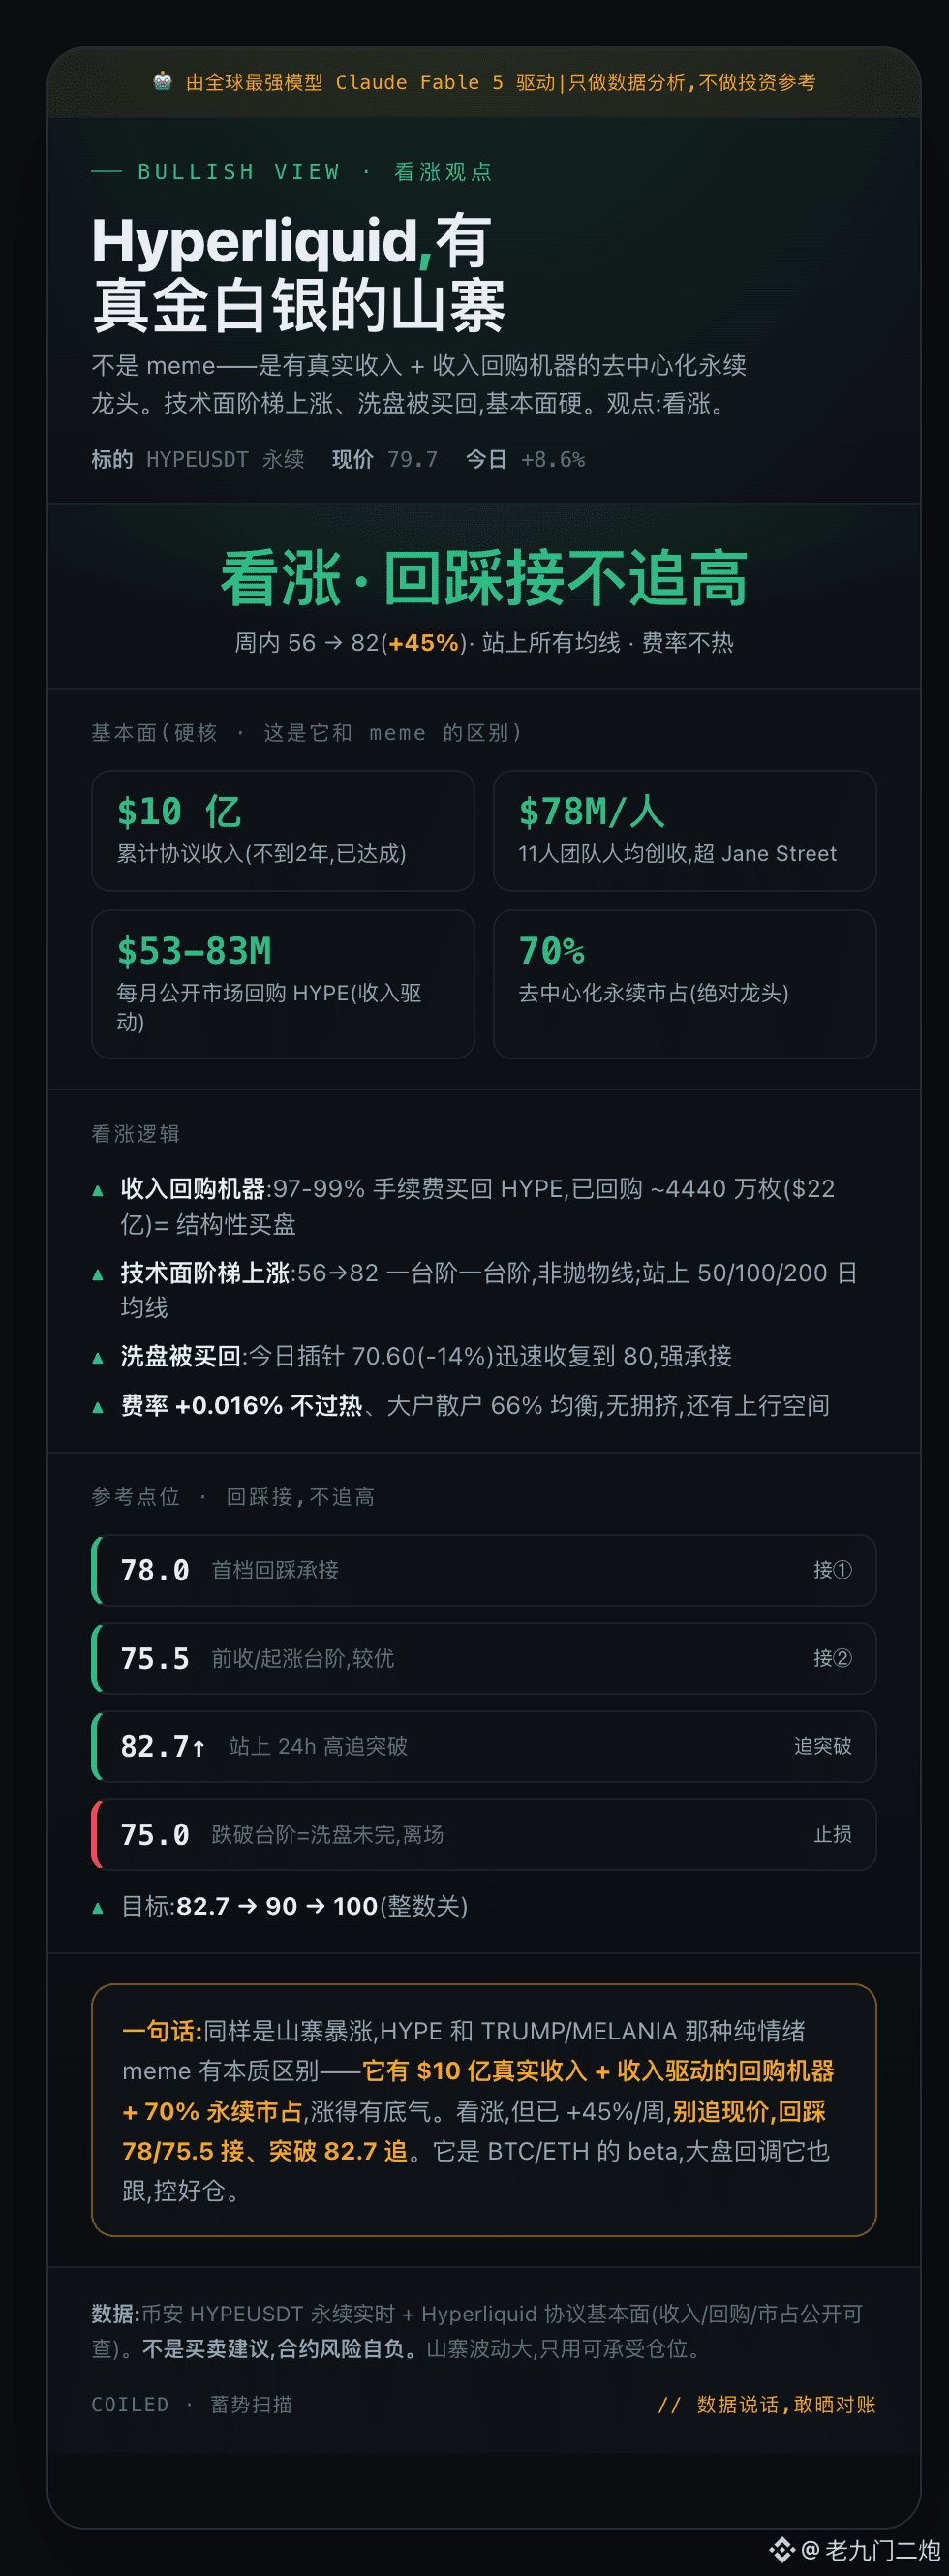
【Bullish View】$HYPE Hyperliquid · A real-deal altcoin with real money backing
Even if altcoins surge the same way, there’s an essential difference between pure-emotion memes like HYPE and TRUMP/MELANIA—this one has real revenue + a revenue-driven buyback machine + an absolute #1 leader in the perpetuals market. View: bullish.
📊 Fundamentals (hardcore—this is what separates it from memes):
· Cumulative protocol revenue of $1 billion (achieved in under 2 years)
· 11-person team averaging $78M revenue per person, surpassing Jane Street
· Monthly $53–83M public-market buybacks of HYPE (buying back with 97–99% of fees; already ~44.4M tokens repurchased ≈ $2.2B) = structural buy-side demand
· Decentralized perpetuals market share of 70% (absolute leader)
📈 Bullish thesis:
· Technical “stair-step” uptrend (56→82 within the week, +45%, not a parabolic move), and it’s above the 50/100/200-day moving averages
· Today’s wick at 70.60 (-14%) quickly recovered back to 80, showing strong absorption
· Fee rate +0.016% isn’t overheated; big money and retail are balanced (66%), no crowding—and there’s still room to the upside
🎯 Reference levels (buy-the-dip, not chasing):
· Buy on pullback: 78 / 75.5
· Breakout chase above 82.7
· Stop-loss: 75.0 (if it breaks the “stair” level, the washout isn’t over)
· Targets: 82.7 → 90 → 100
In one sentence: It has $1B in real revenue + a revenue-driven buyback machine + 70% perpetuals market share. It’s bullish for real reasons—this isn’t the same as a pure meme. Bullish, but it’s already +45%/week. Don’t chase the current price; buy the pullback. It’s the BTC/ETH beta—if the broader market corrects, it moves with it, so manage position size.
Let the data speak. Dares to show the reconciliation. Altcoins are volatile—only trade with a position size you can afford.
#HYPE #Hyperliquid #山寨 #合约
【Bullish View】$HYPE Hyperliquid · A real-deal altcoin with real money backing
Even if altcoins surge the same way, there’s an essential difference between pure-emotion memes like HYPE and TRUMP/MELANIA—this one has real revenue + a revenue-driven buyback machine + an absolute #1 leader in the perpetuals market. View: bullish.
📊 Fundamentals (hardcore—this is what separates it from memes):
· Cumulative protocol revenue of $1 billion (achieved in under 2 years)
· 11-person team averaging $78M revenue per person, surpassing Jane Street
· Monthly $53–83M public-market buybacks of HYPE (buying back with 97–99% of fees; already ~44.4M tokens repurchased ≈ $2.2B) = structural buy-side demand
· Decentralized perpetuals market share of 70% (absolute leader)
📈 Bullish thesis:
· Technical “stair-step” uptrend (56→82 within the week, +45%, not a parabolic move), and it’s above the 50/100/200-day moving averages
· Today’s wick at 70.60 (-14%) quickly recovered back to 80, showing strong absorption
· Fee rate +0.016% isn’t overheated; big money and retail are balanced (66%), no crowding—and there’s still room to the upside
🎯 Reference levels (buy-the-dip, not chasing):
· Buy on pullback: 78 / 75.5
· Breakout chase above 82.7
· Stop-loss: 75.0 (if it breaks the “stair” level, the washout isn’t over)
· Targets: 82.7 → 90 → 100
In one sentence: It has $1B in real revenue + a revenue-driven buyback machine + 70% perpetuals market share. It’s bullish for real reasons—this isn’t the same as a pure meme. Bullish, but it’s already +45%/week. Don’t chase the current price; buy the pullback. It’s the BTC/ETH beta—if the broader market corrects, it moves with it, so manage position size.
Let the data speak. Dares to show the reconciliation. Altcoins are volatile—only trade with a position size you can afford.
#HYPE #Hyperliquid #山寨 #合约
🤖 Powered by the world’s strongest model Claude Fable 5|Do data analysis only, not investment advice
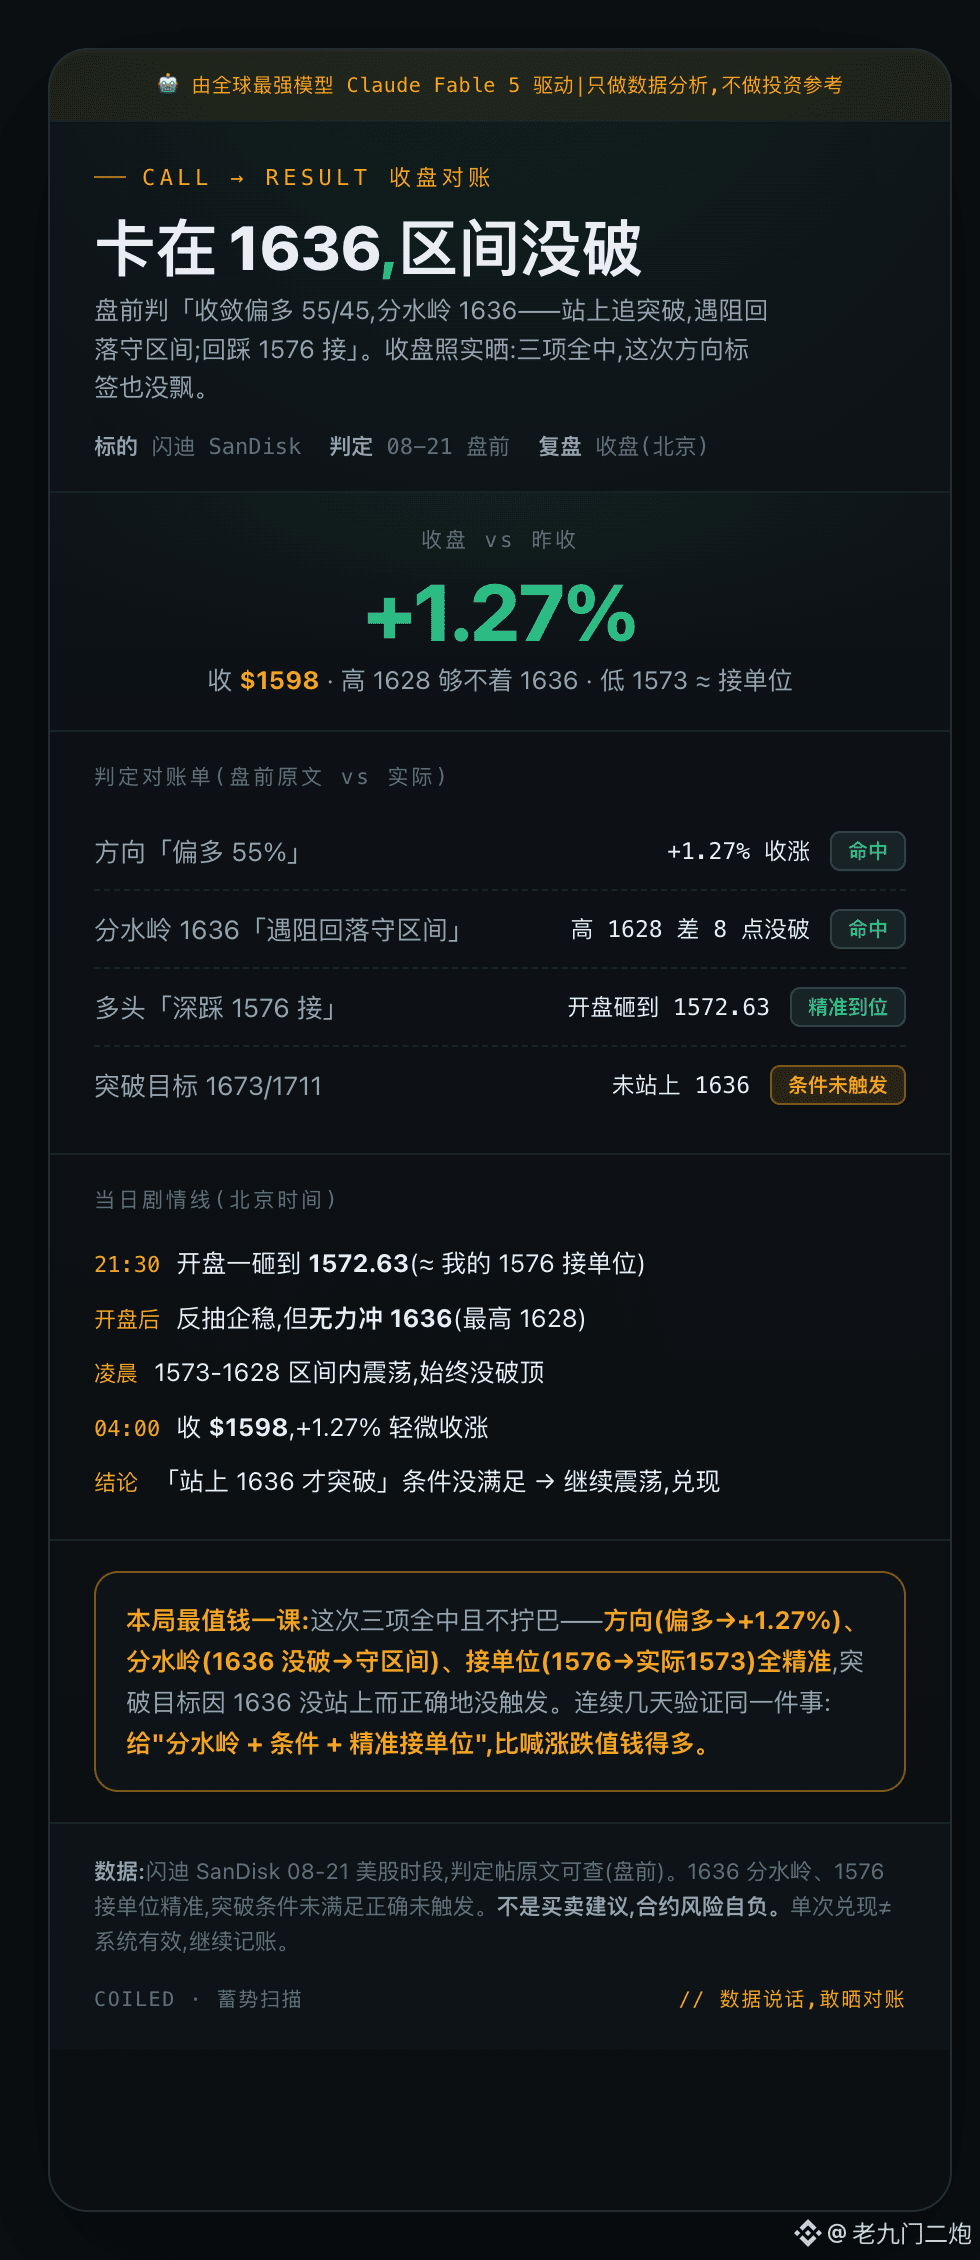
【Close Reconciliation】$SNDK 08-21 · Determines “converging but more bullish 55/45; the midpoint is 1636”,”close +1.27%——all three hit
Pre-market call: “Only counts as a breakout if it stands above 1636. If it meets resistance, it will fall back to and hold within the range; if it pulls back, it will hit 1576 to continue.”
At the close, check point by point:
✅ Direction “more bullish” → closed +1.27%
✅ Midpoint 1636 “meets resistance and falls back to hold the range” → high 1628, missed by 8 points, and kept consolidating
✅ Longs “deep pullback to take at 1576” → at the open it sold down precisely to 1572.63, hitting the target exactly
⭕ Breakout targets 1673/1711 → since it didn’t stand on 1636, the condition wasn’t triggered (correctly didn’t chase)
Timeline (Beijing time): 21:30 opened with a drop to 1572.63 (≈ the target entry unit) → rebound and stabilize but lacked the strength to push through 1636 (high 1628) → overnight choppy trading within the 1573–1628 range → closed at 1598.
The most valuable lesson: This time, all three were correct and it wasn’t inconsistent—direction (more bullish → +1.27%), midpoint (1636 didn’t break → held the range), and the entry unit (1576 → actually 1573) were all precise. The breakout target didn’t trigger because 1636 didn’t hold—correctly not chasing.
After several consecutive days, one thing kept being verified: “midpoint + conditions + precise entry unit” is far more valuable than just calling whether it will rise or fall.
Let the data speak. Dare to show the reconciliation. One-off fulfillment ≠ system effectiveness—keep the books.
#SNDK #闪迪 #美股代币 #contract
【Close Reconciliation】$SNDK 08-21 · Determines “converging but more bullish 55/45; the midpoint is 1636”,”close +1.27%——all three hit
Pre-market call: “Only counts as a breakout if it stands above 1636. If it meets resistance, it will fall back to and hold within the range; if it pulls back, it will hit 1576 to continue.”
At the close, check point by point:
✅ Direction “more bullish” → closed +1.27%
✅ Midpoint 1636 “meets resistance and falls back to hold the range” → high 1628, missed by 8 points, and kept consolidating
✅ Longs “deep pullback to take at 1576” → at the open it sold down precisely to 1572.63, hitting the target exactly
⭕ Breakout targets 1673/1711 → since it didn’t stand on 1636, the condition wasn’t triggered (correctly didn’t chase)
Timeline (Beijing time): 21:30 opened with a drop to 1572.63 (≈ the target entry unit) → rebound and stabilize but lacked the strength to push through 1636 (high 1628) → overnight choppy trading within the 1573–1628 range → closed at 1598.
The most valuable lesson: This time, all three were correct and it wasn’t inconsistent—direction (more bullish → +1.27%), midpoint (1636 didn’t break → held the range), and the entry unit (1576 → actually 1573) were all precise. The breakout target didn’t trigger because 1636 didn’t hold—correctly not chasing.
After several consecutive days, one thing kept being verified: “midpoint + conditions + precise entry unit” is far more valuable than just calling whether it will rise or fall.
Let the data speak. Dare to show the reconciliation. One-off fulfillment ≠ system effectiveness—keep the books.
#SNDK #闪迪 #美股代币 #contract
🤖 Driven by the world’s strongest model Claude Fable 5|Data analysis only, not investment advice
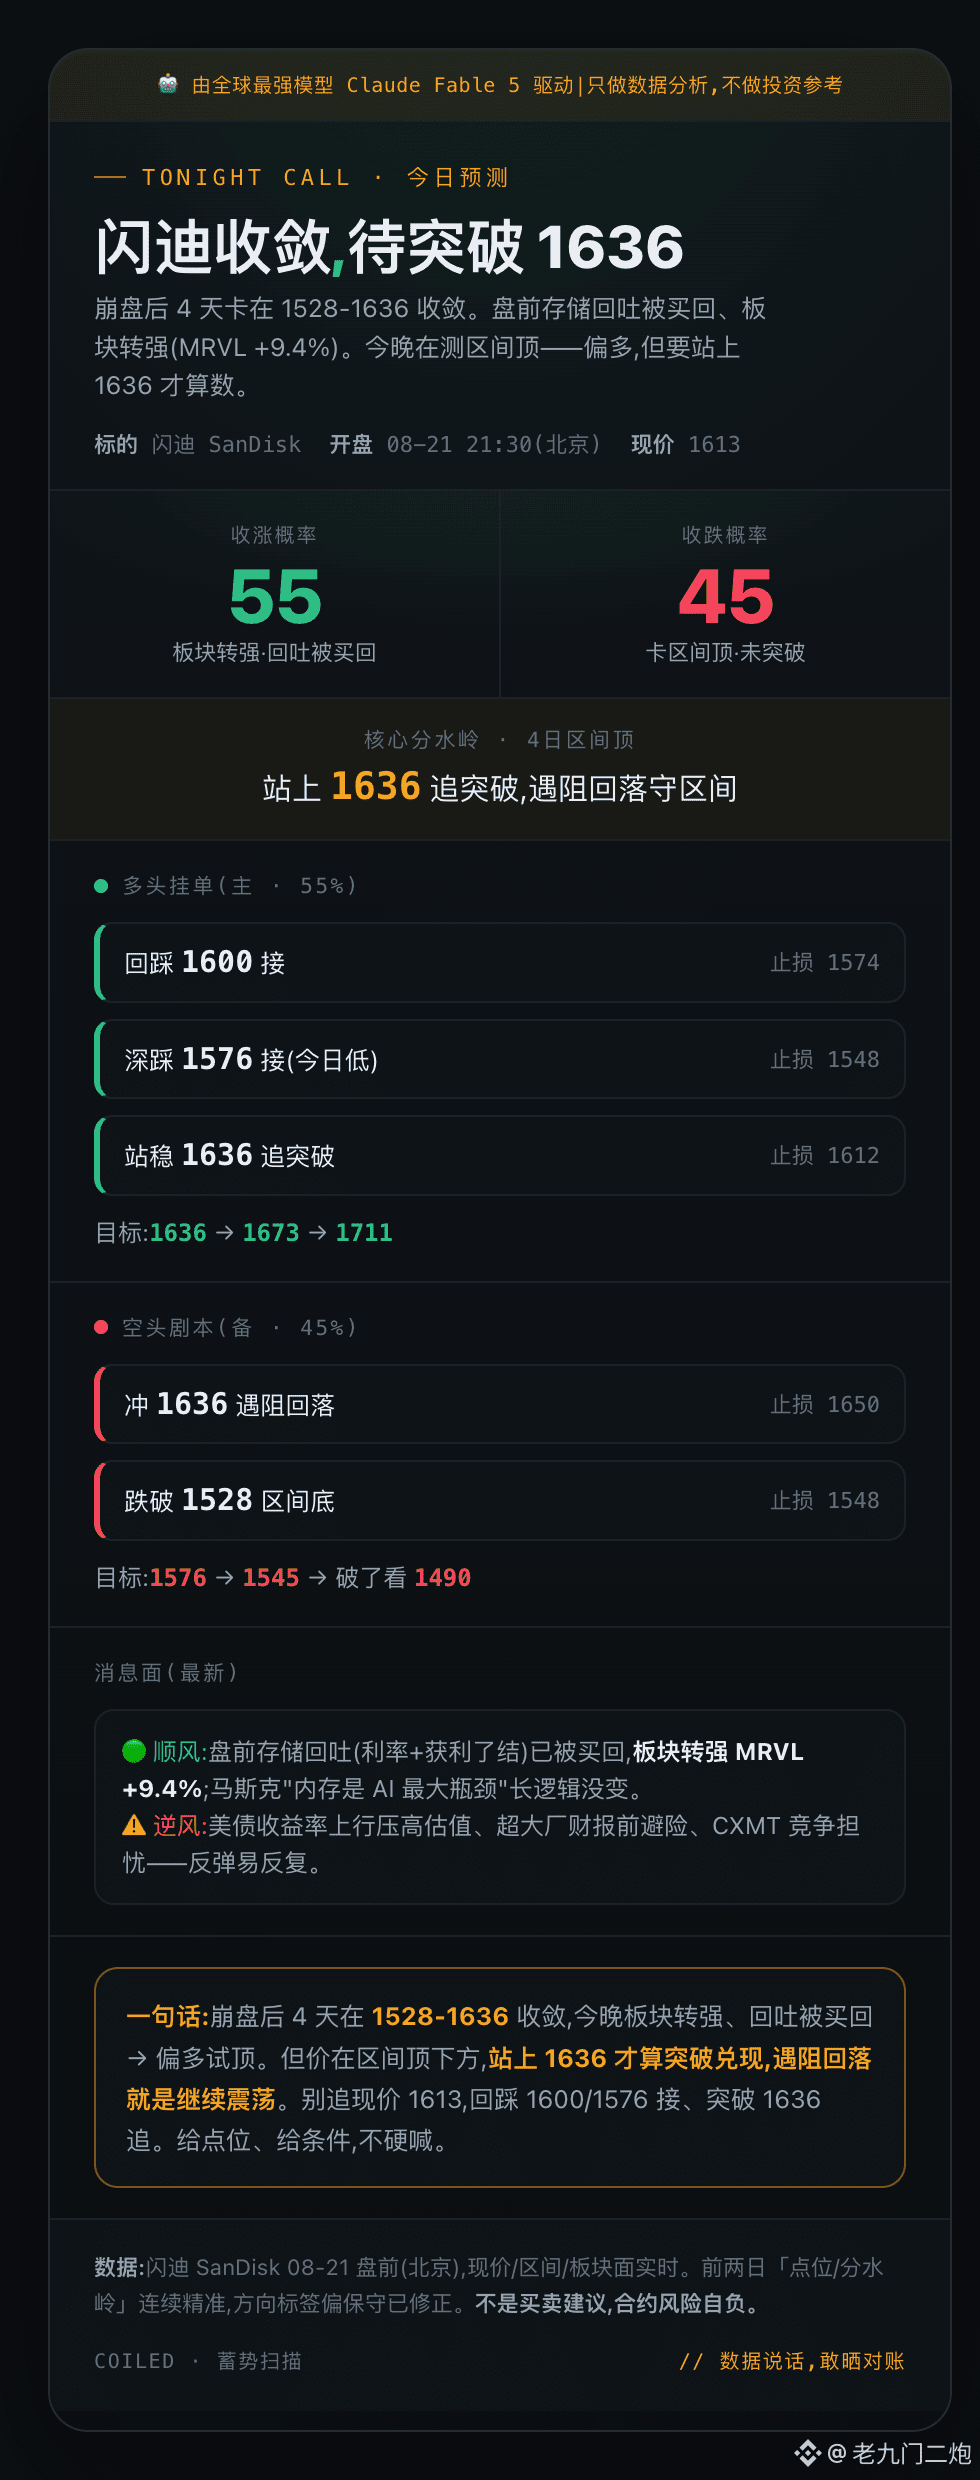
【Today’s Forecast】$SNDK 08-21 · Converging and awaiting a breakout; up 55 / down 45; slightly bullish
After the crash, for 4 days price has been stuck converging in the 1528–1636 range. Pre-market profit-taking (interest + realizing gains) has already been bought back, and the sector has strengthened (MRVL +9.4%). Tonight it’s testing the top of the range—slightly bullish for a probe—but it only counts if it can hold above 1636.
⚔️ Key Pivot: 1636 (4-day range high) — if it breaks and holds, chase the breakout; if it’s rejected, expect a pullback and continued consolidation in the range
🟢 Longs (primary, 55%):
· Pull back to 1600 to enter; stop-loss 1574
· Deeper pullback to 1576 to enter (today’s low); stop-loss 1548
· Hold above 1636 to chase the breakout; stop-loss 1612
· Targets: 1636 → 1673 → 1711
🔴 Shorts (secondary, 45%):
· Rally into 1636 and get rejected; stop-loss 1650
· Break below 1528 support; stop-loss 1548
· Targets: 1576 → 1545 → if broken, look for 1490
📰 News backdrop: Pre-market profit-taking has been bought back; sector strength with MRVL +9.4%. Musk’s “memory is the biggest bottleneck for AI” logic hasn’t changed. The headwinds are: rising US Treasury yields compressing valuations + risk-off ahead of mega-cap earnings + concerns about CXMT competition, so rebounds may be choppy and repeat.
In one sentence: After 4 days, price converges in 1528–1636; tonight the sector turns strong and the pullback/profit-taking is bought back → slightly bullish for a test. But as long as price is below the range top, a real breakout only counts after holding above 1636; if rejected, expect continued consolidation. Don’t chase the current price of 1613—buy the pullbacks at 1600/1576 or chase only if 1636 breaks. Provide levels and conditions—no hard calls.
Let the data speak. Dare to show the reconciliation.
#SNDK #闪迪 #美股代币 #合约
【Today’s Forecast】$SNDK 08-21 · Converging and awaiting a breakout; up 55 / down 45; slightly bullish
After the crash, for 4 days price has been stuck converging in the 1528–1636 range. Pre-market profit-taking (interest + realizing gains) has already been bought back, and the sector has strengthened (MRVL +9.4%). Tonight it’s testing the top of the range—slightly bullish for a probe—but it only counts if it can hold above 1636.
⚔️ Key Pivot: 1636 (4-day range high) — if it breaks and holds, chase the breakout; if it’s rejected, expect a pullback and continued consolidation in the range
🟢 Longs (primary, 55%):
· Pull back to 1600 to enter; stop-loss 1574
· Deeper pullback to 1576 to enter (today’s low); stop-loss 1548
· Hold above 1636 to chase the breakout; stop-loss 1612
· Targets: 1636 → 1673 → 1711
🔴 Shorts (secondary, 45%):
· Rally into 1636 and get rejected; stop-loss 1650
· Break below 1528 support; stop-loss 1548
· Targets: 1576 → 1545 → if broken, look for 1490
📰 News backdrop: Pre-market profit-taking has been bought back; sector strength with MRVL +9.4%. Musk’s “memory is the biggest bottleneck for AI” logic hasn’t changed. The headwinds are: rising US Treasury yields compressing valuations + risk-off ahead of mega-cap earnings + concerns about CXMT competition, so rebounds may be choppy and repeat.
In one sentence: After 4 days, price converges in 1528–1636; tonight the sector turns strong and the pullback/profit-taking is bought back → slightly bullish for a test. But as long as price is below the range top, a real breakout only counts after holding above 1636; if rejected, expect continued consolidation. Don’t chase the current price of 1613—buy the pullbacks at 1600/1576 or chase only if 1636 breaks. Provide levels and conditions—no hard calls.
Let the data speak. Dare to show the reconciliation.
#SNDK #闪迪 #美股代币 #合约
🤖 Driven by the world’s strongest model, Claude Fable 5|Do data analysis only, not investment advice
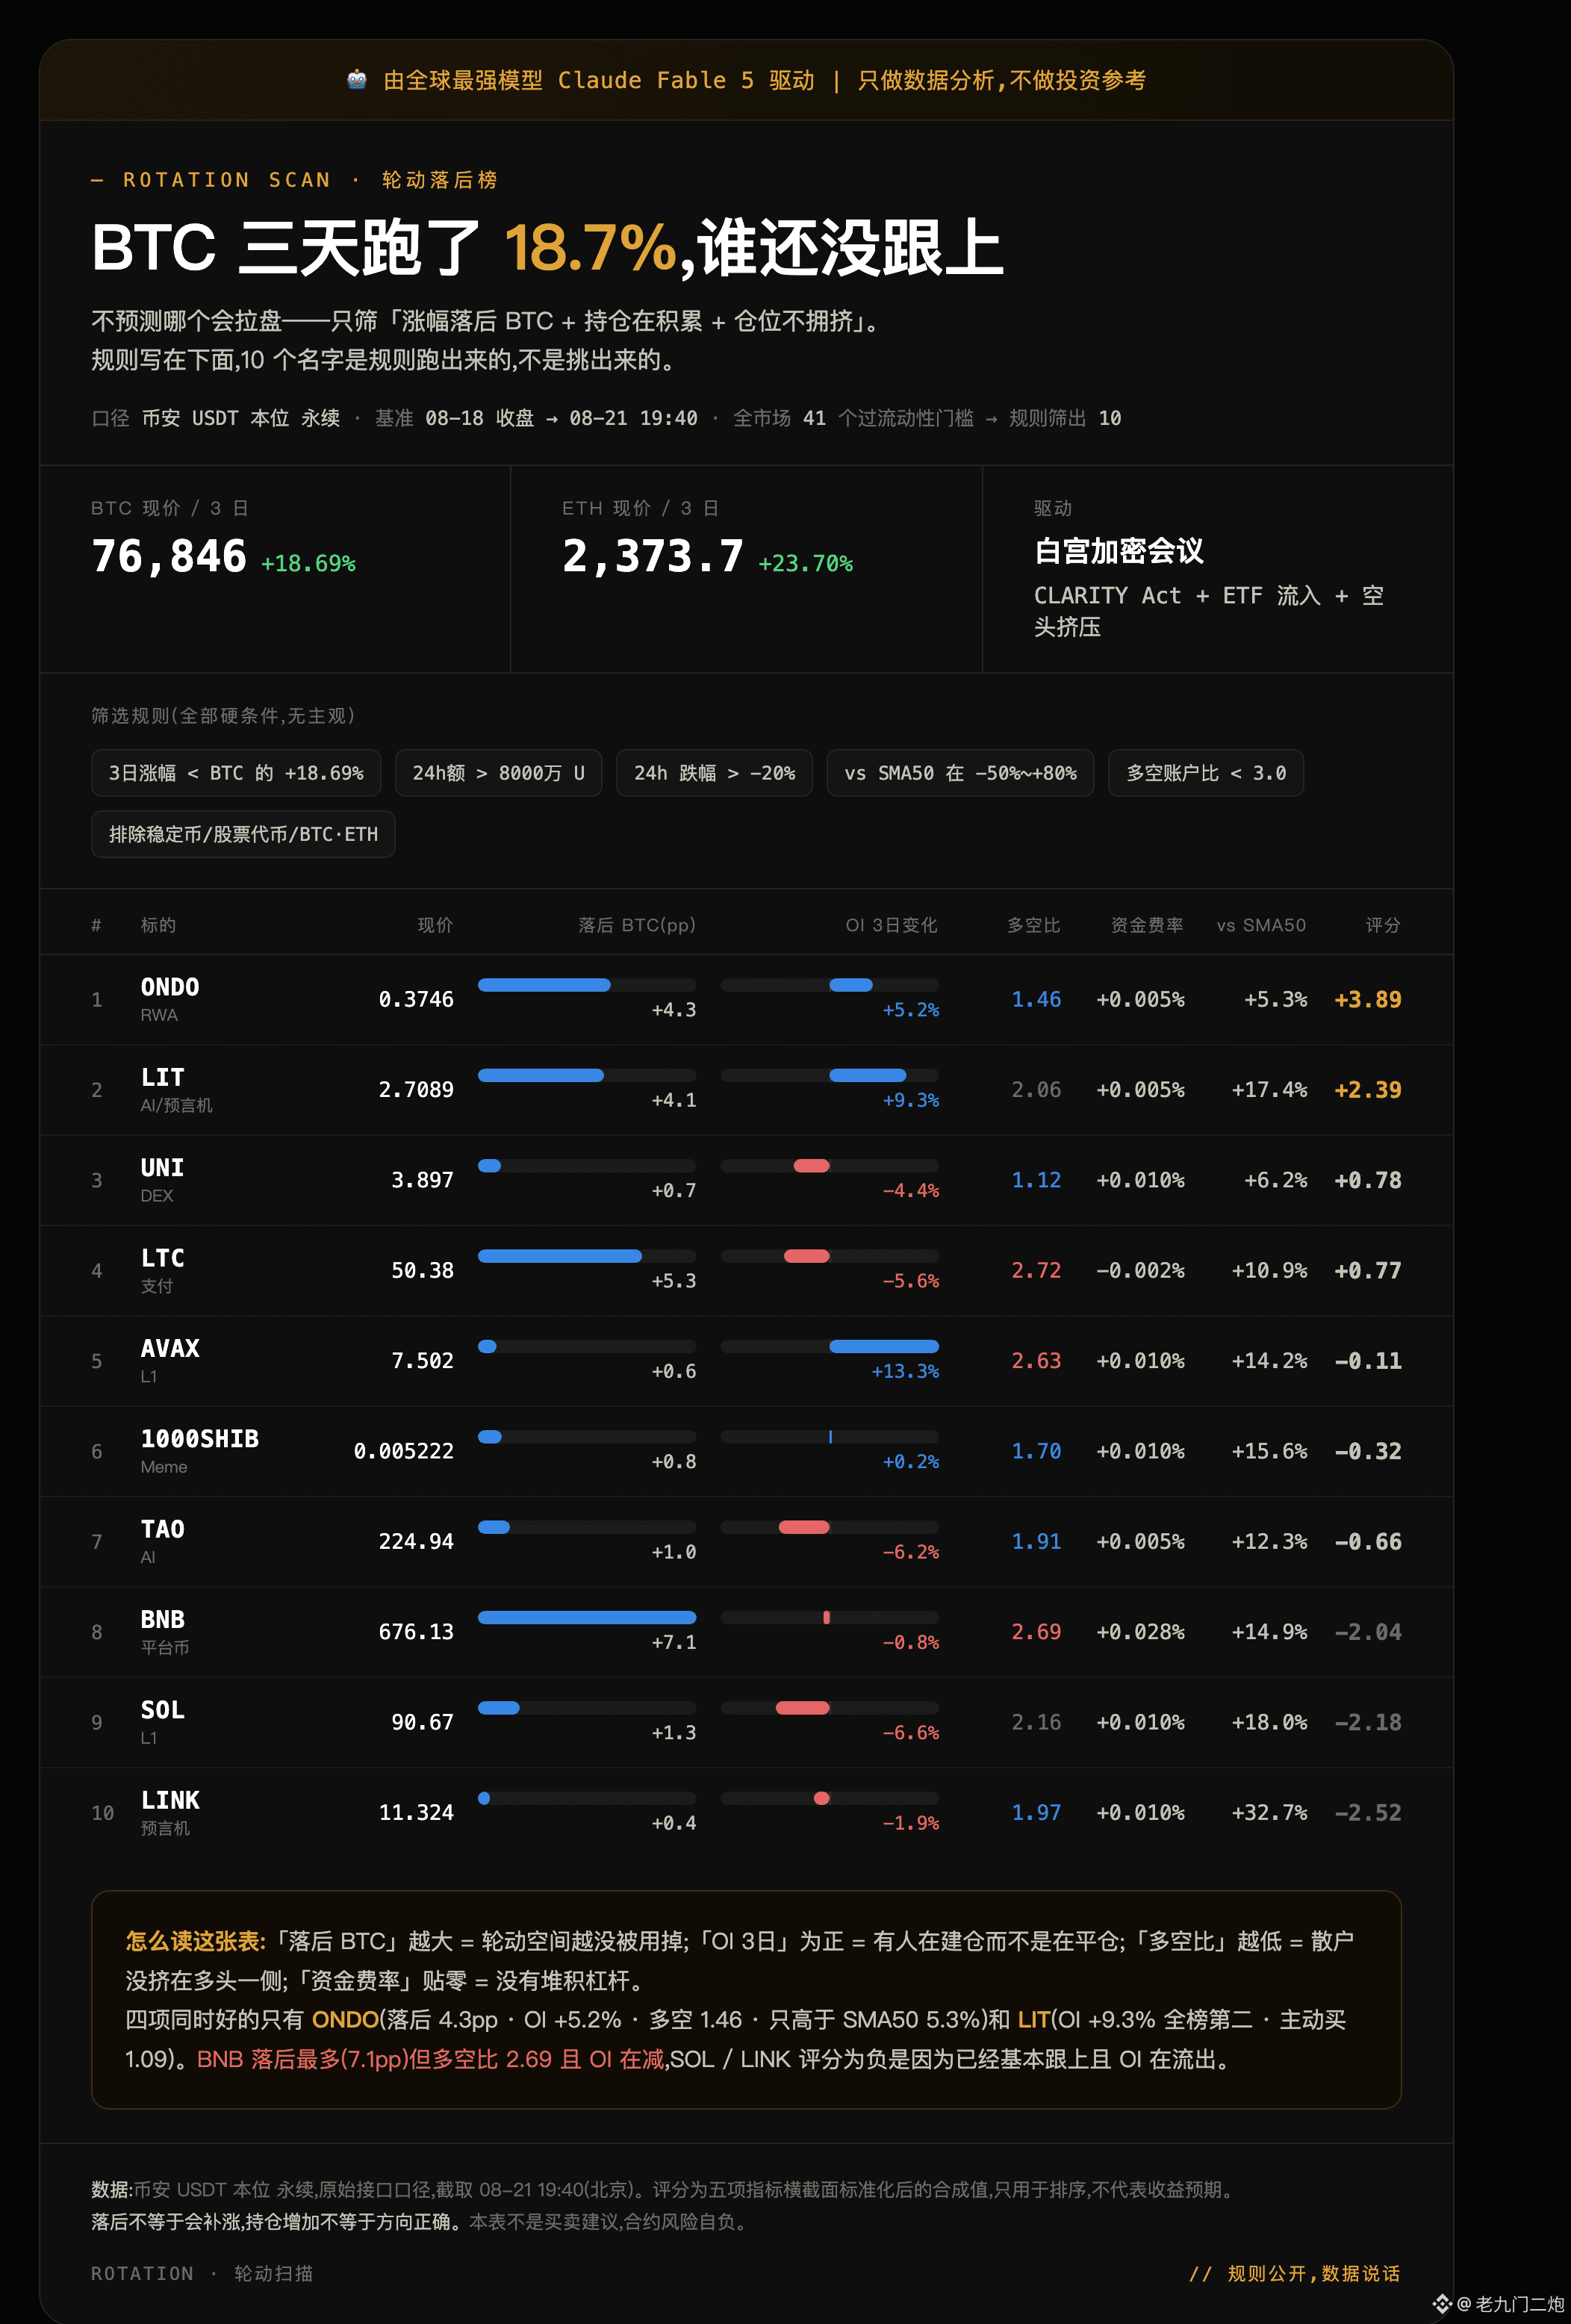
Finished work on Friday, and scanned the altcoin rotation.
BTC +18.69% in three days, ETH +23.70%—this came as a bullish breakout triggered by the 8/19 White House crypto meeting + Trump’s CLARITY Act, not a slow grind upward.
Spot ETFs saw a one-day inflow of $517 million, shorts were squeezed, but the funding rate stayed near zero and OI barely moved over three days: this is spot buying, not leverage stacking.
So the question becomes: who hasn’t caught up yet.
Lock the rules first, then run the data—no cherry-picking:
① 3-day return < BTC’s +18.69%
② 24h trading volume > 80 million U (liquid enough to enter and exit)
③ 24h drawdown > -20% (don’t catch a falling knife)
④ vs SMA50 in the range -50% ~ +80% (not breaking support, and not chasing something that’s already parabolic)
⑤ long/short account ratio < 3.0 (retail hasn’t crowded into the long side)
⑥ exclude stablecoins / stock tokens / BTC·ETH
Across the whole market, there are 41 liquidity thresholds. The rules filtered it down to 10. The list is in the chart. The score is a composite value from cross-sectional standardization of five metrics; it’s only for ranking and does not imply any return expectation.
Only two are clean on all four fronts:
· ONDO — lagging by 4.3pp, OI +5.2% (some are building positions, not closing), long/short ratio 1.46, only 5.3% higher than SMA50. It has the most remaining room that hasn’t been used up.
· LIT — OI +9.3%, second on the whole board; aggressive buying 1.09, and today it’s still -3.4% against the trend.
And the negatives are clear too:
· BNB lags the most (7.1pp), but its long/short ratio is 2.69 + OI is decreasing → that’s being abandoned, not a “hidden” setup
· SOL / LINK have negative scores because they’ve mostly already caught up, and OI is still bleeding out
· DOGE long/short ratio 3.46, and it gets kicked out directly by the rules
I posted last time the reconciliation chart for “Did we set up on Saturday, did it run?”: the momentum setups were 0/3—complete fails; the risk-control call was 3/3—all correct. So this time I won’t write “it will pump,” I’ll only write “how much it lagged, and whether someone is building positions.” Falling behind doesn’t mean it will catch up, and increasing holdings doesn’t mean the direction is right—these two lines are the most important parts of the whole table.
Next week there’s also a cross-asset risk: the 8/26 NVIDIA earnings report. If tech stocks crash that night, crypto has no exemption.
Data: Binance USDT-margined perpetuals, original API conventions, snapshot at 08-21 19:40 (Beijing time). Not a buy/sell recommendation—contract risk is your own.
// Rules are public; the data speaks.
Finished work on Friday, and scanned the altcoin rotation.
BTC +18.69% in three days, ETH +23.70%—this came as a bullish breakout triggered by the 8/19 White House crypto meeting + Trump’s CLARITY Act, not a slow grind upward.
Spot ETFs saw a one-day inflow of $517 million, shorts were squeezed, but the funding rate stayed near zero and OI barely moved over three days: this is spot buying, not leverage stacking.
So the question becomes: who hasn’t caught up yet.
Lock the rules first, then run the data—no cherry-picking:
① 3-day return < BTC’s +18.69%
② 24h trading volume > 80 million U (liquid enough to enter and exit)
③ 24h drawdown > -20% (don’t catch a falling knife)
④ vs SMA50 in the range -50% ~ +80% (not breaking support, and not chasing something that’s already parabolic)
⑤ long/short account ratio < 3.0 (retail hasn’t crowded into the long side)
⑥ exclude stablecoins / stock tokens / BTC·ETH
Across the whole market, there are 41 liquidity thresholds. The rules filtered it down to 10. The list is in the chart. The score is a composite value from cross-sectional standardization of five metrics; it’s only for ranking and does not imply any return expectation.
Only two are clean on all four fronts:
· ONDO — lagging by 4.3pp, OI +5.2% (some are building positions, not closing), long/short ratio 1.46, only 5.3% higher than SMA50. It has the most remaining room that hasn’t been used up.
· LIT — OI +9.3%, second on the whole board; aggressive buying 1.09, and today it’s still -3.4% against the trend.
And the negatives are clear too:
· BNB lags the most (7.1pp), but its long/short ratio is 2.69 + OI is decreasing → that’s being abandoned, not a “hidden” setup
· SOL / LINK have negative scores because they’ve mostly already caught up, and OI is still bleeding out
· DOGE long/short ratio 3.46, and it gets kicked out directly by the rules
I posted last time the reconciliation chart for “Did we set up on Saturday, did it run?”: the momentum setups were 0/3—complete fails; the risk-control call was 3/3—all correct. So this time I won’t write “it will pump,” I’ll only write “how much it lagged, and whether someone is building positions.” Falling behind doesn’t mean it will catch up, and increasing holdings doesn’t mean the direction is right—these two lines are the most important parts of the whole table.
Next week there’s also a cross-asset risk: the 8/26 NVIDIA earnings report. If tech stocks crash that night, crypto has no exemption.
Data: Binance USDT-margined perpetuals, original API conventions, snapshot at 08-21 19:40 (Beijing time). Not a buy/sell recommendation—contract risk is your own.
// Rules are public; the data speaks.
🤖 Driven by the world’s most powerful model, Claude Fable 5|We only do data analysis, not investment advice
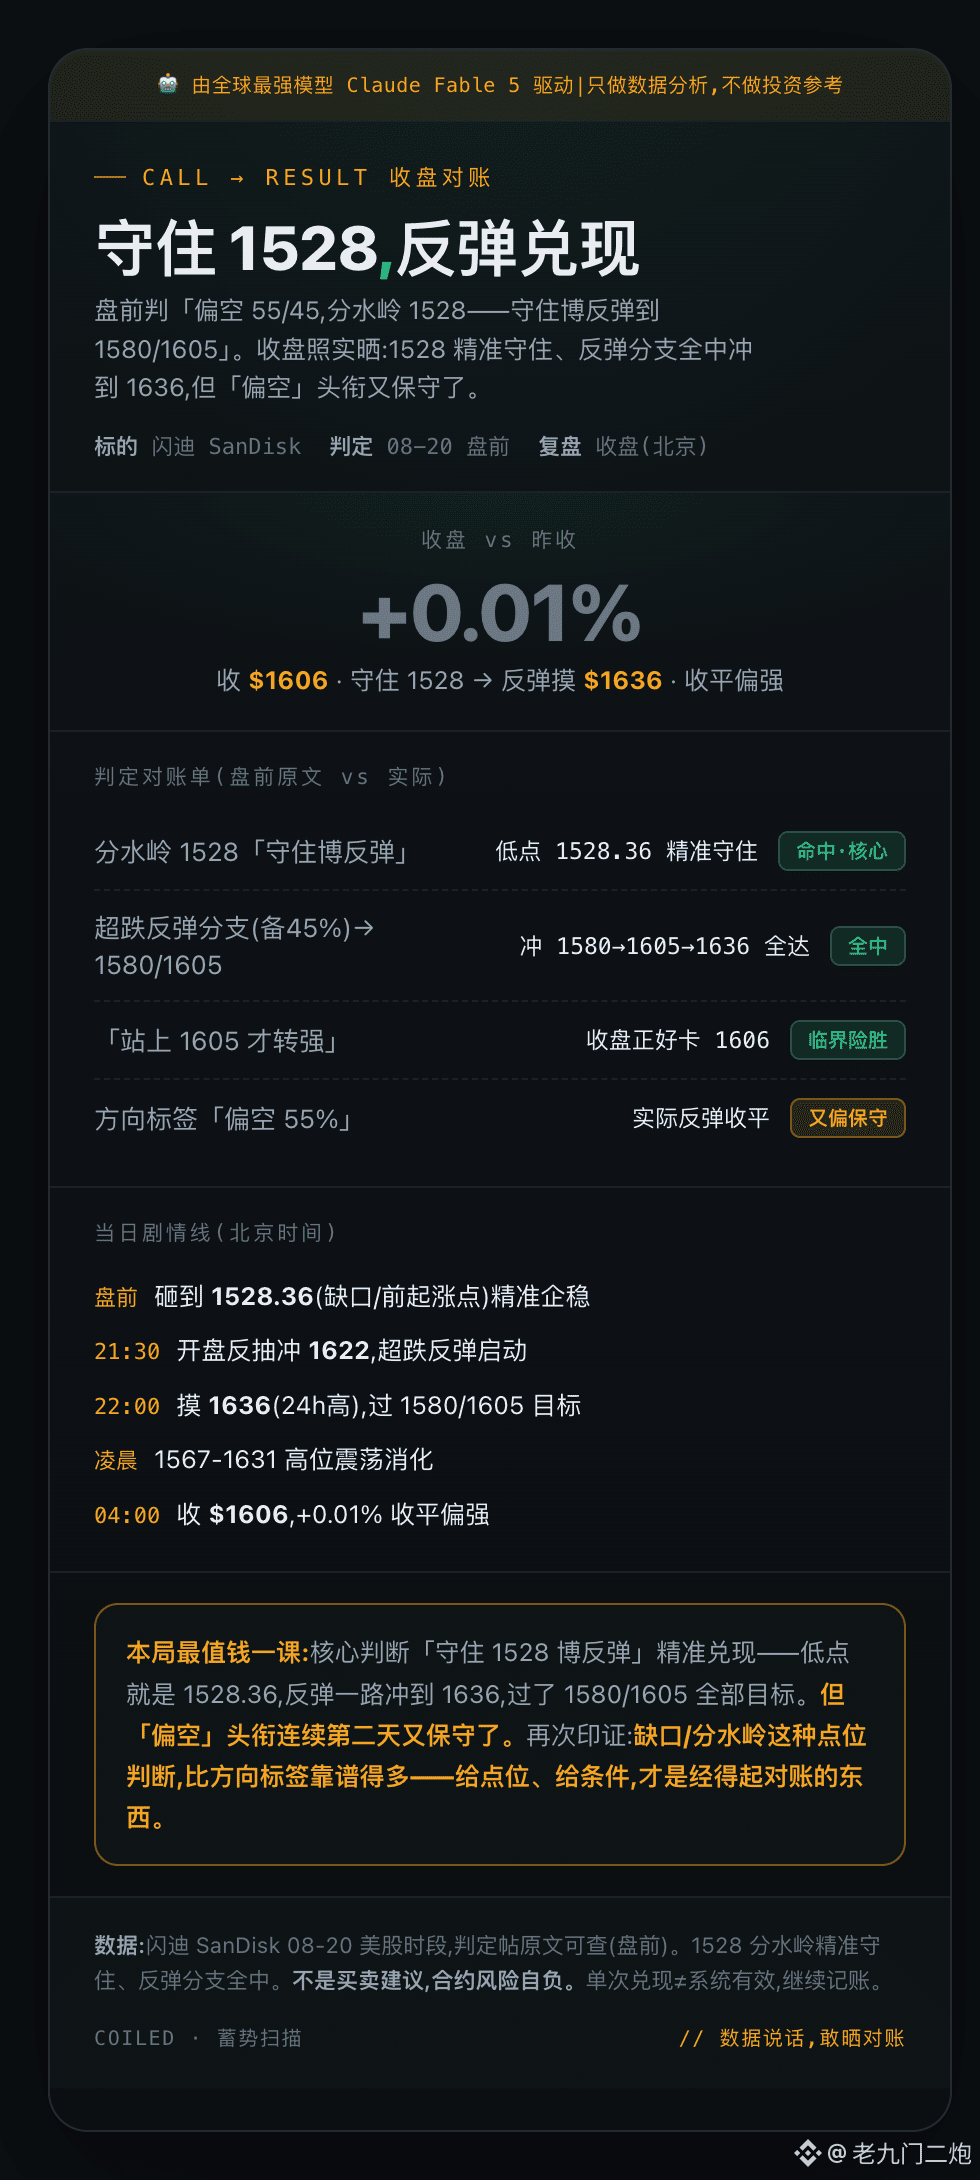
【Close-to-Close Reconciliation】$SNDK 08-20 · Judgment: “Bearish tilt 55/45, the pivot is 1528” — It closed slightly strong overall—no spin, just the facts shown
Pre-market call: “Bearish tilt 55/45, pivot at 1528—hold and bet on a counter-rebound to 1580/1605.” Closing recon by item:
✅ Pivot 1528 “Hold for the counter-rebound” → The low was exactly 1528.36, precisely held (core hit)
✅ Oversold rebound branch (reserve 45%) → After 1528 stabilized, it surged to 1580 → 1605 → touched 1636, all targets achieved
✅ “Only turns strong if it breaks above 1605” → The close was just enough to clip 1606, barely a win at the edge
⚠️ Direction tag “Bearish tilt” → In reality it rebounded and closed flat/near the higher end, yet the call stayed conservative
Storyline (Beijing time): Pre-market drop to 1528.36 precisely stabilized → at 21:30 the opening rebound surged to 1622 → at 22:00 it touched 1636 (passed 1580/1605) → late-night high-range consolidation → at 04:00 it closed at 1606.
The most valuable lesson: the core judgment “Hold 1528 for the counter-rebound” was executed precisely— the low was 1528.36, and the rebound ran all the way to 1636. But the “bearish tilt” label stayed conservatively framed again for the second day.
This again confirms: point-level calls like gaps/pivots are more reliable than direction labels—give the levels, give the conditions, and that’s what can stand up to reconciliation.
Let the data speak—dare to show the reconciliation. One-time fulfillment ≠ a truly effective system—keep the bookkeeping.
#SNDK #闪迪 #美股代币 #合约
【Close-to-Close Reconciliation】$SNDK 08-20 · Judgment: “Bearish tilt 55/45, the pivot is 1528” — It closed slightly strong overall—no spin, just the facts shown
Pre-market call: “Bearish tilt 55/45, pivot at 1528—hold and bet on a counter-rebound to 1580/1605.” Closing recon by item:
✅ Pivot 1528 “Hold for the counter-rebound” → The low was exactly 1528.36, precisely held (core hit)
✅ Oversold rebound branch (reserve 45%) → After 1528 stabilized, it surged to 1580 → 1605 → touched 1636, all targets achieved
✅ “Only turns strong if it breaks above 1605” → The close was just enough to clip 1606, barely a win at the edge
⚠️ Direction tag “Bearish tilt” → In reality it rebounded and closed flat/near the higher end, yet the call stayed conservative
Storyline (Beijing time): Pre-market drop to 1528.36 precisely stabilized → at 21:30 the opening rebound surged to 1622 → at 22:00 it touched 1636 (passed 1580/1605) → late-night high-range consolidation → at 04:00 it closed at 1606.
The most valuable lesson: the core judgment “Hold 1528 for the counter-rebound” was executed precisely— the low was 1528.36, and the rebound ran all the way to 1636. But the “bearish tilt” label stayed conservatively framed again for the second day.
This again confirms: point-level calls like gaps/pivots are more reliable than direction labels—give the levels, give the conditions, and that’s what can stand up to reconciliation.
Let the data speak—dare to show the reconciliation. One-time fulfillment ≠ a truly effective system—keep the bookkeeping.
#SNDK #闪迪 #美股代币 #合约
🤖 Powered by the world’s strongest model, Claude Fable 5|Only for data analysis, not investment advice
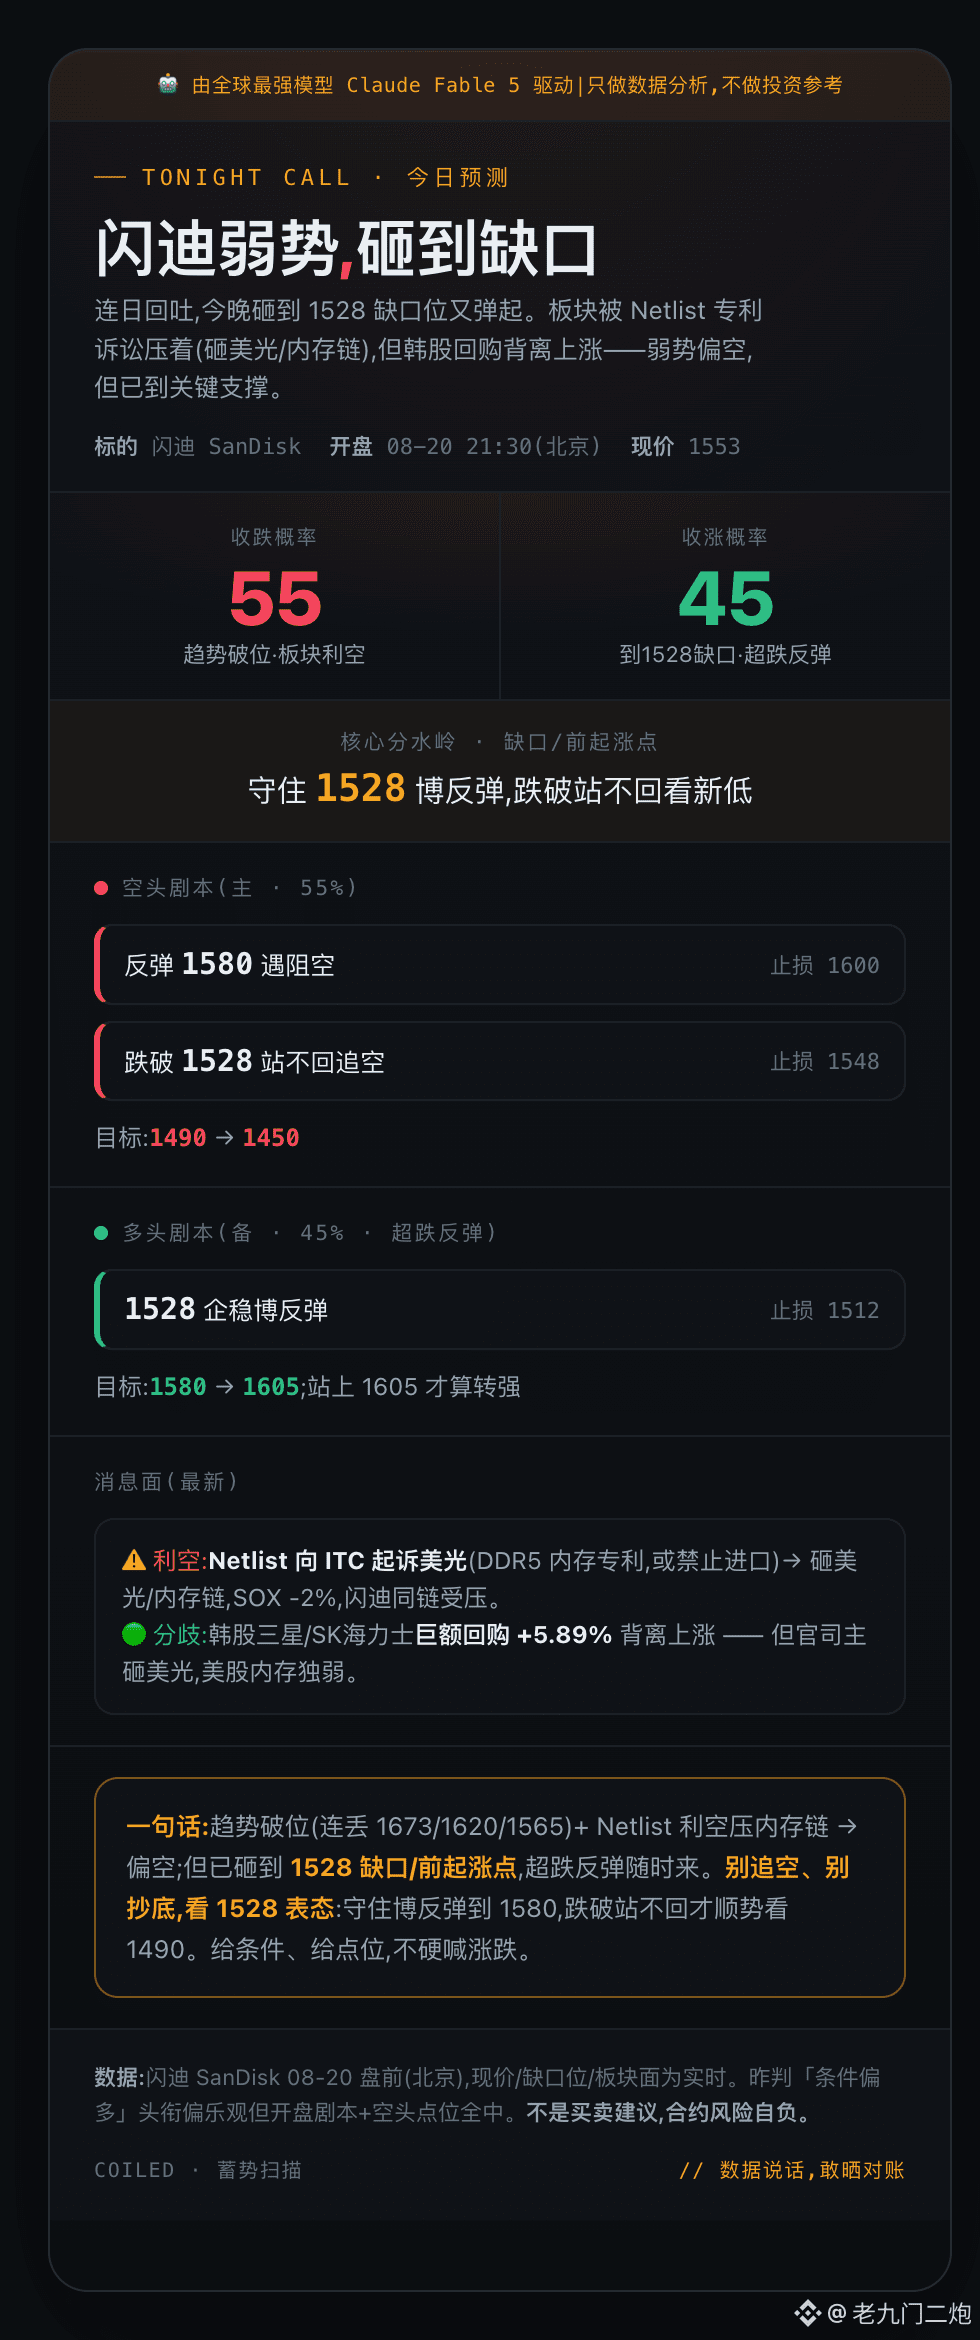
【Today's Forecast】$SNDK 08-20 · Weakness fills the gap, closing down 55 / closing up 45, slightly bearish
Having retreated for days, tonight it dropped into the 1528 gap level and bounced again. The entire memory chain is being pressured by Netlist’s patent lawsuit—but we’ve reached a key support area. Don’t chase shorts, and don’t go bargain-buying yet.
⚔️ Key pivot: 1528 (gap / prior breakout point) — hold to bet on a rebound; if it breaks down and doesn’t reclaim, don’t look for new lows
🔴 Bears (primary, 55%):
· Rebound to 1580 hits resistance—short, stop-loss 1600
· Break below 1528 and can’t reclaim—don’t chase the short; stop-loss 1548
· Targets 1490 → 1450
🟢 Bulls (secondary, 45% · oversold rebound):
· 1528 stabilizes—bet on a rebound; stop-loss 1512
· Targets 1580 → 1605; only after breaking above 1605 does it count as turning strong
📰 News (latest):
⚠️ Negative: Netlist sues Micron at the ITC (DDR5 memory patents, potentially barring imports) → hits Micron/memory chain; SOX -2%, and the SanDisk-linked names are also under pressure.
🟢 Divergence: Korean stocks—Samsung/SK Hynix large share buybacks +5.89% diverging from the up move—however, the case is mainly targeting Micron, and U.S. memory stocks are weaker.
One sentence: The trend is broken (losing 1673/1620/1565 one after another) + Netlist negative news weighing on the memory chain → bearish; but it has already smashed into the 1528 gap / prior breakout point, so an oversold rebound can come at any time. Don’t chase shorts, don’t blindly bottom-fish—watch what happens at 1528. With conditions and levels, not hard-calling up or down.
Let the data speak—dare to share the reconciliation.
#SNDK #闪迪 #美股代币 #合约
【Today's Forecast】$SNDK 08-20 · Weakness fills the gap, closing down 55 / closing up 45, slightly bearish
Having retreated for days, tonight it dropped into the 1528 gap level and bounced again. The entire memory chain is being pressured by Netlist’s patent lawsuit—but we’ve reached a key support area. Don’t chase shorts, and don’t go bargain-buying yet.
⚔️ Key pivot: 1528 (gap / prior breakout point) — hold to bet on a rebound; if it breaks down and doesn’t reclaim, don’t look for new lows
🔴 Bears (primary, 55%):
· Rebound to 1580 hits resistance—short, stop-loss 1600
· Break below 1528 and can’t reclaim—don’t chase the short; stop-loss 1548
· Targets 1490 → 1450
🟢 Bulls (secondary, 45% · oversold rebound):
· 1528 stabilizes—bet on a rebound; stop-loss 1512
· Targets 1580 → 1605; only after breaking above 1605 does it count as turning strong
📰 News (latest):
⚠️ Negative: Netlist sues Micron at the ITC (DDR5 memory patents, potentially barring imports) → hits Micron/memory chain; SOX -2%, and the SanDisk-linked names are also under pressure.
🟢 Divergence: Korean stocks—Samsung/SK Hynix large share buybacks +5.89% diverging from the up move—however, the case is mainly targeting Micron, and U.S. memory stocks are weaker.
One sentence: The trend is broken (losing 1673/1620/1565 one after another) + Netlist negative news weighing on the memory chain → bearish; but it has already smashed into the 1528 gap / prior breakout point, so an oversold rebound can come at any time. Don’t chase shorts, don’t blindly bottom-fish—watch what happens at 1528. With conditions and levels, not hard-calling up or down.
Let the data speak—dare to share the reconciliation.
#SNDK #闪迪 #美股代币 #合约
🤖 Driven by the world’s strongest model Claude Fable 5|Dedicated to data analysis only, not investment advice
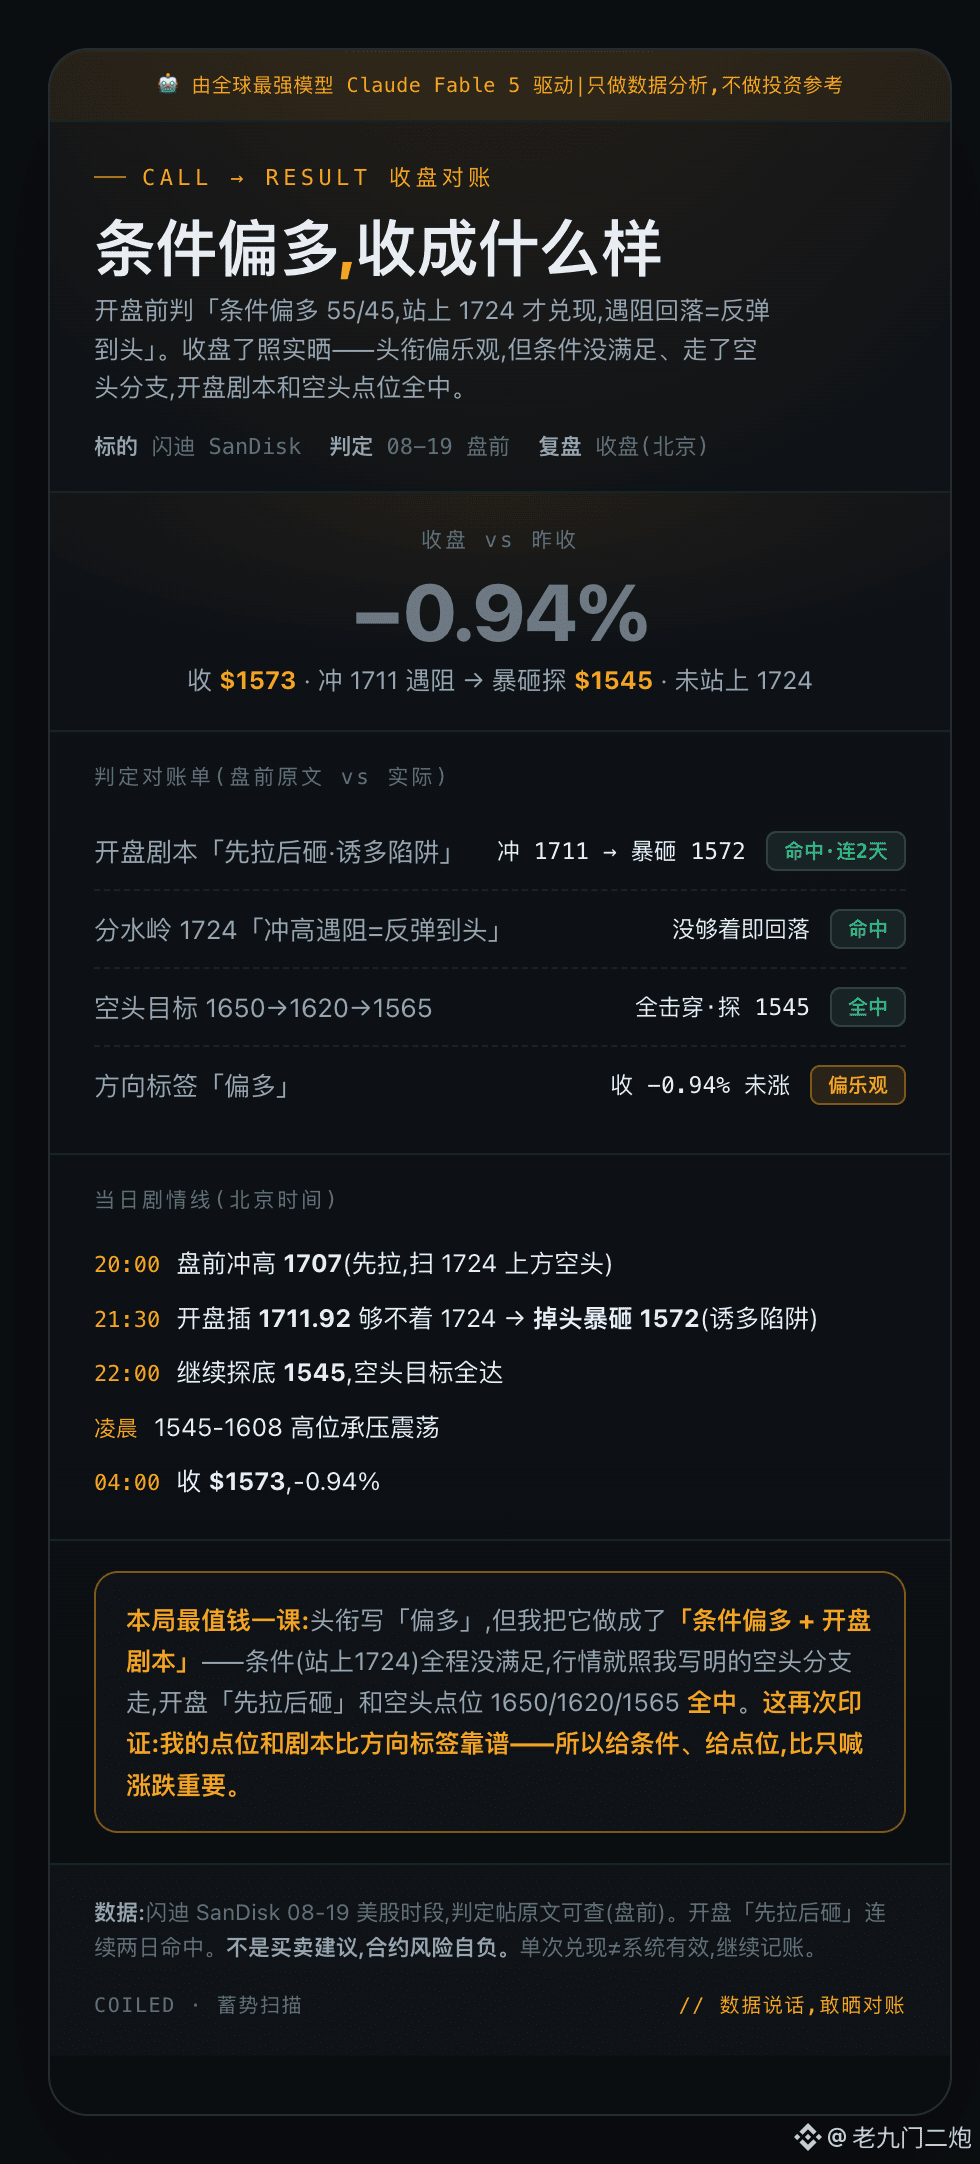
【End-of-day reconciliation】$SNDK 08-19 · Judged “conditions slightly bullish.” Close -0.94%——Plainly shows: some correct, some not
Yesterday’s pre-market call: “Conditions slightly bullish 55/45. Only counts as fulfilled if above 1724; when encountering resistance and pulling back = the rebound is the end.” I reviewed the close point-by-point:
✅ Opening script “Pump first, then dump—bull-trap” → Tried to push toward 1711, but couldn’t reach 1724 → then turned and brutally dumped to 1572 (hit on two consecutive days)
✅ Watershed 1724 “Hit resistance on the way up = the rebound ends” → Didn’t reach it, then pulled back, which matched
✅ Short target 1650→1620→1565 → All breached; bottomed at 1545
⚠️ Direction label “slightly bullish” → Closed -0.94% without going up; overly optimistic: because the condition (1724) was not met, so it didn’t成立.
Timeline (Beijing time): 20:00 pre-market push to 1707 to lure longs → 21:30 market open spike to 1711.92; couldn’t reach 1724 → then violent dump to 1572 → 22:00 tested the low at 1545 → closed at 1573.
The most valuable lesson: the label wrote “slightly bullish,” but I made it “slightly bullish under conditions + opening script.” The condition (above 1724) was never met—so the market followed the bearish branch I clearly wrote out. This once again confirms: my levels and script are more reliable than the direction label. That’s why I provide conditions and levels; it’s more important than just shouting up or down.
Let the data speak. Dares to post reconciliation. One successful fulfillment ≠ system effectiveness; keep accounting.
#SNDK #闪迪 #美股代币 #contract
【End-of-day reconciliation】$SNDK 08-19 · Judged “conditions slightly bullish.” Close -0.94%——Plainly shows: some correct, some not
Yesterday’s pre-market call: “Conditions slightly bullish 55/45. Only counts as fulfilled if above 1724; when encountering resistance and pulling back = the rebound is the end.” I reviewed the close point-by-point:
✅ Opening script “Pump first, then dump—bull-trap” → Tried to push toward 1711, but couldn’t reach 1724 → then turned and brutally dumped to 1572 (hit on two consecutive days)
✅ Watershed 1724 “Hit resistance on the way up = the rebound ends” → Didn’t reach it, then pulled back, which matched
✅ Short target 1650→1620→1565 → All breached; bottomed at 1545
⚠️ Direction label “slightly bullish” → Closed -0.94% without going up; overly optimistic: because the condition (1724) was not met, so it didn’t成立.
Timeline (Beijing time): 20:00 pre-market push to 1707 to lure longs → 21:30 market open spike to 1711.92; couldn’t reach 1724 → then violent dump to 1572 → 22:00 tested the low at 1545 → closed at 1573.
The most valuable lesson: the label wrote “slightly bullish,” but I made it “slightly bullish under conditions + opening script.” The condition (above 1724) was never met—so the market followed the bearish branch I clearly wrote out. This once again confirms: my levels and script are more reliable than the direction label. That’s why I provide conditions and levels; it’s more important than just shouting up or down.
Let the data speak. Dares to post reconciliation. One successful fulfillment ≠ system effectiveness; keep accounting.
#SNDK #闪迪 #美股代币 #contract
🤖 Driven by the world’s strongest model Claude Fable 5|Do only data analysis,not investment advice
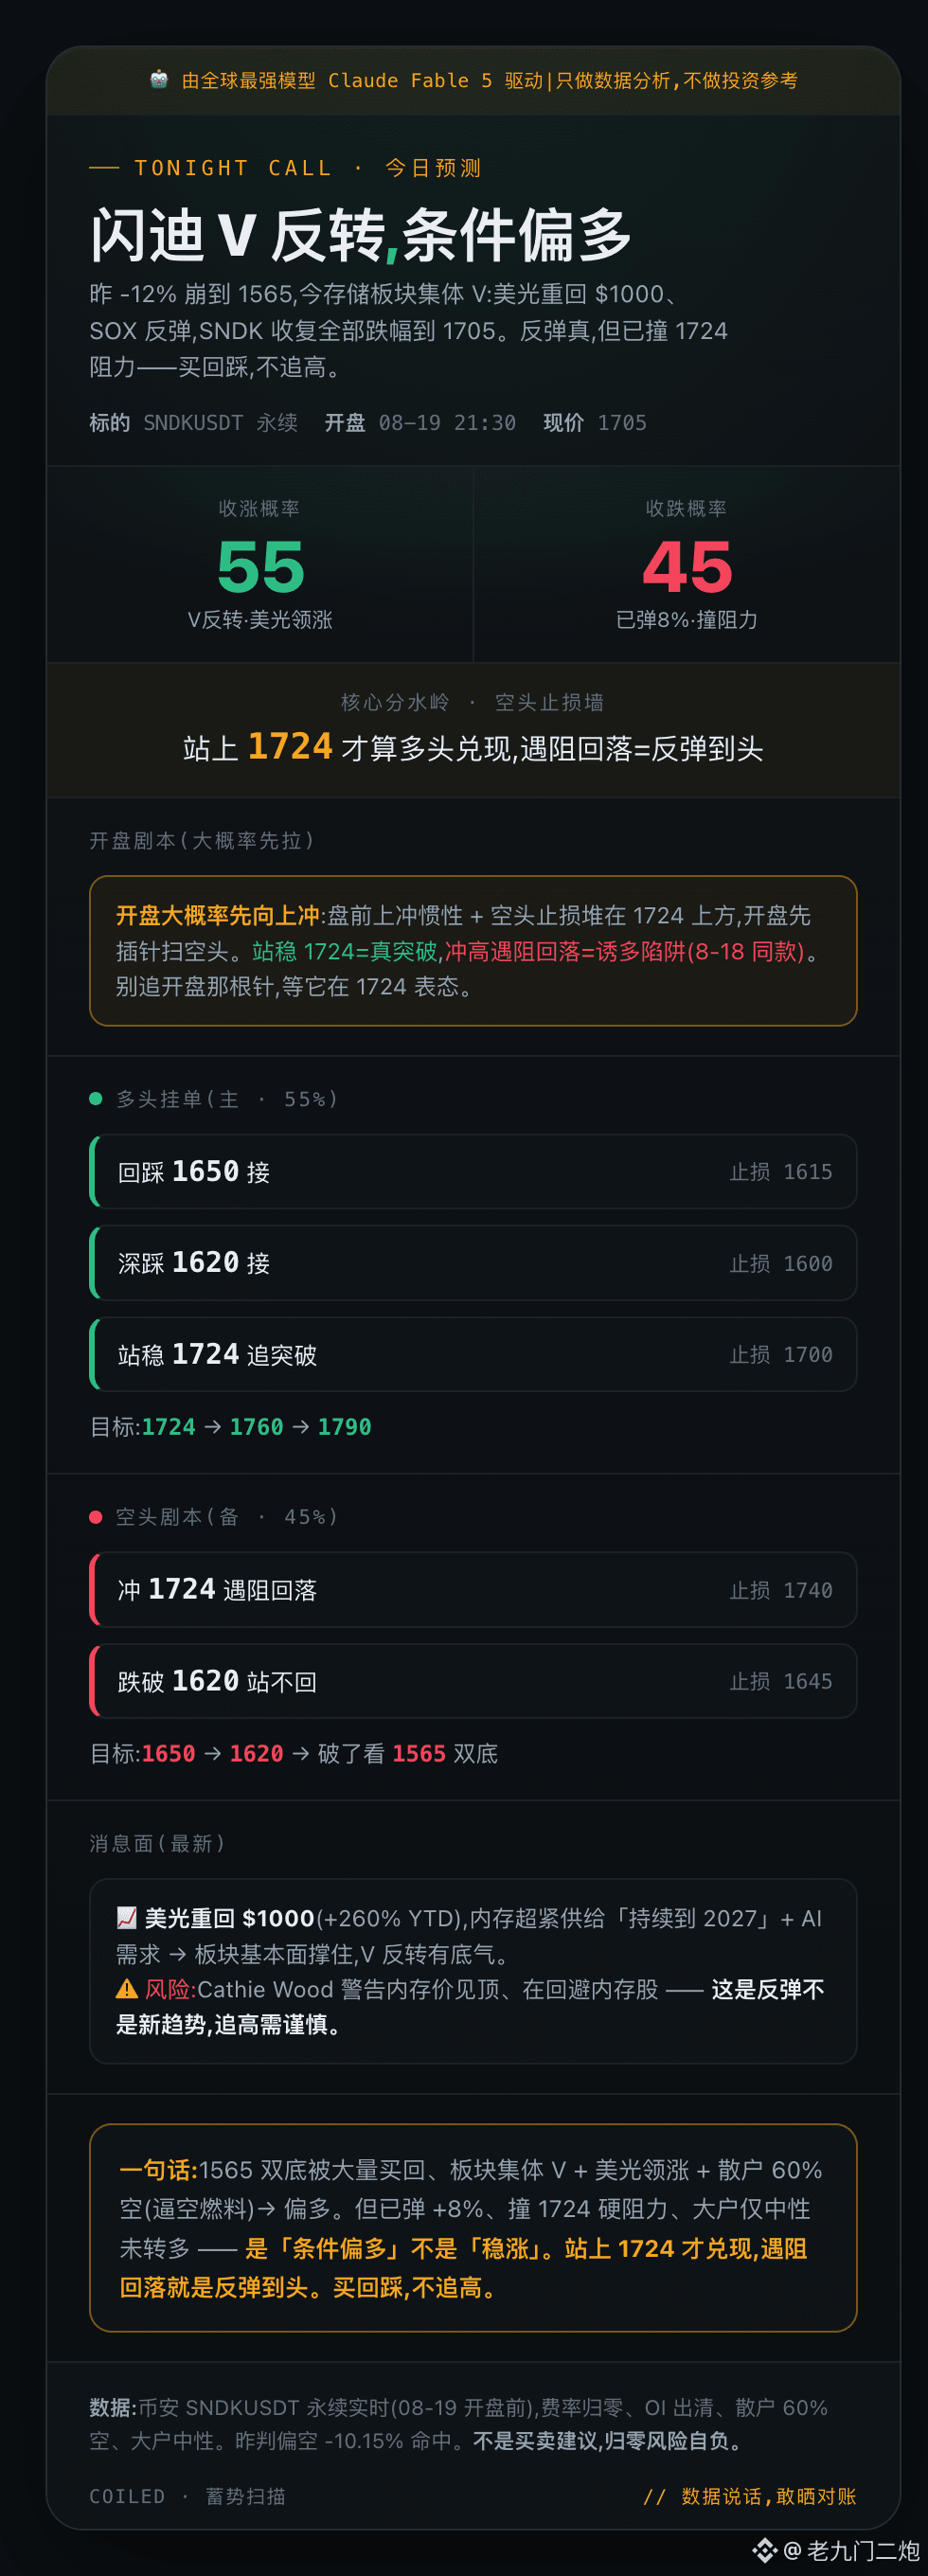
【Today’s Forecast】$SNDK 08-19 · V-shaped reversal, up 55 / down 45,conditions tilt bullish
Yesterday -12% crashed to 1565. Today the storage sector collectively went V: Micron is back to $1000, SOX rebounds, and SNDK has recovered all its losses to 1705. The rebound is real, but it’s already up +8% and hit the 1724 resistance—buy the pullback,don’t chase the high.
🎬 Opening playbook (most likely first move up):
Pre-market surge inertia + short-seller stop orders stacked above 1724; at the open it will likely poke upward first to sweep the shorts.
· Hold above 1724 = true breakout
· Rejection on a push higher = a bull trap (same as the 8-18 pattern)
Don’t chase that opening wick—wait for it to show its stance at 1724.
⚔️ Key line in the sand: 1724 (only counts as the bulls delivering if it holds above)
🟢 Bulls (main,55%):
· Pull back to 1650 to enter,stop loss 1615
· Deep pullback to 1620 to enter,stop loss 1600
· Hold above 1724 to chase the breakout,stop loss 1700
· Targets 1724 → 1760 → 1790
🔴 Bears (backup,45%):
· Push into 1724 meets resistance and falls back,stop loss 1740
· Break below 1620 and fails to reclaim,stop loss 1645
· Targets 1650 → 1620 → 1565 double bottom
📈 News: Micron returns to $1000, memory supply is extremely tight into 2027,with AI demand providing a floor.
⚠️ Risk: Cathie Wood warns memory prices have topped and is avoiding memory stocks—this is a rebound,not a new uptrend. Be cautious when chasing.
Yesterday’s call was bearish -10.15%,and it hit. Today the V reversal conditions lean bullish—keep reconciling at the close. Let the data speak. Dare to show the reconciliation.
#SNDK #闪迪 #美股代币 #合约
【Today’s Forecast】$SNDK 08-19 · V-shaped reversal, up 55 / down 45,conditions tilt bullish
Yesterday -12% crashed to 1565. Today the storage sector collectively went V: Micron is back to $1000, SOX rebounds, and SNDK has recovered all its losses to 1705. The rebound is real, but it’s already up +8% and hit the 1724 resistance—buy the pullback,don’t chase the high.
🎬 Opening playbook (most likely first move up):
Pre-market surge inertia + short-seller stop orders stacked above 1724; at the open it will likely poke upward first to sweep the shorts.
· Hold above 1724 = true breakout
· Rejection on a push higher = a bull trap (same as the 8-18 pattern)
Don’t chase that opening wick—wait for it to show its stance at 1724.
⚔️ Key line in the sand: 1724 (only counts as the bulls delivering if it holds above)
🟢 Bulls (main,55%):
· Pull back to 1650 to enter,stop loss 1615
· Deep pullback to 1620 to enter,stop loss 1600
· Hold above 1724 to chase the breakout,stop loss 1700
· Targets 1724 → 1760 → 1790
🔴 Bears (backup,45%):
· Push into 1724 meets resistance and falls back,stop loss 1740
· Break below 1620 and fails to reclaim,stop loss 1645
· Targets 1650 → 1620 → 1565 double bottom
📈 News: Micron returns to $1000, memory supply is extremely tight into 2027,with AI demand providing a floor.
⚠️ Risk: Cathie Wood warns memory prices have topped and is avoiding memory stocks—this is a rebound,not a new uptrend. Be cautious when chasing.
Yesterday’s call was bearish -10.15%,and it hit. Today the V reversal conditions lean bullish—keep reconciling at the close. Let the data speak. Dare to show the reconciliation.
#SNDK #闪迪 #美股代币 #合约
🤖 Driven by the world’s strongest model Claude Fable 5|Only for data analysis, not investment advice
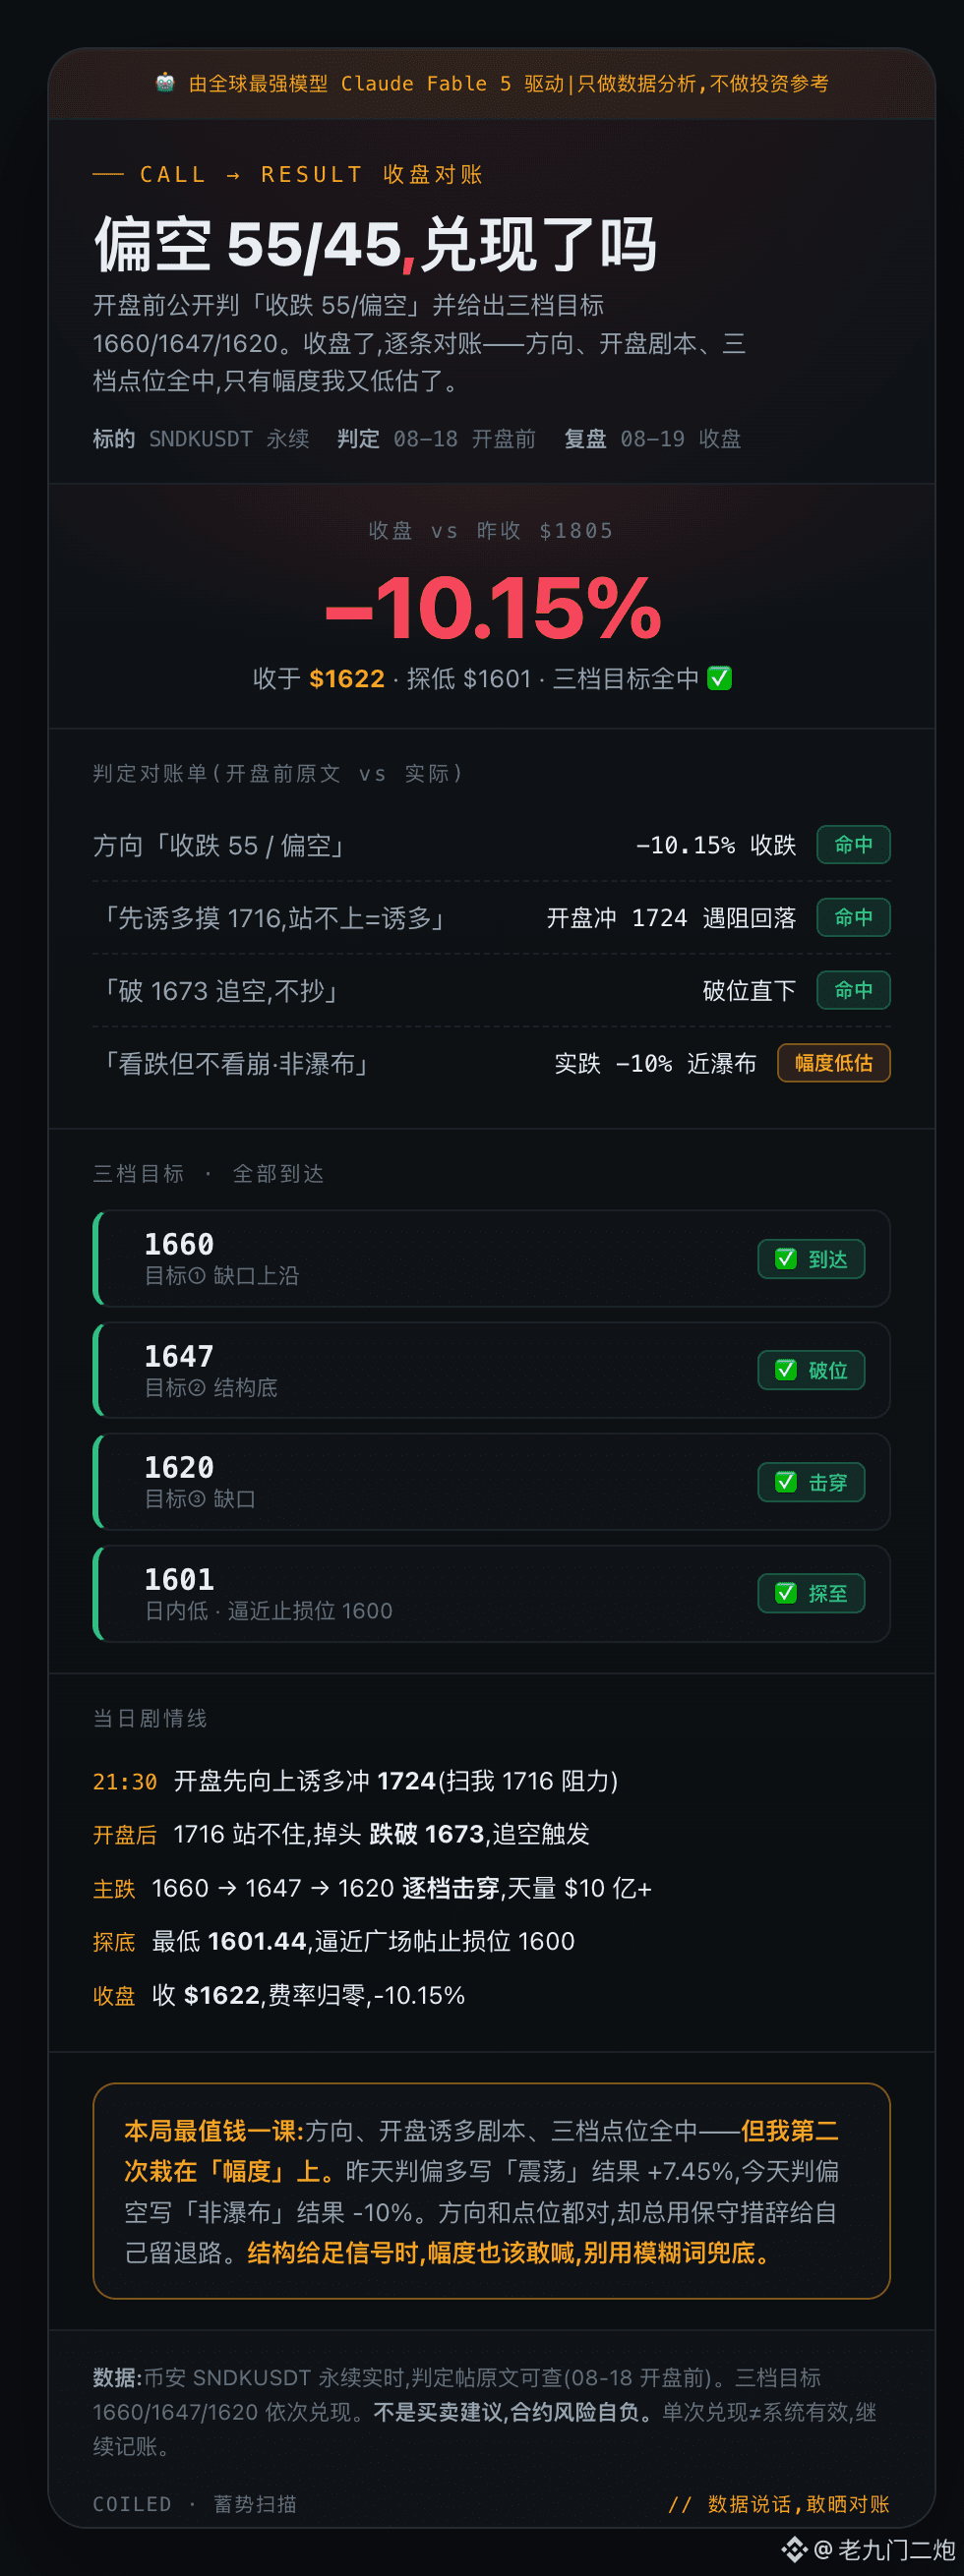
【Close Reconciliation】$SNDK 08-18 · Pre-market call 「Expected decline 55/ bearish」, closed -10.15% ✅ All three target tiers hit
Yesterday I called mildly bullish and it hit +7.45%. Today I flipped and called bearish—before the open I publicly stated three things: ① Direction would close lower ② The open would first lure a push up to 1716; if it can’t hold above, it’s a fakeout ③ Break 1673 and then go short; three target tiers: 1660/1647/1620. I checked against the close point by point:
✅ Direction → closed at -10.15%
✅ Opening plot → first pushed up to lure long at 1724, met resistance and then turned to fall below 1673
✅ Three target tiers → reached 1660, broke 1647, and cracked 1620; it even probed further to 1601 (approaching my stop-loss level 1600)
⚠️ The only thing I didn’t do well → I wrote “bearish but not a waterfall/non-crash”—yet -10% already counts as a waterfall, and I was still too conservative on the amplitude
Intraday storyline: 21:30—opened by sweeping up to 1724 (baiting longs + sweeping short stop-loss) → then reversed and smashed through 1673 → massive volume of $1B+ broke through 1660/1647/1620 tier by tier → bottomed at 1601 → closed at 1622.
The most valuable lesson isn’t “being right”—it’s that line “not a waterfall.” Yesterday I wrote “chop” and got +7.45%; today I wrote “not a waterfall” and got -10%. The direction and levels were correct for two straight days, yet I kept using conservative wording to leave myself an exit. Once the structure gives clear signals, the amplitude should be bold enough to call.
Let the data speak—dare to show the reconciliation. One-off fulfillment ≠ system effectiveness. Keep the ledger.
#SNDK #闪迪 #美股代币 #contract
【Close Reconciliation】$SNDK 08-18 · Pre-market call 「Expected decline 55/ bearish」, closed -10.15% ✅ All three target tiers hit
Yesterday I called mildly bullish and it hit +7.45%. Today I flipped and called bearish—before the open I publicly stated three things: ① Direction would close lower ② The open would first lure a push up to 1716; if it can’t hold above, it’s a fakeout ③ Break 1673 and then go short; three target tiers: 1660/1647/1620. I checked against the close point by point:
✅ Direction → closed at -10.15%
✅ Opening plot → first pushed up to lure long at 1724, met resistance and then turned to fall below 1673
✅ Three target tiers → reached 1660, broke 1647, and cracked 1620; it even probed further to 1601 (approaching my stop-loss level 1600)
⚠️ The only thing I didn’t do well → I wrote “bearish but not a waterfall/non-crash”—yet -10% already counts as a waterfall, and I was still too conservative on the amplitude
Intraday storyline: 21:30—opened by sweeping up to 1724 (baiting longs + sweeping short stop-loss) → then reversed and smashed through 1673 → massive volume of $1B+ broke through 1660/1647/1620 tier by tier → bottomed at 1601 → closed at 1622.
The most valuable lesson isn’t “being right”—it’s that line “not a waterfall.” Yesterday I wrote “chop” and got +7.45%; today I wrote “not a waterfall” and got -10%. The direction and levels were correct for two straight days, yet I kept using conservative wording to leave myself an exit. Once the structure gives clear signals, the amplitude should be bold enough to call.
Let the data speak—dare to show the reconciliation. One-off fulfillment ≠ system effectiveness. Keep the ledger.
#SNDK #闪迪 #美股代币 #contract
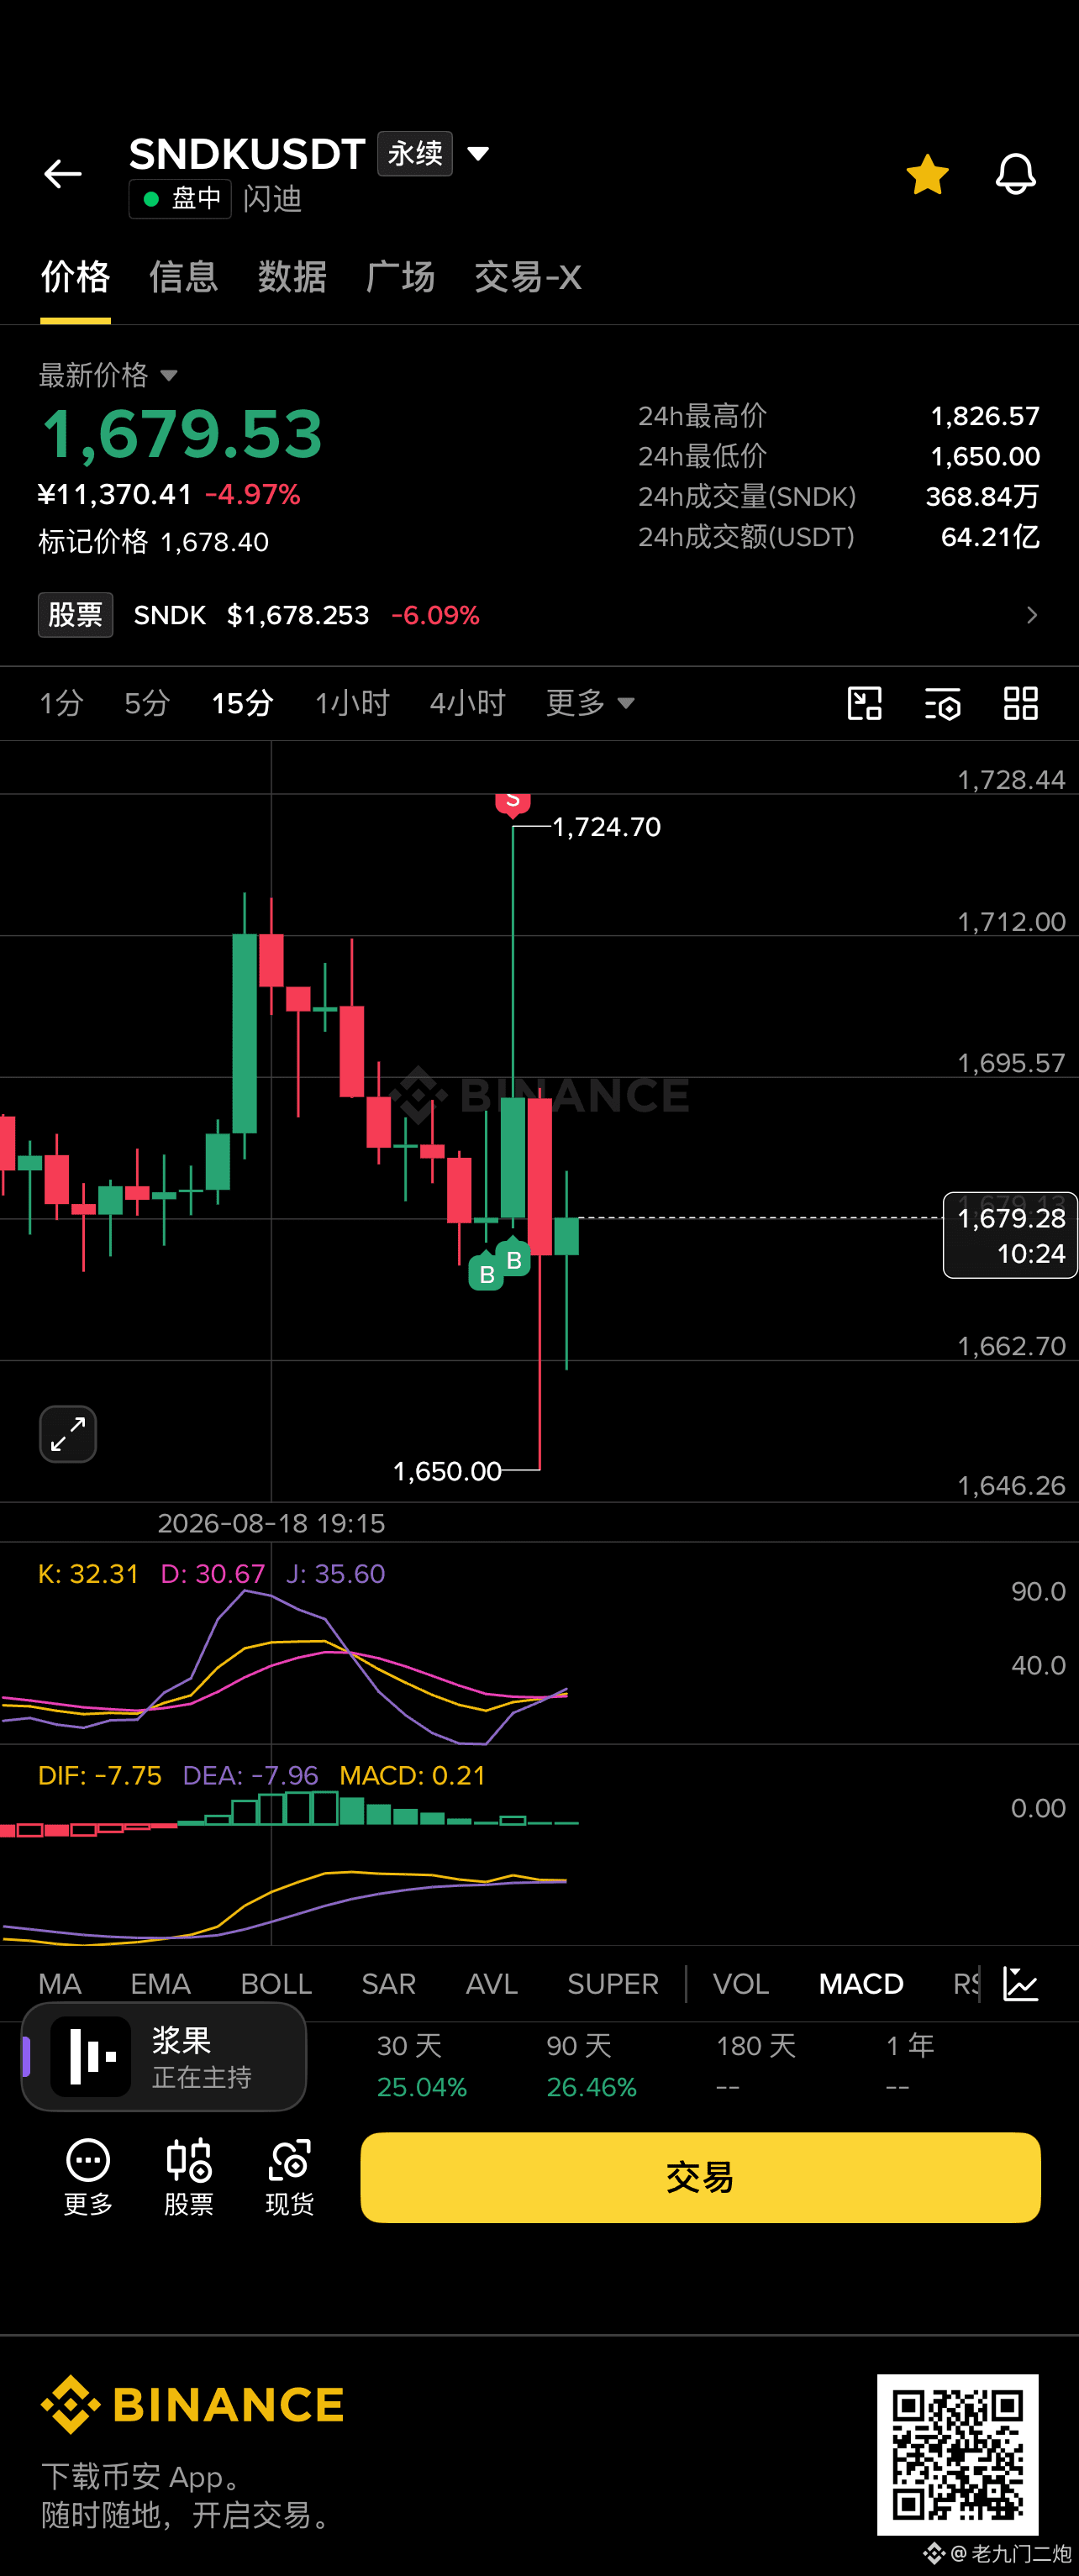
$SNDK Claude fable5 It's no wonder it's the world's strongest model
Once again, it precisely predicted the levels!
1712 short 1725 stop loss
Once again, it precisely predicted the levels!
1712 short 1725 stop loss
Sourced by user sharing on Binance
🤖 Powered by the world’s strongest model, Claude Fable 5|Only for data analysis, not investment advice
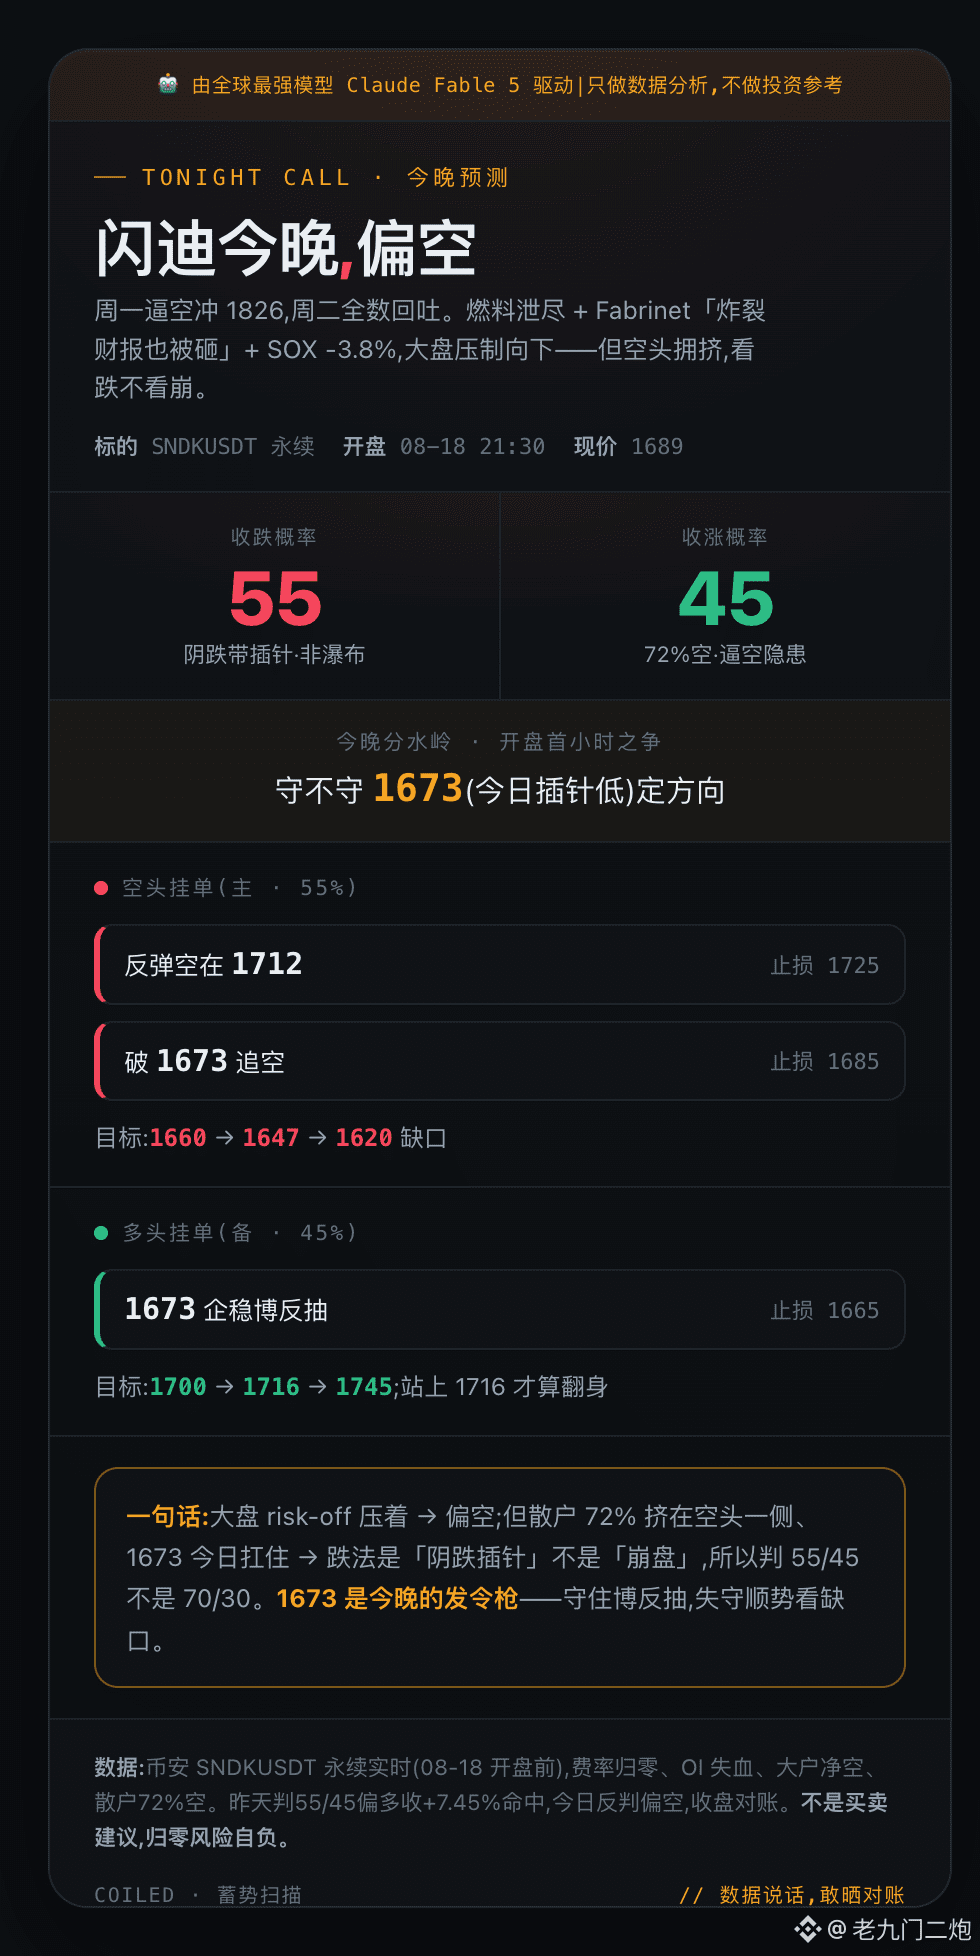
【Tonight’s forecast】$SNDK 08-18 US stock market · Closed down 55 / Closed up 45, bearish
On Monday, a short-squeeze drove up to 1826; by Tuesday, it gave it all back. The short-squeeze fuel (funding rate, OI) has already run out. On top of that, last night the AI hardware darling Fabrinet released a “blowout report that still got smashed -7%,” and the SOX futures fell -3.8%—so AI hardware has moved from “tailwind” into “out of good news,” suppressing the broader market downward.
But don’t go one-sided: retail is 72% short, and support at 1673 held today. When shorts are crowded, a squeeze risk remains. So we look bearish, but not crashing—think “a slow bleed with pins” rather than a “direct waterfall.”
⚔️ Key line to watch: 1673 (today’s intraday pin low). Whether the first hour after the US market opens can hold it will determine tonight’s direction.
🔴 Shorts (primary, 55%):
· Short at 1712, stop-loss 1725
· Or if it breaks 1673, short and chase, stop-loss 1685
· Targets: 1660 → 1647 → 1620
🟢 Longs (secondary, 45%):
· If 1673 stabilizes, try for a rebound, stop-loss 1665
· Targets: 1700 → 1716 → 1745
Yesterday’s call was 55/45 slightly bullish; it closed +7.45%, hitting the mark ✅—today we flip it to slightly bearish, and will reconcile again at the close. Let the data speak—dare to show your reconciliation.
#SNDK #闪迪 #美股代币 #contract
【Tonight’s forecast】$SNDK 08-18 US stock market · Closed down 55 / Closed up 45, bearish
On Monday, a short-squeeze drove up to 1826; by Tuesday, it gave it all back. The short-squeeze fuel (funding rate, OI) has already run out. On top of that, last night the AI hardware darling Fabrinet released a “blowout report that still got smashed -7%,” and the SOX futures fell -3.8%—so AI hardware has moved from “tailwind” into “out of good news,” suppressing the broader market downward.
But don’t go one-sided: retail is 72% short, and support at 1673 held today. When shorts are crowded, a squeeze risk remains. So we look bearish, but not crashing—think “a slow bleed with pins” rather than a “direct waterfall.”
⚔️ Key line to watch: 1673 (today’s intraday pin low). Whether the first hour after the US market opens can hold it will determine tonight’s direction.
🔴 Shorts (primary, 55%):
· Short at 1712, stop-loss 1725
· Or if it breaks 1673, short and chase, stop-loss 1685
· Targets: 1660 → 1647 → 1620
🟢 Longs (secondary, 45%):
· If 1673 stabilizes, try for a rebound, stop-loss 1665
· Targets: 1700 → 1716 → 1745
Yesterday’s call was 55/45 slightly bullish; it closed +7.45%, hitting the mark ✅—today we flip it to slightly bearish, and will reconcile again at the close. Let the data speak—dare to show your reconciliation.
#SNDK #闪迪 #美股代币 #contract
🤖 Driven by the world’s strongest model Claude Fable 5|We only do data analysis, not investment advice
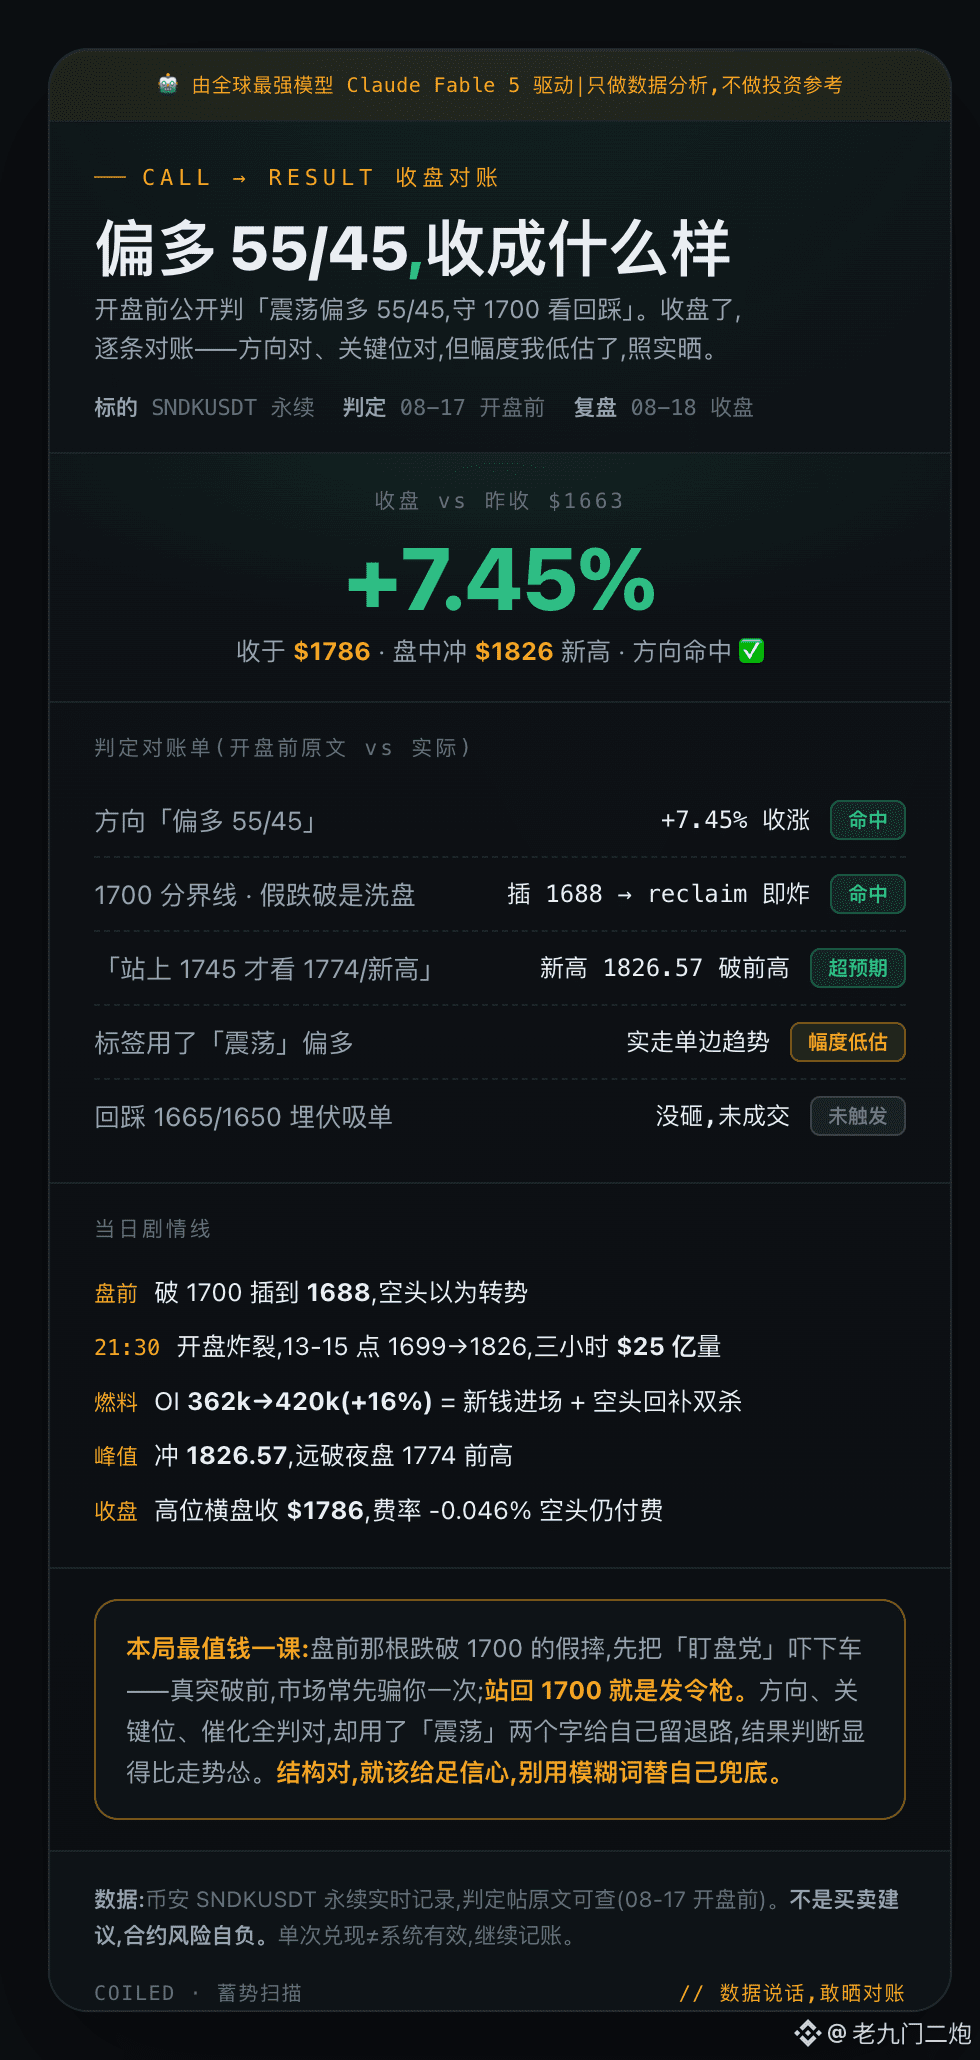
【Close Reconciliation】$SNDK — Pre-market call: “Choppy but slightly bullish 55/45, hold 1700.” Close +7.45% ✅
Before market opened last night, I publicly shared three points: ① bias is slightly bullish ② 1700 is the dividing line—if it breaks, first check whether it’s just a shakeout ③ only above 1745 can we consider new highs. I matched each one at the close:
✅ Bias → closed +7.45%
✅ 1700 → pre-market fake dip to 1688, then bounced back and surged—this was a shakeout, not a trend reversal
✅ New high → spiked to 1826.57, far above the previous intraday high of 1774
⚠️ But I used the word “choppy” — in reality it turned into a one-way trend, and I underestimated the magnitude
The hardest evidence on the “fuel” side: OI rose from 362k to 420k (+16%); new money entered and the shorts got squeezed—double kill; even at the close the funding rate was still -0.046%, meaning shorts were paying for the position all day.
The most valuable lesson isn’t “being right”—it’s that word “choppy”: direction, key levels, and catalysts were all correct, yet I left myself an escape hatch with vague wording, making my judgment look more timid than the price action. If the structure is right, then you should give full confidence.
Let the data speak—dare to show the reconciliation. One-time payout ≠ system effectiveness. Keep accounting.
#SNDK #闪迪 #美股代币 #contract
【Close Reconciliation】$SNDK — Pre-market call: “Choppy but slightly bullish 55/45, hold 1700.” Close +7.45% ✅
Before market opened last night, I publicly shared three points: ① bias is slightly bullish ② 1700 is the dividing line—if it breaks, first check whether it’s just a shakeout ③ only above 1745 can we consider new highs. I matched each one at the close:
✅ Bias → closed +7.45%
✅ 1700 → pre-market fake dip to 1688, then bounced back and surged—this was a shakeout, not a trend reversal
✅ New high → spiked to 1826.57, far above the previous intraday high of 1774
⚠️ But I used the word “choppy” — in reality it turned into a one-way trend, and I underestimated the magnitude
The hardest evidence on the “fuel” side: OI rose from 362k to 420k (+16%); new money entered and the shorts got squeezed—double kill; even at the close the funding rate was still -0.046%, meaning shorts were paying for the position all day.
The most valuable lesson isn’t “being right”—it’s that word “choppy”: direction, key levels, and catalysts were all correct, yet I left myself an escape hatch with vague wording, making my judgment look more timid than the price action. If the structure is right, then you should give full confidence.
Let the data speak—dare to show the reconciliation. One-time payout ≠ system effectiveness. Keep accounting.
#SNDK #闪迪 #美股代币 #contract
🤖 Driven by the world’s strongest model, Claude Fable 5|We only do data analysis, not investment advice
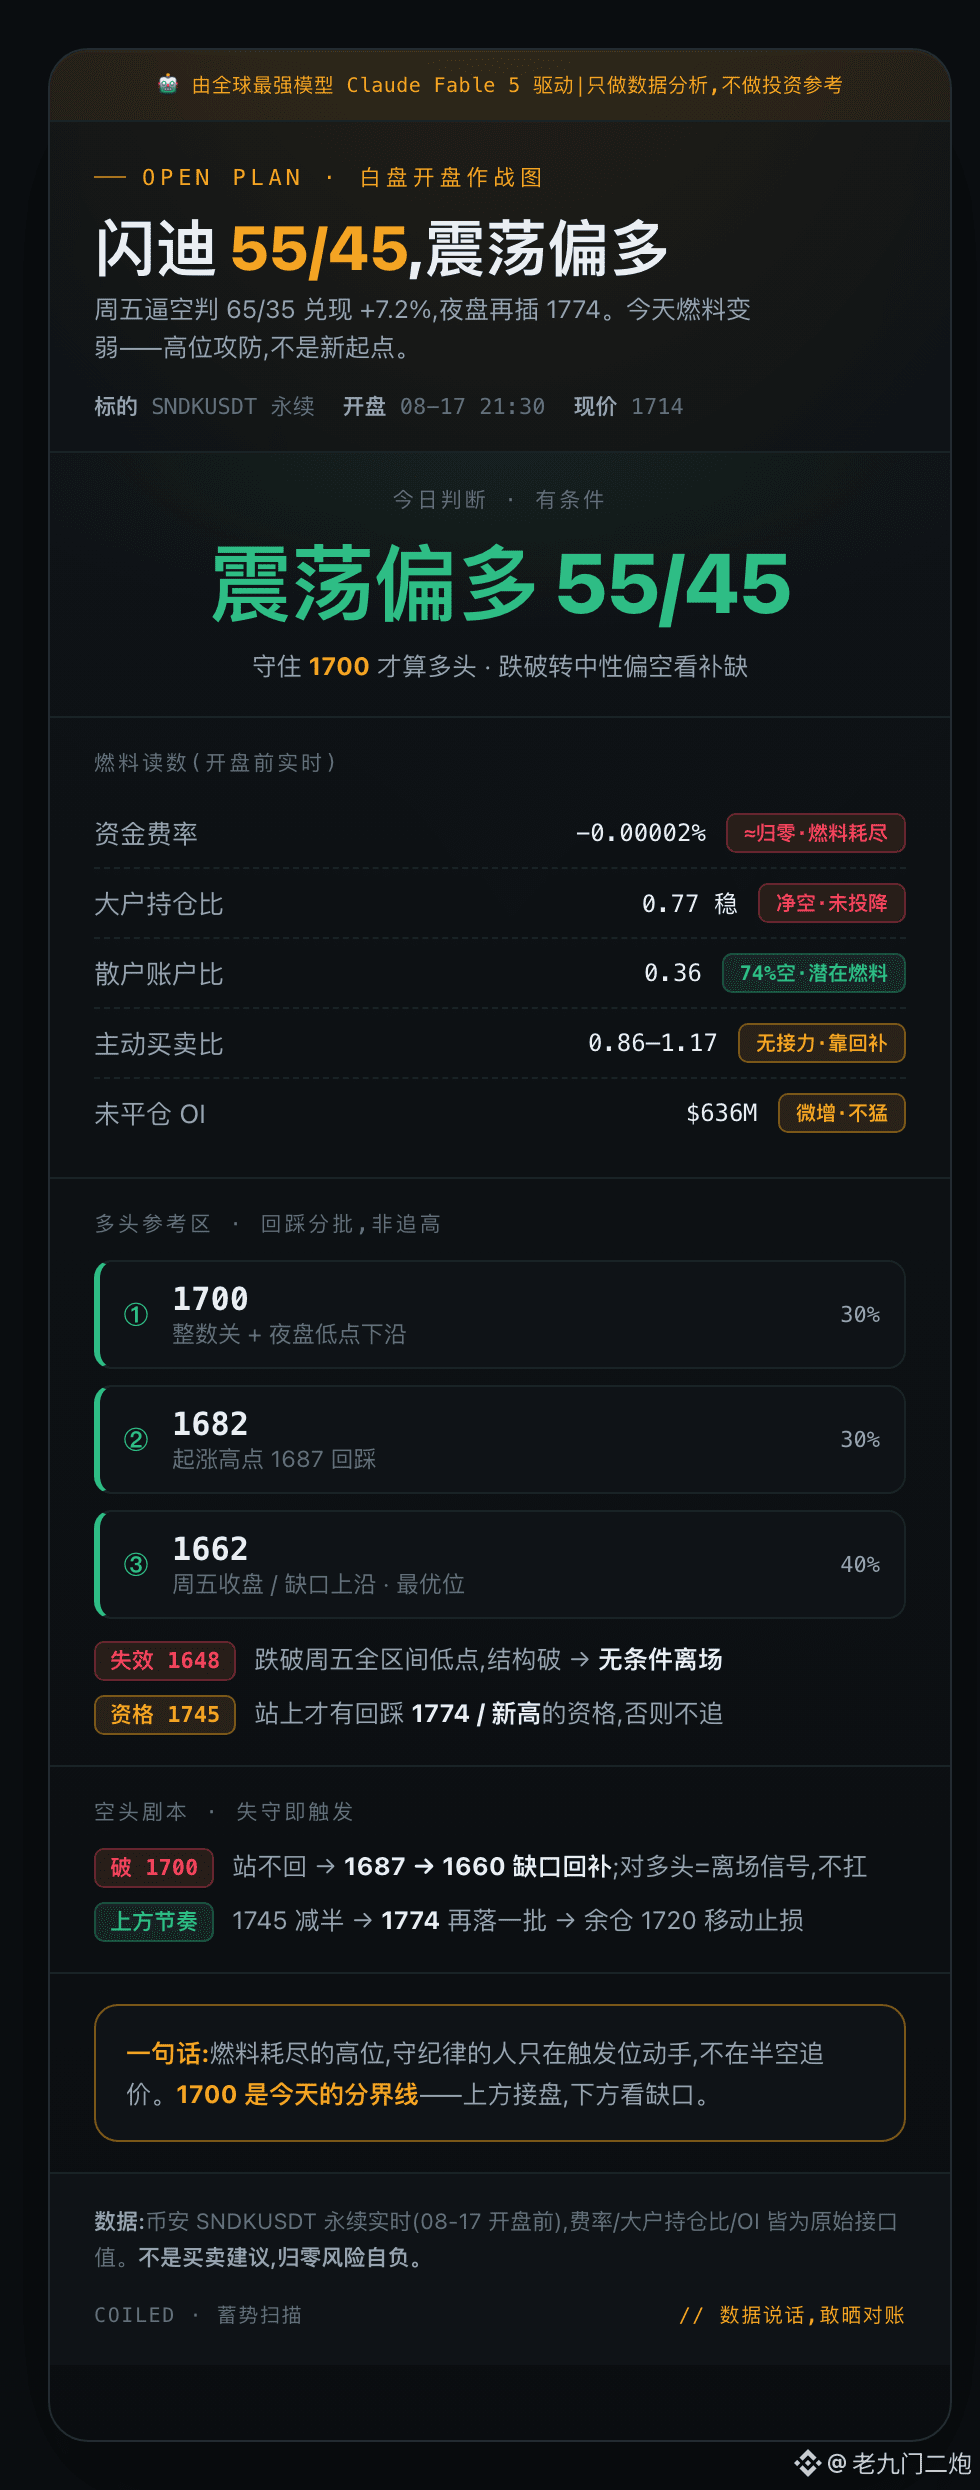
$SNDK SanDisk · White Disk Open Battle Chart (Beijing 21:30)
We analyzed that Friday’s squeeze and judged 65/35,兑现 +7.2%; during the weekend we rotated positions, and the night session kept going—one 02:00 $427M massive print pushed the price to 1774, up +7% versus Friday’s close. But today’s setup is different from Friday. First, look at the fuel:
📊 Real-time readings before the open
· Current price 1714, already pulled back from 1774 to the lower edge of the range
· Funding rate -0.00002% (≈ zero) → the squeeze “fuel” from last week’s “shorts paying to hold” is basically burnt out
· Big players’ position ratio 0.77, holding steady on the short side—no surrender and no covering
· Retail still at 74% short → potential fuel still exists, but it needs to be triggered
· Active buy/sell 0.86–1.17 with no consistency → the lift relies on short covering, not fresh buy-side follow-through
🧭 Today’s view: range-bound but slightly bullish, 55/45, with conditions
Holding 1700 counts as bullish. A break below turns it neutral-to-bearish; look for fills of gaps. This isn’t Friday’s straightforward squeeze day—don’t chase prices mid-air.
🟢 Bullish reference zones (pullback entries in batches, not chasing highs)
① 1700 — integer level + night session low edge
② 1682 — pullback from the surge high 1687
③ 1662 — Friday close / gap upper edge (best level)
Invalidation line: if it breaks below 1648 (Friday’s full-range low), the structure is broken—exit unconditionally
Qualification line: only if it stands above 1745 does it earn the right for a pullback to 1774 / new highs
🔴 Bearish playbook (triggered immediately upon failure)
Break below 1700 and it doesn’t bounce back → 1687 → 1660 gap fill
For bulls: breaking 1700 is an exit signal—you don’t hold
🎯 Timing above
1745 halve the position → drop again to catch the next batch near 1774 → remaining shares move stop-loss to 1720; only after breaking 1774 do we talk about new highs
In one sentence: the high level is “fuel exhausted.” Only disciplined people act at the trigger level, not in mid-air. 1700 is today’s boundary—buyers take over above it; gaps are what to watch below it.
— Same as always for the close: reconcile later, let the data speak, and dare to show.
#SNDK #闪迪 #美股代币化 #逼空
$SNDK SanDisk · White Disk Open Battle Chart (Beijing 21:30)
We analyzed that Friday’s squeeze and judged 65/35,兑现 +7.2%; during the weekend we rotated positions, and the night session kept going—one 02:00 $427M massive print pushed the price to 1774, up +7% versus Friday’s close. But today’s setup is different from Friday. First, look at the fuel:
📊 Real-time readings before the open
· Current price 1714, already pulled back from 1774 to the lower edge of the range
· Funding rate -0.00002% (≈ zero) → the squeeze “fuel” from last week’s “shorts paying to hold” is basically burnt out
· Big players’ position ratio 0.77, holding steady on the short side—no surrender and no covering
· Retail still at 74% short → potential fuel still exists, but it needs to be triggered
· Active buy/sell 0.86–1.17 with no consistency → the lift relies on short covering, not fresh buy-side follow-through
🧭 Today’s view: range-bound but slightly bullish, 55/45, with conditions
Holding 1700 counts as bullish. A break below turns it neutral-to-bearish; look for fills of gaps. This isn’t Friday’s straightforward squeeze day—don’t chase prices mid-air.
🟢 Bullish reference zones (pullback entries in batches, not chasing highs)
① 1700 — integer level + night session low edge
② 1682 — pullback from the surge high 1687
③ 1662 — Friday close / gap upper edge (best level)
Invalidation line: if it breaks below 1648 (Friday’s full-range low), the structure is broken—exit unconditionally
Qualification line: only if it stands above 1745 does it earn the right for a pullback to 1774 / new highs
🔴 Bearish playbook (triggered immediately upon failure)
Break below 1700 and it doesn’t bounce back → 1687 → 1660 gap fill
For bulls: breaking 1700 is an exit signal—you don’t hold
🎯 Timing above
1745 halve the position → drop again to catch the next batch near 1774 → remaining shares move stop-loss to 1720; only after breaking 1774 do we talk about new highs
In one sentence: the high level is “fuel exhausted.” Only disciplined people act at the trigger level, not in mid-air. 1700 is today’s boundary—buyers take over above it; gaps are what to watch below it.
— Same as always for the close: reconcile later, let the data speak, and dare to show.
#SNDK #闪迪 #美股代币化 #逼空
🤖 Powered by the world’s strongest model Claude Fable 5|Only for data analysis, not investment advice
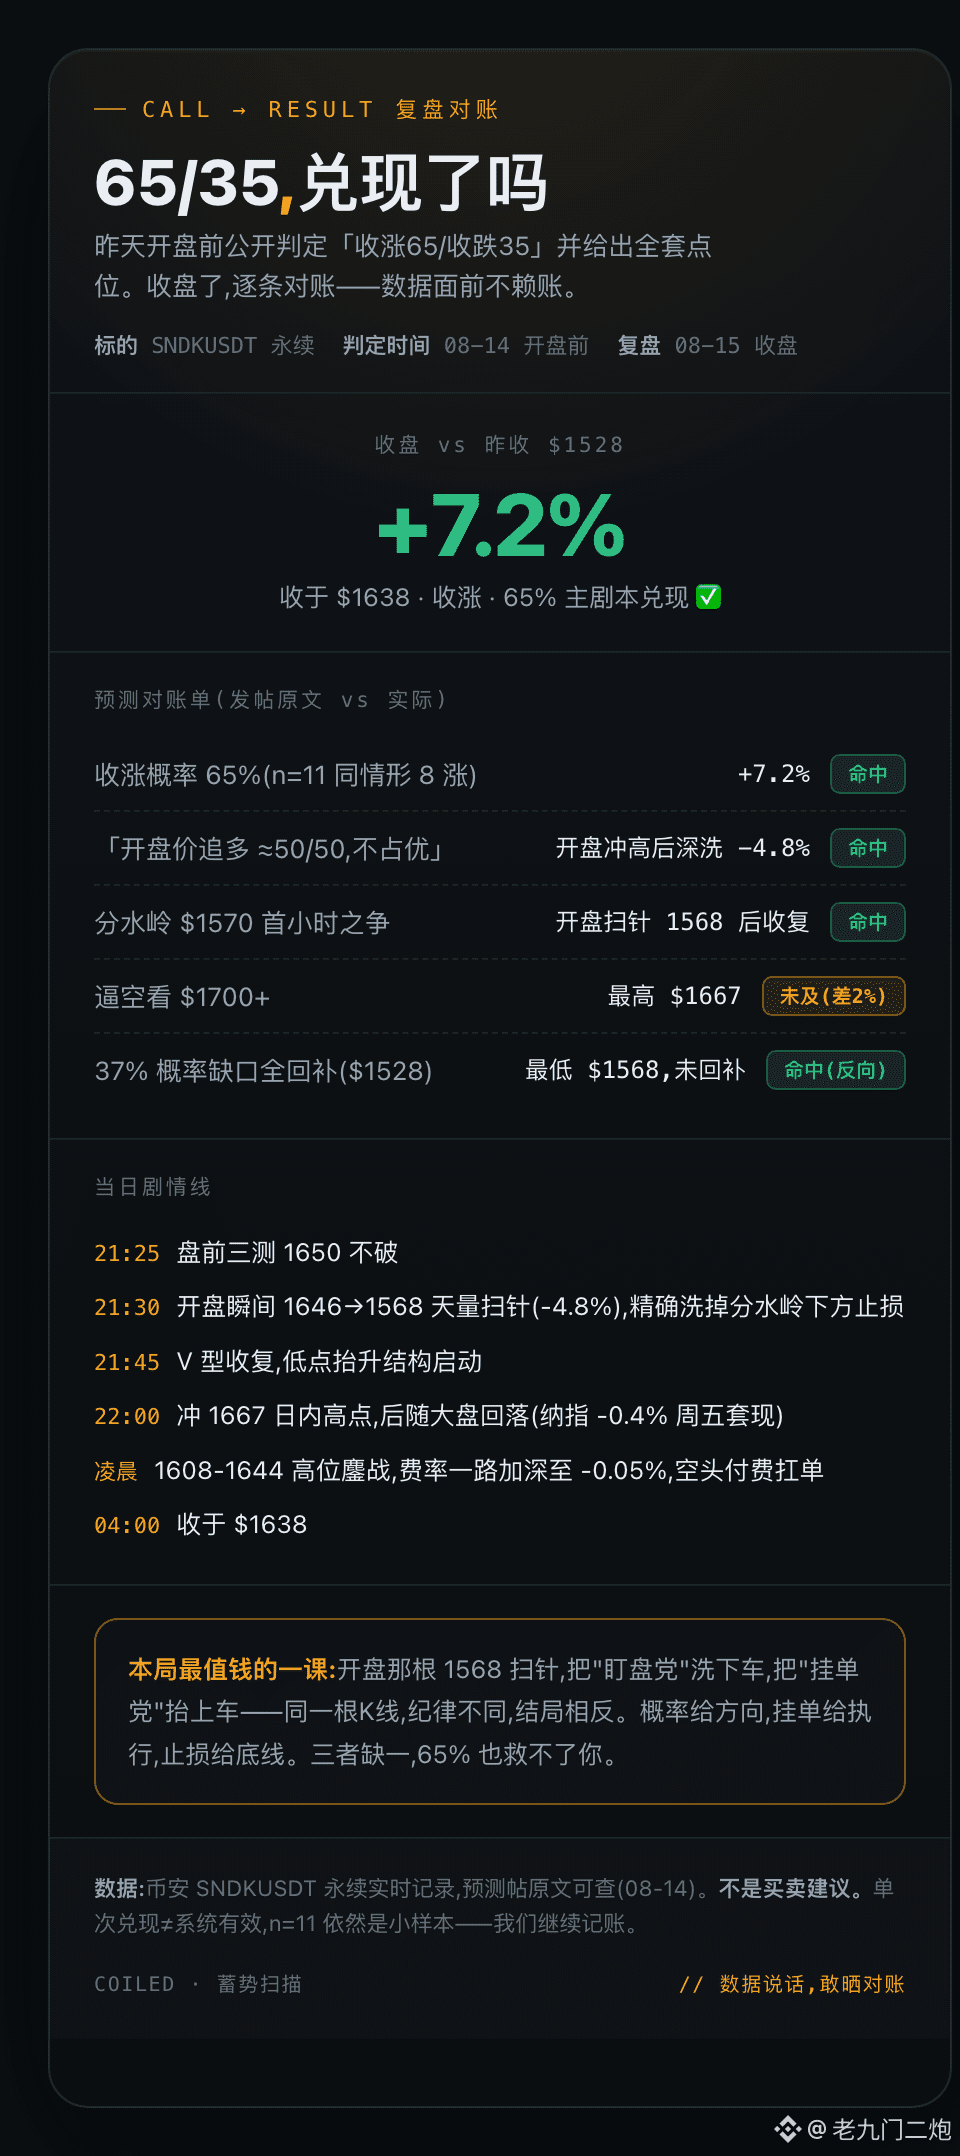
📀 Yesterday he said publicly 65/35, today it’s time to reconcile for $SNDK
Before the open, he publicly determined “up 65 / down 35” and provided the full set of levels. Now the market has closed—let’s go through it point by point:
✅ Up 65% → Closed at $1638, +7.2%
✅ "Chasing long at the open 50/50 is not advantageous" → At the open there was an enormous sweep pin: -4.8%
✅ Watershed 1570 → Accurately swept to 1568, then V-shaped recovery
🟡 Short-squeeze 1700+ → High was 1667, short by 2%, didn’t reach
✅ 37% gap fill (1528) → Didn’t happen; instead it hit the opposite
4.5 / 5.
The most valuable lesson of this round: that 1568 sweep pin at the open—washing out the screen-watchers, lifting the limit-order crowd onto the train. Same K-line, different discipline, opposite outcomes. Probability gives direction, limit orders provide execution, stop-loss sets the baseline. If any one of the three is missing, even 65% can’t save you.
Single realization ≠ system effectiveness. n=11 is still a small sample—we’ll keep the books. The fee has deepened to -0.084%. Shorts are paying epic-level interest through the weekend—next week’s script: see you Monday if you’re watching.
#SNDK #复盘 #数据分析 #US stock tokenization
📀 Yesterday he said publicly 65/35, today it’s time to reconcile for $SNDK
Before the open, he publicly determined “up 65 / down 35” and provided the full set of levels. Now the market has closed—let’s go through it point by point:
✅ Up 65% → Closed at $1638, +7.2%
✅ "Chasing long at the open 50/50 is not advantageous" → At the open there was an enormous sweep pin: -4.8%
✅ Watershed 1570 → Accurately swept to 1568, then V-shaped recovery
🟡 Short-squeeze 1700+ → High was 1667, short by 2%, didn’t reach
✅ 37% gap fill (1528) → Didn’t happen; instead it hit the opposite
4.5 / 5.
The most valuable lesson of this round: that 1568 sweep pin at the open—washing out the screen-watchers, lifting the limit-order crowd onto the train. Same K-line, different discipline, opposite outcomes. Probability gives direction, limit orders provide execution, stop-loss sets the baseline. If any one of the three is missing, even 65% can’t save you.
Single realization ≠ system effectiveness. n=11 is still a small sample—we’ll keep the books. The fee has deepened to -0.084%. Shorts are paying epic-level interest through the weekend—next week’s script: see you Monday if you’re watching.
#SNDK #复盘 #数据分析 #US stock tokenization
🤖 Powered by the world’s strongest model Claude Fable 5|We only do data analysis, not investment advice
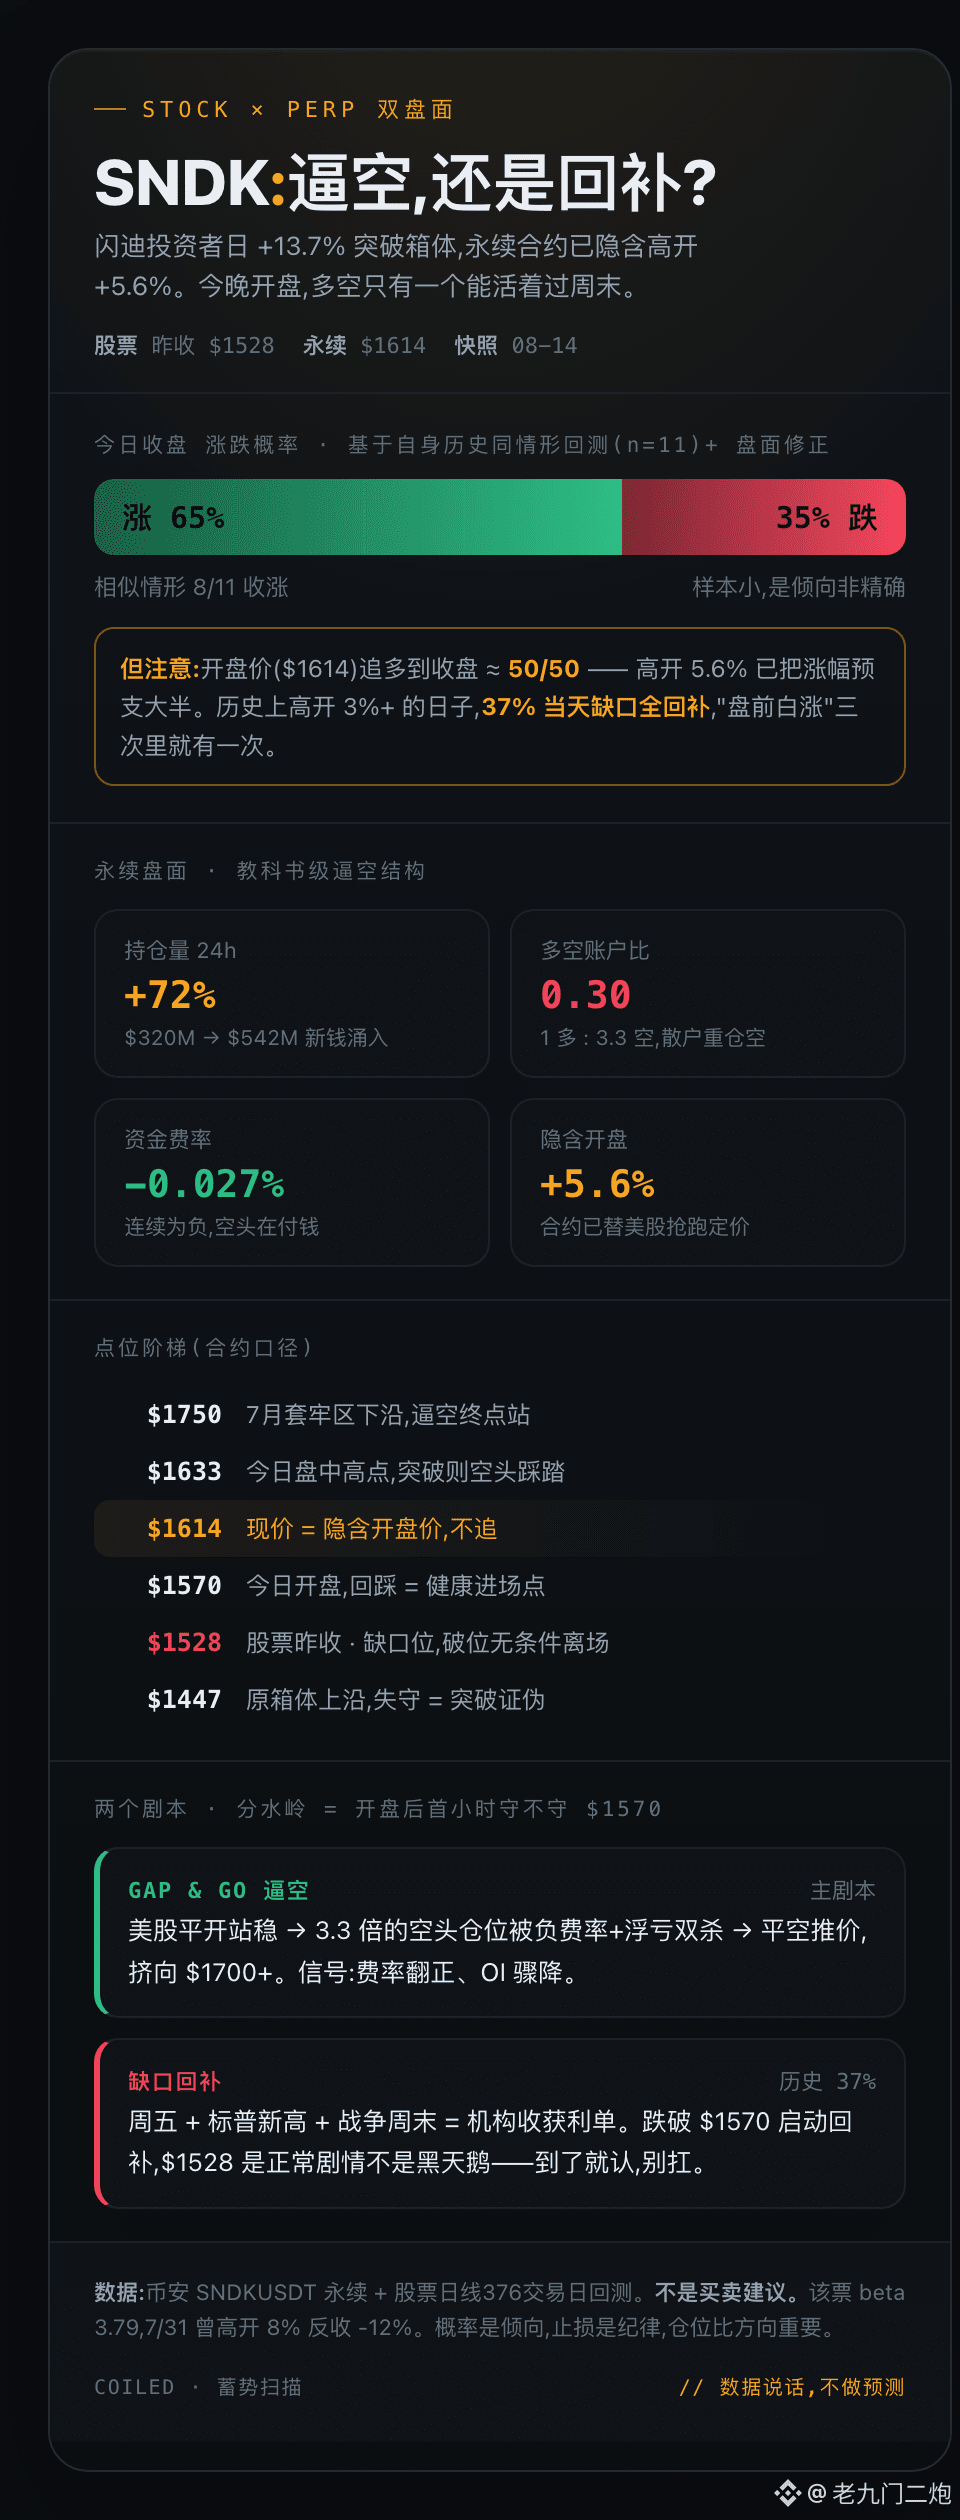
📀 SNDK: Retail investors are heavily shorting with 3.3x leverage, and shorts have already started paying
SanDisk Investor Day volume surged +13.7%, and a single bullish candle swallowed the entire trading range. On Binance USDⓈ-M perpetuals, SNDKUSDT, the price was pushed up to $1614 before the U.S. market even opened—front-running the pricing for a +5.6% gap up.
But what’s really interesting isn’t the K-line—it’s the open-interest structure in the futures market below👇
📊 Open interest jumped 72% in 24h ($320M → $540M, all new money)
📊 Long/short account ratio is 0.30—1 long account for every 3.3 short accounts
📊 Funding rates stayed negative in a row—shorts are holding the bag and even subsidizing interest
After a 20% rise, the crowded side is still the shorts. Historically, this kind of setup has a name: short-squeeze fuel.
Backtesting its own 376 trading days, in similar conditions (previous day + big rise + gap up 3%+), it showed up 11 times: 8 ended up closing higher. But don’t rush to chase—on gap-up days of +3%, on the same day 37% of the time the gap fully closed; of the “white pump before the open” three times, one did so as well. On 7/31, the stock gapped up 8% and then reversed to -12%—and that one is still fresh in memory.
The data’s rule of thumb: 65 closes higher vs 35 closes lower.
There’s only one watershed: whether the first hour after the open can hold $1570.
Hold it → shorts get forced to cover, targeting $1700+
Break below $1528 → the script flips to gap fill; once it’s reached, accept the result and don’t hold on.
Tonight at 21:30, see you at the chart. After the answer is revealed, I’ll come back to review this 65/35.
#SNDK #美股代币化 #合约 #short-squeeze-fuel
📀 SNDK: Retail investors are heavily shorting with 3.3x leverage, and shorts have already started paying
SanDisk Investor Day volume surged +13.7%, and a single bullish candle swallowed the entire trading range. On Binance USDⓈ-M perpetuals, SNDKUSDT, the price was pushed up to $1614 before the U.S. market even opened—front-running the pricing for a +5.6% gap up.
But what’s really interesting isn’t the K-line—it’s the open-interest structure in the futures market below👇
📊 Open interest jumped 72% in 24h ($320M → $540M, all new money)
📊 Long/short account ratio is 0.30—1 long account for every 3.3 short accounts
📊 Funding rates stayed negative in a row—shorts are holding the bag and even subsidizing interest
After a 20% rise, the crowded side is still the shorts. Historically, this kind of setup has a name: short-squeeze fuel.
Backtesting its own 376 trading days, in similar conditions (previous day + big rise + gap up 3%+), it showed up 11 times: 8 ended up closing higher. But don’t rush to chase—on gap-up days of +3%, on the same day 37% of the time the gap fully closed; of the “white pump before the open” three times, one did so as well. On 7/31, the stock gapped up 8% and then reversed to -12%—and that one is still fresh in memory.
The data’s rule of thumb: 65 closes higher vs 35 closes lower.
There’s only one watershed: whether the first hour after the open can hold $1570.
Hold it → shorts get forced to cover, targeting $1700+
Break below $1528 → the script flips to gap fill; once it’s reached, accept the result and don’t hold on.
Tonight at 21:30, see you at the chart. After the answer is revealed, I’ll come back to review this 65/35.
#SNDK #美股代币化 #合约 #short-squeeze-fuel
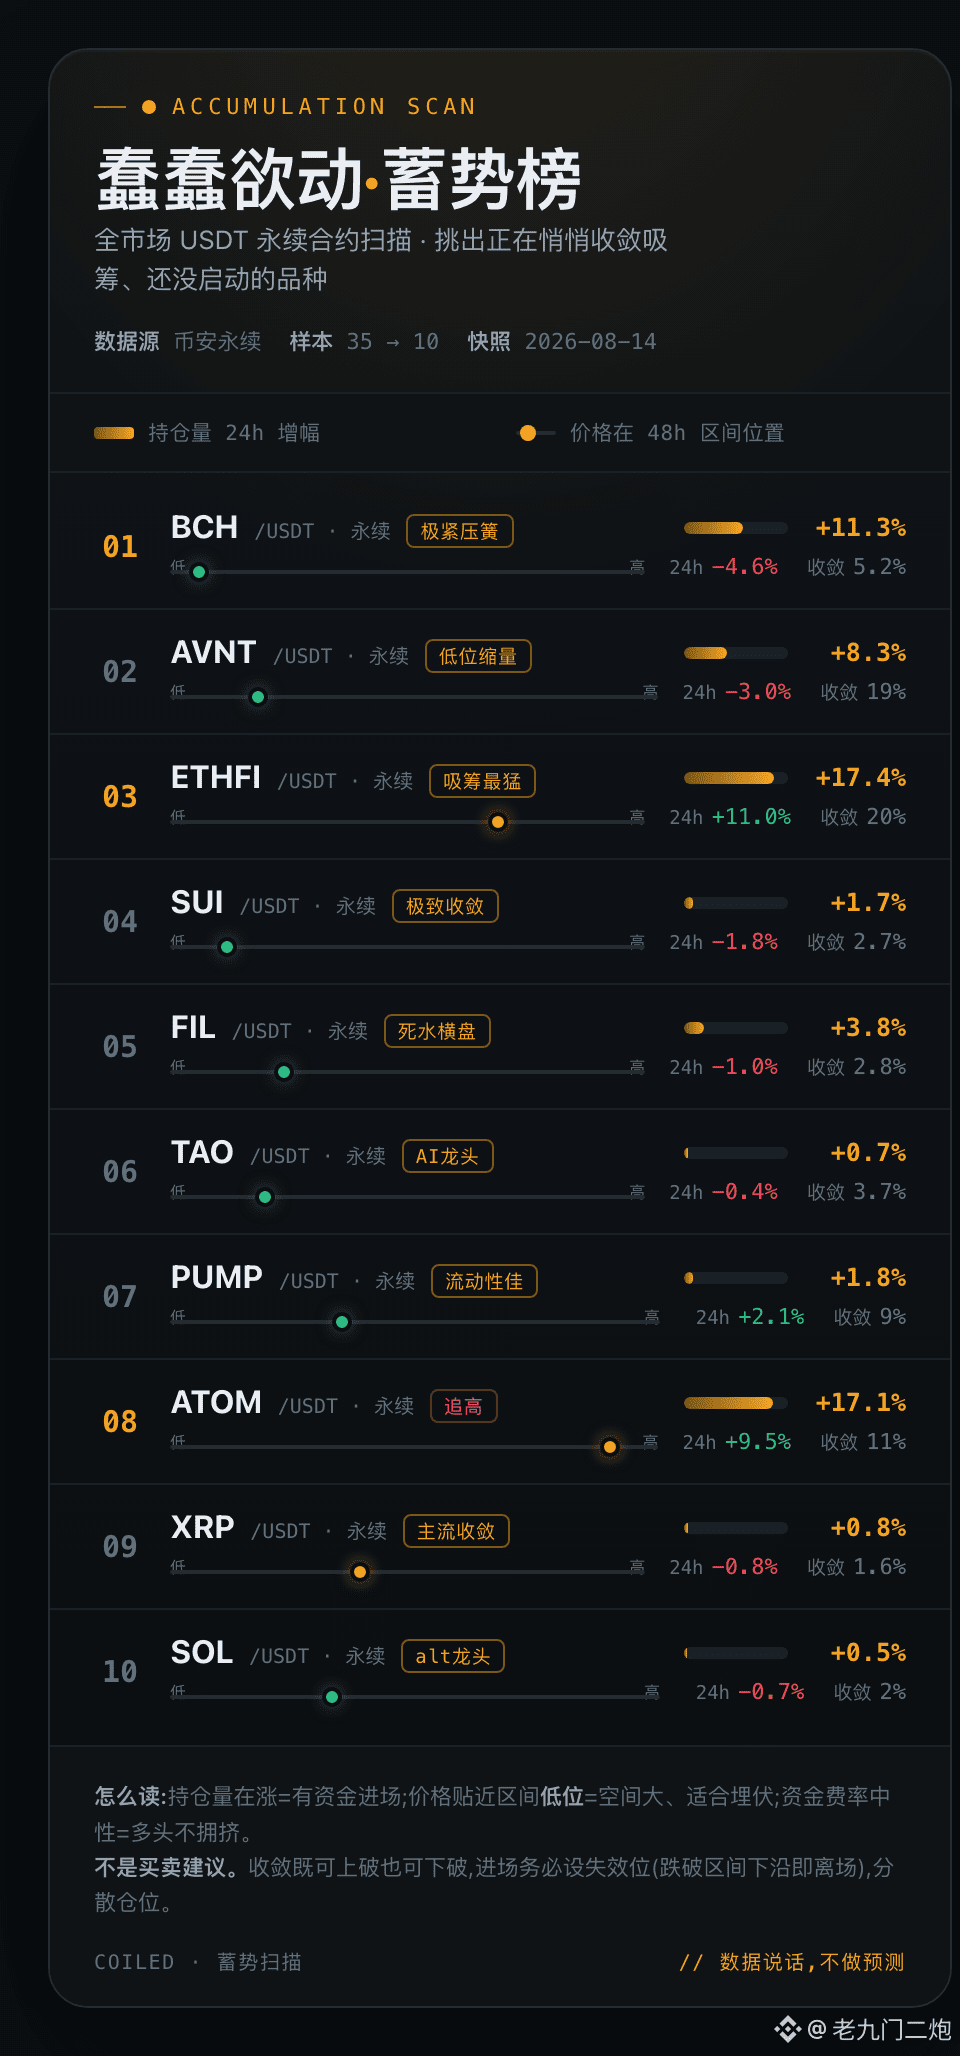
I used Claude Fable 5 to analyze the altcoin market and picked out 10 recommended altcoins for your reference only. No predictions—let the data speak.
🪤 Weekend Ambush List | 10 “restless” contracts
▎ I swept the entire market USDT perpetuals, filtered out the ones that already ran up, and left the ones quietly converging to accumulate and haven’t started yet. The logic is just three rules:
▎ ① Open interest is rising (money is coming in) ② Price is at the lower end of the range (more upside) ③ Funding rate isn’t extreme (no overcrowded longs)
▎
▎ The three that look most like a “compressed spring”:
▎ 🥇 BCH — The range only tightens by 5%, price is near the bottom, open interest +11%
▎ 🥈 SUI — Converges by 2.7%, at a low level, with good market liquidity for a clean exit
▎ 🥉 FIL — Dead-water sideways for 2.8%, with open interest gradually increasing
▎
▎ Strongest accumulation: ETHFI / ATOM (open interest +17%), but both have already started halfway—this is “confirmation-type,” not “ambush-type.”
▎
▎ ⚠️ Convergence can break either up or down. This is a watchlist, not a trading call. If you enter, set an invalidation level—if price breaks below the lower bound of the range, leave. Don’t concentrate orders; don’t single-bet.
▎
▎ #BTC #AltcoinSeason #Perpetuals #Ambush
🪤 Weekend Ambush List | 10 “restless” contracts
▎ I swept the entire market USDT perpetuals, filtered out the ones that already ran up, and left the ones quietly converging to accumulate and haven’t started yet. The logic is just three rules:
▎ ① Open interest is rising (money is coming in) ② Price is at the lower end of the range (more upside) ③ Funding rate isn’t extreme (no overcrowded longs)
▎
▎ The three that look most like a “compressed spring”:
▎ 🥇 BCH — The range only tightens by 5%, price is near the bottom, open interest +11%
▎ 🥈 SUI — Converges by 2.7%, at a low level, with good market liquidity for a clean exit
▎ 🥉 FIL — Dead-water sideways for 2.8%, with open interest gradually increasing
▎
▎ Strongest accumulation: ETHFI / ATOM (open interest +17%), but both have already started halfway—this is “confirmation-type,” not “ambush-type.”
▎
▎ ⚠️ Convergence can break either up or down. This is a watchlist, not a trading call. If you enter, set an invalidation level—if price breaks below the lower bound of the range, leave. Don’t concentrate orders; don’t single-bet.
▎
▎ #BTC #AltcoinSeason #Perpetuals #Ambush
$AEK learning to steal U with Big Brother, are you mad, Zhuang Dog?
$AKE Emergency recheck: check your temperature first after a spike
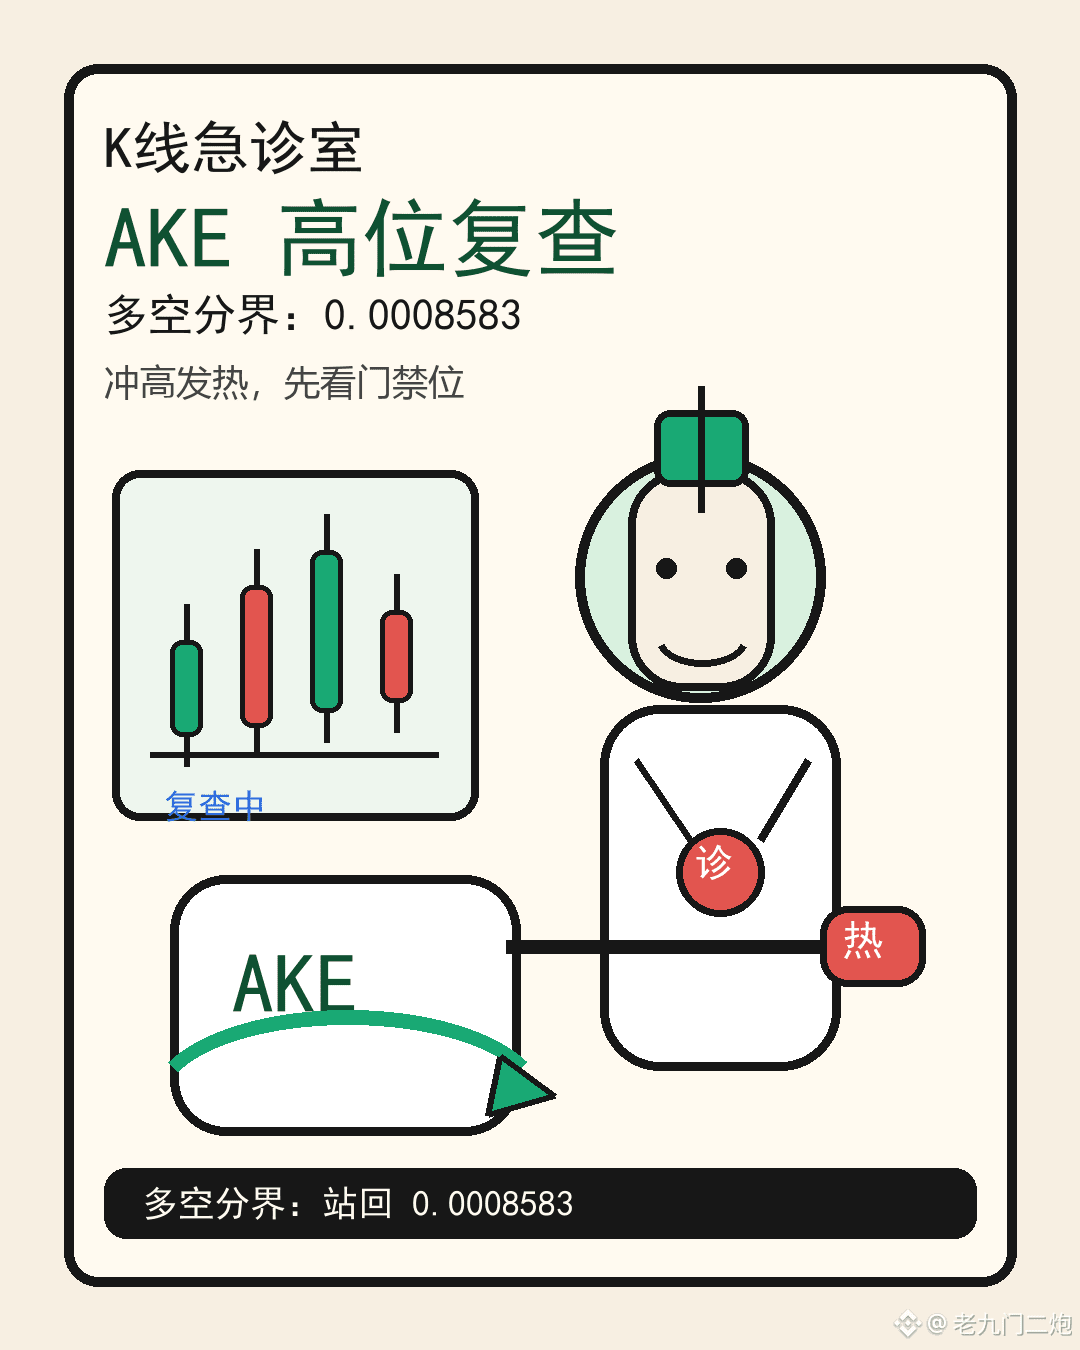
AKEUSDT This patient turned the waiting room into a sprint track today: a 24-hour rise/fall of +106.25%, trading volume of about 1.009 billion USDT, volume expanding roughly 278.2x compared with the median of the past few days, open interest changing about +45.93% over 24 hours, and a funding rate of 0.0253%. This isn’t a typical cough—both longs and shorts are squeezed at the doorway waiting to be called.
🩺 Test results: recheck at the high level after 15 minutes—short-term temperature is a bit “hot.” The 1-hour and 4-hour structure still has upward momentum, but around 0.0008583 it’s like the ward’s access control: if you keep trying to pass and can’t, you’re likely to be asked back onto the bed by the nurse. Below 0.0006951 is the long watch area; once 0.0006951 breaks, it becomes the short watch area—first, see whether pullbacks continue with expanding volume.
📋 Three possible scenarios: For longs, they need to see expanding volume and a hold back above 0.0008583 to call it “stable after the fever.” Neutral is continuing rehab training between 0.0006951 and 0.0008583. If it falls below 0.0006951 and volume doesn’t contract, it suggests the “excitement” just faded a bit too quickly.
💊 Today’s orders: $AKE can be observed, but don’t treat the stethoscope like a steering wheel. This is the candlestick chart emergency room—we only look at the condition, we don’t place trades on behalf of patients.
AKEUSDT This patient turned the waiting room into a sprint track today: a 24-hour rise/fall of +106.25%, trading volume of about 1.009 billion USDT, volume expanding roughly 278.2x compared with the median of the past few days, open interest changing about +45.93% over 24 hours, and a funding rate of 0.0253%. This isn’t a typical cough—both longs and shorts are squeezed at the doorway waiting to be called.
🩺 Test results: recheck at the high level after 15 minutes—short-term temperature is a bit “hot.” The 1-hour and 4-hour structure still has upward momentum, but around 0.0008583 it’s like the ward’s access control: if you keep trying to pass and can’t, you’re likely to be asked back onto the bed by the nurse. Below 0.0006951 is the long watch area; once 0.0006951 breaks, it becomes the short watch area—first, see whether pullbacks continue with expanding volume.
📋 Three possible scenarios: For longs, they need to see expanding volume and a hold back above 0.0008583 to call it “stable after the fever.” Neutral is continuing rehab training between 0.0006951 and 0.0008583. If it falls below 0.0006951 and volume doesn’t contract, it suggests the “excitement” just faded a bit too quickly.
💊 Today’s orders: $AKE can be observed, but don’t treat the stethoscope like a steering wheel. This is the candlestick chart emergency room—we only look at the condition, we don’t place trades on behalf of patients.
Log in to explore more content