
Gold 800
1k Posts

Gold 800
Report
Block User
لا جدران أمام الاحلام 👊
202 Following
218 Followers
185 Liked
Posts
All
Quotes
·
--
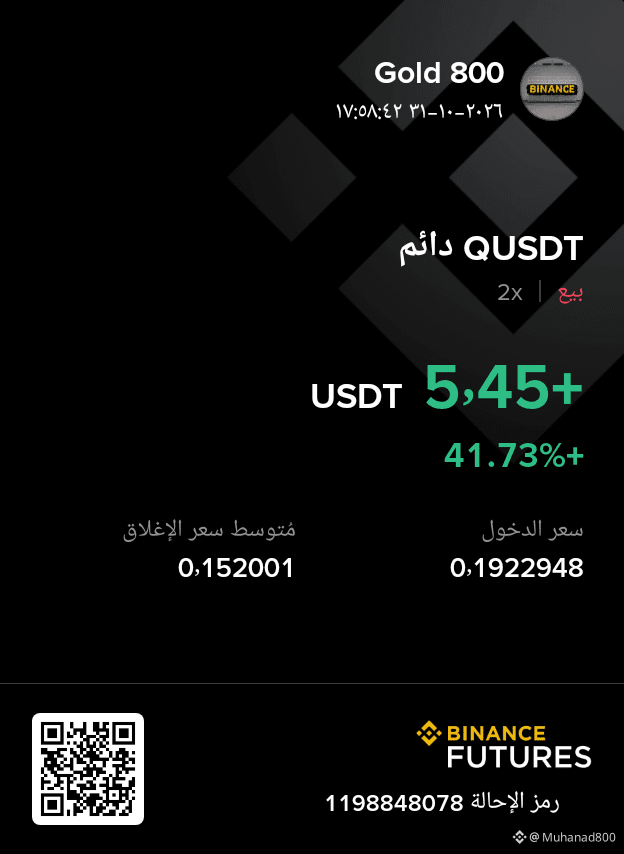
2
3
843

·
--
Bearish
No buying from now on.....
In these stormy conditions, we must be content with watching..
$BTC
$ETH
$XRP
{spot}(INTCBUSDT)
No buying from now on.....
In these stormy conditions, we must be content with watching..
$BTC
$ETH
$XRP
In these stormy conditions, we must be content with watching..
$BTC
$ETH
$XRP

202
·
--
Bullish
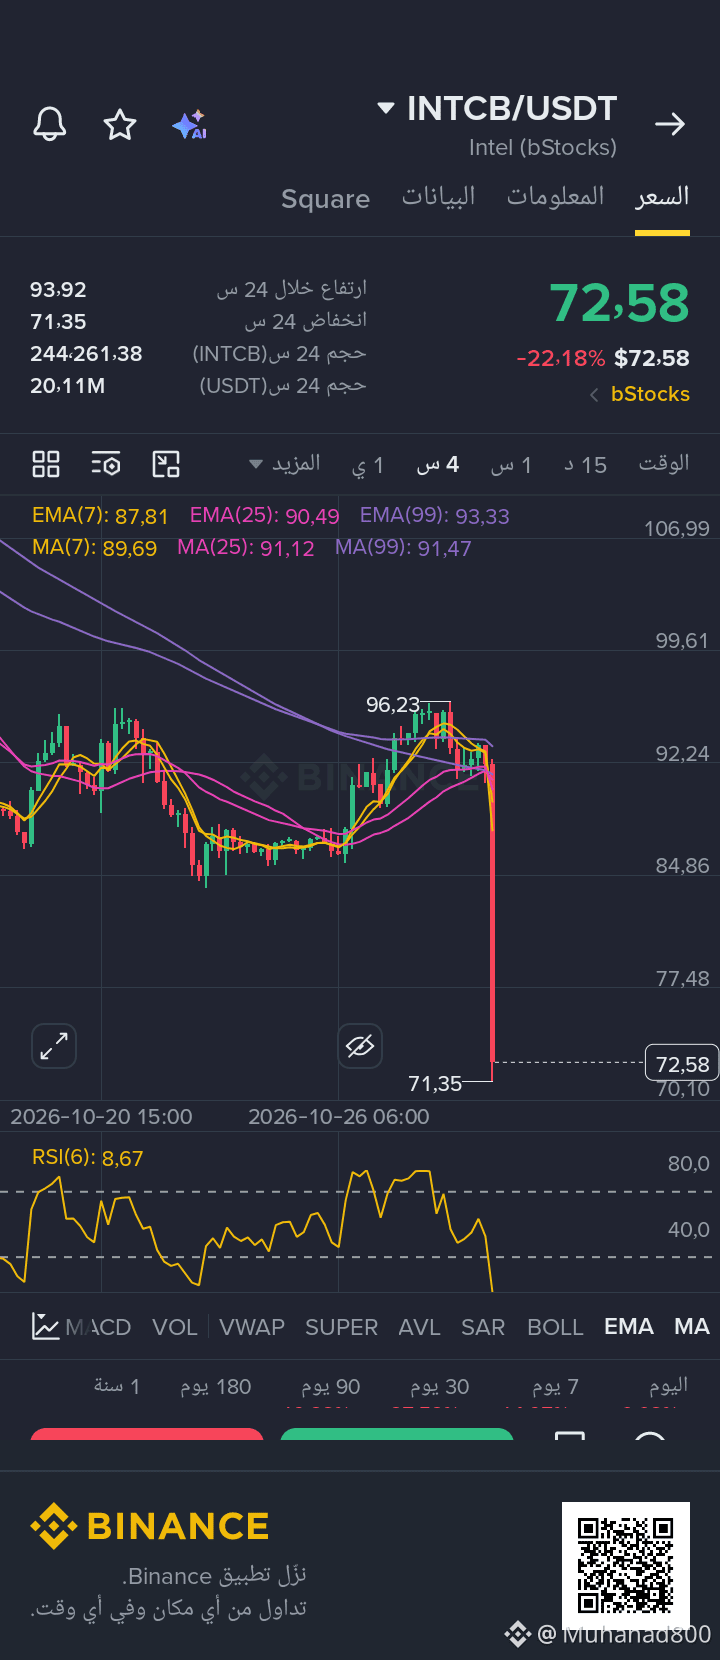
$INTCB dives to 72$🫥
Will there be buying opportunities ⬇️🫴
{spot}(INTCBUSDT)
see
$INTCB dives to 72$🫥
Will there be buying opportunities ⬇️🫴
see
Will there be buying opportunities ⬇️🫴
see
128


·
--
Bearish
$DOOD 🧨
Trending... quick on the way down and up 🧨
$DOOD 🧨
Trending... quick on the way down and up 🧨
Trending... quick on the way down and up 🧨

1
426
·
--
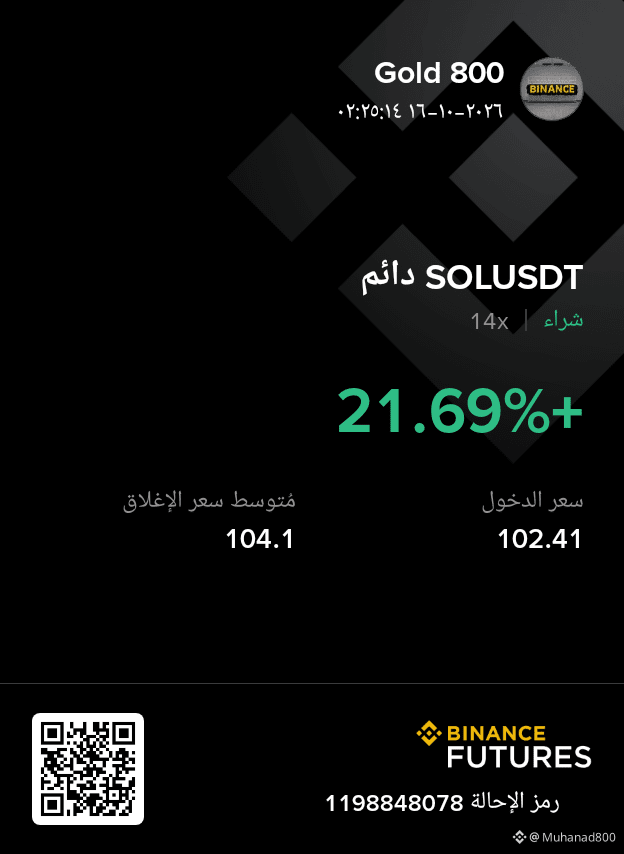
[https://www.binance.info/en/futures/ref/1198848078](https://www.binance.info/en/futures/ref/1198848078)
https://www.binance.info/en/futures/ref/1198848078
12
·
--
Bullish
📊 CPI Watch | Will inflation change the interest-rate path?
With the release of the upcoming CPI inflation data, attention turns to the Federal Reserve’s stance in the coming period. If inflation data comes in higher than expected, alongside NFP (Non-Farm Payrolls) data that exceeds expectations, pressure may increase on the Fed to maintain a tighter monetary policy—or at least to delay any potential interest-rate cuts.
If, however, CPI data shows a clear slowdown in inflation, the picture may shift in favor of a more flexible monetary policy, especially if the labor market begins to show signs of weakness.
{spot}(XAUTUSDT)
For the markets, I believe gold will remain highly sensitive to surprises in inflation data, as well as to movements in the dollar and bond yields. A CPI reading higher than expected could be negative for gold in the short term, while a reading lower than expected could support gold and increase expectations for monetary easing.
🎯 My view: I will wait for the actual CPI figures before making a trading decision, because the surprise versus expectations matters more than the number alone. Risk management remains essential as volatility rises around the data.
#CPIWatch✨
#CPI #NFP #Gold
$XAUT
📊 CPI Watch | Will inflation change the interest-rate path?
With the release of the upcoming CPI inflation data, attention turns to the Federal Reserve’s stance in the coming period. If inflation data comes in higher than expected, alongside NFP (Non-Farm Payrolls) data that exceeds expectations, pressure may increase on the Fed to maintain a tighter monetary policy—or at least to delay any potential interest-rate cuts.
If, however, CPI data shows a clear slowdown in inflation, the picture may shift in favor of a more flexible monetary policy, especially if the labor market begins to show signs of weakness.
For the markets, I believe gold will remain highly sensitive to surprises in inflation data, as well as to movements in the dollar and bond yields. A CPI reading higher than expected could be negative for gold in the short term, while a reading lower than expected could support gold and increase expectations for monetary easing.
🎯 My view: I will wait for the actual CPI figures before making a trading decision, because the surprise versus expectations matters more than the number alone. Risk management remains essential as volatility rises around the data.
#CPIWatch✨
#CPI #NFP #Gold
$XAUT
With the release of the upcoming CPI inflation data, attention turns to the Federal Reserve’s stance in the coming period. If inflation data comes in higher than expected, alongside NFP (Non-Farm Payrolls) data that exceeds expectations, pressure may increase on the Fed to maintain a tighter monetary policy—or at least to delay any potential interest-rate cuts.
If, however, CPI data shows a clear slowdown in inflation, the picture may shift in favor of a more flexible monetary policy, especially if the labor market begins to show signs of weakness.
For the markets, I believe gold will remain highly sensitive to surprises in inflation data, as well as to movements in the dollar and bond yields. A CPI reading higher than expected could be negative for gold in the short term, while a reading lower than expected could support gold and increase expectations for monetary easing.
🎯 My view: I will wait for the actual CPI figures before making a trading decision, because the surprise versus expectations matters more than the number alone. Risk management remains essential as volatility rises around the data.
#CPIWatch✨
#CPI #NFP #Gold
$XAUT
113
·
--
Bearish
$SOL
First Support: $97.4–$98.0 — the floor of the current 24-hour range; stability above it may indicate short-term consolidation.
Next Support: $94–$95 — a lower psychological and technical zone that deserves monitoring of trading volume there.
First Resistance: $100–$102.6 — includes the psychological level $100 and today’s high; breaking above it with stronger trading activity could improve momentum.
Next Resistance: $105–$108 — a higher zone where price action may face sell pressure if the rebound continues.
Confirm any zone is not based on price alone: watch closes above/below the zone, trading volume, and BTC’s movement, because SOL is often affected by broader market sentiment. A support break does not necessarily mean continued downside, and a resistance breakout does not guarantee sustained upside.
#solana
Not investment advice, just analysis 🙏
{future}(SOLUSDT)
$SOL
First Support: $97.4–$98.0 — the floor of the current 24-hour range; stability above it may indicate short-term consolidation.
Next Support: $94–$95 — a lower psychological and technical zone that deserves monitoring of trading volume there.
First Resistance: $100–$102.6 — includes the psychological level $100 and today’s high; breaking above it with stronger trading activity could improve momentum.
Next Resistance: $105–$108 — a higher zone where price action may face sell pressure if the rebound continues.
Confirm any zone is not based on price alone: watch closes above/below the zone, trading volume, and BTC’s movement, because SOL is often affected by broader market sentiment. A support break does not necessarily mean continued downside, and a resistance breakout does not guarantee sustained upside.
#solana
Not investment advice, just analysis 🙏
First Support: $97.4–$98.0 — the floor of the current 24-hour range; stability above it may indicate short-term consolidation.
Next Support: $94–$95 — a lower psychological and technical zone that deserves monitoring of trading volume there.
First Resistance: $100–$102.6 — includes the psychological level $100 and today’s high; breaking above it with stronger trading activity could improve momentum.
Next Resistance: $105–$108 — a higher zone where price action may face sell pressure if the rebound continues.
Confirm any zone is not based on price alone: watch closes above/below the zone, trading volume, and BTC’s movement, because SOL is often affected by broader market sentiment. A support break does not necessarily mean continued downside, and a resistance breakout does not guarantee sustained upside.
#solana
Not investment advice, just analysis 🙏

134
·
--
Bearish
$SPCXB ⬇️
The probability is high $127🫴 in the coming week ⬇️
{future}(SPCXUSDT)
$SPCXB ⬇️
The probability is high $127🫴 in the coming week ⬇️
The probability is high $127🫴 in the coming week ⬇️

275
·
--
Bullish
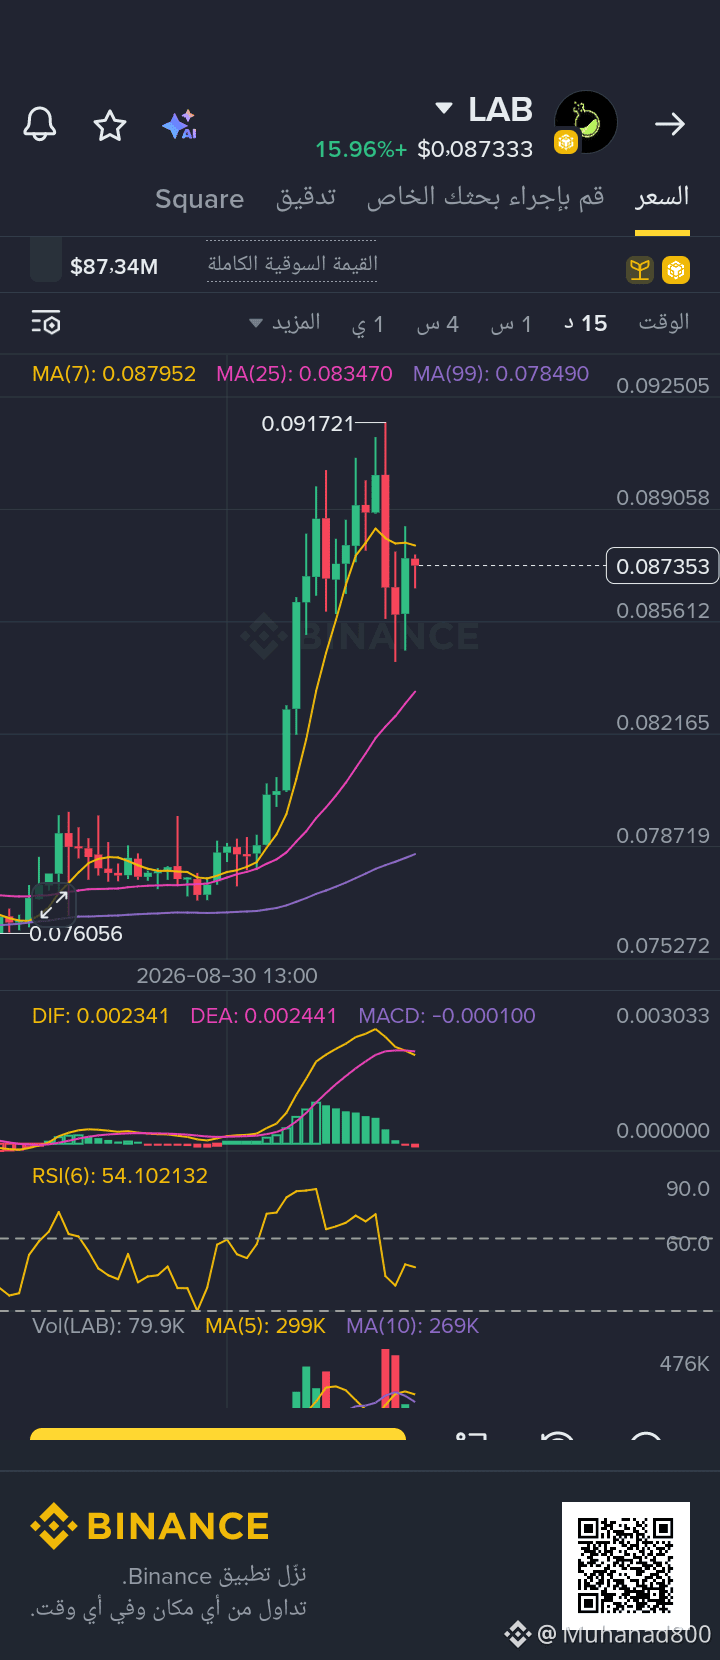
$LAB beginning of the rise before the 1$🚀
$LAB returns to the forefront
{alpha}(560x7ec43cf65f1663f820427c62a5780b8f2e25593a)
$LAB beginning of the rise before the 1$🚀
$LAB returns to the forefront
$LAB returns to the forefront
1
3
365

·
--
Bullish
$PAXG 🚀
{future}(PAXGUSDT)
Has the safe haven started boarding 🚀
$PAXG 🚀
Has the safe haven started boarding 🚀
Has the safe haven started boarding 🚀

44
·
--
Bullish
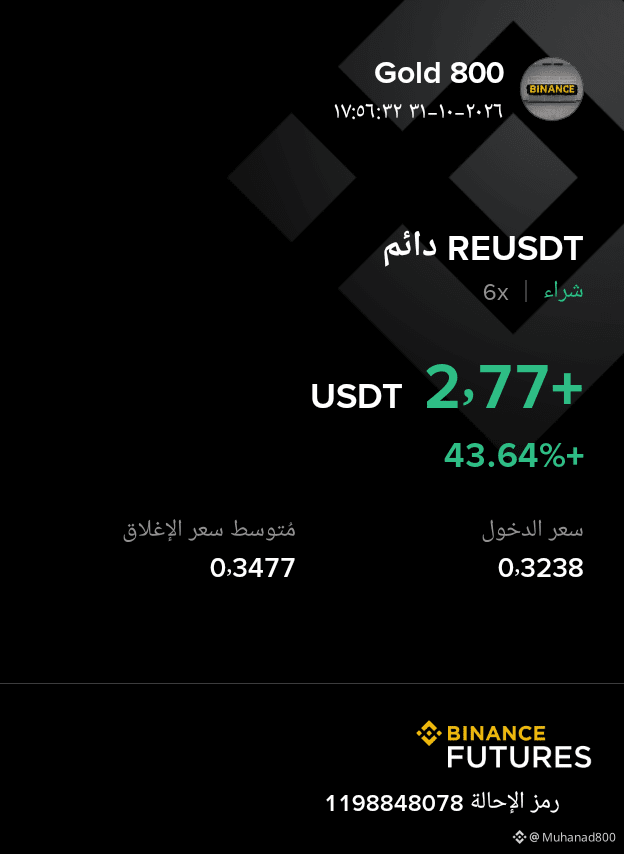
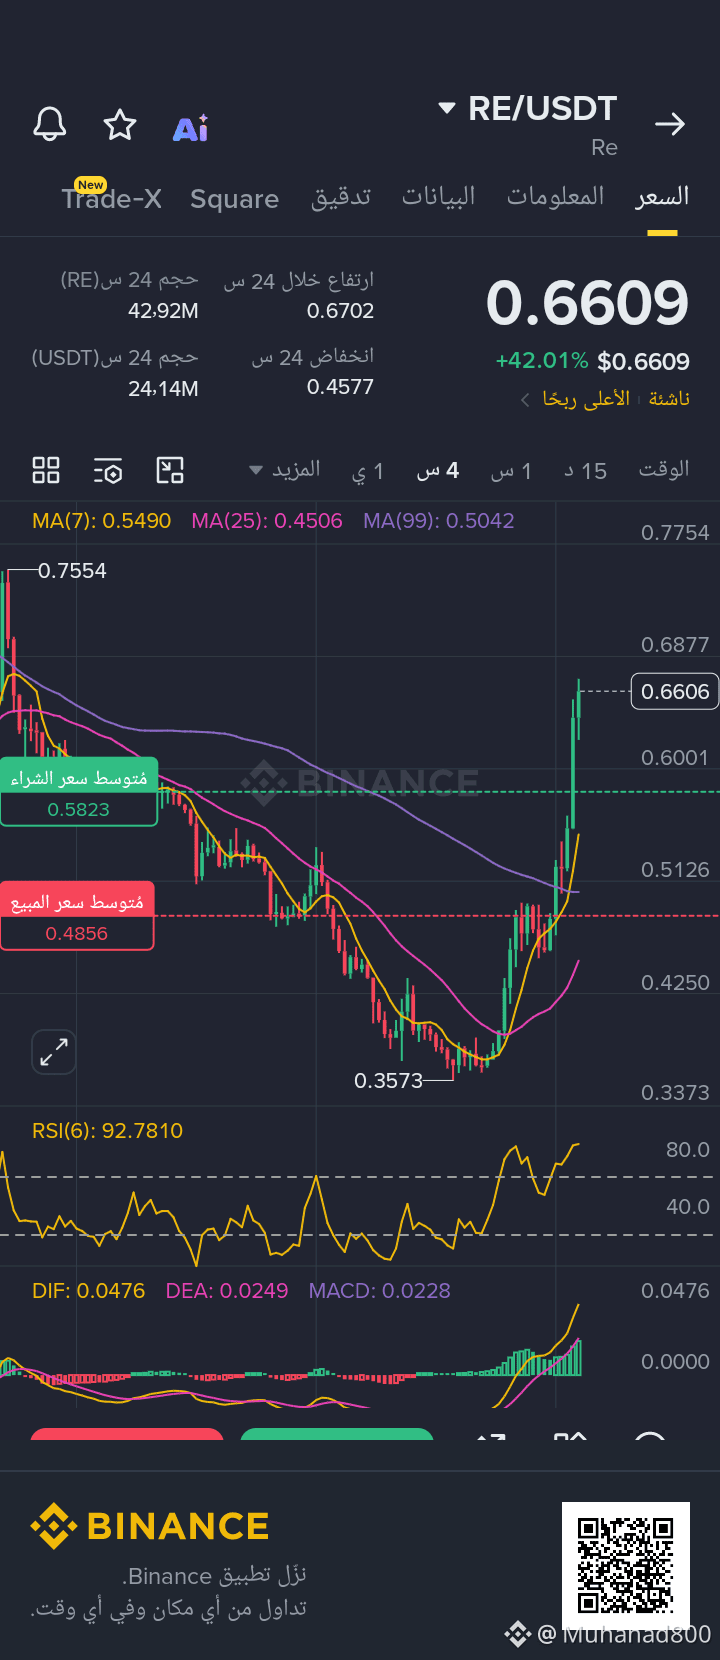
$RE consecutive explosions 🚀
You caught $RE from the bottom
Congratulations to whoever got it for $0.36🫂
{future}(REUSDT)
$RE consecutive explosions 🚀
You caught $RE from the bottom
Congratulations to whoever got it for $0.36🫂
You caught $RE from the bottom
Congratulations to whoever got it for $0.36🫂

157
·
--
Bullish
Partly True
Strong institutional inflows into Ethereum🌱
Ethereum ETFs recorded net inflows totaling 19,517 ETH $ETH during the July 21 session, valued at roughly $37.7 million.
Over the past 7 days, net inflows rose to 81,773 ETH—equivalent to about $158 million—meaning that the latest session alone accounted for roughly 24% of the week’s total inflows.
These figures reflect continued interest from institutional capital in Ethereum despite market volatility, but they do not necessarily mean the price will rise immediately; what matters most is that inflows continue in the coming sessions and turn into sustained demand.
Do these inflows pave the way for a new bullish wave for #ETH , or are they just gradual institutional accumulation before a bigger move?? 🚀
#EthereumNews 🍺
{future}(ETHUSDT)
Strong institutional inflows into Ethereum🌱
Ethereum ETFs recorded net inflows totaling 19,517 ETH $ETH during the July 21 session, valued at roughly $37.7 million.
Over the past 7 days, net inflows rose to 81,773 ETH—equivalent to about $158 million—meaning that the latest session alone accounted for roughly 24% of the week’s total inflows.
These figures reflect continued interest from institutional capital in Ethereum despite market volatility, but they do not necessarily mean the price will rise immediately; what matters most is that inflows continue in the coming sessions and turn into sustained demand.
Do these inflows pave the way for a new bullish wave for #ETH , or are they just gradual institutional accumulation before a bigger move?? 🚀
#EthereumNews 🍺
Ethereum ETFs recorded net inflows totaling 19,517 ETH $ETH during the July 21 session, valued at roughly $37.7 million.
Over the past 7 days, net inflows rose to 81,773 ETH—equivalent to about $158 million—meaning that the latest session alone accounted for roughly 24% of the week’s total inflows.
These figures reflect continued interest from institutional capital in Ethereum despite market volatility, but they do not necessarily mean the price will rise immediately; what matters most is that inflows continue in the coming sessions and turn into sustained demand.
Do these inflows pave the way for a new bullish wave for #ETH , or are they just gradual institutional accumulation before a bigger move?? 🚀
#EthereumNews 🍺

120
·
--
Bullish
$SOL at 78.53 USDT right now, while today’s high is 78.67 and the low is 75.50. This means the price is very close to today’s high, but it has not clearly broken it yet. The increase over the last 24 hours is about +3.36%.
We are still in a testing/resistance zone, and it hasn’t been confirmed as support yet.
#sol
If it breaks 78.67 and closes above it, then returns to test it and bounces back, we say that today’s high has been converted into support.
If it fails at 78.67 and rejection candles appear or there is a rapid drop below it, the most likely outcome is that it rejects the high.
Since the price is only 78.53, the distance is very small, so the real decision depends on closing above 78.67, not just touching it.
#solana
Practically:
Above 78.67 steadily = a positive short-term signal.
Below 78.67 with repeated rejection = resistance is still effective.
Falling back below ~78.00 quickly after the attempt could strengthen the rejection scenario.
{future}(SOLUSDT)
#SolanaStrong 🚀
$SOL at 78.53 USDT right now, while today’s high is 78.67 and the low is 75.50. This means the price is very close to today’s high, but it has not clearly broken it yet. The increase over the last 24 hours is about +3.36%.
We are still in a testing/resistance zone, and it hasn’t been confirmed as support yet.
#sol
If it breaks 78.67 and closes above it, then returns to test it and bounces back, we say that today’s high has been converted into support.
If it fails at 78.67 and rejection candles appear or there is a rapid drop below it, the most likely outcome is that it rejects the high.
Since the price is only 78.53, the distance is very small, so the real decision depends on closing above 78.67, not just touching it.
#solana
Practically:
Above 78.67 steadily = a positive short-term signal.
Below 78.67 with repeated rejection = resistance is still effective.
Falling back below ~78.00 quickly after the attempt could strengthen the rejection scenario.
#SolanaStrong 🚀
We are still in a testing/resistance zone, and it hasn’t been confirmed as support yet.
#sol
If it breaks 78.67 and closes above it, then returns to test it and bounces back, we say that today’s high has been converted into support.
If it fails at 78.67 and rejection candles appear or there is a rapid drop below it, the most likely outcome is that it rejects the high.
Since the price is only 78.53, the distance is very small, so the real decision depends on closing above 78.67, not just touching it.
#solana
Practically:
Above 78.67 steadily = a positive short-term signal.
Below 78.67 with repeated rejection = resistance is still effective.
Falling back below ~78.00 quickly after the attempt could strengthen the rejection scenario.
#SolanaStrong 🚀
355
Log in to explore more content
Join global crypto users on Binance Square
⚡️ Get latest and useful information about crypto.
💬 Trusted by the world’s largest crypto exchange.
👍 Discover real insights from verified creators.
Email / Phone number
Trending Topics
A Packed Week of Earnings and Data Tests Markets
42,360 views
303 Discussing
🚨🇺🇸 BIG WEEK AHEAD FOR THE MARKETS!
Markets are pricing in a Fed rate hike in December and $BTC could see some big moves next week.
Here's what's coming:
• Monday: Fed Chair Warsh speaks
• Tuesday: US Retail Sales + $NVDA earnings
• Wednesday: FOMC Minutes
• Thursday: Jobless Claims + Philly Fed Index
• Friday: Consumer Sentiment + Fed speeches
All eyes on $BTC as another important week begins.
#bitcoin
Mookie
·10 Likes
·5.7k views
AnthropicIPOTestsInvestorAppetiteForAI
58,574 views
986 Discussing
BitcoinExtendsLosingStreakToSixWeeks
17,430 views
336 Discussing