

Mr_KING01
122 Posts

Mr_KING01
Report
Block User
0 Following
7 Followers
28 Liked
Posts
·
--
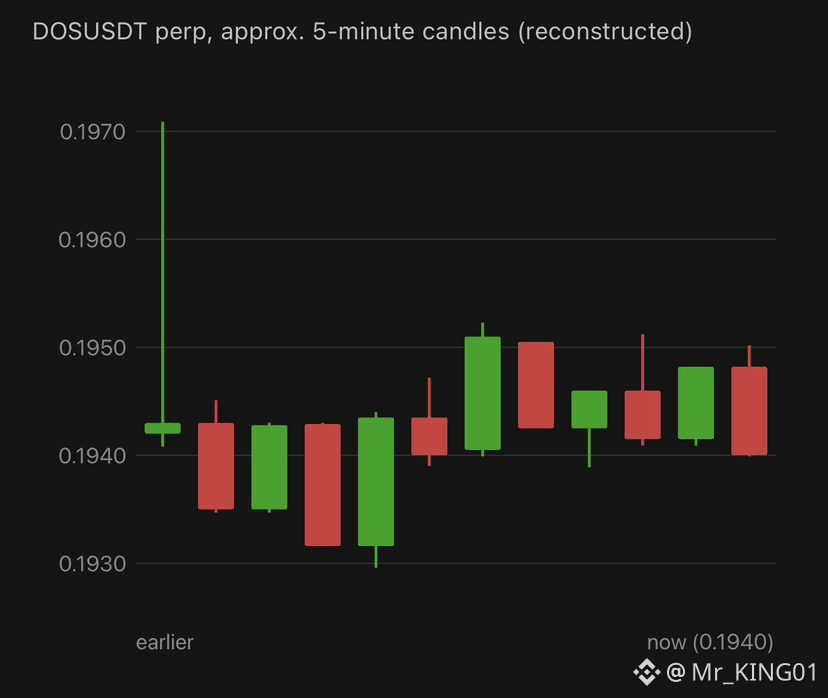
$DOS is trading at 0.1940 USDT with a mark price of 0.1941. It is down 12.10% over 24h, while “Today” shows +2.00%. The 24h range is wide at 0.1801–0.2261, on about 23.64M USDT (118.29M DOS) in volume. Only the 7-day (-10.43%) and 30-day (-10.64%) returns are shown, with no 90-day, 180-day or 1-year data, which means a short trading history. In the visible window, price spiked to about 0.1971 at the very start, then settled into a choppy range of about 0.1930–0.1952, with a low near 0.1930 and a second peak near 0.1952. It is trading right at the MA60 (0.1942), and the order book is evenly split (50.39% asks vs 49.61% bids), so there is no clear short-term direction. Support is near 0.1930, then the 24h low of 0.1801, and resistance is at the MA60 (0.1942), then 0.1952 and the 24h high of 0.2261. A move above 0.1952 would be the first sign of strength, while a drop below 0.1930 would reopen the downside. A coin with a short history on a leveraged perp can swing sharply in either direction.
{future}(DOSUSDT)
$DOS is trading at 0.1940 USDT with a mark price of 0.1941. It is down 12.10% over 24h, while “Today” shows +2.00%. The 24h range is wide at 0.1801–0.2261, on about 23.64M USDT (118.29M DOS) in volume. Only the 7-day (-10.43%) and 30-day (-10.64%) returns are shown, with no 90-day, 180-day or 1-year data, which means a short trading history. In the visible window, price spiked to about 0.1971 at the very start, then settled into a choppy range of about 0.1930–0.1952, with a low near 0.1930 and a second peak near 0.1952. It is trading right at the MA60 (0.1942), and the order book is evenly split (50.39% asks vs 49.61% bids), so there is no clear short-term direction. Support is near 0.1930, then the 24h low of 0.1801, and resistance is at the MA60 (0.1942), then 0.1952 and the 24h high of 0.2261. A move above 0.1952 would be the first sign of strength, while a drop below 0.1930 would reopen the downside. A coin with a short history on a leveraged perp can swing sharply in either direction.
221
·
--
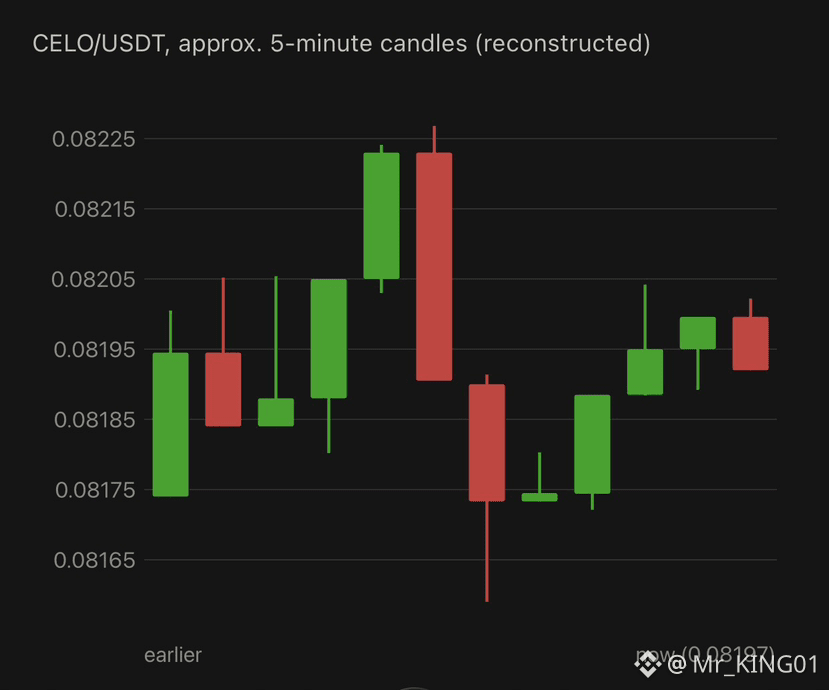
$CELO is trading at 0.08197 USDT, up 1.64% in 24h (the “Today” figure shows +1.25%), with a range of 0.07763–0.08235 and about 11.42M USDT (142.28M CELO) in volume. Returns are mixed: -5.07% over 7 days, -11.53% over 30 days, +31.43% over 90 days, -6.55% over 180 days and -67.78% over 1 year. In the visible window, price rallied to a peak near 0.08227, dropped sharply to about 0.08159, built a base around 0.08172–0.08178, and then recovered to the current level. It is sitting right at the MA60 (0.08191), which is rising, so the short-term picture is neutral to slightly positive. The order book leans heavily toward sellers (71.74% asks vs 28.26% bids), which could cap further gains near the highs. Support is at the MA60 (0.08191), then 0.08172 and the 24h low of 0.07763, and resistance is at 0.08227, then the 24h high of 0.08235. A clean move above 0.08227 would be the first sign of strength, while a drop below 0.08172 would put the lower part of the range back in play.
{spot}(CELOUSDT)
$CELO is trading at 0.08197 USDT, up 1.64% in 24h (the “Today” figure shows +1.25%), with a range of 0.07763–0.08235 and about 11.42M USDT (142.28M CELO) in volume. Returns are mixed: -5.07% over 7 days, -11.53% over 30 days, +31.43% over 90 days, -6.55% over 180 days and -67.78% over 1 year. In the visible window, price rallied to a peak near 0.08227, dropped sharply to about 0.08159, built a base around 0.08172–0.08178, and then recovered to the current level. It is sitting right at the MA60 (0.08191), which is rising, so the short-term picture is neutral to slightly positive. The order book leans heavily toward sellers (71.74% asks vs 28.26% bids), which could cap further gains near the highs. Support is at the MA60 (0.08191), then 0.08172 and the 24h low of 0.07763, and resistance is at 0.08227, then the 24h high of 0.08235. A clean move above 0.08227 would be the first sign of strength, while a drop below 0.08172 would put the lower part of the range back in play.
181
·
--
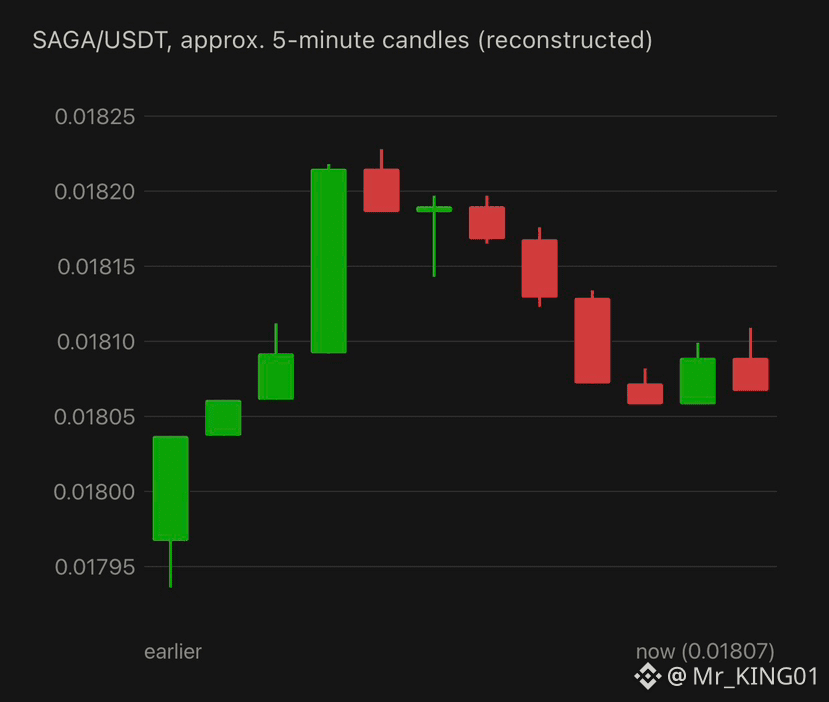
$SAGA is trading at 0.01807 USDT, down 2.80% in 24h (the “Today” figure shows -2.11%), with a range of 0.01781–0.01891 and about 991.5K USDT (54.07M SAGA) in volume. The longer-term trend is weak: -9.60% over 7 days, -32.57% over 30 days and -83.38% over 1 year, with only the 90-day (+48.48%) and 180-day (+3.97%) figures positive. In the visible window, price rallied from about 0.01794 to a peak near 0.01823, then faded back to roughly where it started the climb’s midpoint. It has since moved sideways around 0.01806–0.01811 with a small bounce. Price is just below the MA60 (0.01811), and the order book is balanced (50.62% bids vs 49.38% asks), so there is no clear short-term direction. Support is near 0.01805 and 0.01798, then the 24h low of 0.01781, and resistance is at the MA60 (0.01811), then 0.01820 and the 24h high of 0.01891. A move back above 0.01811 would show buyers regaining control, while a drop below 0.01798 would extend the decline.
{spot}(SAGAUSDT)
$SAGA is trading at 0.01807 USDT, down 2.80% in 24h (the “Today” figure shows -2.11%), with a range of 0.01781–0.01891 and about 991.5K USDT (54.07M SAGA) in volume. The longer-term trend is weak: -9.60% over 7 days, -32.57% over 30 days and -83.38% over 1 year, with only the 90-day (+48.48%) and 180-day (+3.97%) figures positive. In the visible window, price rallied from about 0.01794 to a peak near 0.01823, then faded back to roughly where it started the climb’s midpoint. It has since moved sideways around 0.01806–0.01811 with a small bounce. Price is just below the MA60 (0.01811), and the order book is balanced (50.62% bids vs 49.38% asks), so there is no clear short-term direction. Support is near 0.01805 and 0.01798, then the 24h low of 0.01781, and resistance is at the MA60 (0.01811), then 0.01820 and the 24h high of 0.01891. A move back above 0.01811 would show buyers regaining control, while a drop below 0.01798 would extend the decline.
347
·
--
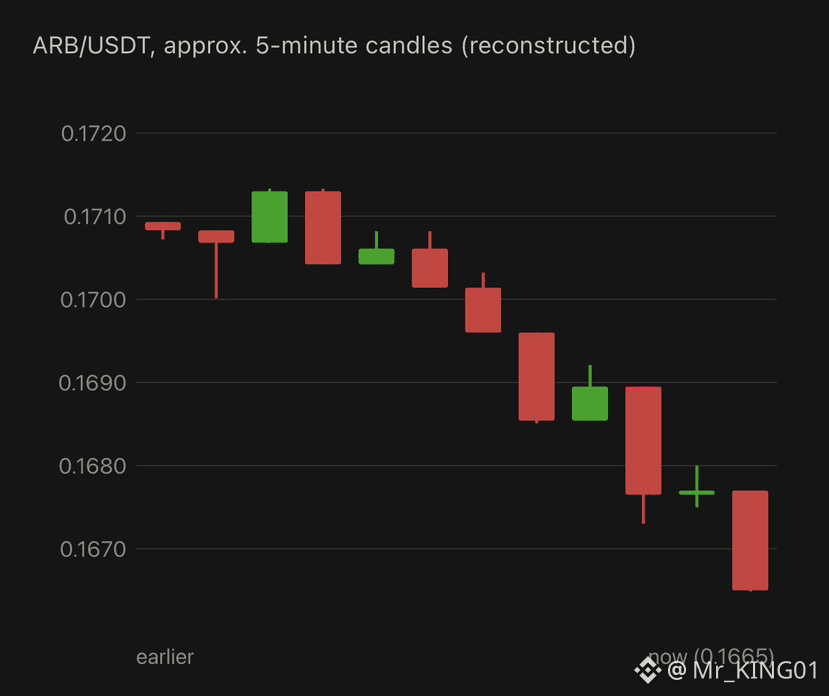
$ARB is trading at 0.1665 USDT, down 1.83% in 24h (the “Today” figure shows -2.97%), with a range of 0.1634–0.1786 and about 13.69M USDT (80.52M ARB) in volume. The trend is weak over most periods: -14.53% over 7 days, -19.53% over 30 days and -48.88% over 1 year, while the 90-day (+113.46%) and 180-day (+32.99%) figures remain positive. In the visible window, price peaked near 0.1713 early, then drifted lower in steps and slid steeply in the second half to the window low at the current price. It is well below the MA60 (0.1696), which is sloping down, so sellers have the clear short-term edge. The order book leans slightly toward buyers (56.43% bids vs 43.57% asks), but that has not stopped the decline. Support is near 0.1660 and the 24h low of 0.1634, and resistance is at 0.1674 and 0.1685, then the MA60 (0.1696) and the 24h high of 0.1786. A bounce back above 0.1685 would show buyers regaining control, while a break below 0.1634 would set a new 24h low.
{spot}(ARBUSDT)
$ARB is trading at 0.1665 USDT, down 1.83% in 24h (the “Today” figure shows -2.97%), with a range of 0.1634–0.1786 and about 13.69M USDT (80.52M ARB) in volume. The trend is weak over most periods: -14.53% over 7 days, -19.53% over 30 days and -48.88% over 1 year, while the 90-day (+113.46%) and 180-day (+32.99%) figures remain positive. In the visible window, price peaked near 0.1713 early, then drifted lower in steps and slid steeply in the second half to the window low at the current price. It is well below the MA60 (0.1696), which is sloping down, so sellers have the clear short-term edge. The order book leans slightly toward buyers (56.43% bids vs 43.57% asks), but that has not stopped the decline. Support is near 0.1660 and the 24h low of 0.1634, and resistance is at 0.1674 and 0.1685, then the MA60 (0.1696) and the 24h high of 0.1786. A bounce back above 0.1685 would show buyers regaining control, while a break below 0.1634 would set a new 24h low.
1
380
·
--
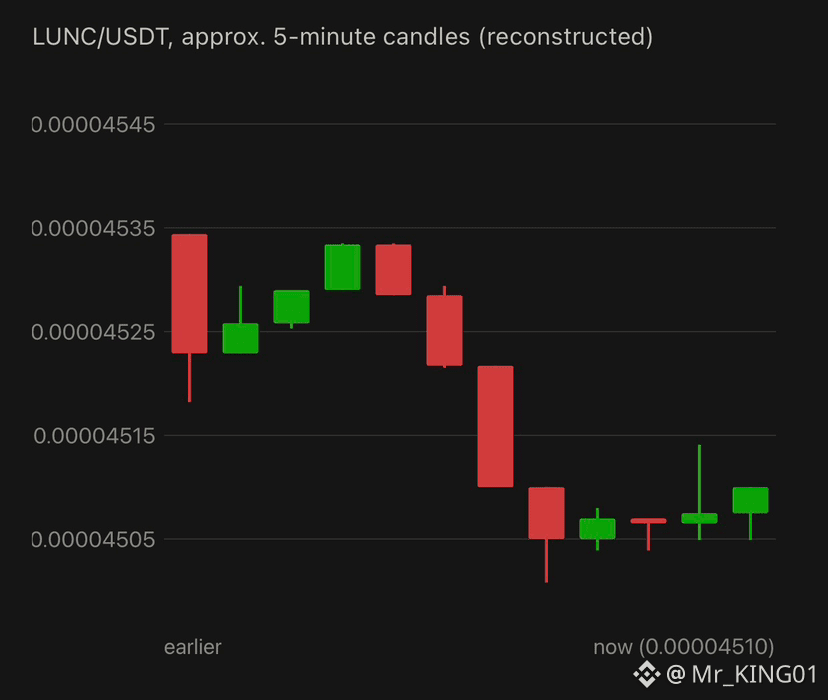
$LUNC is trading at 0.00004510 USDT, up 1.19% in 24h (the “Today” figure shows +0.31%), with a range of 0.00004451–0.00004567 and about 587.6K USDT (13.02B LUNC) in volume. That is about 3.6% below the 0.00004677 level in your earlier LUNC screenshot. The longer-term trend is weak: -3.16% over 7 days, -19.94% over 30 days, -10.90% over 90 days, -39.95% over 180 days and -2.47% over 1 year. In the visible window, price chopped near 0.00004525–0.00004533 for the first half, then dropped sharply to about 0.00004501 on a large red volume spike and has since bounced only slightly. Price is below the MA60 (0.00004520), which is sloping down, and the order book is heavily sell-side (69.38% asks vs 30.62% bids), so sellers are still in control. Support is at 0.00004500, then the 24h low of 0.00004451, and resistance is at the MA60 (0.00004520), then 0.00004533 and the 24h high of 0.00004567. A recovery above the MA60 would be the first sign the drop is fading, while a break below 0.00004500 would extend the decline.
{spot}(LUNCUSDT)
$LUNC is trading at 0.00004510 USDT, up 1.19% in 24h (the “Today” figure shows +0.31%), with a range of 0.00004451–0.00004567 and about 587.6K USDT (13.02B LUNC) in volume. That is about 3.6% below the 0.00004677 level in your earlier LUNC screenshot. The longer-term trend is weak: -3.16% over 7 days, -19.94% over 30 days, -10.90% over 90 days, -39.95% over 180 days and -2.47% over 1 year. In the visible window, price chopped near 0.00004525–0.00004533 for the first half, then dropped sharply to about 0.00004501 on a large red volume spike and has since bounced only slightly. Price is below the MA60 (0.00004520), which is sloping down, and the order book is heavily sell-side (69.38% asks vs 30.62% bids), so sellers are still in control. Support is at 0.00004500, then the 24h low of 0.00004451, and resistance is at the MA60 (0.00004520), then 0.00004533 and the 24h high of 0.00004567. A recovery above the MA60 would be the first sign the drop is fading, while a break below 0.00004500 would extend the decline.
3
332
·
--
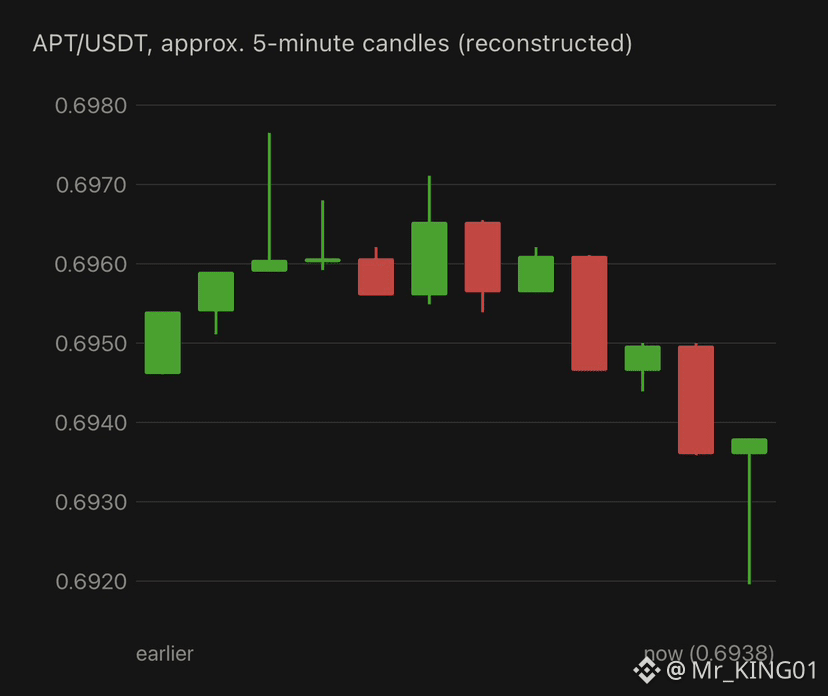
$APT is trading at 0.6938 USDT, up 1.48% in 24h (the “Today” figure shows +0.81%), with a range of 0.6740–0.7045 and about 4.09M USDT in volume. That is about 9% below the 0.7653 level in your earlier APT screenshot. The trend is weak over most periods: -16.37% over 7 days, -19.39% over 30 days, -30.06% over 180 days and -80.28% over 1 year, with only the 90-day figure positive (+21.08%). In the visible window, price moved in a choppy range of about 0.6935–0.6977, peaking near 0.6977 and then sliding below the MA60. It dropped to about 0.6920 late in the window before a sharp rebound to the current level. Price is still below the MA60 (0.6953), which is flat, so the short-term trend remains cautious. The order book leans toward buyers (62.27% bids vs 37.73% asks), which helped fuel the late bounce. Support is near 0.6920, then the 24h low of 0.6740, and resistance is at the MA60 (0.6953), then 0.6977 and the 24h high of 0.7045. A close back above 0.6953 would show the rebound has traction, while a drop below 0.6920 would reopen the lower end of the 24h range.
{spot}(APTUSDT)
$APT is trading at 0.6938 USDT, up 1.48% in 24h (the “Today” figure shows +0.81%), with a range of 0.6740–0.7045 and about 4.09M USDT in volume. That is about 9% below the 0.7653 level in your earlier APT screenshot. The trend is weak over most periods: -16.37% over 7 days, -19.39% over 30 days, -30.06% over 180 days and -80.28% over 1 year, with only the 90-day figure positive (+21.08%). In the visible window, price moved in a choppy range of about 0.6935–0.6977, peaking near 0.6977 and then sliding below the MA60. It dropped to about 0.6920 late in the window before a sharp rebound to the current level. Price is still below the MA60 (0.6953), which is flat, so the short-term trend remains cautious. The order book leans toward buyers (62.27% bids vs 37.73% asks), which helped fuel the late bounce. Support is near 0.6920, then the 24h low of 0.6740, and resistance is at the MA60 (0.6953), then 0.6977 and the 24h high of 0.7045. A close back above 0.6953 would show the rebound has traction, while a drop below 0.6920 would reopen the lower end of the 24h range.
354
·
--
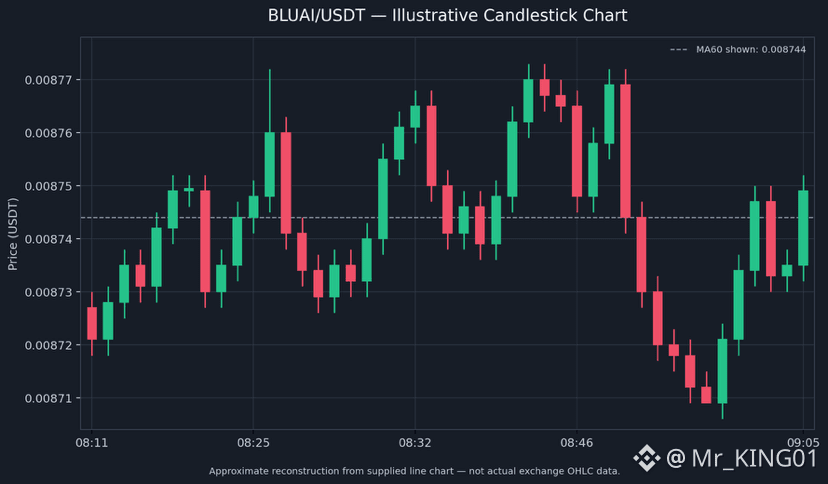
$BLUAI is showing short-term volatility with a slight bearish bias. the current price is $0.008749, down approximately 1.66%, with a 24-hour high of $0.008992 and a low of $0.008618. The price experienced several fluctuations before recovering from a recent dip near $0.008709. The current price is slightly above the MA60 level of $0.008744, suggesting a possible short-term recovery, although selling pressure remains significant. Immediate support is around $0.008721–$0.008709, while resistance is near $0.008761–$0.008774. A breakout above resistance could support further upward movement, while a drop below support may signal additional weakness.
{future}(BLUAIUSDT)
$BLUAI is showing short-term volatility with a slight bearish bias. the current price is $0.008749, down approximately 1.66%, with a 24-hour high of $0.008992 and a low of $0.008618. The price experienced several fluctuations before recovering from a recent dip near $0.008709. The current price is slightly above the MA60 level of $0.008744, suggesting a possible short-term recovery, although selling pressure remains significant. Immediate support is around $0.008721–$0.008709, while resistance is near $0.008761–$0.008774. A breakout above resistance could support further upward movement, while a drop below support may signal additional weakness.
492
·
--
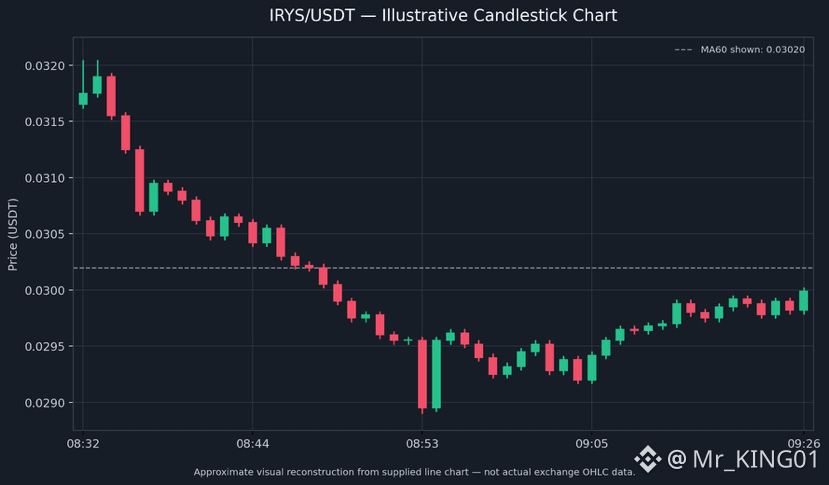
$IRYS is showing bearish short-term momentum, despite a recent attempt at recovery. According to your screenshot, the current price is $0.02999, down approximately 16.32%, with a 24-hour high of $0.03600 and a low of $0.02556. The price has declined significantly from its recent high before recovering slightly from around $0.02890. The current price remains below the MA60 level of $0.03020, suggesting continued selling pressure. Immediate support is around $0.02890–$0.02900, while resistance lies near $0.03020–$0.03050. A move above resistance could support a recovery, while a break below support may lead to further weakness.
{future}(IRYSUSDT)
$IRYS is showing bearish short-term momentum, despite a recent attempt at recovery. According to your screenshot, the current price is $0.02999, down approximately 16.32%, with a 24-hour high of $0.03600 and a low of $0.02556. The price has declined significantly from its recent high before recovering slightly from around $0.02890. The current price remains below the MA60 level of $0.03020, suggesting continued selling pressure. Immediate support is around $0.02890–$0.02900, while resistance lies near $0.03020–$0.03050. A move above resistance could support a recovery, while a break below support may lead to further weakness.
348
·
--
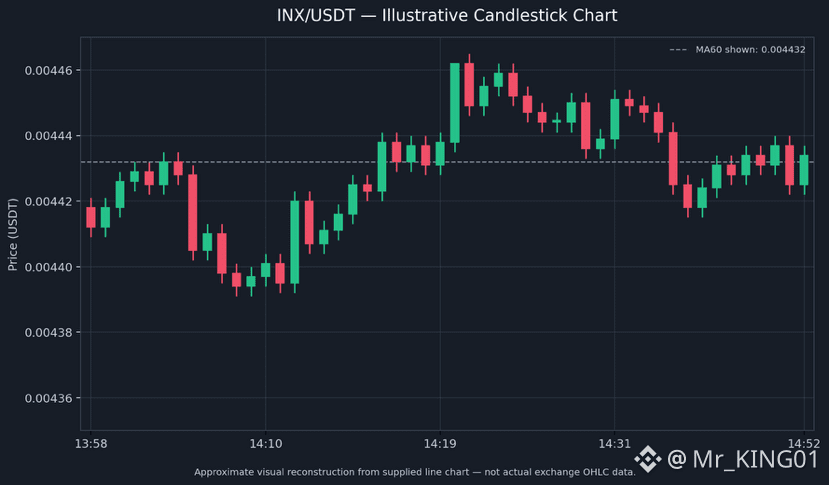
$INX is showing mixed price action with slight bearish pressure, according to your screenshot. The current price is $0.004434, down approximately 2.72%, with a 24-hour high of $0.004753 and a low of $0.004223. The price recently recovered from a local dip but remains below its recent peak. The MA60 is around $0.004432, placing the current price very close to the moving average. Immediate support is around $0.004420–$0.004400, while resistance lies near $0.004441–$0.004460. A move above resistance could support a short-term recovery, while a break below support may indicate further weakness.
{future}(INXUSDT)
$INX is showing mixed price action with slight bearish pressure, according to your screenshot. The current price is $0.004434, down approximately 2.72%, with a 24-hour high of $0.004753 and a low of $0.004223. The price recently recovered from a local dip but remains below its recent peak. The MA60 is around $0.004432, placing the current price very close to the moving average. Immediate support is around $0.004420–$0.004400, while resistance lies near $0.004441–$0.004460. A move above resistance could support a short-term recovery, while a break below support may indicate further weakness.
453
·
--
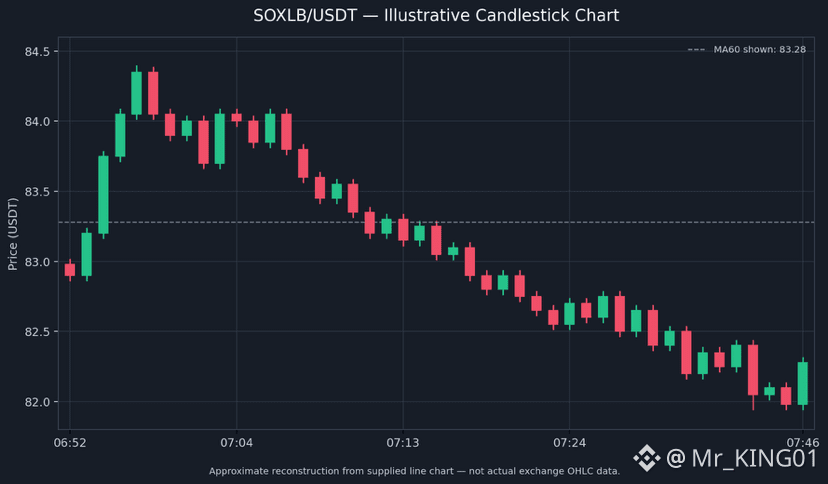
$SOXLB is showing strong bearish momentum according to your screenshot. The current price is $82.28, down approximately 3.10%, after falling from a recent high near $84.35. The price is now below the MA60 level of $83.28, indicating continued selling pressure. Immediate support is around $81.94–$82.00, while resistance lies near $82.98–$83.28. If the price breaks below support, further downside is possible. However, a recovery above $83.28 could indicate a short-term rebound. Trading volume has increased during the decline, suggesting stronger selling activity.
{spot}(SOXLBUSDT)
$SOXLB is showing strong bearish momentum according to your screenshot. The current price is $82.28, down approximately 3.10%, after falling from a recent high near $84.35. The price is now below the MA60 level of $83.28, indicating continued selling pressure. Immediate support is around $81.94–$82.00, while resistance lies near $82.98–$83.28. If the price breaks below support, further downside is possible. However, a recovery above $83.28 could indicate a short-term rebound. Trading volume has increased during the decline, suggesting stronger selling activity.
170
·
--
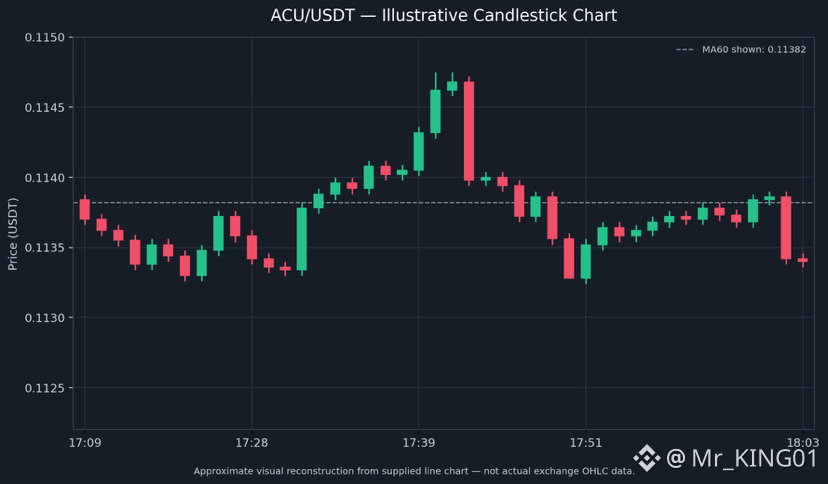
$ACU is showing slightly bearish short-term momentum, trading at $0.11340, down approximately 1.18%, according to your screenshot. The price experienced a brief rally toward $0.11475 before pulling back, indicating selling pressure near higher levels. The current price is slightly below the MA60 level of $0.11382, suggesting that buyers have not yet regained control. Immediate support is around $0.11330–$0.11340, while resistance lies near $0.11380–$0.11400. A break below support could lead to further weakness, whereas a recovery above resistance may signal a short-term rebound.
{future}(ACUUSDT)
$ACU is showing slightly bearish short-term momentum, trading at $0.11340, down approximately 1.18%, according to your screenshot. The price experienced a brief rally toward $0.11475 before pulling back, indicating selling pressure near higher levels. The current price is slightly below the MA60 level of $0.11382, suggesting that buyers have not yet regained control. Immediate support is around $0.11330–$0.11340, while resistance lies near $0.11380–$0.11400. A break below support could lead to further weakness, whereas a recovery above resistance may signal a short-term rebound.
342
·
--
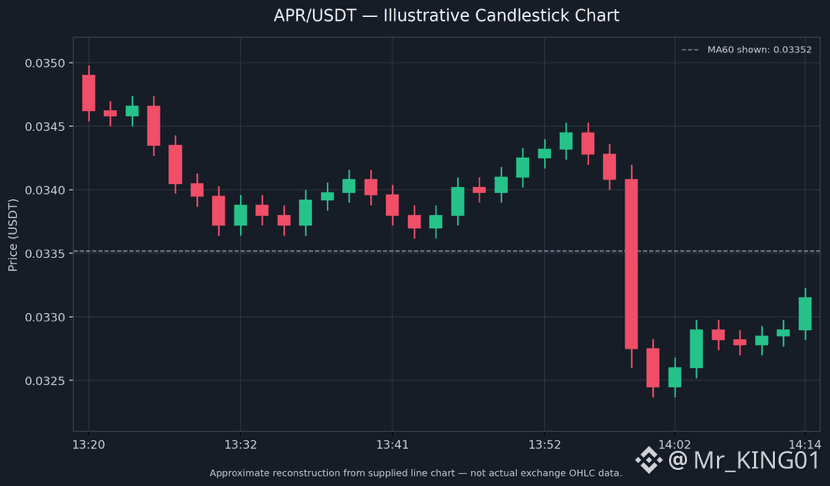
$APR is showing high volatility with a short-term bearish trend, despite being up approximately 27.78% in 24 hours, according to your screenshot. The displayed price is $0.03289, following a sharp decline from around $0.0348 and a partial recovery from the $0.0323 area. The price remains below the MA60 level of $0.03352, indicating continued selling pressure. Immediate support is around $0.0323–$0.0326, while resistance lies near $0.0334–$0.0340. If buying pressure increases, APR could attempt a recovery; however, a break below support could lead to further losses.
{future}(APRUSDT)
$APR is showing high volatility with a short-term bearish trend, despite being up approximately 27.78% in 24 hours, according to your screenshot. The displayed price is $0.03289, following a sharp decline from around $0.0348 and a partial recovery from the $0.0323 area. The price remains below the MA60 level of $0.03352, indicating continued selling pressure. Immediate support is around $0.0323–$0.0326, while resistance lies near $0.0334–$0.0340. If buying pressure increases, APR could attempt a recovery; however, a break below support could lead to further losses.
229
·
--
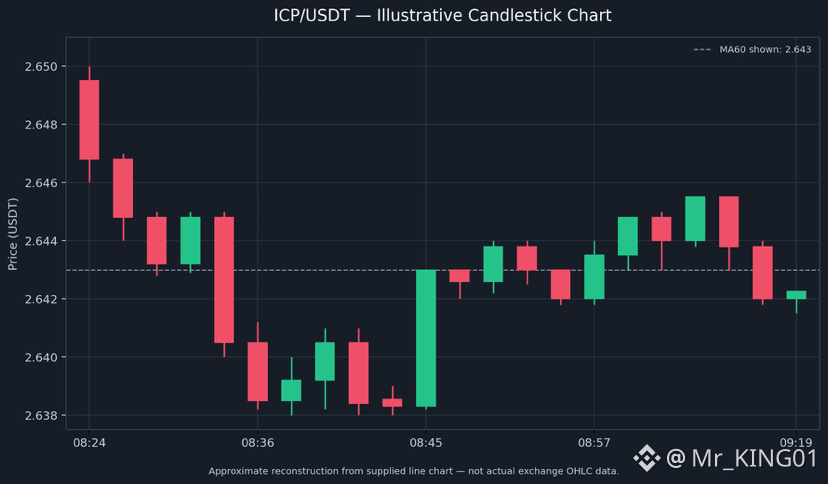
$ICP is showing slightly bearish momentum, trading at $2.642, down approximately 3.15% according to your screenshot. The price dropped from around $2.649 before recovering from the $2.638 area, but it is now close to the MA60 level of $2.643. Immediate support lies around $2.638–$2.640, while resistance is near $2.645–$2.647. If ICP breaks below support, further downside is possible. However, a move above $2.645 could indicate a short-term recovery. Trading volume appears relatively low apart from a few spikes, suggesting that a strong directional move is not yet confirmed.
{spot}(ICPUSDT)
$ICP is showing slightly bearish momentum, trading at $2.642, down approximately 3.15% according to your screenshot. The price dropped from around $2.649 before recovering from the $2.638 area, but it is now close to the MA60 level of $2.643. Immediate support lies around $2.638–$2.640, while resistance is near $2.645–$2.647. If ICP breaks below support, further downside is possible. However, a move above $2.645 could indicate a short-term recovery. Trading volume appears relatively low apart from a few spikes, suggesting that a strong directional move is not yet confirmed.
2
556
·
--
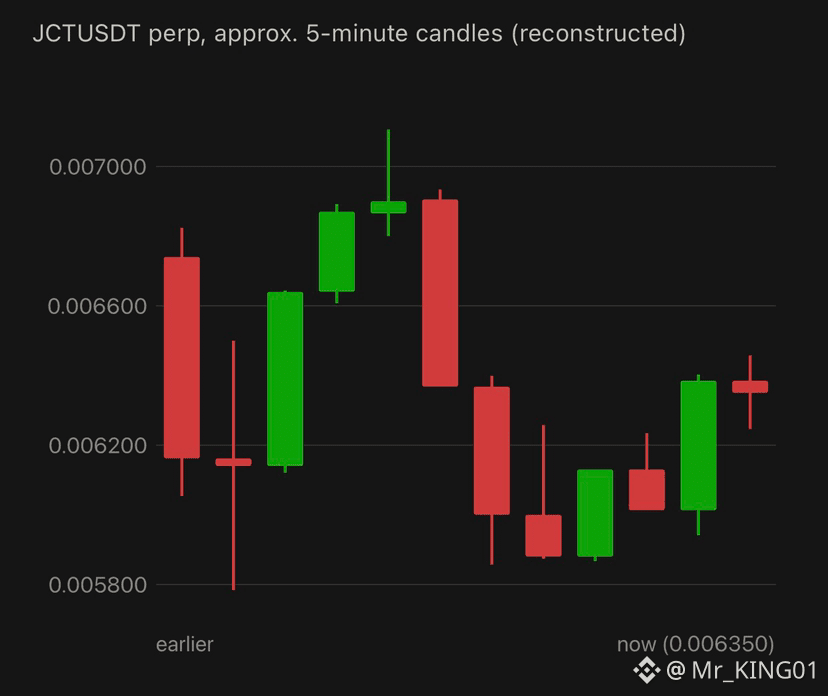
$JCT is trading at 0.006350 USDT with a mark price of 0.006303. It is up 26.70% over 24h, while “Today” shows +132.77%, which means it opened the day far lower. The 24h range is very wide at 0.001885–0.007210, on about 322.43M USDT in volume, so the price has more than tripled from its 24h low. Longer-term returns are huge (+211.27% over 7 days, +261.00% over 30 days, +48.47% over 90 days, +132.09% over 180 days), though no 1-year figure is shown, which usually means a short trading history. In the visible window, price climbed to a peak near 0.007106, fell sharply to about 0.00587, then recovered to the current level. It is sitting right on the MA60 (0.006349), and the order book leans toward buyers (65.37% bids vs 34.63% asks). Support is near 0.00600 and 0.00587, then the 24h low of 0.001885, and resistance is around 0.00640–0.00647, then 0.00710 and the 24h high of 0.007210. A hold above the MA60 would keep the recovery intact, while a drop below 0.00587 would put the lower range in play. A coin that has moved this far this fast, on a leveraged perp, can reverse sharply in either direction.
{future}(JCTUSDT)
$JCT is trading at 0.006350 USDT with a mark price of 0.006303. It is up 26.70% over 24h, while “Today” shows +132.77%, which means it opened the day far lower. The 24h range is very wide at 0.001885–0.007210, on about 322.43M USDT in volume, so the price has more than tripled from its 24h low. Longer-term returns are huge (+211.27% over 7 days, +261.00% over 30 days, +48.47% over 90 days, +132.09% over 180 days), though no 1-year figure is shown, which usually means a short trading history. In the visible window, price climbed to a peak near 0.007106, fell sharply to about 0.00587, then recovered to the current level. It is sitting right on the MA60 (0.006349), and the order book leans toward buyers (65.37% bids vs 34.63% asks). Support is near 0.00600 and 0.00587, then the 24h low of 0.001885, and resistance is around 0.00640–0.00647, then 0.00710 and the 24h high of 0.007210. A hold above the MA60 would keep the recovery intact, while a drop below 0.00587 would put the lower range in play. A coin that has moved this far this fast, on a leveraged perp, can reverse sharply in either direction.
465
·
--
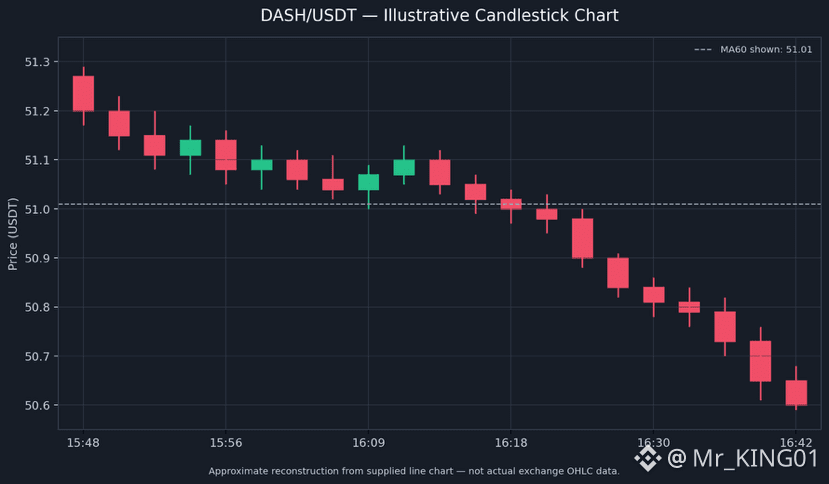
$DASH is showing bearish momentum, trading at $50.60, down approximately 3.71% according to your screenshot. The price has declined steadily from around $51.27 and is now below the MA60 level of $51.01, indicating continued selling pressure. Immediate support is around $50.33–$50.60, while resistance lies near $51.01–$51.17. If DASH breaks below support, further downside is possible. However, a recovery above $51.17 could signal a short-term rebound. Trading volume has increased during the decline, suggesting heightened market activity.
{spot}(DASHUSDT)
$DASH is showing bearish momentum, trading at $50.60, down approximately 3.71% according to your screenshot. The price has declined steadily from around $51.27 and is now below the MA60 level of $51.01, indicating continued selling pressure. Immediate support is around $50.33–$50.60, while resistance lies near $51.01–$51.17. If DASH breaks below support, further downside is possible. However, a recovery above $51.17 could signal a short-term rebound. Trading volume has increased during the decline, suggesting heightened market activity.
1
263
·
--
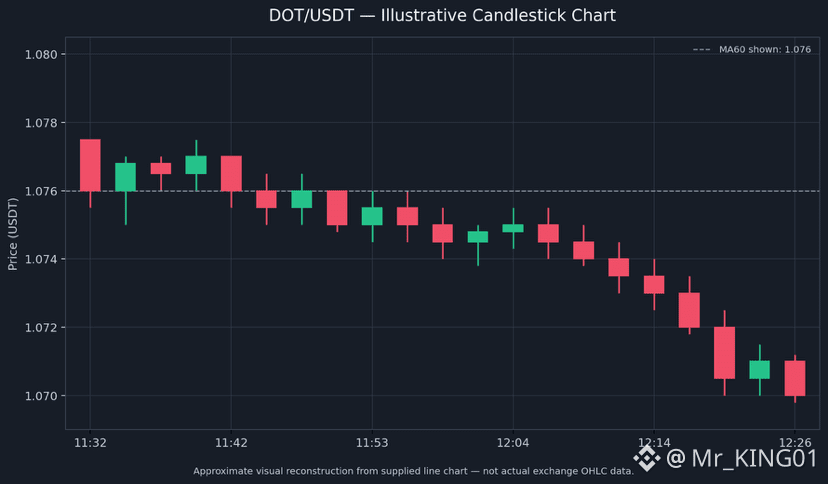
$DOT is showing strong bearish momentum, trading at $1.070, down approximately 10.46% according to your screenshot. The price has declined steadily from around $1.078 and is now below the MA60 level of $1.076, indicating selling pressure. Immediate support is around $1.067–$1.070, while resistance lies near $1.075–$1.077. If DOT breaks below support, further downside is possible; however, a recovery above resistance could signal a short-term rebound. Trading volume has increased during the latest decline, suggesting stronger selling activity. Watch price action carefully, as a sudden reversal is also possible.
{spot}(DOTUSDT)
$DOT is showing strong bearish momentum, trading at $1.070, down approximately 10.46% according to your screenshot. The price has declined steadily from around $1.078 and is now below the MA60 level of $1.076, indicating selling pressure. Immediate support is around $1.067–$1.070, while resistance lies near $1.075–$1.077. If DOT breaks below support, further downside is possible; however, a recovery above resistance could signal a short-term rebound. Trading volume has increased during the latest decline, suggesting stronger selling activity. Watch price action carefully, as a sudden reversal is also possible.
151
·
--
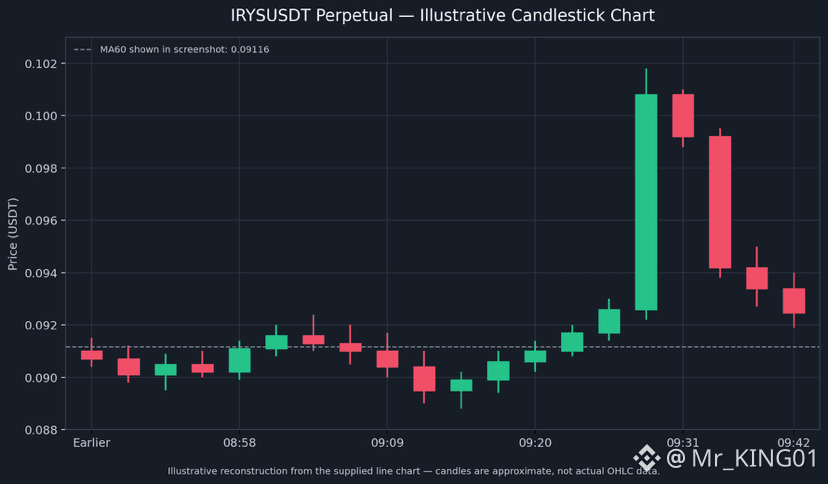
$IRYS is showing strong bullish momentum, with the price at $0.09246, up approximately 251.56% in 24 hours according to your screenshot. The chart shows a sharp price spike toward $0.1018, followed by a noticeable pullback, suggesting increased volatility and possible profit-taking. The price is currently near the MA60 level of $0.09116. Immediate resistance appears around $0.0940–$0.0950, with stronger resistance near $0.1000–$0.1020. Support is around $0.0910, followed by $0.0885. If buying pressure returns, IRYS may attempt another upward move; however, losing support could lead to further downside. Caution: After such a rapid rise, volatility and reversal risk are elevated. These levels are estimates based on your screenshot, not a live trading signal.
{future}(IRYSUSDT)
$IRYS is showing strong bullish momentum, with the price at $0.09246, up approximately 251.56% in 24 hours according to your screenshot. The chart shows a sharp price spike toward $0.1018, followed by a noticeable pullback, suggesting increased volatility and possible profit-taking. The price is currently near the MA60 level of $0.09116. Immediate resistance appears around $0.0940–$0.0950, with stronger resistance near $0.1000–$0.1020. Support is around $0.0910, followed by $0.0885. If buying pressure returns, IRYS may attempt another upward move; however, losing support could lead to further downside. Caution: After such a rapid rise, volatility and reversal risk are elevated. These levels are estimates based on your screenshot, not a live trading signal.
445
·
--
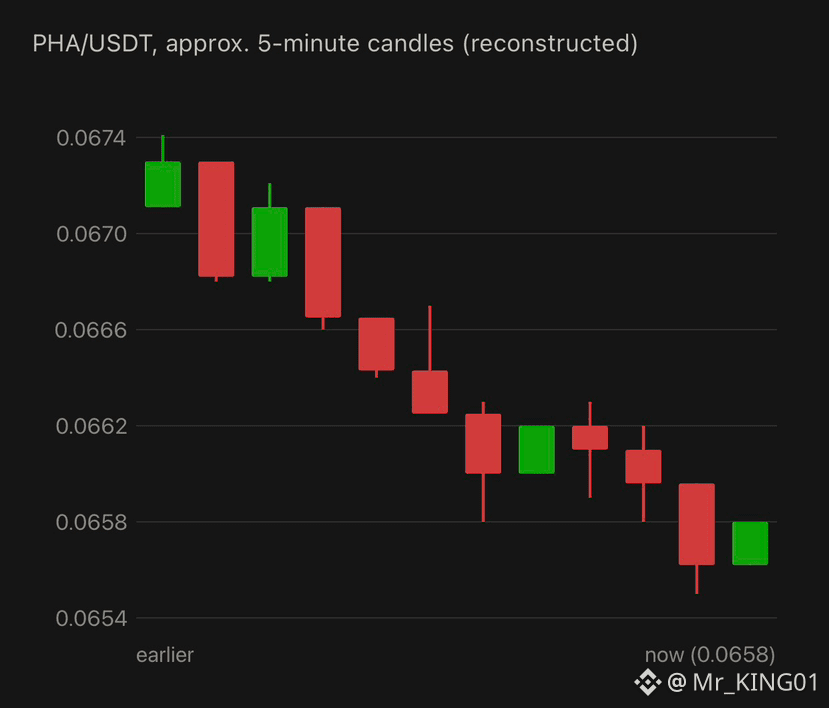
$PHA is trading at 0.0658 USDT, up 1.39% in 24h (the “Today” figure shows +2.33%), with a range of 0.0593–0.0690 and about 5.21M USDT (81.58M PHA) in volume. The medium-term trend is strong: +27.52% over 7 days, +43.04% over 30 days, +196.40% over 90 days, +94.67% over 180 days and +13.06% over 1 year. In the visible window, price slid in steps from about 0.0674 to a low near 0.0655, with brief rebounds along the way, and has bounced slightly into a flat close at 0.0658. It is below the MA60 (0.0665), which is turning down, so the short-term momentum favors sellers despite the strong longer-term gains. The order book leans slightly toward buyers (53.91% bids vs 46.09% asks). Support is near 0.0655, then 0.0654 and the 24h low of 0.0593, and resistance is at the MA60 (0.0665), then 0.0671 and the 24h high of 0.0690. A move back above the MA60 would suggest the pullback is ending, while a break below 0.0654 would extend it.
{spot}(PHAUSDT)
$PHA is trading at 0.0658 USDT, up 1.39% in 24h (the “Today” figure shows +2.33%), with a range of 0.0593–0.0690 and about 5.21M USDT (81.58M PHA) in volume. The medium-term trend is strong: +27.52% over 7 days, +43.04% over 30 days, +196.40% over 90 days, +94.67% over 180 days and +13.06% over 1 year. In the visible window, price slid in steps from about 0.0674 to a low near 0.0655, with brief rebounds along the way, and has bounced slightly into a flat close at 0.0658. It is below the MA60 (0.0665), which is turning down, so the short-term momentum favors sellers despite the strong longer-term gains. The order book leans slightly toward buyers (53.91% bids vs 46.09% asks). Support is near 0.0655, then 0.0654 and the 24h low of 0.0593, and resistance is at the MA60 (0.0665), then 0.0671 and the 24h high of 0.0690. A move back above the MA60 would suggest the pullback is ending, while a break below 0.0654 would extend it.
193
·
--
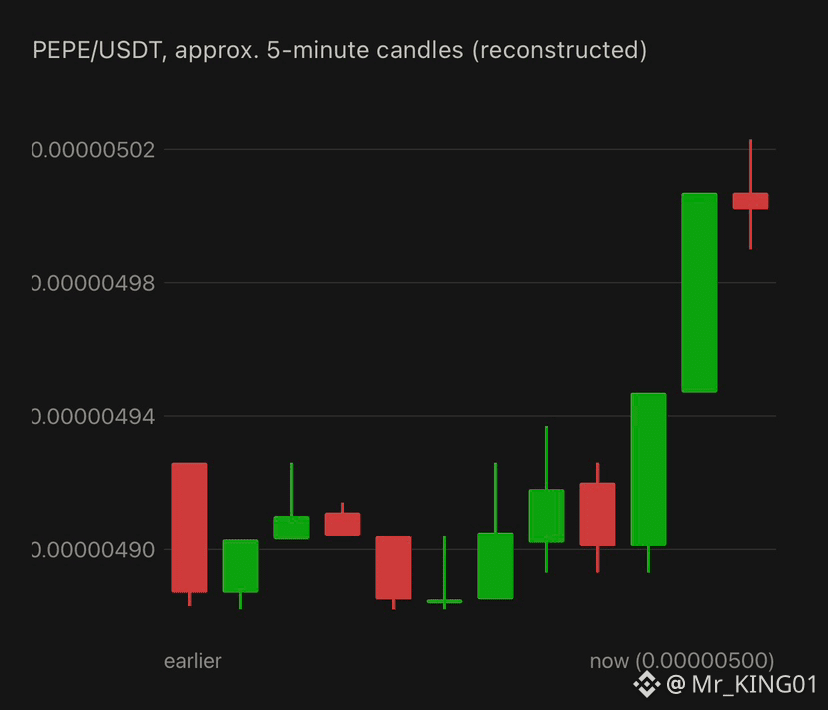
$PEPE is trading at 0.00000500 USDT, up 11.11% in 24h (the “Today” figure shows +13.38%), with a range of 0.00000433–0.00000504 and about 58.96M USDT in volume. That is roughly 25% above the 0.00000401 level in your earlier PEPE screenshot. Returns are positive over most periods: +20.19% over 7 days, +1.83% over 30 days, +83.82% over 90 days and +30.89% over 180 days, though it is still -26.14% over 1 year. In the visible window, price spent most of the time in a choppy base between about 0.00000488 and 0.00000493. It then broke out sharply to about 0.00000502 on rising green volume and has pulled back slightly. Price is now well above the MA60 (0.00000492), which is turning up, so the short-term trend favors buyers. The order book is nearly balanced (52.27% bids vs 47.73% asks), and the best bid (0.00000499) and ask (0.00000500) are one tick apart. Support is near the MA60 (0.00000492), then 0.00000490 and the 24h low of 0.00000433, and resistance is at 0.00000502–0.00000504 (the 24h high). A hold above 0.00000500 would keep the breakout intact, while a drop back under the MA60 would suggest it was a short spike. After a move this fast, sharp pullbacks are common.
{spot}(PEPEUSDT)
$PEPE is trading at 0.00000500 USDT, up 11.11% in 24h (the “Today” figure shows +13.38%), with a range of 0.00000433–0.00000504 and about 58.96M USDT in volume. That is roughly 25% above the 0.00000401 level in your earlier PEPE screenshot. Returns are positive over most periods: +20.19% over 7 days, +1.83% over 30 days, +83.82% over 90 days and +30.89% over 180 days, though it is still -26.14% over 1 year. In the visible window, price spent most of the time in a choppy base between about 0.00000488 and 0.00000493. It then broke out sharply to about 0.00000502 on rising green volume and has pulled back slightly. Price is now well above the MA60 (0.00000492), which is turning up, so the short-term trend favors buyers. The order book is nearly balanced (52.27% bids vs 47.73% asks), and the best bid (0.00000499) and ask (0.00000500) are one tick apart. Support is near the MA60 (0.00000492), then 0.00000490 and the 24h low of 0.00000433, and resistance is at 0.00000502–0.00000504 (the 24h high). A hold above 0.00000500 would keep the breakout intact, while a drop back under the MA60 would suggest it was a short spike. After a move this fast, sharp pullbacks are common.
106
·
--
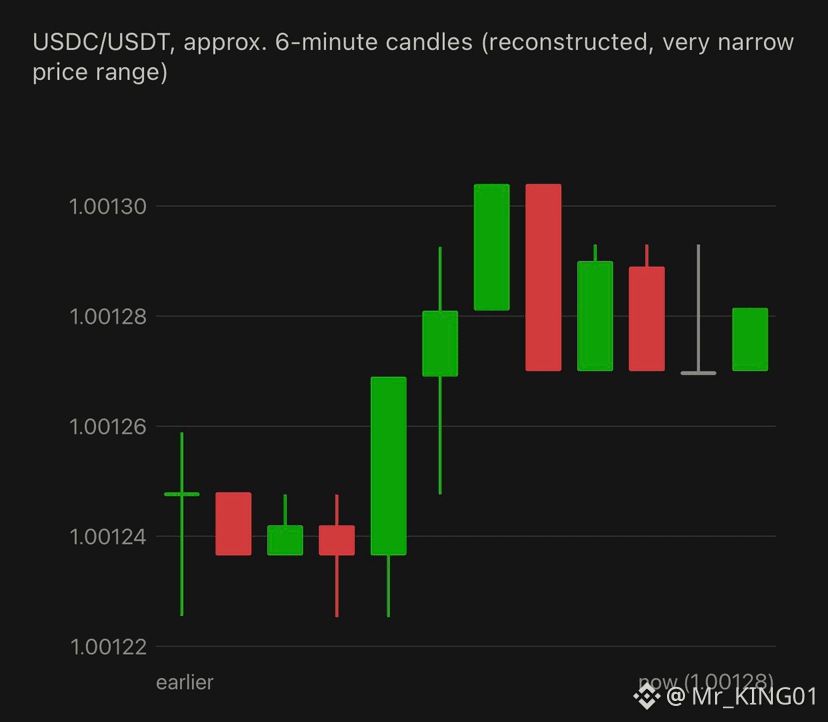
$USDC is trading at 1.00128, up 0.05% in 24h, with a range of only 1.00068–1.00134 and about 1.82B USDT in volume. USDC is a stablecoin, so this pair mostly shows how USDC is priced against USDT, not an investment trend. Returns are tiny across all periods: +0.04% over 7 days, +0.13% over 30 days, +0.05% over 90 days, +0.17% over 180 days and +0.16% over 1 year. The chart looks dramatic only because the axis is zoomed in to a few hundredths of a percent. In the visible window, price rose from about 1.00122 to a peak near 1.00130, then moved sideways between 1.00127 and 1.00129. It is just above the MA60 (1.00126), and the order book leans slightly toward buyers (58.52% bids vs 41.48% asks). Support is near 1.00122, then the 24h low of 1.00068, and resistance is around 1.00131, then the 24h high of 1.00134. The main risk with stablecoins is a loss of peg, so a move well outside this narrow band (for example below 0.999) would be the signal to watch.
{spot}(USDCUSDT)
$USDC is trading at 1.00128, up 0.05% in 24h, with a range of only 1.00068–1.00134 and about 1.82B USDT in volume. USDC is a stablecoin, so this pair mostly shows how USDC is priced against USDT, not an investment trend. Returns are tiny across all periods: +0.04% over 7 days, +0.13% over 30 days, +0.05% over 90 days, +0.17% over 180 days and +0.16% over 1 year. The chart looks dramatic only because the axis is zoomed in to a few hundredths of a percent. In the visible window, price rose from about 1.00122 to a peak near 1.00130, then moved sideways between 1.00127 and 1.00129. It is just above the MA60 (1.00126), and the order book leans slightly toward buyers (58.52% bids vs 41.48% asks). Support is near 1.00122, then the 24h low of 1.00068, and resistance is around 1.00131, then the 24h high of 1.00134. The main risk with stablecoins is a loss of peg, so a move well outside this narrow band (for example below 0.999) would be the signal to watch.
69
Log in to explore more content
Join global crypto users on Binance Square
⚡️ Get latest and useful information about crypto.
💬 Trusted by the world’s largest crypto exchange.
👍 Discover real insights from verified creators.
Email / Phone number
Trending Topics
EarningsSeason
6.6M views
32,876 Discussing
Earnings Season Session 3: Will Google & Microsoft Beat Earnings Expectations?
Binance Square Official
·184 Likes
·109.4k views
USMidtermElections
78,596 views
1,006 Discussing
StrategySTRCReaches$99.95ForFirstTimeIn165Days
281 views
16 Discussing