

半只猴子
1.3k Posts
半只猴子
Report
Block User
meme玩家
X:半只猴子 monkeyd_long
Frequent Trader
5.7 Years
81 Following
2.9K+ Followers
5.1K+ Liked
Posts
All
Quotes
Videos
PINNED
·
--
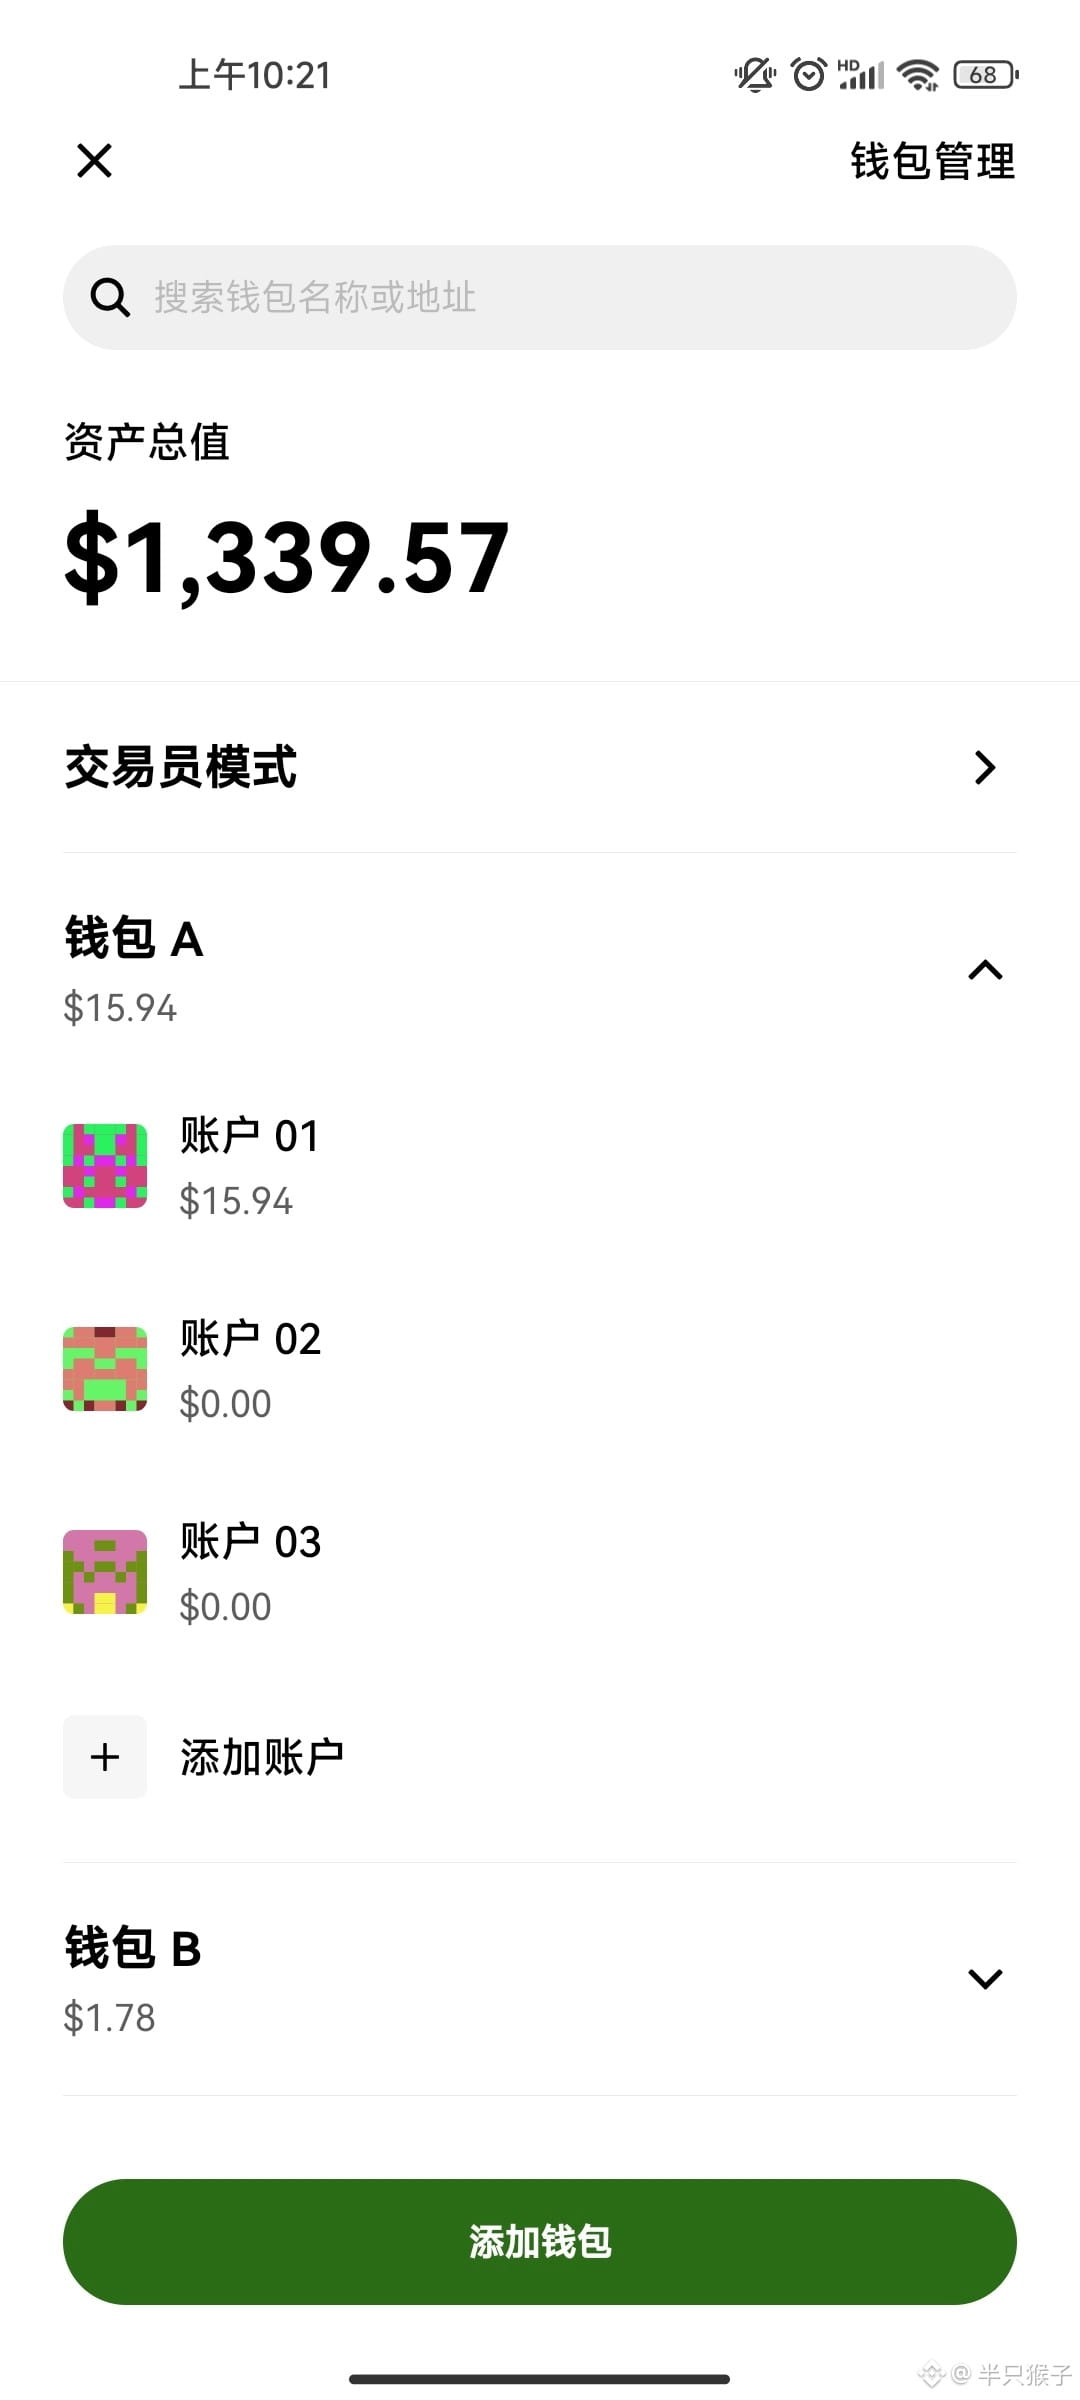
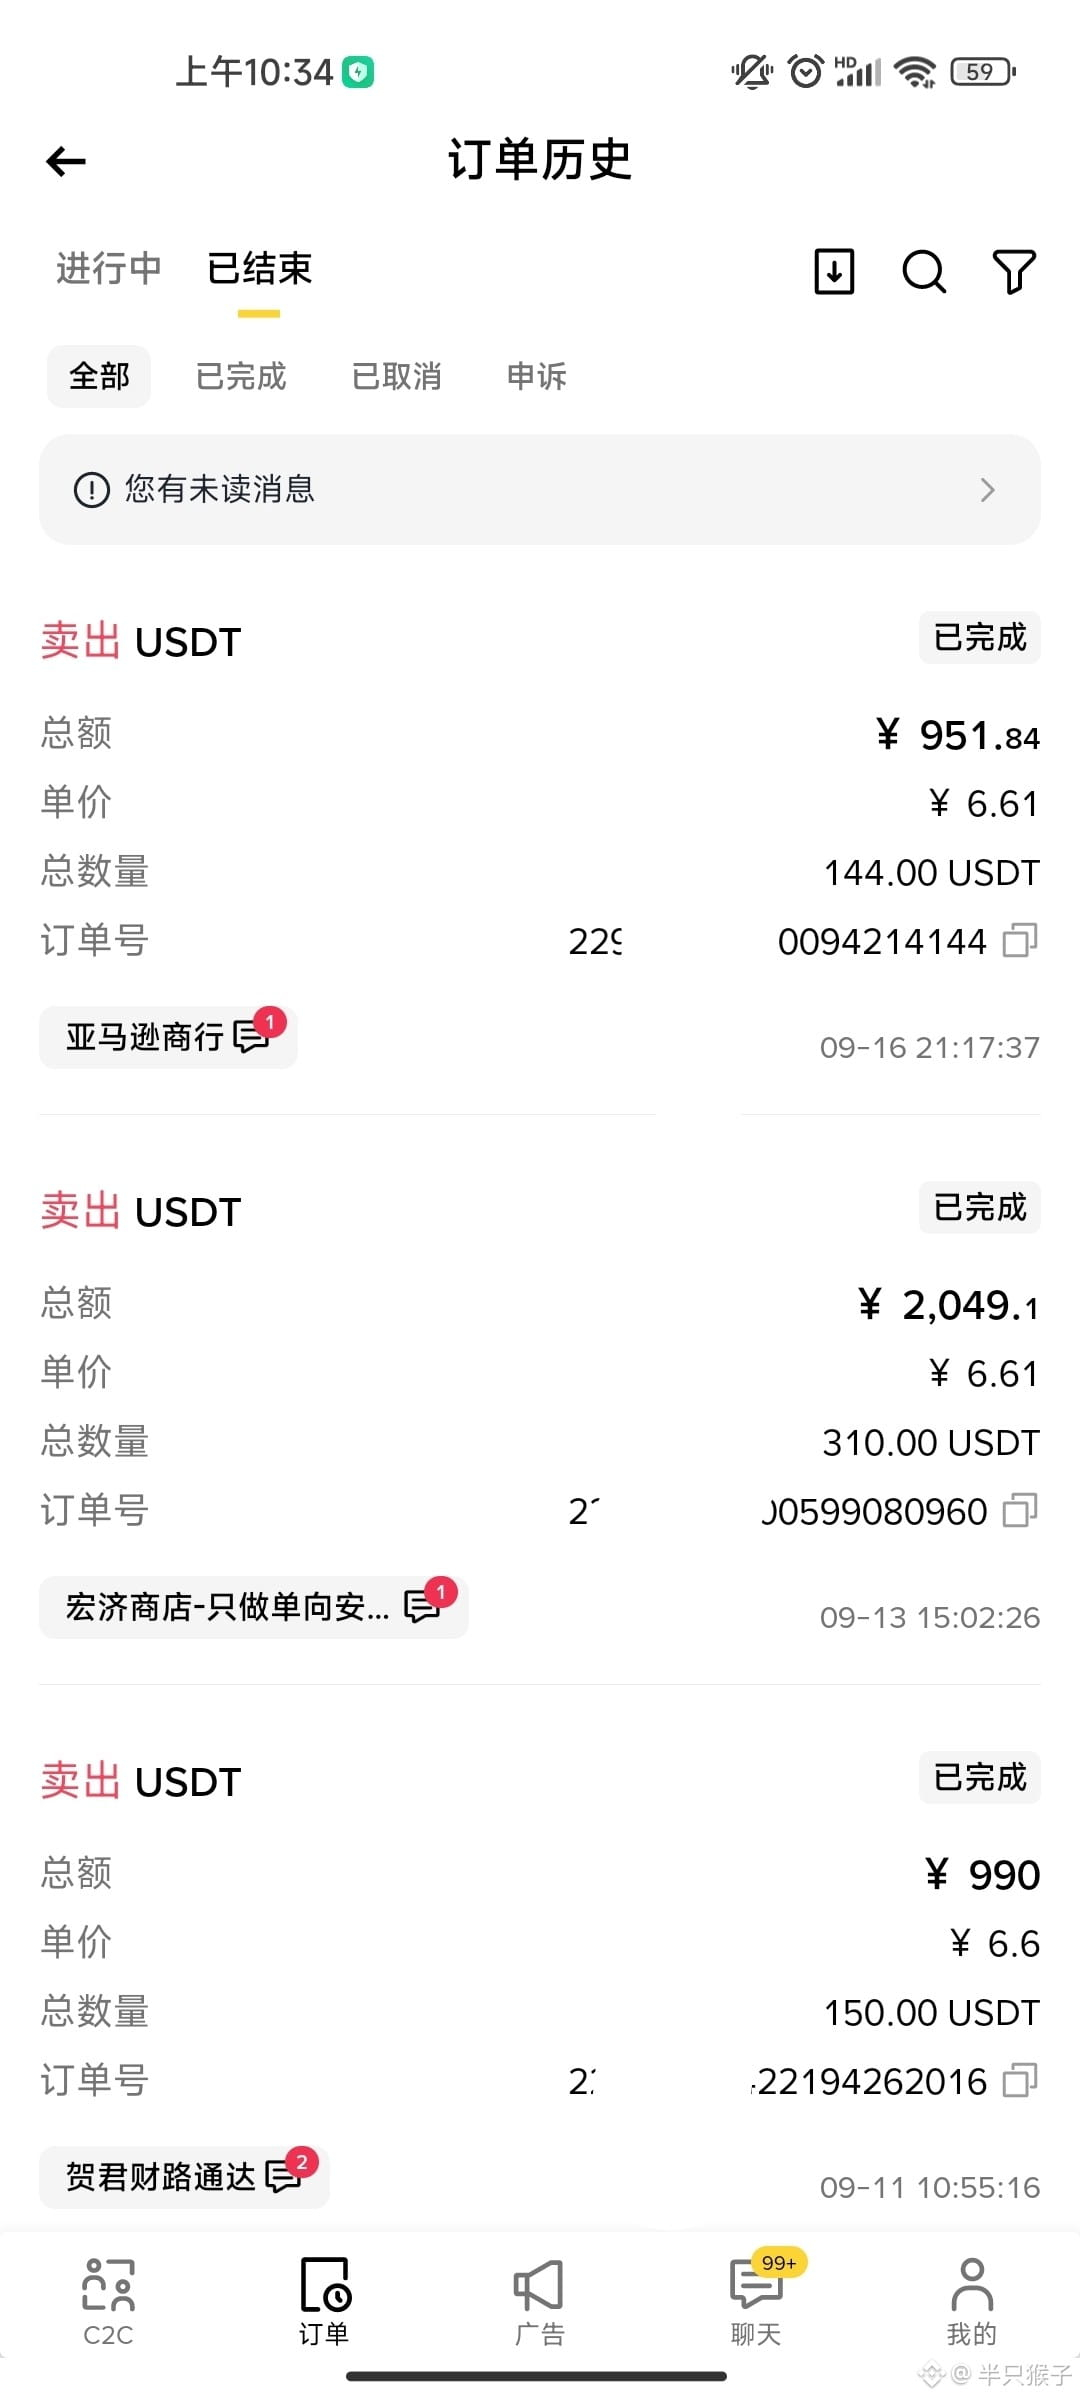
7u challenge to make 100 million!
Day 28
Principal: 7u, target: 100 million
Current: 3650u
Survival cost: 1550u
Available funds: 2100u+
My principal is still too small. As for the contracts, I currently hold a long position in Bitcoin $BTC and PONS; spot holdings are basically $BNB ; as for meme coins, I hold a few, mainly laying in wait.
So the overall approach to increasing principal remains unchanged: create content, trade contracts, and go for memes.
For the Bitcoin longs, there are two major risks recently: rate hikes and the CLARITY Act. With the downside already priced in, and no drop to 740,000 USD, overall I still maintain that this is a bull market!
For PONS, I’m considering adding to the position if it’s in profit. Its fundamentals have already fallen back quite a lot from the earlier peak, but in the market, there aren’t many such assets.
As for memes: the past week of high-intensity chain-scanning made my eyes hurt. Yesterday I tried it again—basically I had to rest after 15 minutes. One of them pumped 3x yesterday, and I didn’t take action. After that, I only made a little.
This is a big issue with how I go after meme coins. Once I buy, I like to hold on. When it goes up 1x, 2x, even a few times, I basically don’t exit. I just like holding it. In the end, not only did I not make money, a whole bunch went to zero. It may be necessary to change this kind of strategy.
{future}(PONSUSDT)
7u challenge to make 100 million!
Day 28
Principal: 7u, target: 100 million
Current: 3650u
Survival cost: 1550u
Available funds: 2100u+
My principal is still too small. As for the contracts, I currently hold a long position in Bitcoin $BTC and PONS; spot holdings are basically $BNB ; as for meme coins, I hold a few, mainly laying in wait.
So the overall approach to increasing principal remains unchanged: create content, trade contracts, and go for memes.
For the Bitcoin longs, there are two major risks recently: rate hikes and the CLARITY Act. With the downside already priced in, and no drop to 740,000 USD, overall I still maintain that this is a bull market!
For PONS, I’m considering adding to the position if it’s in profit. Its fundamentals have already fallen back quite a lot from the earlier peak, but in the market, there aren’t many such assets.
As for memes: the past week of high-intensity chain-scanning made my eyes hurt. Yesterday I tried it again—basically I had to rest after 15 minutes. One of them pumped 3x yesterday, and I didn’t take action. After that, I only made a little.
This is a big issue with how I go after meme coins. Once I buy, I like to hold on. When it goes up 1x, 2x, even a few times, I basically don’t exit. I just like holding it. In the end, not only did I not make money, a whole bunch went to zero. It may be necessary to change this kind of strategy.
Day 28
Principal: 7u, target: 100 million
Current: 3650u
Survival cost: 1550u
Available funds: 2100u+
My principal is still too small. As for the contracts, I currently hold a long position in Bitcoin $BTC and PONS; spot holdings are basically $BNB ; as for meme coins, I hold a few, mainly laying in wait.
So the overall approach to increasing principal remains unchanged: create content, trade contracts, and go for memes.
For the Bitcoin longs, there are two major risks recently: rate hikes and the CLARITY Act. With the downside already priced in, and no drop to 740,000 USD, overall I still maintain that this is a bull market!
For PONS, I’m considering adding to the position if it’s in profit. Its fundamentals have already fallen back quite a lot from the earlier peak, but in the market, there aren’t many such assets.
As for memes: the past week of high-intensity chain-scanning made my eyes hurt. Yesterday I tried it again—basically I had to rest after 15 minutes. One of them pumped 3x yesterday, and I didn’t take action. After that, I only made a little.
This is a big issue with how I go after meme coins. Once I buy, I like to hold on. When it goes up 1x, 2x, even a few times, I basically don’t exit. I just like holding it. In the end, not only did I not make money, a whole bunch went to zero. It may be necessary to change this kind of strategy.
10
6
1.8k
·
--
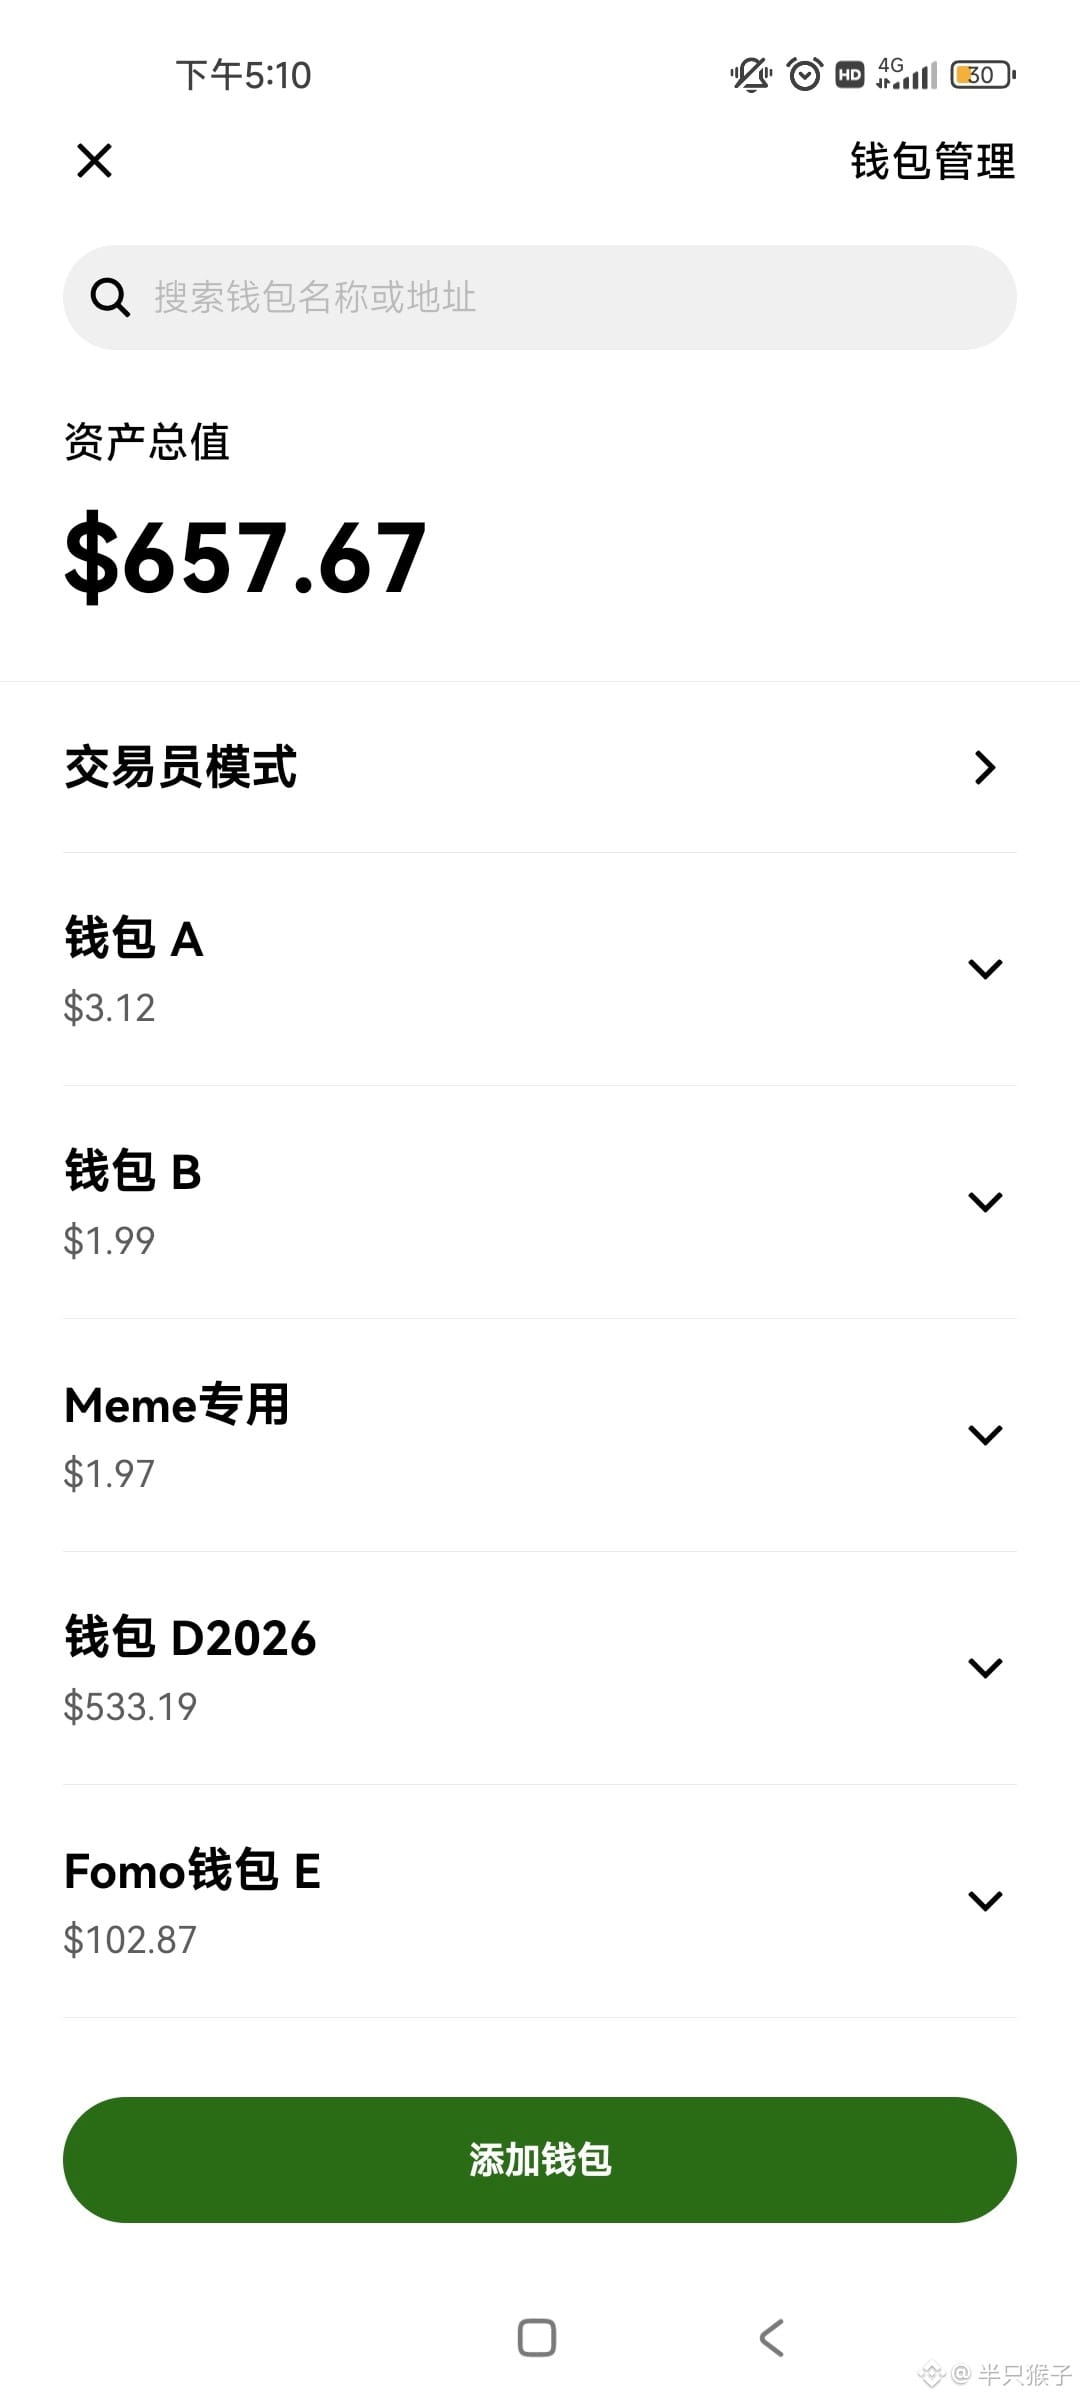
7u Challenge One Hundred Million!
Day 42
Principal: 7u, Goal: 100,000,000
Current: 3900u
Survival cost: 2600u
Available funds: 1300u+
During the National Day holiday, all kinds of market makers, funds, big players, etc. are on break. Maybe this is the strength we have during our long holiday. The market basically hasn’t changed; all news and emotions only get released in a concentrated way after the holiday.
1. Today, it was unexpected that Bitcoin $BTC could break out of the triangle. Just hold the long position; I don’t want to look at anything else.
2. Looking at $PUMP makes me like it more and more. The daily income and buybacks are way too aggressive.
3. $ENA has been a little interesting lately. In addition to the four major updates announced at the beginning of last month, there’s been constant movement this month too. The team is actually doing things.
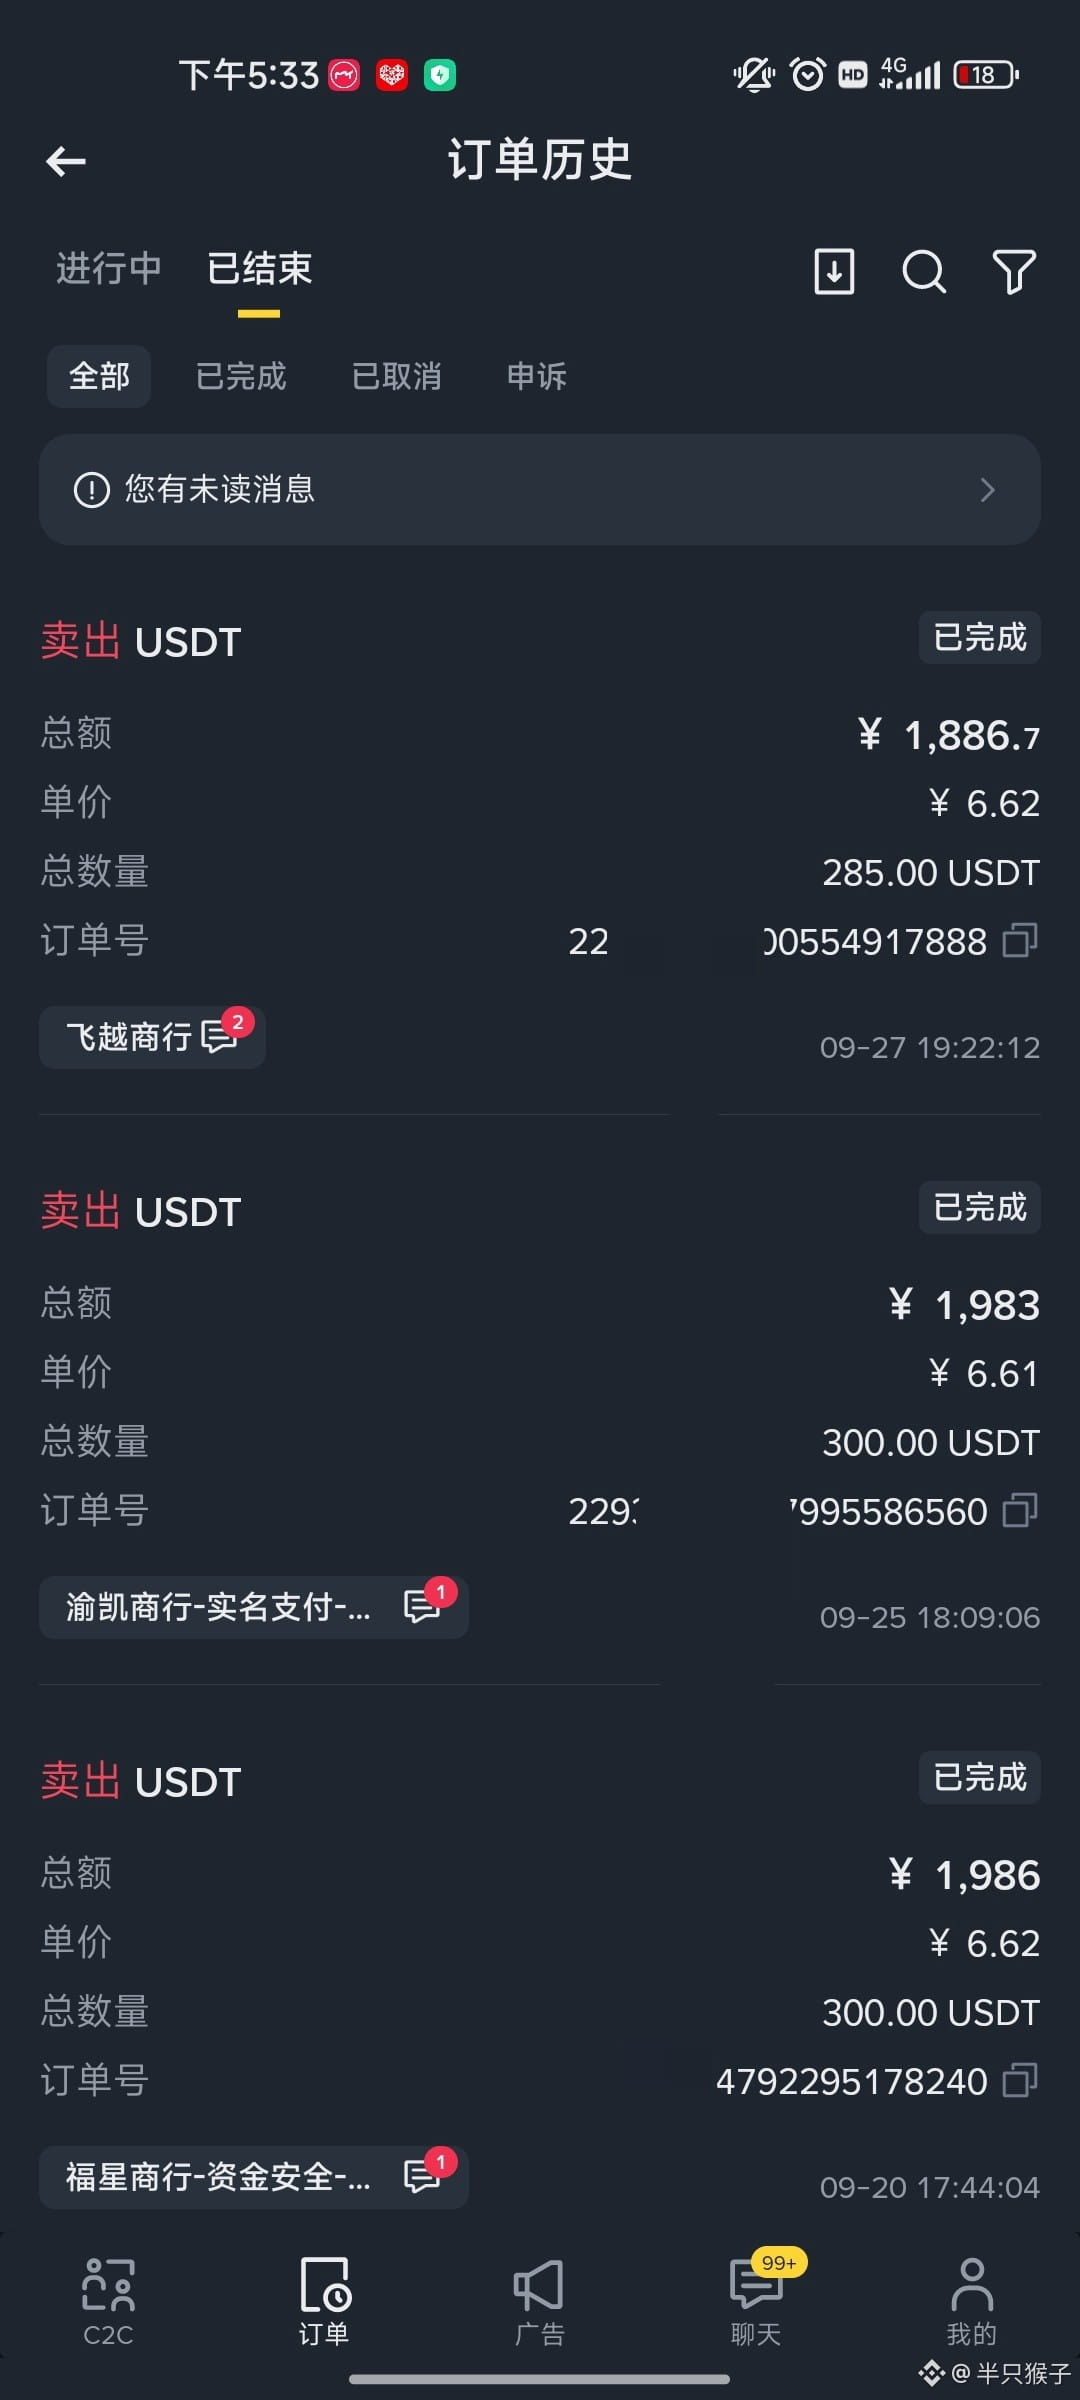
The meme that was set up got caught in another trap—broke badly. It also delayed capital, missing the moment when it crossed over ten thousand USD. The core issue is that I’ve been too lazy recently and didn’t sweep the chain. That’s not good.
7u Challenge One Hundred Million!
Day 42
Principal: 7u, Goal: 100,000,000
Current: 3900u
Survival cost: 2600u
Available funds: 1300u+
During the National Day holiday, all kinds of market makers, funds, big players, etc. are on break. Maybe this is the strength we have during our long holiday. The market basically hasn’t changed; all news and emotions only get released in a concentrated way after the holiday.
1. Today, it was unexpected that Bitcoin $BTC could break out of the triangle. Just hold the long position; I don’t want to look at anything else.
2. Looking at $PUMP makes me like it more and more. The daily income and buybacks are way too aggressive.
3. $ENA has been a little interesting lately. In addition to the four major updates announced at the beginning of last month, there’s been constant movement this month too. The team is actually doing things.
The meme that was set up got caught in another trap—broke badly. It also delayed capital, missing the moment when it crossed over ten thousand USD. The core issue is that I’ve been too lazy recently and didn’t sweep the chain. That’s not good.
Day 42
Principal: 7u, Goal: 100,000,000
Current: 3900u
Survival cost: 2600u
Available funds: 1300u+
During the National Day holiday, all kinds of market makers, funds, big players, etc. are on break. Maybe this is the strength we have during our long holiday. The market basically hasn’t changed; all news and emotions only get released in a concentrated way after the holiday.
1. Today, it was unexpected that Bitcoin $BTC could break out of the triangle. Just hold the long position; I don’t want to look at anything else.
2. Looking at $PUMP makes me like it more and more. The daily income and buybacks are way too aggressive.
3. $ENA has been a little interesting lately. In addition to the four major updates announced at the beginning of last month, there’s been constant movement this month too. The team is actually doing things.
The meme that was set up got caught in another trap—broke badly. It also delayed capital, missing the moment when it crossed over ten thousand USD. The core issue is that I’ve been too lazy recently and didn’t sweep the chain. That’s not good.
1.1k
·
--
Perpetual Contract Inventor: $HYPE is still the best perp DEX, but the risk-reward ratio is no longer what it used to be.
In an interview at the 2026 KBW event, he talked about HYPE.
His core point can be summed up in one sentence: HYPE is still the best perp DEX, but the risk-reward ratio is no longer as good as it was early on.
His own trades:
He bought HYPE around $30 and sold it at $75.
After that, when HYPE fell back to the $50s, he couldn’t find a suitable opportunity to re-enter.
Buy at $30, sell at $75—then he never got back on.
Why is he still bullish, yet not buying?
He believes that HYPE still holds the lead thanks to its liquidity, brand, and token economics.
But as more competitors enter, the risk-reward profile has changed.
Put simply: the best project doesn’t necessarily mean the best entry point. The project is still the same, but the price is no longer the same.
{future}(HYPEUSDT)
Perpetual Contract Inventor: $HYPE is still the best perp DEX, but the risk-reward ratio is no longer what it used to be.
In an interview at the 2026 KBW event, he talked about HYPE.
His core point can be summed up in one sentence: HYPE is still the best perp DEX, but the risk-reward ratio is no longer as good as it was early on.
His own trades:
He bought HYPE around $30 and sold it at $75.
After that, when HYPE fell back to the $50s, he couldn’t find a suitable opportunity to re-enter.
Buy at $30, sell at $75—then he never got back on.
Why is he still bullish, yet not buying?
He believes that HYPE still holds the lead thanks to its liquidity, brand, and token economics.
But as more competitors enter, the risk-reward profile has changed.
Put simply: the best project doesn’t necessarily mean the best entry point. The project is still the same, but the price is no longer the same.
In an interview at the 2026 KBW event, he talked about HYPE.
His core point can be summed up in one sentence: HYPE is still the best perp DEX, but the risk-reward ratio is no longer as good as it was early on.
His own trades:
He bought HYPE around $30 and sold it at $75.
After that, when HYPE fell back to the $50s, he couldn’t find a suitable opportunity to re-enter.
Buy at $30, sell at $75—then he never got back on.
Why is he still bullish, yet not buying?
He believes that HYPE still holds the lead thanks to its liquidity, brand, and token economics.
But as more competitors enter, the risk-reward profile has changed.
Put simply: the best project doesn’t necessarily mean the best entry point. The project is still the same, but the price is no longer the same.

1.3k
·
--
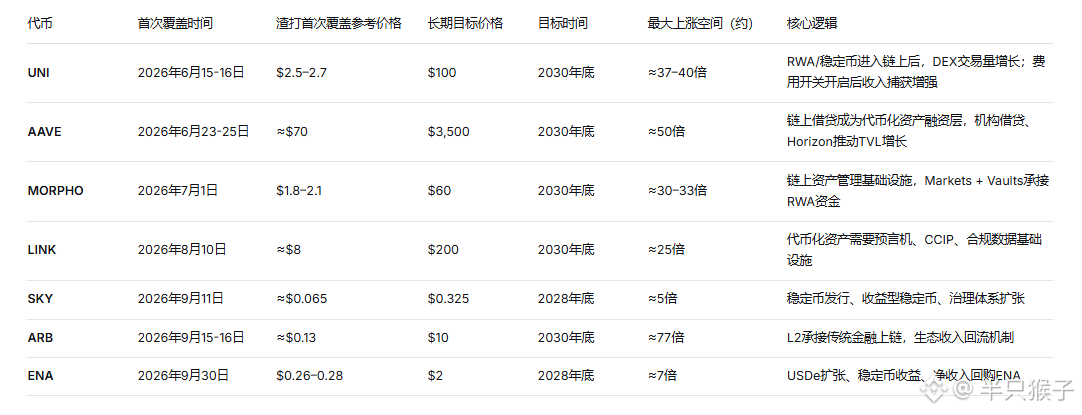
Standard Chartered Annual “Pipe-Dream” Record: Target Prices for 7 Coins—The Most Aggressive One Is Set to Rise 77 Times
This year, Standard Chartered has made quite a few bold predictions about crypto assets. I’ve gathered them for everyone to see when each coin might reach its target price. The target prices for each coin are shown in the image.
The bank’s core judgments are:
1. The size of on-chain tokenized assets will grow from the current level of about $340 billion to $4 trillion by 2028.
2. The share of capital flowing into DeFi will keep rising, and by 2030 will drive DeFi deployed assets to about $2.7 trillion—around 37 times the current level.
The logic benefiting each track:
$UNI will capture transaction demand
$AAVE and MORPHO will capture lending and borrowing demand
LINK will capture oracle and cross-chain demand
SKY and ENA will capture stablecoin demand
$ARB will capture demand for on-chain infrastructure
{future}(ARBUSDT)
Standard Chartered Annual “Pipe-Dream” Record: Target Prices for 7 Coins—The Most Aggressive One Is Set to Rise 77 Times
This year, Standard Chartered has made quite a few bold predictions about crypto assets. I’ve gathered them for everyone to see when each coin might reach its target price. The target prices for each coin are shown in the image.
The bank’s core judgments are:
1. The size of on-chain tokenized assets will grow from the current level of about $340 billion to $4 trillion by 2028.
2. The share of capital flowing into DeFi will keep rising, and by 2030 will drive DeFi deployed assets to about $2.7 trillion—around 37 times the current level.
The logic benefiting each track:
$UNI will capture transaction demand
$AAVE and MORPHO will capture lending and borrowing demand
LINK will capture oracle and cross-chain demand
SKY and ENA will capture stablecoin demand
$ARB will capture demand for on-chain infrastructure
This year, Standard Chartered has made quite a few bold predictions about crypto assets. I’ve gathered them for everyone to see when each coin might reach its target price. The target prices for each coin are shown in the image.
The bank’s core judgments are:
1. The size of on-chain tokenized assets will grow from the current level of about $340 billion to $4 trillion by 2028.
2. The share of capital flowing into DeFi will keep rising, and by 2030 will drive DeFi deployed assets to about $2.7 trillion—around 37 times the current level.
The logic benefiting each track:
$UNI will capture transaction demand
$AAVE and MORPHO will capture lending and borrowing demand
LINK will capture oracle and cross-chain demand
SKY and ENA will capture stablecoin demand
$ARB will capture demand for on-chain infrastructure
6
2
10.7k
·
--
Partly True
Mystery giant whale sells $ETH , turns around and buys $UNI
{future}(ETHUSDT)
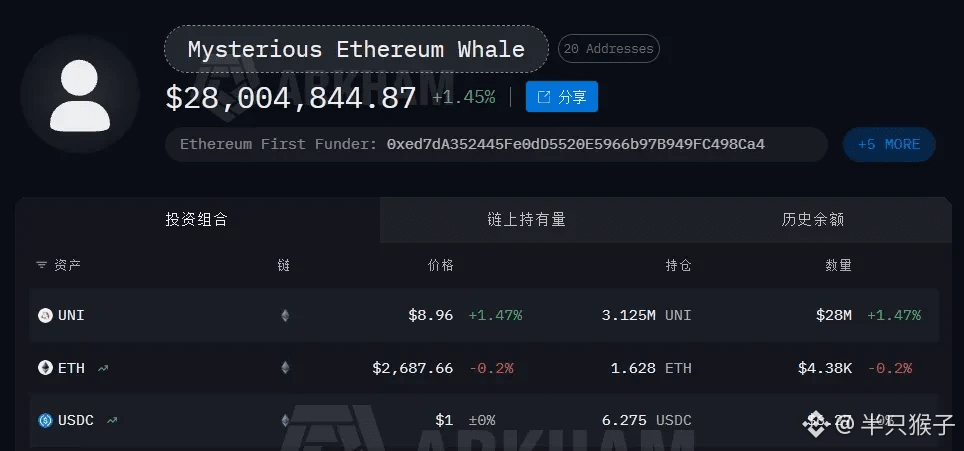
On-chain data shows that a mysterious giant whale sold all 167,855 ETH, worth $408 million.
Then, he immediately bought 3.125 million UNI, worth $24.2 million.
Currently, this UNI position has generated an unrealized profit of $3.78 million.
{future}(UNIUSDT)
A few noteworthy points:
First, he liquidated the ETH and heavily accumulated UNI. Selling all $408 million worth of ETH—by itself, speaks volumes.
Second, the timing of the buy was spot on. He started the position at $7.75, and UNI is now above $10, with a floating gain of $3.78 million.
Third, UNI’s recent narrative has shifted. The SEC’s tokenized stock exemption has been finalized, Uniswap’s permissioned pool has been called out, and in the tokenized stock DEX trading volume, Uniswap accounts for six-tenths.
The whale’s moves are often worth paying attention to.
Mystery giant whale sells $ETH , turns around and buys $UNI
On-chain data shows that a mysterious giant whale sold all 167,855 ETH, worth $408 million.
Then, he immediately bought 3.125 million UNI, worth $24.2 million.
Currently, this UNI position has generated an unrealized profit of $3.78 million.
A few noteworthy points:
First, he liquidated the ETH and heavily accumulated UNI. Selling all $408 million worth of ETH—by itself, speaks volumes.
Second, the timing of the buy was spot on. He started the position at $7.75, and UNI is now above $10, with a floating gain of $3.78 million.
Third, UNI’s recent narrative has shifted. The SEC’s tokenized stock exemption has been finalized, Uniswap’s permissioned pool has been called out, and in the tokenized stock DEX trading volume, Uniswap accounts for six-tenths.
The whale’s moves are often worth paying attention to.
On-chain data shows that a mysterious giant whale sold all 167,855 ETH, worth $408 million.
Then, he immediately bought 3.125 million UNI, worth $24.2 million.
Currently, this UNI position has generated an unrealized profit of $3.78 million.
A few noteworthy points:
First, he liquidated the ETH and heavily accumulated UNI. Selling all $408 million worth of ETH—by itself, speaks volumes.
Second, the timing of the buy was spot on. He started the position at $7.75, and UNI is now above $10, with a floating gain of $3.78 million.
Third, UNI’s recent narrative has shifted. The SEC’s tokenized stock exemption has been finalized, Uniswap’s permissioned pool has been called out, and in the tokenized stock DEX trading volume, Uniswap accounts for six-tenths.
The whale’s moves are often worth paying attention to.
1.3k
·
--
In the past 7 days, whose power—buyers or sellers—is stronger?
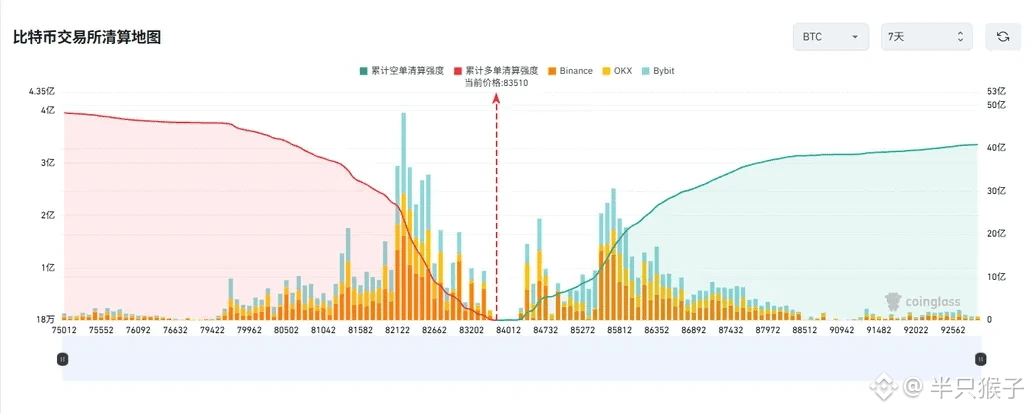
I just looked at the Bitcoin $BTC liquidation map. On this chart, it’s clear to see which side—buyers or sellers—has more strength:
Red line: Cumulative long liquidation strength. Starting from 83,510, it climbs steadily to the left, reaching more than $4.8 billion at the far left. Around 82,500, the cumulative amount reaches $2.65 billion. This means that if the price drops, a large wave of long positions will be liquidated.
Green line: Cumulative short liquidation strength. Starting from 83,510, it climbs steadily upward, piling up to more than $4 billion on the right side. Near 86,000, the cumulative amount reaches $2 billion. This means that if the price moves up, there’s a big block of short positions waiting to be liquidated.
Right now, Bitcoin’s key level is around 82,500. The longs have deployed heavy forces at this spot, while the shorts have gathered around 85,000.
During the National Day holiday, it appears that the influence of both sides is roughly balanced. Most likely, the entire holiday will be a choppy, range-bound market with no clear direction.
In the past 7 days, whose power—buyers or sellers—is stronger?
I just looked at the Bitcoin $BTC liquidation map. On this chart, it’s clear to see which side—buyers or sellers—has more strength:
Red line: Cumulative long liquidation strength. Starting from 83,510, it climbs steadily to the left, reaching more than $4.8 billion at the far left. Around 82,500, the cumulative amount reaches $2.65 billion. This means that if the price drops, a large wave of long positions will be liquidated.
Green line: Cumulative short liquidation strength. Starting from 83,510, it climbs steadily upward, piling up to more than $4 billion on the right side. Near 86,000, the cumulative amount reaches $2 billion. This means that if the price moves up, there’s a big block of short positions waiting to be liquidated.
Right now, Bitcoin’s key level is around 82,500. The longs have deployed heavy forces at this spot, while the shorts have gathered around 85,000.
During the National Day holiday, it appears that the influence of both sides is roughly balanced. Most likely, the entire holiday will be a choppy, range-bound market with no clear direction.
I just looked at the Bitcoin $BTC liquidation map. On this chart, it’s clear to see which side—buyers or sellers—has more strength:
Red line: Cumulative long liquidation strength. Starting from 83,510, it climbs steadily to the left, reaching more than $4.8 billion at the far left. Around 82,500, the cumulative amount reaches $2.65 billion. This means that if the price drops, a large wave of long positions will be liquidated.
Green line: Cumulative short liquidation strength. Starting from 83,510, it climbs steadily upward, piling up to more than $4 billion on the right side. Near 86,000, the cumulative amount reaches $2 billion. This means that if the price moves up, there’s a big block of short positions waiting to be liquidated.
Right now, Bitcoin’s key level is around 82,500. The longs have deployed heavy forces at this spot, while the shorts have gathered around 85,000.
During the National Day holiday, it appears that the influence of both sides is roughly balanced. Most likely, the entire holiday will be a choppy, range-bound market with no clear direction.
385
·
--
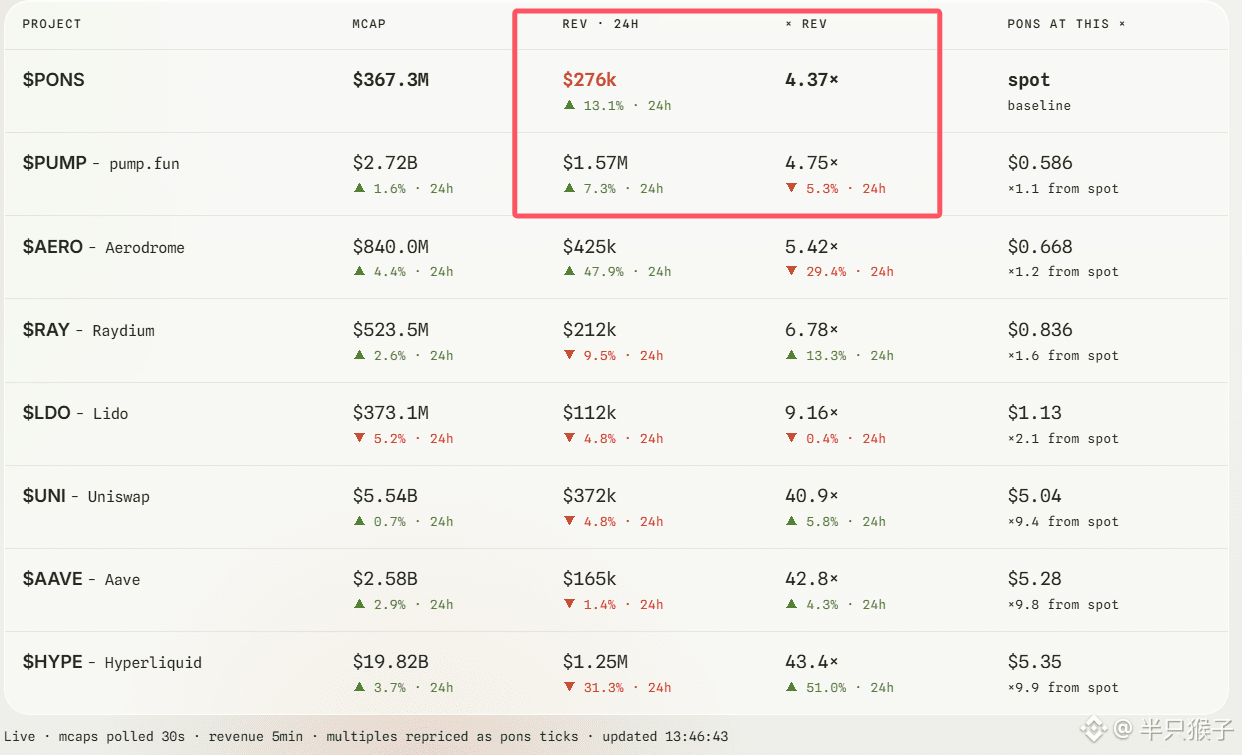
PONS— the cheapest across the entire market: opportunity or trap?
According to the latest data from $PONS :
24-hour revenue: $276k
Revenue multiple: 4.37
24-hour change: +13.1%
Compared with peers:
PUMP: 4.75
AERO: 5.42
RAY: 6.78
LDO: 9.16
UNI: 40.9
AAVE: 42.8
HYPE: 43.4
4.37 is still the lowest across the board. PONS’s valuation multiple is only one-tenth of AAVE’s.
But this time, there’s a signal: look at the small text in the red box: 24-hour revenue +13.1%.
Revenue is rebounding—even though the absolute value is only 276k, at least the direction is upward.
Now look at another set of data:
In the last ten minutes, only one new coin was launched on the domestic market.
In the last hour on the overseas market, only two coins were launched.
Yesterday’s coin launch volume was 7,338—less than one-sixth of the peak period.
So right now, PONS’s low multiple doesn’t necessarily mean it will rise. The market is pricing PONS at a low valuation because of the risk that its revenue may not be sustainable. The key is whether the launch activity can come back. A rebound in revenue is a good sign, but if there isn’t continued growth, revenue is hard to sustain.
In one sentence: “Cheap” is the top-end price for the risk to revenue sustainability. Next, we’ll see whether the launch side can become active again.
{future}(PONSUSDT)
PONS— the cheapest across the entire market: opportunity or trap?
According to the latest data from $PONS :
24-hour revenue: $276k
Revenue multiple: 4.37
24-hour change: +13.1%
Compared with peers:
PUMP: 4.75
AERO: 5.42
RAY: 6.78
LDO: 9.16
UNI: 40.9
AAVE: 42.8
HYPE: 43.4
4.37 is still the lowest across the board. PONS’s valuation multiple is only one-tenth of AAVE’s.
But this time, there’s a signal: look at the small text in the red box: 24-hour revenue +13.1%.
Revenue is rebounding—even though the absolute value is only 276k, at least the direction is upward.
Now look at another set of data:
In the last ten minutes, only one new coin was launched on the domestic market.
In the last hour on the overseas market, only two coins were launched.
Yesterday’s coin launch volume was 7,338—less than one-sixth of the peak period.
So right now, PONS’s low multiple doesn’t necessarily mean it will rise. The market is pricing PONS at a low valuation because of the risk that its revenue may not be sustainable. The key is whether the launch activity can come back. A rebound in revenue is a good sign, but if there isn’t continued growth, revenue is hard to sustain.
In one sentence: “Cheap” is the top-end price for the risk to revenue sustainability. Next, we’ll see whether the launch side can become active again.
According to the latest data from $PONS :
24-hour revenue: $276k
Revenue multiple: 4.37
24-hour change: +13.1%
Compared with peers:
PUMP: 4.75
AERO: 5.42
RAY: 6.78
LDO: 9.16
UNI: 40.9
AAVE: 42.8
HYPE: 43.4
4.37 is still the lowest across the board. PONS’s valuation multiple is only one-tenth of AAVE’s.
But this time, there’s a signal: look at the small text in the red box: 24-hour revenue +13.1%.
Revenue is rebounding—even though the absolute value is only 276k, at least the direction is upward.
Now look at another set of data:
In the last ten minutes, only one new coin was launched on the domestic market.
In the last hour on the overseas market, only two coins were launched.
Yesterday’s coin launch volume was 7,338—less than one-sixth of the peak period.
So right now, PONS’s low multiple doesn’t necessarily mean it will rise. The market is pricing PONS at a low valuation because of the risk that its revenue may not be sustainable. The key is whether the launch activity can come back. A rebound in revenue is a good sign, but if there isn’t continued growth, revenue is hard to sustain.
In one sentence: “Cheap” is the top-end price for the risk to revenue sustainability. Next, we’ll see whether the launch side can become active again.
701
·
--
The three most profitable “money printers” in the crypto world—do you know who they are?
I just checked the 24-hour income ranking in the crypto space, and after reading it, I only had one feeling: $PUMP and $HYPE are truly formidable.
1. PUMP — Benchmark in the launchpad track
24-hour income: $2.39 million
30-day income: $53.12 million
Whether it’s the basic data, strategy, team setup, or product lines, no other launchpad can shake it.
{future}(PUMPUSDT)
2. HYPE — Perpetual contracts
24-hour income: $1.25 million
30-day income: $55.89 million
What draws the most attention is its buyback flywheel: about 97% of the platform’s transaction fees are used to buy back HYPE in the open market and then burn it.
{future}(HYPEUSDT)
3. Stonkfun — A new SOL launchpad
24-hour income: $1.17 million
30-day income: $26.5 million
Solana’s counterattack against the Robin Hood chain, while also going after PONS and simultaneously keeping PUMP under pressure—this is the official target that they’re focusing on “lifting up” during this Meme market cycle.
{future}(PONSUSDT)
Among these three, which one do you like most?
Note:
Tether’s 24-hour income is $17.55 million, ranking first. Circle is $7.30 million, ranking third. But these two are stablecoin issuers—their profit comes from interest, the traditional finance playbook. After removing those two, only look at native crypto protocols.
The three most profitable “money printers” in the crypto world—do you know who they are?
I just checked the 24-hour income ranking in the crypto space, and after reading it, I only had one feeling: $PUMP and $HYPE are truly formidable.
1. PUMP — Benchmark in the launchpad track
24-hour income: $2.39 million
30-day income: $53.12 million
Whether it’s the basic data, strategy, team setup, or product lines, no other launchpad can shake it.
2. HYPE — Perpetual contracts
24-hour income: $1.25 million
30-day income: $55.89 million
What draws the most attention is its buyback flywheel: about 97% of the platform’s transaction fees are used to buy back HYPE in the open market and then burn it.
3. Stonkfun — A new SOL launchpad
24-hour income: $1.17 million
30-day income: $26.5 million
Solana’s counterattack against the Robin Hood chain, while also going after PONS and simultaneously keeping PUMP under pressure—this is the official target that they’re focusing on “lifting up” during this Meme market cycle.
Among these three, which one do you like most?
Note:
Tether’s 24-hour income is $17.55 million, ranking first. Circle is $7.30 million, ranking third. But these two are stablecoin issuers—their profit comes from interest, the traditional finance playbook. After removing those two, only look at native crypto protocols.
I just checked the 24-hour income ranking in the crypto space, and after reading it, I only had one feeling: $PUMP and $HYPE are truly formidable.
1. PUMP — Benchmark in the launchpad track
24-hour income: $2.39 million
30-day income: $53.12 million
Whether it’s the basic data, strategy, team setup, or product lines, no other launchpad can shake it.
2. HYPE — Perpetual contracts
24-hour income: $1.25 million
30-day income: $55.89 million
What draws the most attention is its buyback flywheel: about 97% of the platform’s transaction fees are used to buy back HYPE in the open market and then burn it.
3. Stonkfun — A new SOL launchpad
24-hour income: $1.17 million
30-day income: $26.5 million
Solana’s counterattack against the Robin Hood chain, while also going after PONS and simultaneously keeping PUMP under pressure—this is the official target that they’re focusing on “lifting up” during this Meme market cycle.
Among these three, which one do you like most?
Note:
Tether’s 24-hour income is $17.55 million, ranking first. Circle is $7.30 million, ranking third. But these two are stablecoin issuers—their profit comes from interest, the traditional finance playbook. After removing those two, only look at native crypto protocols.

1
3.2k
·
--
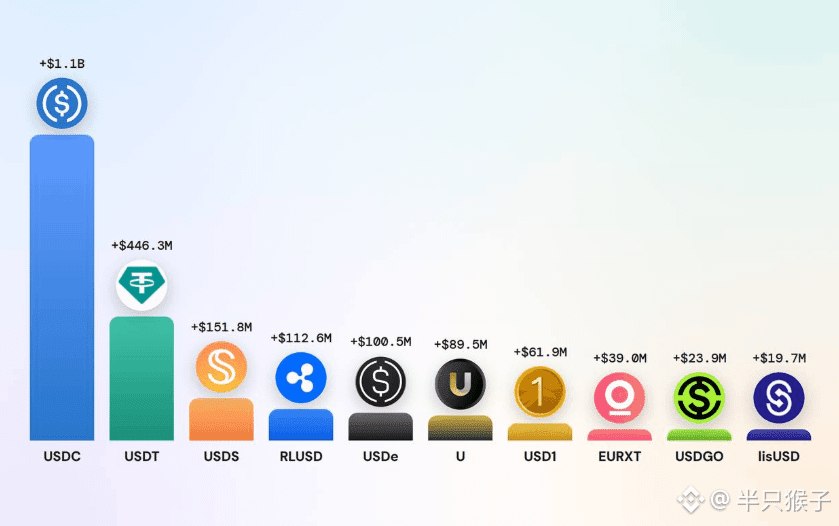
Circle adds $1.1 billion in issuance around the circle, while Tether is left behind
Take a look at the latest data from stablecoin issuers:
Over the past 7 days, USDC’s market cap increased by $1.1 billion—2.5 times Tether’s USDT ($446.3 million). From the issuer perspective, Circle grew by $1 billion, more than double Tether’s $445.2 million.
$CRCL outperformed Tether, the strongest-performing issuer over the past week.
{future}(CRCLUSDT)
Traditional banks start to make the list:
Crédit Agricole entered the top ten issuers. Through EURXT, it added $39 million— the only euro stablecoin among the top ten fastest-growing assets.
Overall, USD stablecoins still account for about 98% of all growth, adding $2 billion. Euro stablecoins increased by only $30.9 million.
For new stablecoin holders:
$BNB added 985,000 new users on-chain, exceeding half of the total combined by the top ten—and is nearly 5 times the second place.
{future}(BNBUSDT)
By asset:
USDT gained 845,900 holders, accounting for 62% of growth among the top ten holders. USDC ranked second with 390,800 holders.
One detail worth noting
Ethena$ENA ’s USDe market cap grew by more than $100 million, but it only added 800 holders.
Growth came mainly from a small number of large holders, not broad retail adoption.
{future}(ENAUSDT)
Circle adds $1.1 billion in issuance around the circle, while Tether is left behind
Take a look at the latest data from stablecoin issuers:
Over the past 7 days, USDC’s market cap increased by $1.1 billion—2.5 times Tether’s USDT ($446.3 million). From the issuer perspective, Circle grew by $1 billion, more than double Tether’s $445.2 million.
$CRCL outperformed Tether, the strongest-performing issuer over the past week.
Traditional banks start to make the list:
Crédit Agricole entered the top ten issuers. Through EURXT, it added $39 million— the only euro stablecoin among the top ten fastest-growing assets.
Overall, USD stablecoins still account for about 98% of all growth, adding $2 billion. Euro stablecoins increased by only $30.9 million.
For new stablecoin holders:
$BNB added 985,000 new users on-chain, exceeding half of the total combined by the top ten—and is nearly 5 times the second place.
By asset:
USDT gained 845,900 holders, accounting for 62% of growth among the top ten holders. USDC ranked second with 390,800 holders.
One detail worth noting
Ethena$ENA ’s USDe market cap grew by more than $100 million, but it only added 800 holders.
Growth came mainly from a small number of large holders, not broad retail adoption.
Take a look at the latest data from stablecoin issuers:
Over the past 7 days, USDC’s market cap increased by $1.1 billion—2.5 times Tether’s USDT ($446.3 million). From the issuer perspective, Circle grew by $1 billion, more than double Tether’s $445.2 million.
$CRCL outperformed Tether, the strongest-performing issuer over the past week.
Traditional banks start to make the list:
Crédit Agricole entered the top ten issuers. Through EURXT, it added $39 million— the only euro stablecoin among the top ten fastest-growing assets.
Overall, USD stablecoins still account for about 98% of all growth, adding $2 billion. Euro stablecoins increased by only $30.9 million.
For new stablecoin holders:
$BNB added 985,000 new users on-chain, exceeding half of the total combined by the top ten—and is nearly 5 times the second place.
By asset:
USDT gained 845,900 holders, accounting for 62% of growth among the top ten holders. USDC ranked second with 390,800 holders.
One detail worth noting
Ethena$ENA ’s USDe market cap grew by more than $100 million, but it only added 800 holders.
Growth came mainly from a small number of large holders, not broad retail adoption.
2
2
9
7.5k
·
--
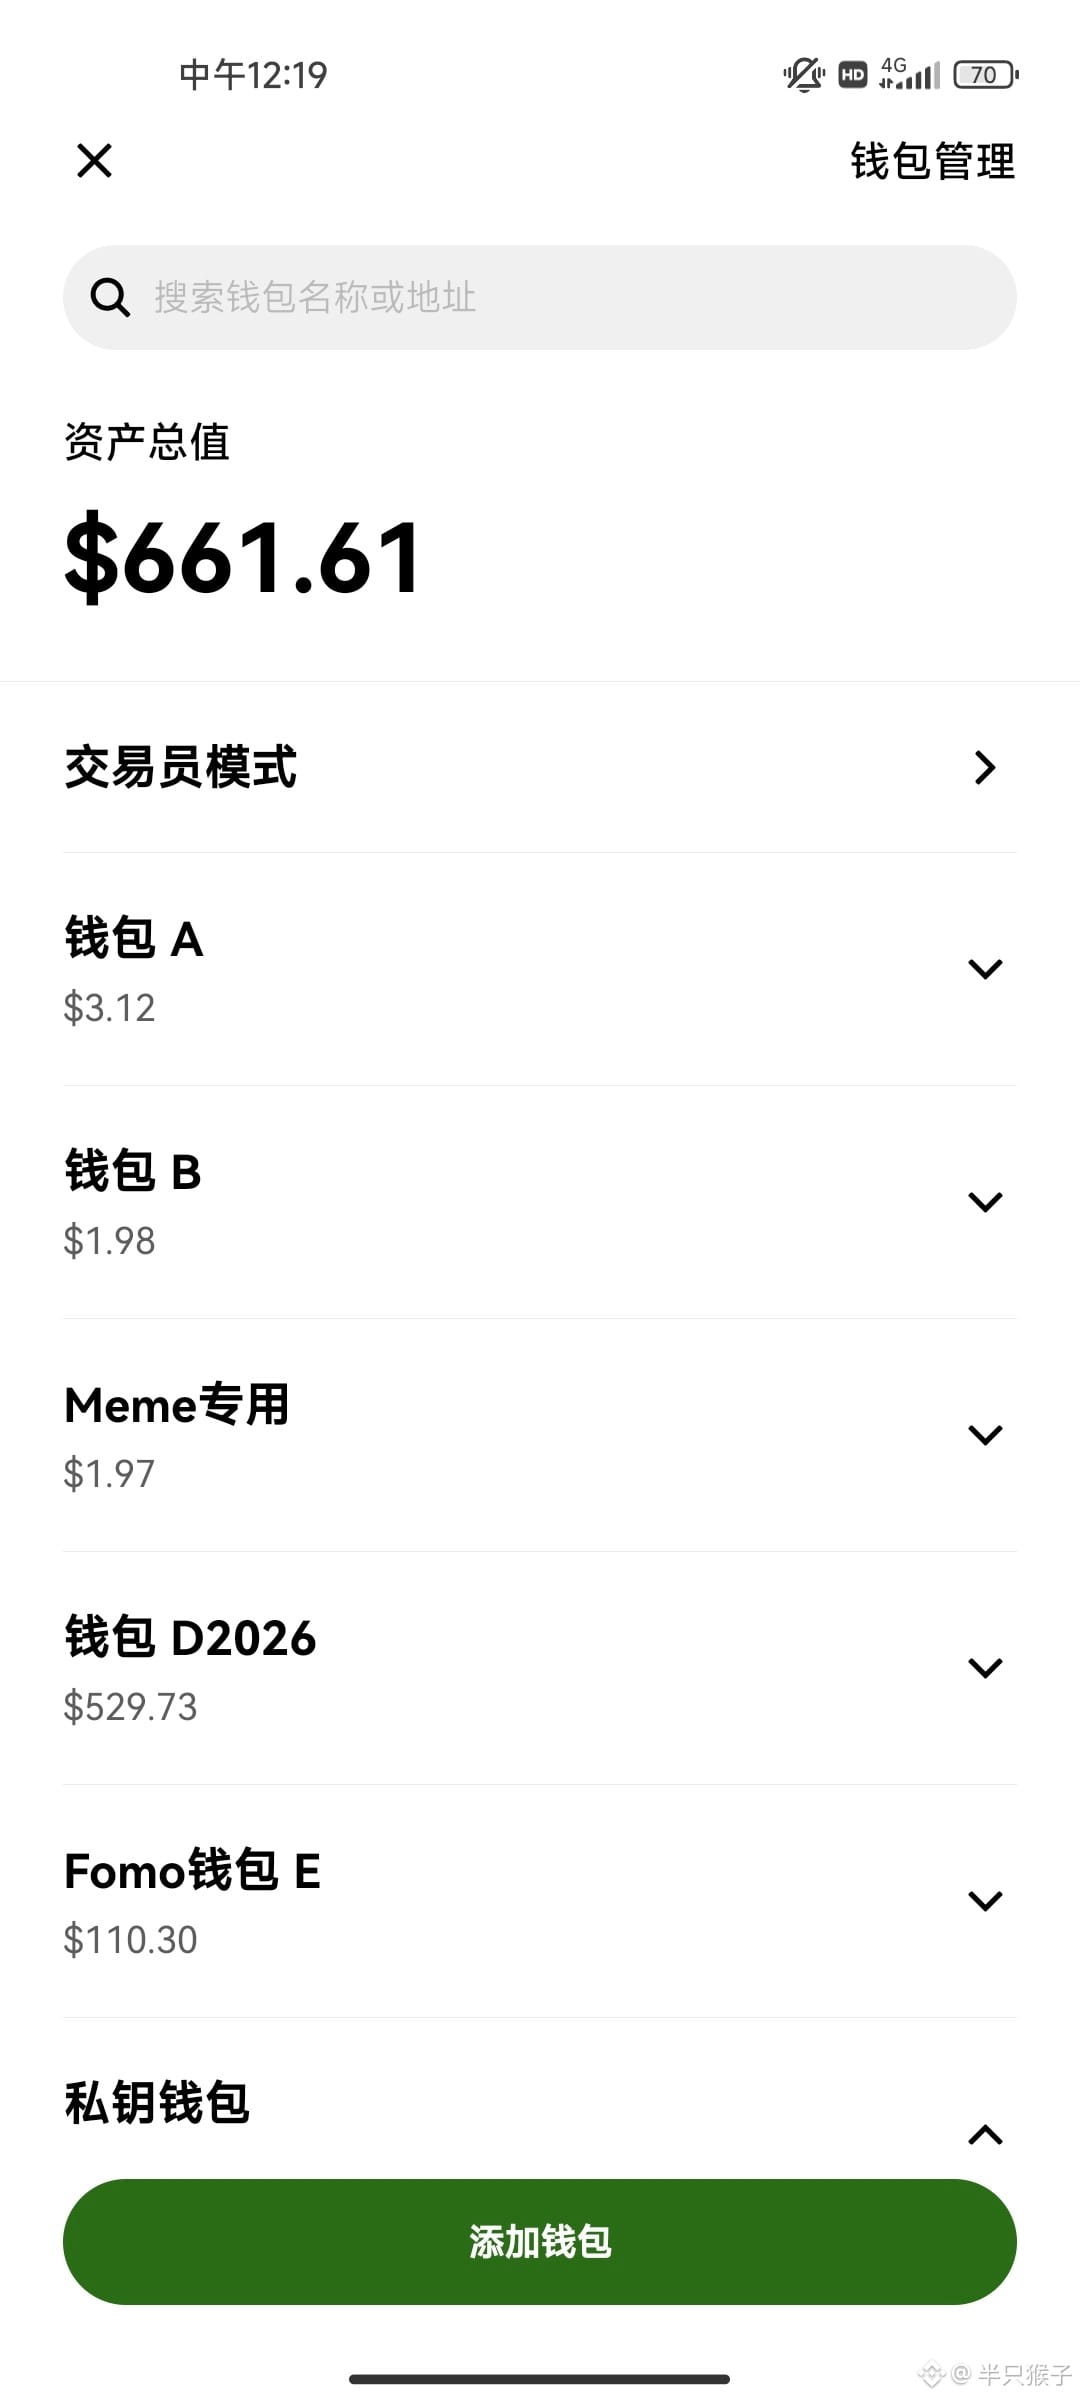
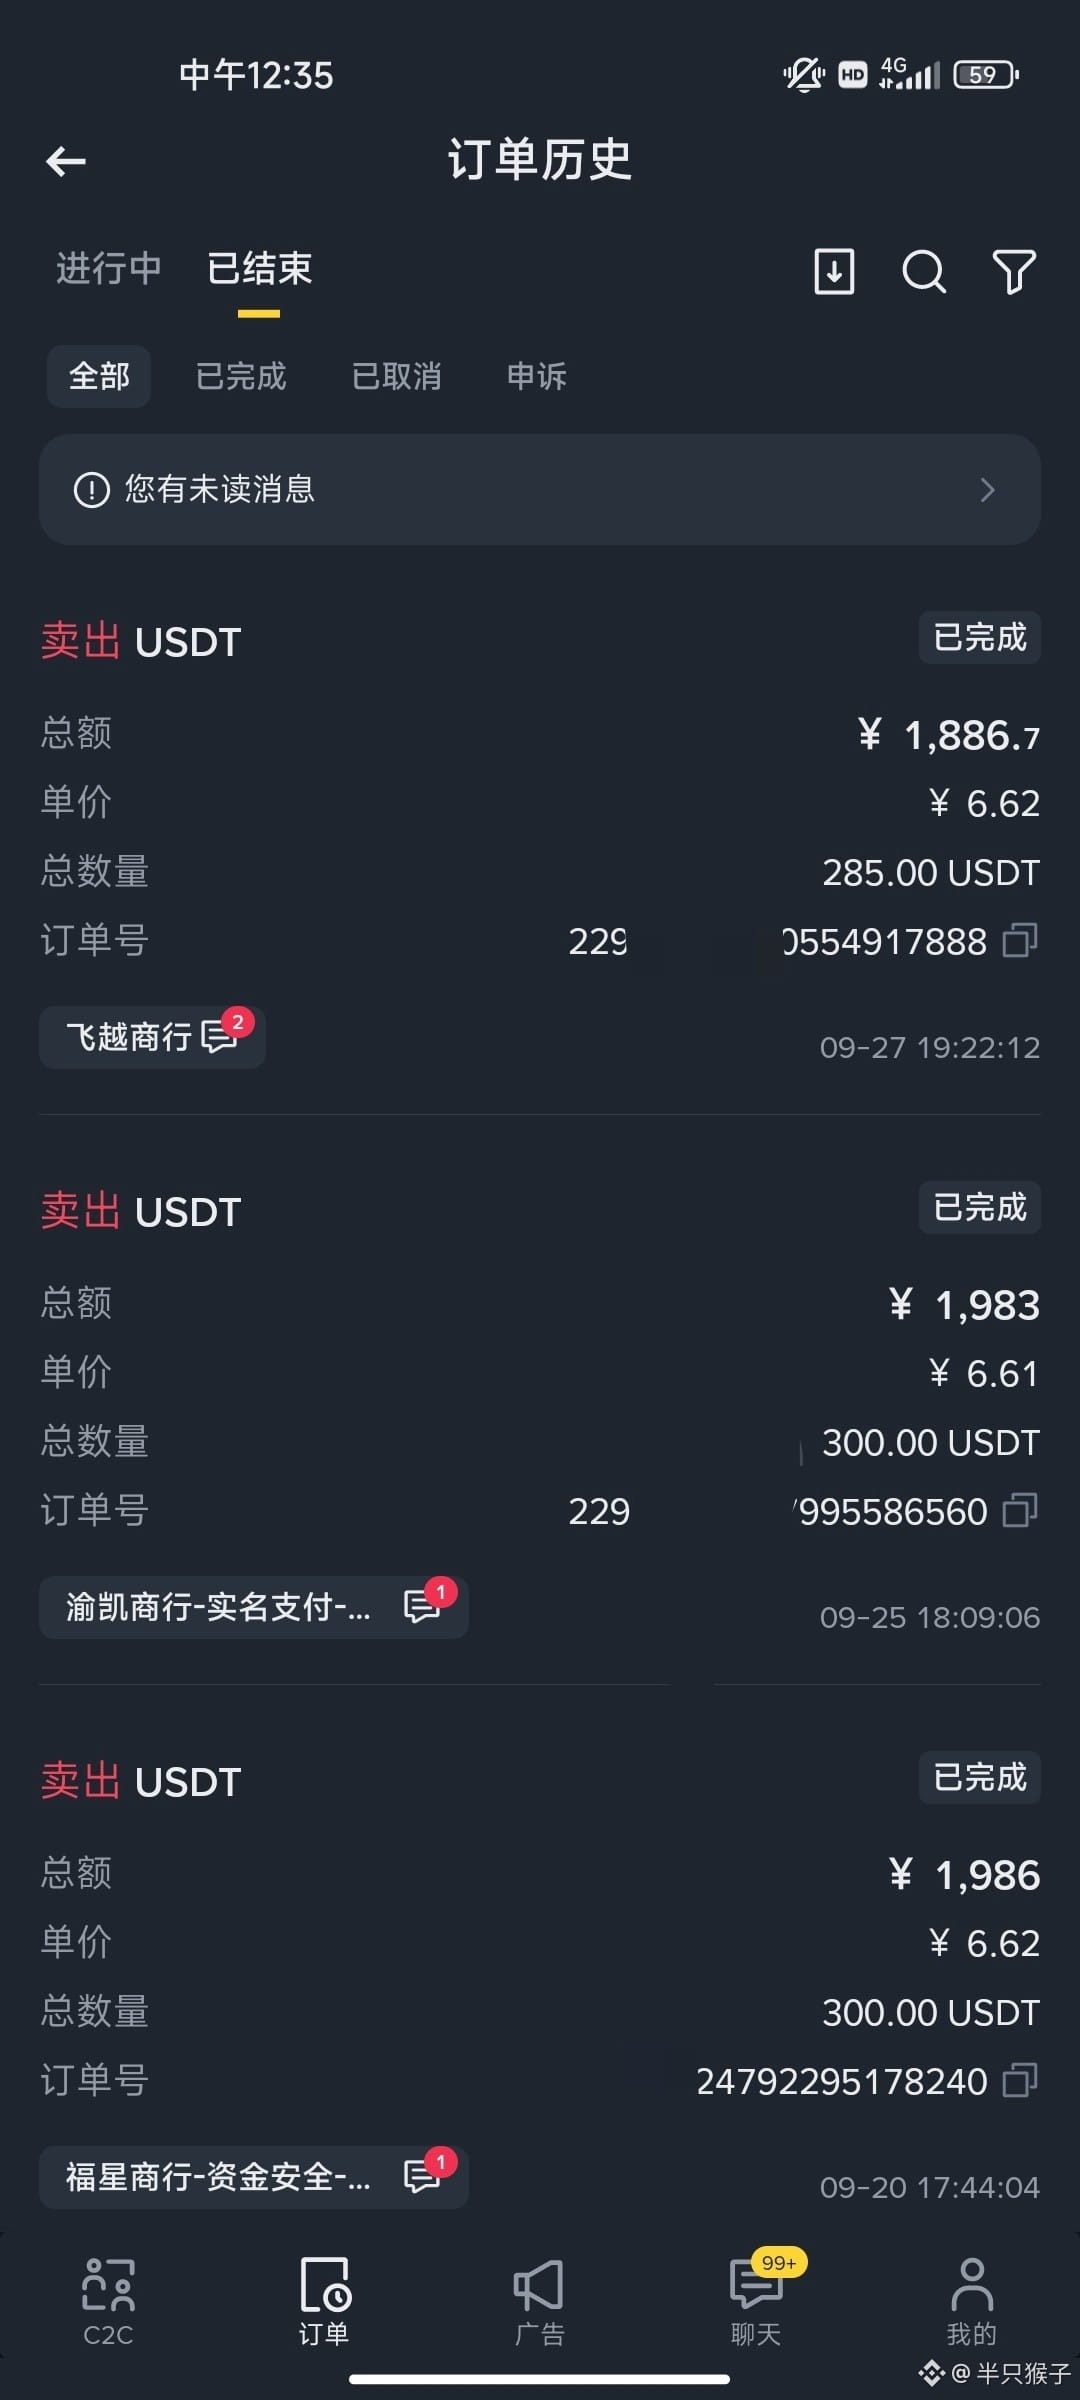
7u Challenge One Hundred Million!
Day 41
Principal 7u, target 100 million
Current: 3900u
Survival cost: 2600u
Available funds: 1300u+
For the past more than a week or so, I haven’t been scanning the chain much; I’ve hardly opened my computer or phone. First comes Mid-Autumn Festival, then National Day—many people are off work, and the market hasn’t changed much either.
1. Currently <$BTC > is at a key position around 82,500. This is the long side’s defensive level. The short side’s defense is mainly between 85,000 and 87,500.
The long positions I entered—I’m still holding them. Even if I haven’t been watching the market much recently, just looking at the Bitcoin market, I can still most likely tell what’s going on.
Because Bitcoin’s market share is over 55%, it’s the absolute banner of the crypto market. As long as the banner doesn’t fall, you must have absolute confidence in the bull market.
2. <$PUMP > has been showing good recent data. The price action looks very much like it’s about to go challenge 0.8.
3. <$PONS > Right now the fundamentals don’t look great. Compared with pump, it’s not just that the data is worse—it’s also the overall gap in strategy, team, and product line.
4. Continue keeping an eye on ENA and ONDO.
5. The stablecoin track has a new player again.
I already have a full hand of memecoins waiting in ambush, and they’ve all been hit by the ambush—now I still need to do high-intensity chain scanning.
In the last more than ten days, the principal has dropped significantly. Money is needed everywhere to keep the principal at a certain level—so we still need to write more content, trade contracts, and go after memecoins if there’s any hope.
{future}(PUMPUSDT)
7u Challenge One Hundred Million!
Day 41
Principal 7u, target 100 million
Current: 3900u
Survival cost: 2600u
Available funds: 1300u+
For the past more than a week or so, I haven’t been scanning the chain much; I’ve hardly opened my computer or phone. First comes Mid-Autumn Festival, then National Day—many people are off work, and the market hasn’t changed much either.
1. Currently <$BTC > is at a key position around 82,500. This is the long side’s defensive level. The short side’s defense is mainly between 85,000 and 87,500.
The long positions I entered—I’m still holding them. Even if I haven’t been watching the market much recently, just looking at the Bitcoin market, I can still most likely tell what’s going on.
Because Bitcoin’s market share is over 55%, it’s the absolute banner of the crypto market. As long as the banner doesn’t fall, you must have absolute confidence in the bull market.
2. <$PUMP > has been showing good recent data. The price action looks very much like it’s about to go challenge 0.8.
3. <$PONS > Right now the fundamentals don’t look great. Compared with pump, it’s not just that the data is worse—it’s also the overall gap in strategy, team, and product line.
4. Continue keeping an eye on ENA and ONDO.
5. The stablecoin track has a new player again.
I already have a full hand of memecoins waiting in ambush, and they’ve all been hit by the ambush—now I still need to do high-intensity chain scanning.
In the last more than ten days, the principal has dropped significantly. Money is needed everywhere to keep the principal at a certain level—so we still need to write more content, trade contracts, and go after memecoins if there’s any hope.
Day 41
Principal 7u, target 100 million
Current: 3900u
Survival cost: 2600u
Available funds: 1300u+
For the past more than a week or so, I haven’t been scanning the chain much; I’ve hardly opened my computer or phone. First comes Mid-Autumn Festival, then National Day—many people are off work, and the market hasn’t changed much either.
1. Currently <$BTC > is at a key position around 82,500. This is the long side’s defensive level. The short side’s defense is mainly between 85,000 and 87,500.
The long positions I entered—I’m still holding them. Even if I haven’t been watching the market much recently, just looking at the Bitcoin market, I can still most likely tell what’s going on.
Because Bitcoin’s market share is over 55%, it’s the absolute banner of the crypto market. As long as the banner doesn’t fall, you must have absolute confidence in the bull market.
2. <$PUMP > has been showing good recent data. The price action looks very much like it’s about to go challenge 0.8.
3. <$PONS > Right now the fundamentals don’t look great. Compared with pump, it’s not just that the data is worse—it’s also the overall gap in strategy, team, and product line.
4. Continue keeping an eye on ENA and ONDO.
5. The stablecoin track has a new player again.
I already have a full hand of memecoins waiting in ambush, and they’ve all been hit by the ambush—now I still need to do high-intensity chain scanning.
In the last more than ten days, the principal has dropped significantly. Money is needed everywhere to keep the principal at a certain level—so we still need to write more content, trade contracts, and go after memecoins if there’s any hope.
1
728
·
--
Finally know why $CRCL dropped! Because it’s here
Stablecoins are the holy-grail-level track in crypto circles! As one of the most profitable businesses in the crypto world, a company that issues stablecoins receives users’ dollars, then turns around to buy U.S. Treasuries—keeping all the interest for itself. Tether’s annual profit exceeds ten billion dollars, making it even more profitable than BlackRock.
Yesterday, five institutions including Visa jointly launched OUSD, with initial liquidity of over $1 billion.
Now, today’s stablecoins have an overlooked problem
Total supply has surpassed $304 billion, with USDT and USDC accounting for 85%.
But look at efficiency: the USDC supply is only half that of USDT, yet its on-chain transfer volume is nearly 5 times higher. Most of these transfers come from internal DeFi loops—on the Base chain, 69% of USDC transfers come from DEX liquidity, and 23% come from flash loans.
Now, what stablecoins want to earn is interest; what OUSD wants to do is embed itself into commercial settlement processes.
What it means for crypto
First, the competition logic changes. Previously it was about who had the biggest pool; now it’s about who is truly embedded into commercial settlement.
Second, the DeFi landscape may be shaken. If OUSD works in real-world business scenarios, it could in turn affect its standing in DeFi.
Third, USDC faces the most pressure—because in terms of “real demand,” the two will compete directly.
In summary
OUSD isn’t stealing market share—it’s going after the position of the “commercial settlement layer.”
If it succeeds in running that system, the competition among stablecoins will shift from “who has the biggest pool” to “whose rails are more useful.” $CRCL
{future}(CRCLUSDT)
Finally know why $CRCL dropped! Because it’s here
Stablecoins are the holy-grail-level track in crypto circles! As one of the most profitable businesses in the crypto world, a company that issues stablecoins receives users’ dollars, then turns around to buy U.S. Treasuries—keeping all the interest for itself. Tether’s annual profit exceeds ten billion dollars, making it even more profitable than BlackRock.
Yesterday, five institutions including Visa jointly launched OUSD, with initial liquidity of over $1 billion.
Now, today’s stablecoins have an overlooked problem
Total supply has surpassed $304 billion, with USDT and USDC accounting for 85%.
But look at efficiency: the USDC supply is only half that of USDT, yet its on-chain transfer volume is nearly 5 times higher. Most of these transfers come from internal DeFi loops—on the Base chain, 69% of USDC transfers come from DEX liquidity, and 23% come from flash loans.
Now, what stablecoins want to earn is interest; what OUSD wants to do is embed itself into commercial settlement processes.
What it means for crypto
First, the competition logic changes. Previously it was about who had the biggest pool; now it’s about who is truly embedded into commercial settlement.
Second, the DeFi landscape may be shaken. If OUSD works in real-world business scenarios, it could in turn affect its standing in DeFi.
Third, USDC faces the most pressure—because in terms of “real demand,” the two will compete directly.
In summary
OUSD isn’t stealing market share—it’s going after the position of the “commercial settlement layer.”
If it succeeds in running that system, the competition among stablecoins will shift from “who has the biggest pool” to “whose rails are more useful.” $CRCL
Stablecoins are the holy-grail-level track in crypto circles! As one of the most profitable businesses in the crypto world, a company that issues stablecoins receives users’ dollars, then turns around to buy U.S. Treasuries—keeping all the interest for itself. Tether’s annual profit exceeds ten billion dollars, making it even more profitable than BlackRock.
Yesterday, five institutions including Visa jointly launched OUSD, with initial liquidity of over $1 billion.
Now, today’s stablecoins have an overlooked problem
Total supply has surpassed $304 billion, with USDT and USDC accounting for 85%.
But look at efficiency: the USDC supply is only half that of USDT, yet its on-chain transfer volume is nearly 5 times higher. Most of these transfers come from internal DeFi loops—on the Base chain, 69% of USDC transfers come from DEX liquidity, and 23% come from flash loans.
Now, what stablecoins want to earn is interest; what OUSD wants to do is embed itself into commercial settlement processes.
What it means for crypto
First, the competition logic changes. Previously it was about who had the biggest pool; now it’s about who is truly embedded into commercial settlement.
Second, the DeFi landscape may be shaken. If OUSD works in real-world business scenarios, it could in turn affect its standing in DeFi.
Third, USDC faces the most pressure—because in terms of “real demand,” the two will compete directly.
In summary
OUSD isn’t stealing market share—it’s going after the position of the “commercial settlement layer.”
If it succeeds in running that system, the competition among stablecoins will shift from “who has the biggest pool” to “whose rails are more useful.” $CRCL

1
1
3.5k
·
--
Stayed still for 4 years—then one move is $356 million: what does this Ethereum whale want to do?
In 2015, during Ethereum’s ICO, someone bought 560,000 ETH at $0.31 per coin, purchasing $ETH . After 9 years, today ETH is around $2,670, yielding an 86-fold return.
In 9 years, he only did one thing: do nothing
From 2015 until now, this whale has hardly moved the ETH in his holdings.
The last time he made a single transfer worth over 100 million, it was already 4 years ago.
Just now, he woke up
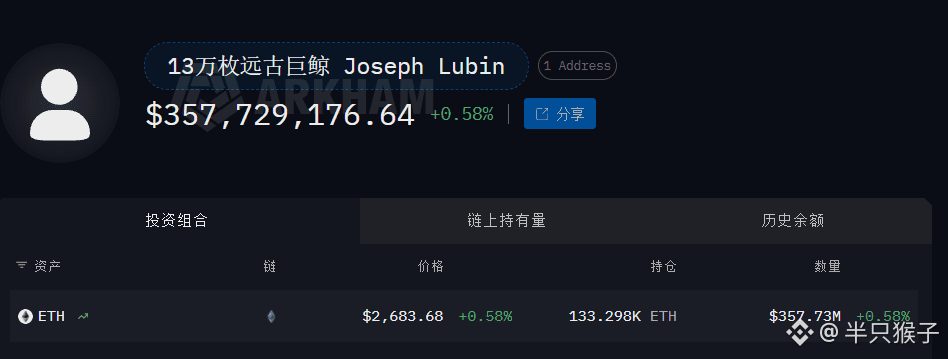
About 6 hours ago, he transferred 133,298 ETH—worth $356 million—to a brand-new address.
This is one of the biggest moves he’s made in 9 years.
Now the most exciting question
Is he going to dump the market, or is he just moving wallets?
If it’s only a wallet change, then nothing happens
If he’s planning to sell, then the $356 million sell-pressure must be absorbed by the market
Let’s talk in the comments: what do you think he’s going to do next?
{future}(ETHUSDT)
Stayed still for 4 years—then one move is $356 million: what does this Ethereum whale want to do?
In 2015, during Ethereum’s ICO, someone bought 560,000 ETH at $0.31 per coin, purchasing $ETH . After 9 years, today ETH is around $2,670, yielding an 86-fold return.
In 9 years, he only did one thing: do nothing
From 2015 until now, this whale has hardly moved the ETH in his holdings.
The last time he made a single transfer worth over 100 million, it was already 4 years ago.
Just now, he woke up
About 6 hours ago, he transferred 133,298 ETH—worth $356 million—to a brand-new address.
This is one of the biggest moves he’s made in 9 years.
Now the most exciting question
Is he going to dump the market, or is he just moving wallets?
If it’s only a wallet change, then nothing happens
If he’s planning to sell, then the $356 million sell-pressure must be absorbed by the market
Let’s talk in the comments: what do you think he’s going to do next?
In 2015, during Ethereum’s ICO, someone bought 560,000 ETH at $0.31 per coin, purchasing $ETH . After 9 years, today ETH is around $2,670, yielding an 86-fold return.
In 9 years, he only did one thing: do nothing
From 2015 until now, this whale has hardly moved the ETH in his holdings.
The last time he made a single transfer worth over 100 million, it was already 4 years ago.
Just now, he woke up
About 6 hours ago, he transferred 133,298 ETH—worth $356 million—to a brand-new address.
This is one of the biggest moves he’s made in 9 years.
Now the most exciting question
Is he going to dump the market, or is he just moving wallets?
If it’s only a wallet change, then nothing happens
If he’s planning to sell, then the $356 million sell-pressure must be absorbed by the market
Let’s talk in the comments: what do you think he’s going to do next?
533
·
--
The biggest change in the crypto world is hidden in the revenue structure of $RAY
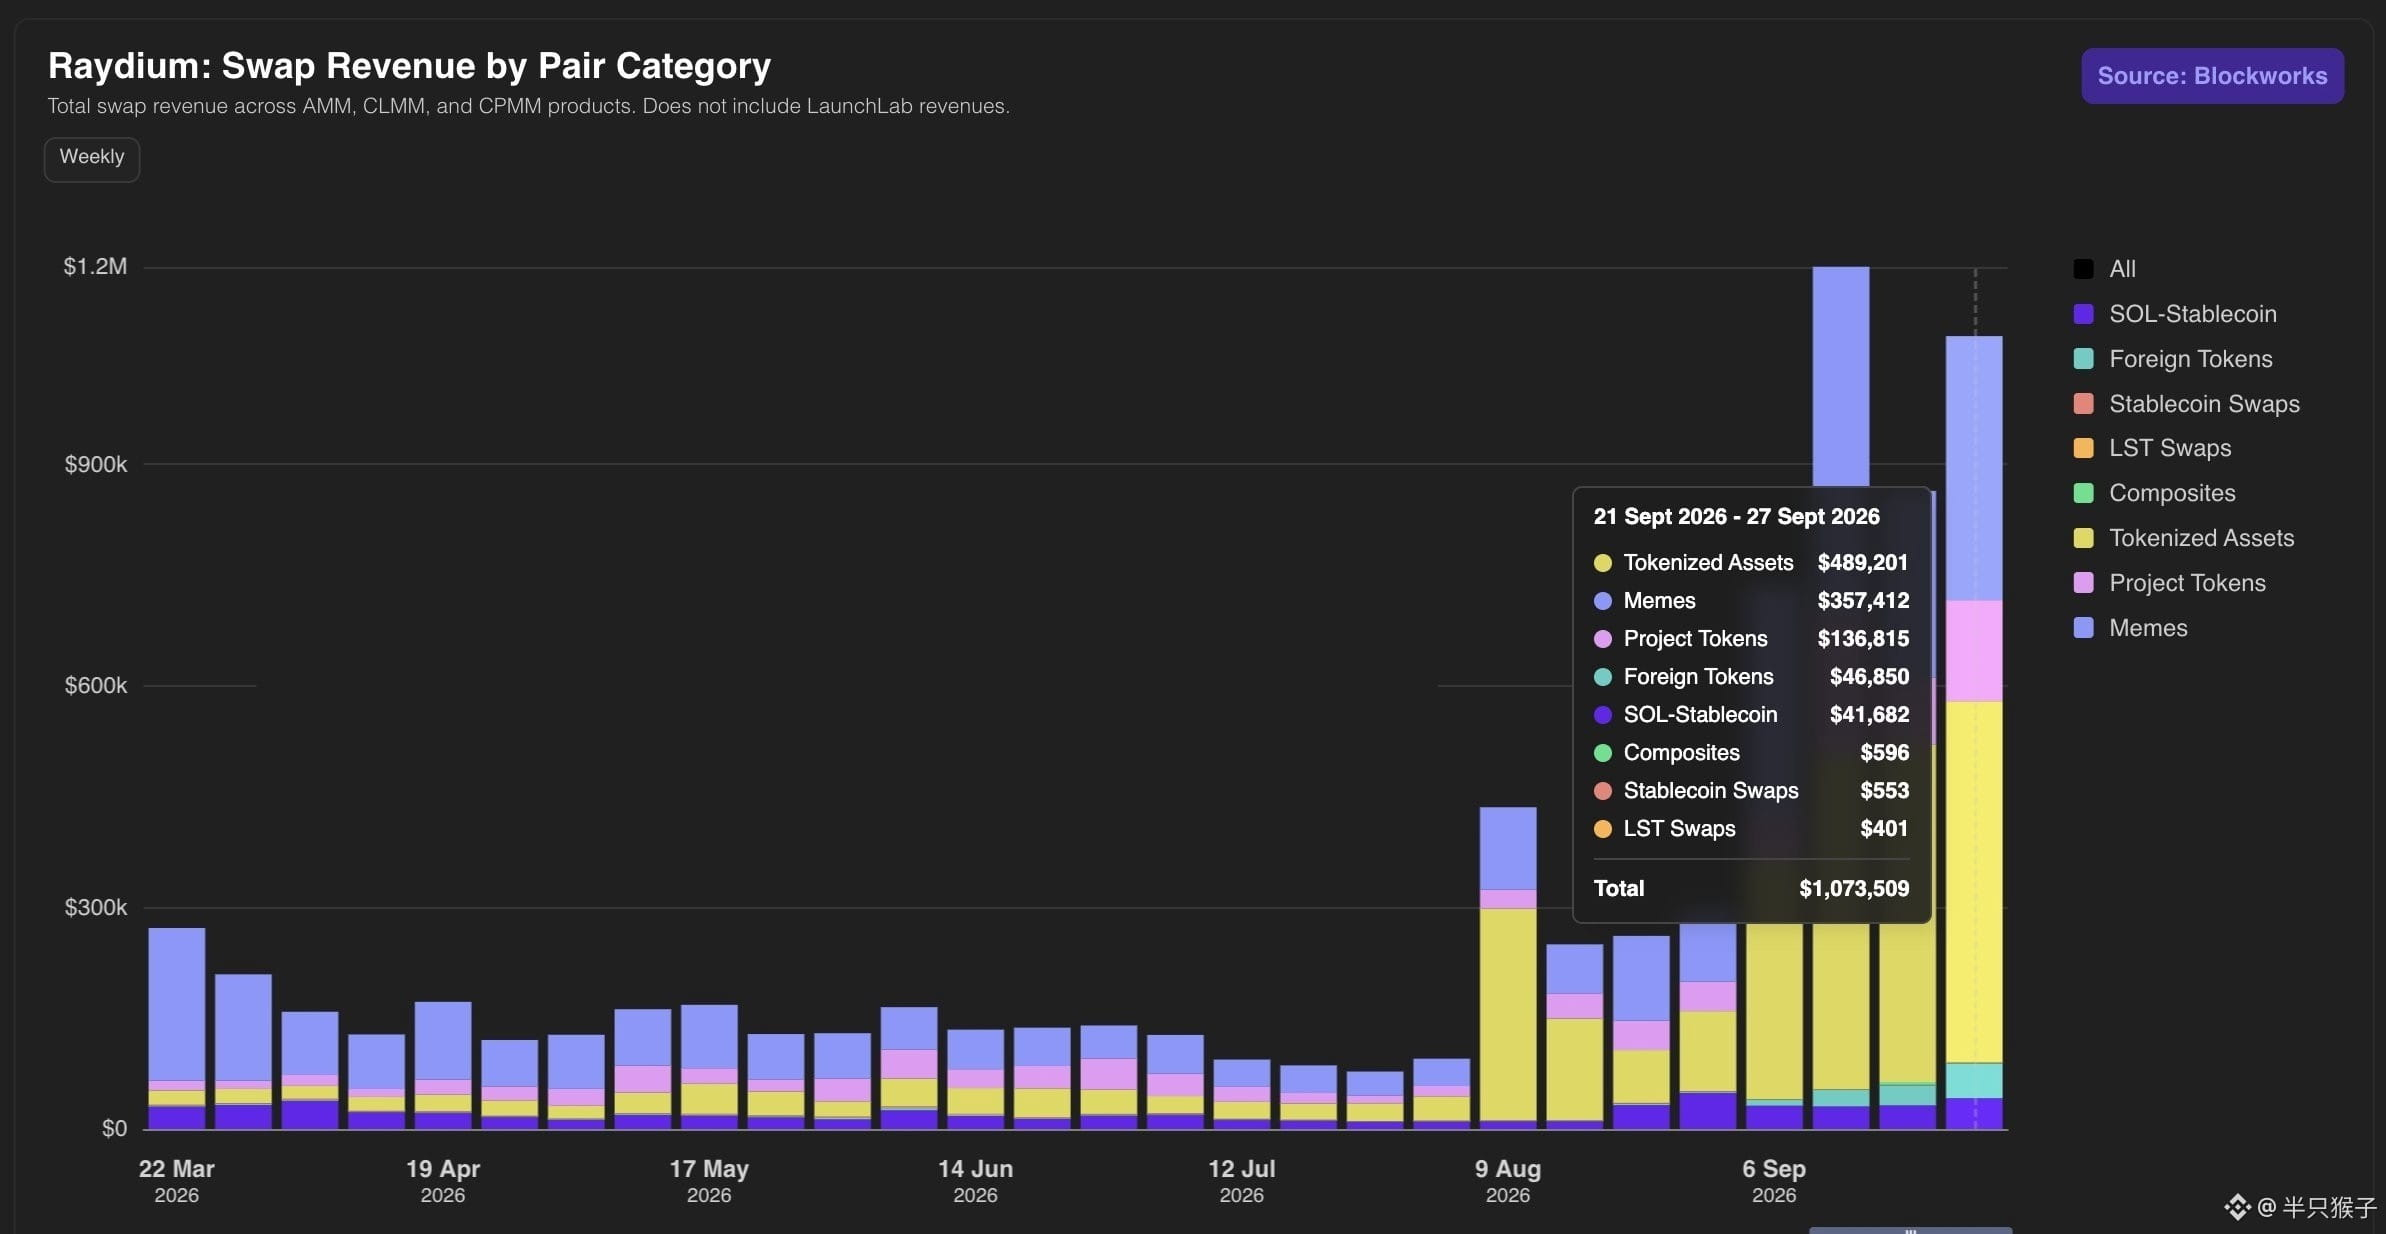
RAY is one of the largest DEXs in the Solana $SOL ecosystem. Changes in its revenue structure reflect the shift in transaction demand across the entire chain.
Let’s look at some data:
In the second quarter, tokenized assets accounted for 21% of Ray’s trading revenue.
In the third quarter, that figure rose to 46%.
In just one quarter, the share of revenue from tokenized assets jumped from 21% to 46%—more than doubled.
Why does this matter?
Tokenized assets are moving from a "marginal category" to a core source of DEX revenue.
This is not an exception on a single chain. Previously, $UNI ’s data also showed that tokenized stocks contributed 60% of its DEX trading volume. Of course, this is not that other assets are shrinking—it’s that tokenized assets are growing faster.
{future}(UNIUSDT)
The biggest change in the crypto world is hidden in the revenue structure of $RAY
RAY is one of the largest DEXs in the Solana $SOL ecosystem. Changes in its revenue structure reflect the shift in transaction demand across the entire chain.
Let’s look at some data:
In the second quarter, tokenized assets accounted for 21% of Ray’s trading revenue.
In the third quarter, that figure rose to 46%.
In just one quarter, the share of revenue from tokenized assets jumped from 21% to 46%—more than doubled.
Why does this matter?
Tokenized assets are moving from a "marginal category" to a core source of DEX revenue.
This is not an exception on a single chain. Previously, $UNI ’s data also showed that tokenized stocks contributed 60% of its DEX trading volume. Of course, this is not that other assets are shrinking—it’s that tokenized assets are growing faster.
RAY is one of the largest DEXs in the Solana $SOL ecosystem. Changes in its revenue structure reflect the shift in transaction demand across the entire chain.
Let’s look at some data:
In the second quarter, tokenized assets accounted for 21% of Ray’s trading revenue.
In the third quarter, that figure rose to 46%.
In just one quarter, the share of revenue from tokenized assets jumped from 21% to 46%—more than doubled.
Why does this matter?
Tokenized assets are moving from a "marginal category" to a core source of DEX revenue.
This is not an exception on a single chain. Previously, $UNI ’s data also showed that tokenized stocks contributed 60% of its DEX trading volume. Of course, this is not that other assets are shrinking—it’s that tokenized assets are growing faster.
1.5k
·
--
Institutions are at it again: Bitcoin ETF sees an inflow of $43 million in a day
Looking at today’s data, the Bitcoin $BTC ETF
Single-day net inflow: +511 BTC (+$42.99 million)
7-day net inflow: +15,196 BTC (+$1.28 billion)
Ethereum $ETH ETF:
Single-day net inflow: +5,648 ETH (+$15.37 million)
7-day net inflow: +168,733 ETH (+$459 million)
Why is this data important?
First, ETFs are a compliant channel for institutions to enter.
Previously, if institutions wanted to buy Bitcoin, they had to self-custody and manage their own private keys—there were all kinds of compliance headaches. Now, through ETFs, you can buy Bitcoin the way you buy stocks; you can operate it through a brokerage account.
Second, ETF inflows and outflows reflect institutional sentiment.
An ETF is the compliant channel through which institutions buy crypto. Ongoing inflows indicate that institutions are continuously entering. This isn’t retail chasing price spikes—it's institutions allocating. Retail may buy today and sell tomorrow, but institutions typically use ETFs for planned, sustained positioning.
Note: ETF stands for “exchange-traded open-end index fund.” In plain terms, it’s a “basket” you can buy and sell in a stock account, and the basket holds certain assets.
For a Bitcoin ETF, the basket contains Bitcoin. Buying it is equivalent to indirectly holding Bitcoin—you don’t have to open your own wallet, manage private keys, or worry about an exchange going under. The same logic applies to Ethereum ETFs: the basket holds Ethereum.
{future}(ETHUSDT)
Institutions are at it again: Bitcoin ETF sees an inflow of $43 million in a day
Looking at today’s data, the Bitcoin $BTC ETF
Single-day net inflow: +511 BTC (+$42.99 million)
7-day net inflow: +15,196 BTC (+$1.28 billion)
Ethereum $ETH ETF:
Single-day net inflow: +5,648 ETH (+$15.37 million)
7-day net inflow: +168,733 ETH (+$459 million)
Why is this data important?
First, ETFs are a compliant channel for institutions to enter.
Previously, if institutions wanted to buy Bitcoin, they had to self-custody and manage their own private keys—there were all kinds of compliance headaches. Now, through ETFs, you can buy Bitcoin the way you buy stocks; you can operate it through a brokerage account.
Second, ETF inflows and outflows reflect institutional sentiment.
An ETF is the compliant channel through which institutions buy crypto. Ongoing inflows indicate that institutions are continuously entering. This isn’t retail chasing price spikes—it's institutions allocating. Retail may buy today and sell tomorrow, but institutions typically use ETFs for planned, sustained positioning.
Note: ETF stands for “exchange-traded open-end index fund.” In plain terms, it’s a “basket” you can buy and sell in a stock account, and the basket holds certain assets.
For a Bitcoin ETF, the basket contains Bitcoin. Buying it is equivalent to indirectly holding Bitcoin—you don’t have to open your own wallet, manage private keys, or worry about an exchange going under. The same logic applies to Ethereum ETFs: the basket holds Ethereum.
Looking at today’s data, the Bitcoin $BTC ETF
Single-day net inflow: +511 BTC (+$42.99 million)
7-day net inflow: +15,196 BTC (+$1.28 billion)
Ethereum $ETH ETF:
Single-day net inflow: +5,648 ETH (+$15.37 million)
7-day net inflow: +168,733 ETH (+$459 million)
Why is this data important?
First, ETFs are a compliant channel for institutions to enter.
Previously, if institutions wanted to buy Bitcoin, they had to self-custody and manage their own private keys—there were all kinds of compliance headaches. Now, through ETFs, you can buy Bitcoin the way you buy stocks; you can operate it through a brokerage account.
Second, ETF inflows and outflows reflect institutional sentiment.
An ETF is the compliant channel through which institutions buy crypto. Ongoing inflows indicate that institutions are continuously entering. This isn’t retail chasing price spikes—it's institutions allocating. Retail may buy today and sell tomorrow, but institutions typically use ETFs for planned, sustained positioning.
Note: ETF stands for “exchange-traded open-end index fund.” In plain terms, it’s a “basket” you can buy and sell in a stock account, and the basket holds certain assets.
For a Bitcoin ETF, the basket contains Bitcoin. Buying it is equivalent to indirectly holding Bitcoin—you don’t have to open your own wallet, manage private keys, or worry about an exchange going under. The same logic applies to Ethereum ETFs: the basket holds Ethereum.
194
·
--
Partly True
HYPE’s money printer: earns 2 million a day, burns 1% a year
The revenue data for $HYPE has just been updated. After reading it, there’s only one feeling: this machine is turning faster than you’d imagine.
Revenue side: annualized $823 million
Total historical revenue: $1.358 billion
Annualized revenue: $823 million
Past 30 days: $56.33 million
Average daily revenue: $2.1 million
98% of revenue comes from perpetual contracts. Spot, gas fees, and auctions combined account for only 2%.
Burn side: burns 1% per year. Revenue isn’t the endpoint—the key question is where the money goes.
Of the trading fees, about 99% is used to buy back HYPE, and only 1% goes to HLP. Priority fees and auctions are 100% burned.
Looking at the burn data:
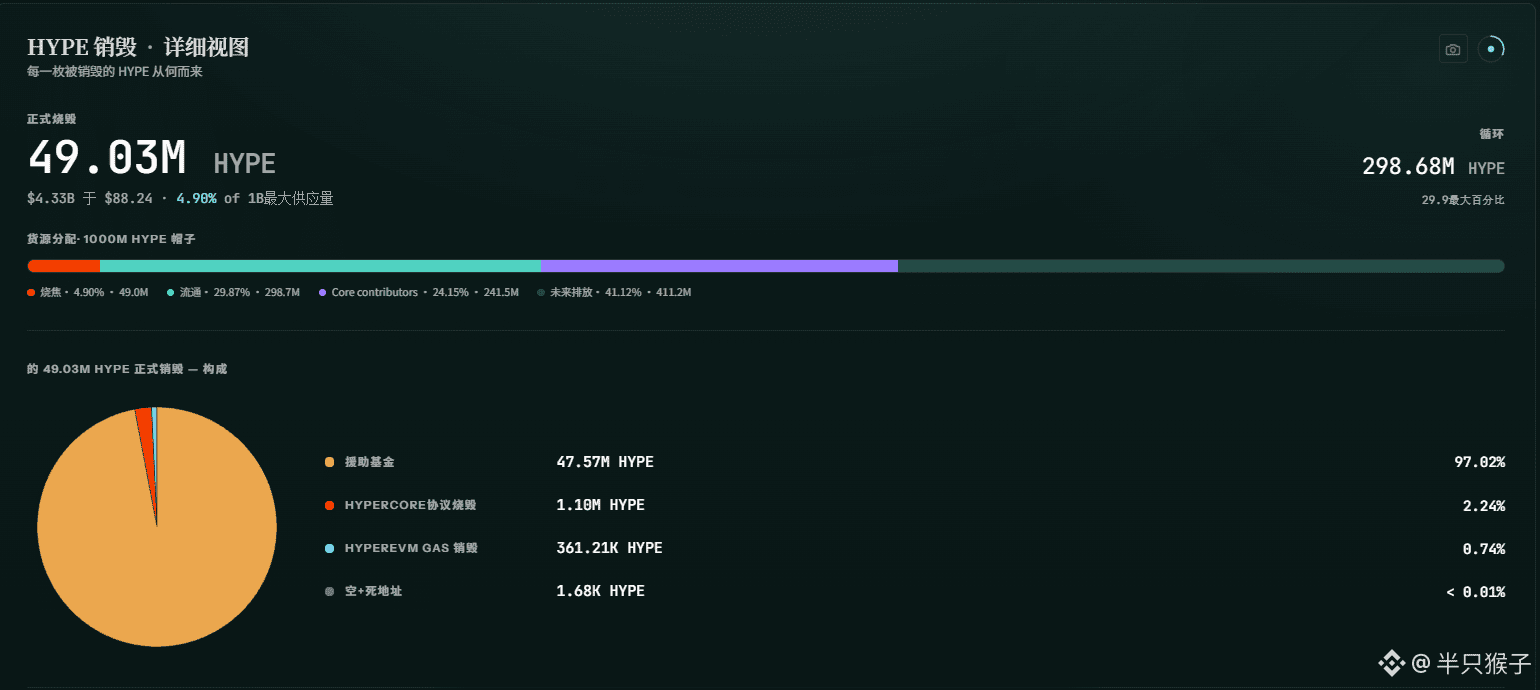
Total burned: 47.56 million HYPE, worth $1.289 billion
Share of total supply: 4.76%
Annualized burn rate: ~1%
Burned in 24 hours: 30.4k HYPE, worth $2.6681 million
The main channel for burning is the Foundation/Donation Fund, accounting for 97.02%. The money earned by the protocol is used to buy HYPE in the market, and then burned.
How the flywheel turns
Contract trading → generates fees → 99% buyback of HYPE → burn → reduced supply → annualized burn of 1%
This isn’t “expectations”—it’s real data happening every single day.
Summary
Earns 2.1 million a day, burns 1% a year; 98% of revenue comes from contracts.
{future}(HYPEUSDT)
HYPE’s money printer: earns 2 million a day, burns 1% a year
The revenue data for $HYPE has just been updated. After reading it, there’s only one feeling: this machine is turning faster than you’d imagine.
Revenue side: annualized $823 million
Total historical revenue: $1.358 billion
Annualized revenue: $823 million
Past 30 days: $56.33 million
Average daily revenue: $2.1 million
98% of revenue comes from perpetual contracts. Spot, gas fees, and auctions combined account for only 2%.
Burn side: burns 1% per year. Revenue isn’t the endpoint—the key question is where the money goes.
Of the trading fees, about 99% is used to buy back HYPE, and only 1% goes to HLP. Priority fees and auctions are 100% burned.
Looking at the burn data:
Total burned: 47.56 million HYPE, worth $1.289 billion
Share of total supply: 4.76%
Annualized burn rate: ~1%
Burned in 24 hours: 30.4k HYPE, worth $2.6681 million
The main channel for burning is the Foundation/Donation Fund, accounting for 97.02%. The money earned by the protocol is used to buy HYPE in the market, and then burned.
How the flywheel turns
Contract trading → generates fees → 99% buyback of HYPE → burn → reduced supply → annualized burn of 1%
This isn’t “expectations”—it’s real data happening every single day.
Summary
Earns 2.1 million a day, burns 1% a year; 98% of revenue comes from contracts.
The revenue data for $HYPE has just been updated. After reading it, there’s only one feeling: this machine is turning faster than you’d imagine.
Revenue side: annualized $823 million
Total historical revenue: $1.358 billion
Annualized revenue: $823 million
Past 30 days: $56.33 million
Average daily revenue: $2.1 million
98% of revenue comes from perpetual contracts. Spot, gas fees, and auctions combined account for only 2%.
Burn side: burns 1% per year. Revenue isn’t the endpoint—the key question is where the money goes.
Of the trading fees, about 99% is used to buy back HYPE, and only 1% goes to HLP. Priority fees and auctions are 100% burned.
Looking at the burn data:
Total burned: 47.56 million HYPE, worth $1.289 billion
Share of total supply: 4.76%
Annualized burn rate: ~1%
Burned in 24 hours: 30.4k HYPE, worth $2.6681 million
The main channel for burning is the Foundation/Donation Fund, accounting for 97.02%. The money earned by the protocol is used to buy HYPE in the market, and then burned.
How the flywheel turns
Contract trading → generates fees → 99% buyback of HYPE → burn → reduced supply → annualized burn of 1%
This isn’t “expectations”—it’s real data happening every single day.
Summary
Earns 2.1 million a day, burns 1% a year; 98% of revenue comes from contracts.
1.4k
·
--
The probability that BTC touches $100,000 in 2027 ($BTC ): 80.5%
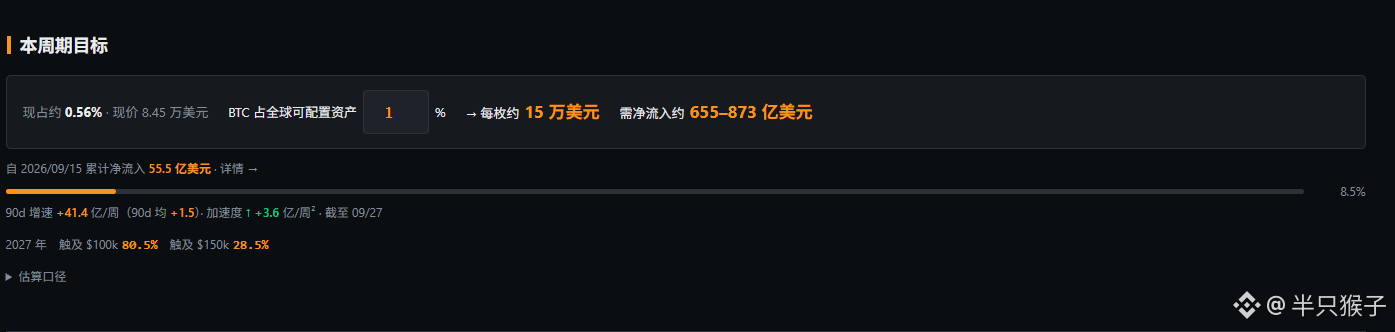
Take a look at the data. Since 2026-06-21, cumulative net inflows have reached $5.55 billion. Of this:
ETF net subscriptions: +$2.23 billion
Listed company treasuries: +$0.3261 billion
Stablecoin net issuance: +$2.99 billion
The most critical data: over the past 90 days, the average weekly inflow into Bitcoin has been $150 million. But recently, the pace has surged to $360 million per week.
At this rate, the probability that BTC will reach $100,000 in 2027 is 80.5%. The probability of reaching $150,000 is 28.5%.
If BTC accounts for 1% of globally available assets—about $150,000 per coin—then net inflows of approximately $65.6–87.5 billion are required. Current progress is 8.5%.
{future}(BTCUSDT)
The probability that BTC touches $100,000 in 2027 ($BTC ): 80.5%
Take a look at the data. Since 2026-06-21, cumulative net inflows have reached $5.55 billion. Of this:
ETF net subscriptions: +$2.23 billion
Listed company treasuries: +$0.3261 billion
Stablecoin net issuance: +$2.99 billion
The most critical data: over the past 90 days, the average weekly inflow into Bitcoin has been $150 million. But recently, the pace has surged to $360 million per week.
At this rate, the probability that BTC will reach $100,000 in 2027 is 80.5%. The probability of reaching $150,000 is 28.5%.
If BTC accounts for 1% of globally available assets—about $150,000 per coin—then net inflows of approximately $65.6–87.5 billion are required. Current progress is 8.5%.
Take a look at the data. Since 2026-06-21, cumulative net inflows have reached $5.55 billion. Of this:
ETF net subscriptions: +$2.23 billion
Listed company treasuries: +$0.3261 billion
Stablecoin net issuance: +$2.99 billion
The most critical data: over the past 90 days, the average weekly inflow into Bitcoin has been $150 million. But recently, the pace has surged to $360 million per week.
At this rate, the probability that BTC will reach $100,000 in 2027 is 80.5%. The probability of reaching $150,000 is 28.5%.
If BTC accounts for 1% of globally available assets—about $150,000 per coin—then net inflows of approximately $65.6–87.5 billion are required. Current progress is 8.5%.
437
·
--
Partly True
$PUMP is real
{future}(PUMPUSDT)
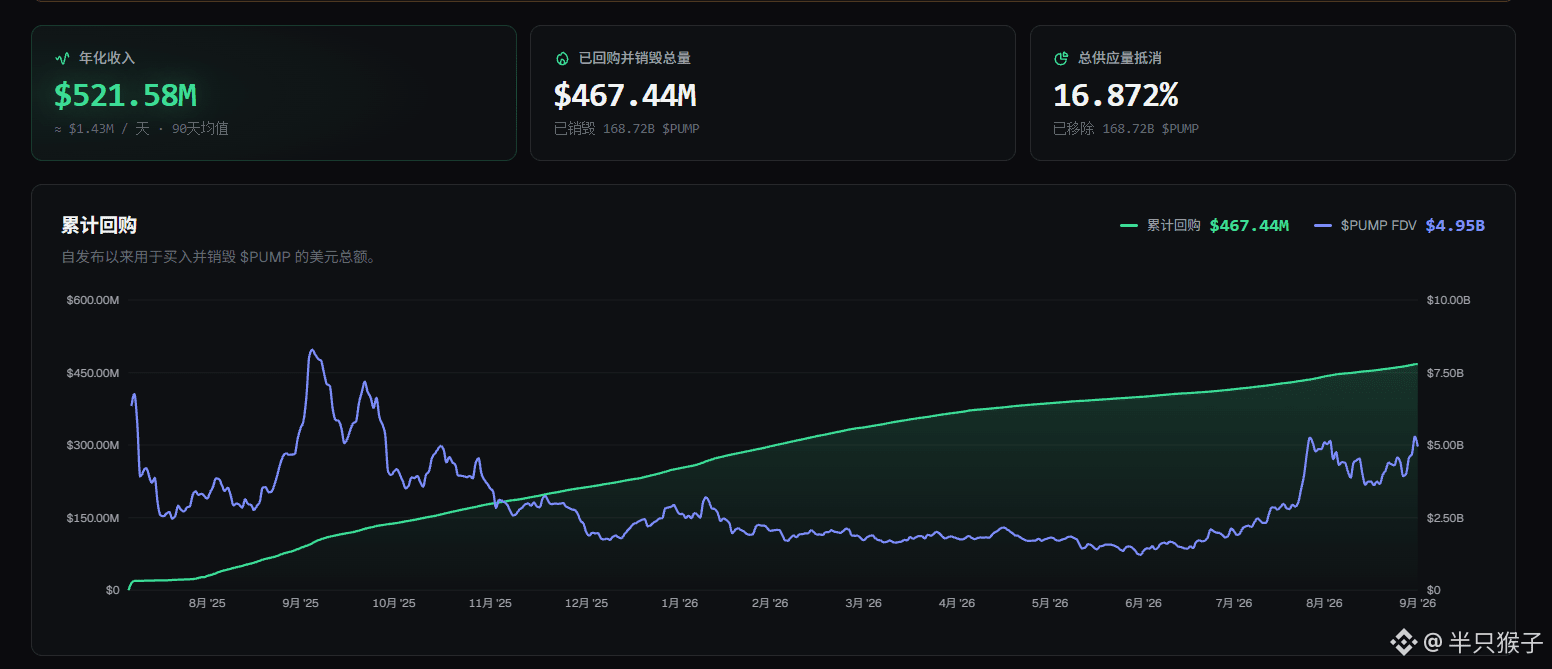
24-hour agreement revenue: $8.28 million, 24-hour agreement fees: $2.53 million
Agreement fees in the last 7 days: $47.7 million, agreement revenue in the last 7 days: $15.73 million
Recently, Robinhood chain $PONS has grown rapidly, but if you think about it carefully, PONS is still too far from pump. Here are a few simple points:
{future}(PONSUSDT)
1. Temperament—also, ambition, or strategic goals. When the Robinhood chain was hot, $UNI of most of its revenue came from PONS contributions. If PONS makes its own swap, wouldn’t that revenue belong to PONS then? Whether to do a swap isn’t really a question of whether you can make money—it’s a strategic question. Clearly, PONS hasn’t figured it out.
2. Team configuration. A tight team does have high productivity. But long-term, high-intensity work requires sustained combat power. Staffing needs a certain degree of resilience to be “anti-fragile.” Pump has managed to withstand this challenge over the past couple of years, while PONS hasn’t yet experienced it.
3. Product lines derived from memes. Besides swap, there’s social, chain-scanning tools, and multi-chain development. Pump stands out across all these areas. You could say it is a leader in each niche.
$PUMP is real
24-hour agreement revenue: $8.28 million, 24-hour agreement fees: $2.53 million
Agreement fees in the last 7 days: $47.7 million, agreement revenue in the last 7 days: $15.73 million
Recently, Robinhood chain $PONS has grown rapidly, but if you think about it carefully, PONS is still too far from pump. Here are a few simple points:
1. Temperament—also, ambition, or strategic goals. When the Robinhood chain was hot, $UNI of most of its revenue came from PONS contributions. If PONS makes its own swap, wouldn’t that revenue belong to PONS then? Whether to do a swap isn’t really a question of whether you can make money—it’s a strategic question. Clearly, PONS hasn’t figured it out.
2. Team configuration. A tight team does have high productivity. But long-term, high-intensity work requires sustained combat power. Staffing needs a certain degree of resilience to be “anti-fragile.” Pump has managed to withstand this challenge over the past couple of years, while PONS hasn’t yet experienced it.
3. Product lines derived from memes. Besides swap, there’s social, chain-scanning tools, and multi-chain development. Pump stands out across all these areas. You could say it is a leader in each niche.
24-hour agreement revenue: $8.28 million, 24-hour agreement fees: $2.53 million
Agreement fees in the last 7 days: $47.7 million, agreement revenue in the last 7 days: $15.73 million
Recently, Robinhood chain $PONS has grown rapidly, but if you think about it carefully, PONS is still too far from pump. Here are a few simple points:
1. Temperament—also, ambition, or strategic goals. When the Robinhood chain was hot, $UNI of most of its revenue came from PONS contributions. If PONS makes its own swap, wouldn’t that revenue belong to PONS then? Whether to do a swap isn’t really a question of whether you can make money—it’s a strategic question. Clearly, PONS hasn’t figured it out.
2. Team configuration. A tight team does have high productivity. But long-term, high-intensity work requires sustained combat power. Staffing needs a certain degree of resilience to be “anti-fragile.” Pump has managed to withstand this challenge over the past couple of years, while PONS hasn’t yet experienced it.
3. Product lines derived from memes. Besides swap, there’s social, chain-scanning tools, and multi-chain development. Pump stands out across all these areas. You could say it is a leader in each niche.
1
1.8k
·
--

Article
Wang Chun: Is SPCX the best investment after Bitcoin?What just happened?
On September 28, 2026, Starship first entered sustained orbit, successfully deploying 26 operational-grade V3 satellites. This is Starship’s first real source of revenue—previously, the 13 missions were basically tests.
Wang Chun has recently been saying: “If you sold too early when BTC was at sixty thousand or seventy thousand, and you don’t dare to buy back when it’s above eighty thousand, consider $SPCX. It is the best investment besides Bitcoin—it’s investing in humanity’s multi-planet future. Flight 14 is a milestone: after more than 7 years of development, Starship has finally started generating revenue.”
In essence, what he means is that using Flight 14, SpaceX has been redefined from a “reusable rocket + satellite internet company” into a “foundation-infrastructure company for a multi-planet civilization.”
Wang Chun: Is SPCX the best investment after Bitcoin?
What just happened?
On September 28, 2026, Starship first entered sustained orbit, successfully deploying 26 operational-grade V3 satellites. This is Starship’s first real source of revenue—previously, the 13 missions were basically tests.
Wang Chun has recently been saying: “If you sold too early when BTC was at sixty thousand or seventy thousand, and you don’t dare to buy back when it’s above eighty thousand, consider $SPCX . It is the best investment besides Bitcoin—it’s investing in humanity’s multi-planet future. Flight 14 is a milestone: after more than 7 years of development, Starship has finally started generating revenue.”
In essence, what he means is that using Flight 14, SpaceX has been redefined from a “reusable rocket + satellite internet company” into a “foundation-infrastructure company for a multi-planet civilization.”
On September 28, 2026, Starship first entered sustained orbit, successfully deploying 26 operational-grade V3 satellites. This is Starship’s first real source of revenue—previously, the 13 missions were basically tests.
Wang Chun has recently been saying: “If you sold too early when BTC was at sixty thousand or seventy thousand, and you don’t dare to buy back when it’s above eighty thousand, consider $SPCX . It is the best investment besides Bitcoin—it’s investing in humanity’s multi-planet future. Flight 14 is a milestone: after more than 7 years of development, Starship has finally started generating revenue.”
In essence, what he means is that using Flight 14, SpaceX has been redefined from a “reusable rocket + satellite internet company” into a “foundation-infrastructure company for a multi-planet civilization.”
1.1k
·
--
7u Challenge One Hundred Million!
Day 38
Principal 7u, target one hundred million
Current: 3700u
Survival cost: 2600u
Available funds: 1100u+
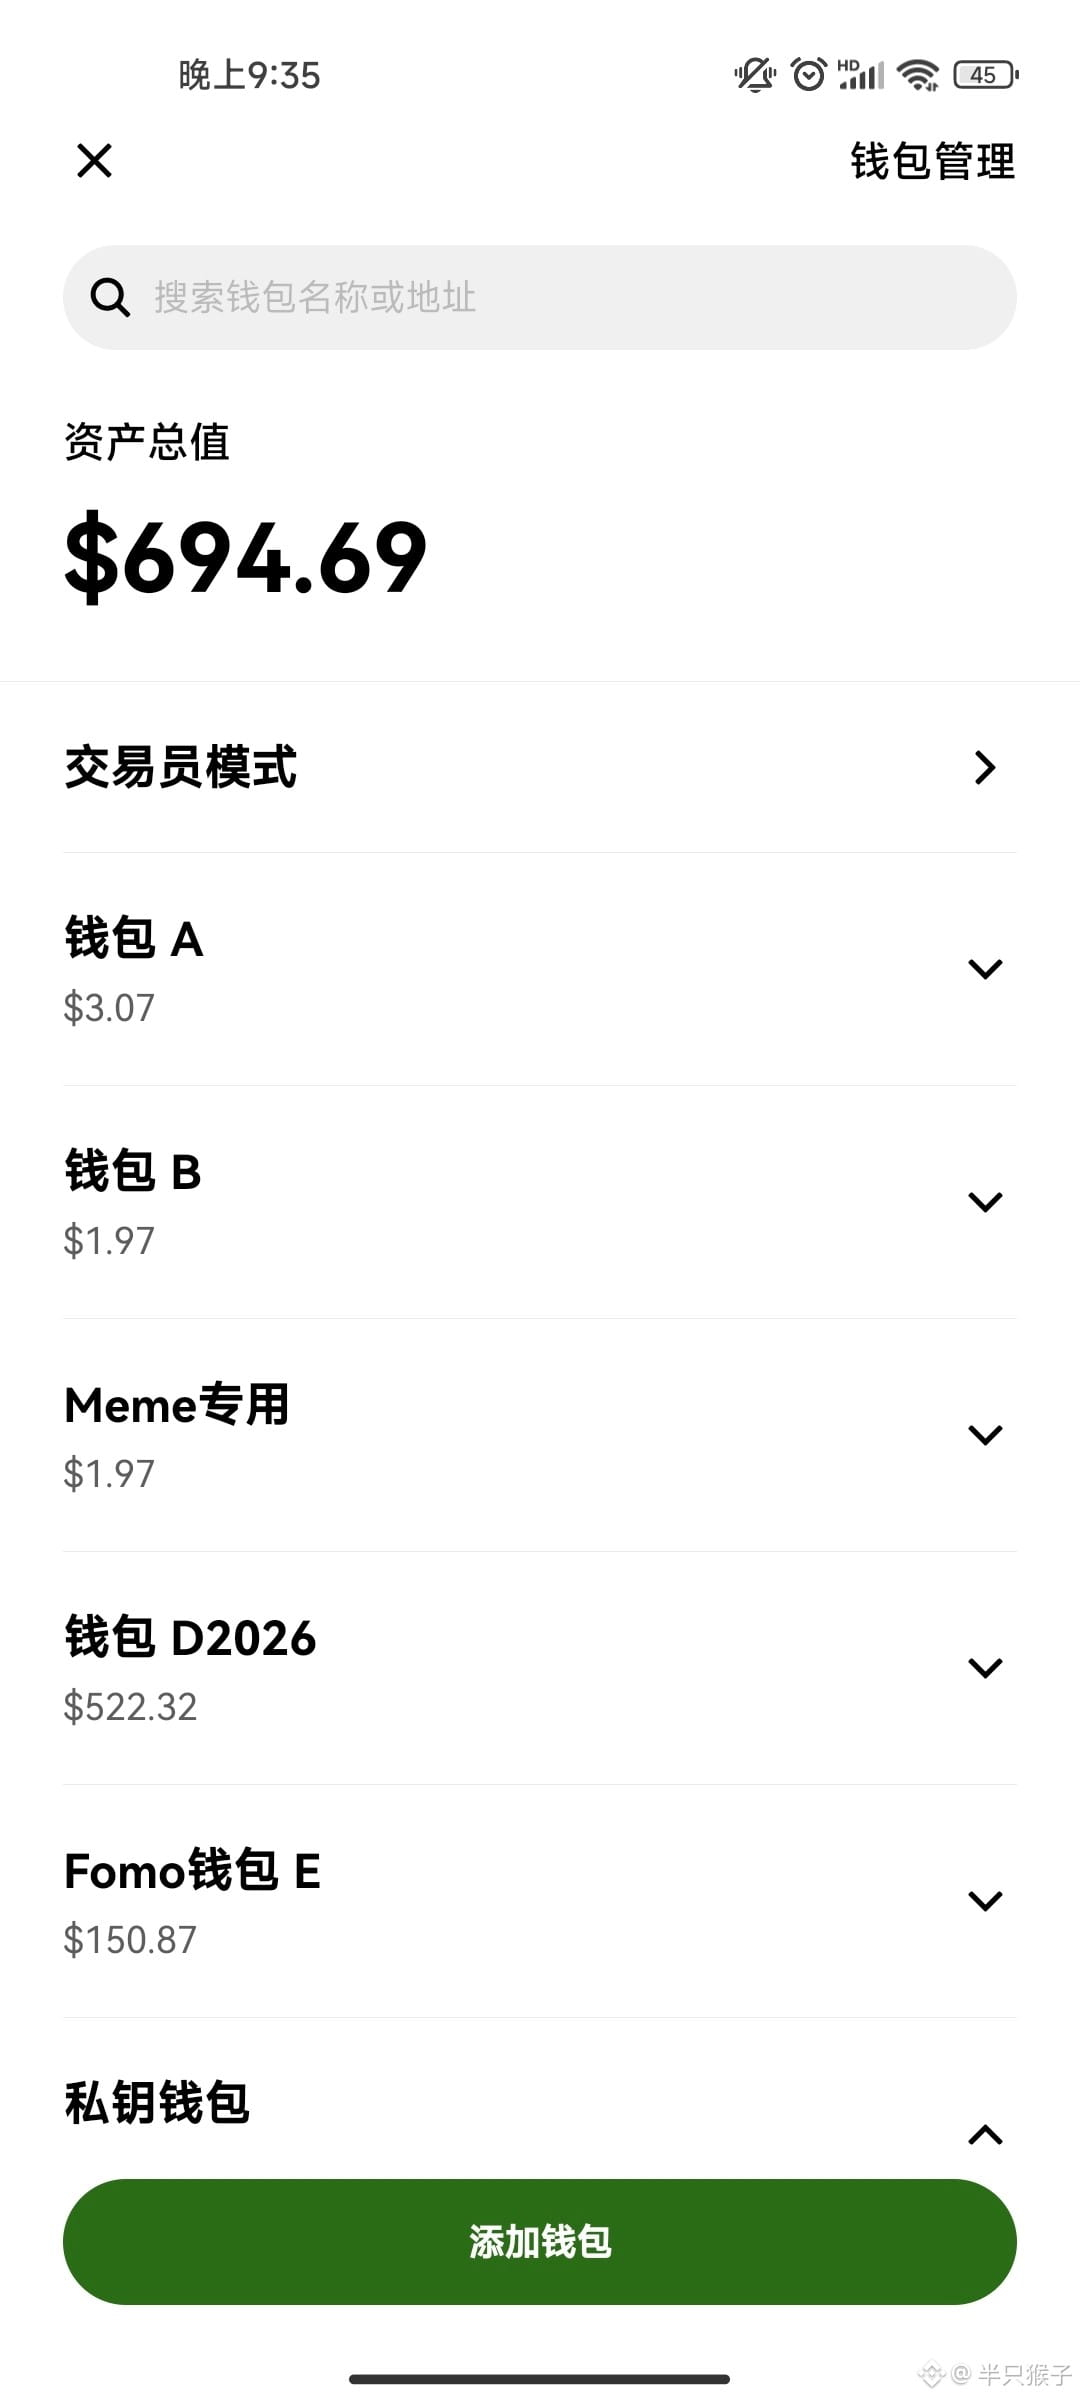
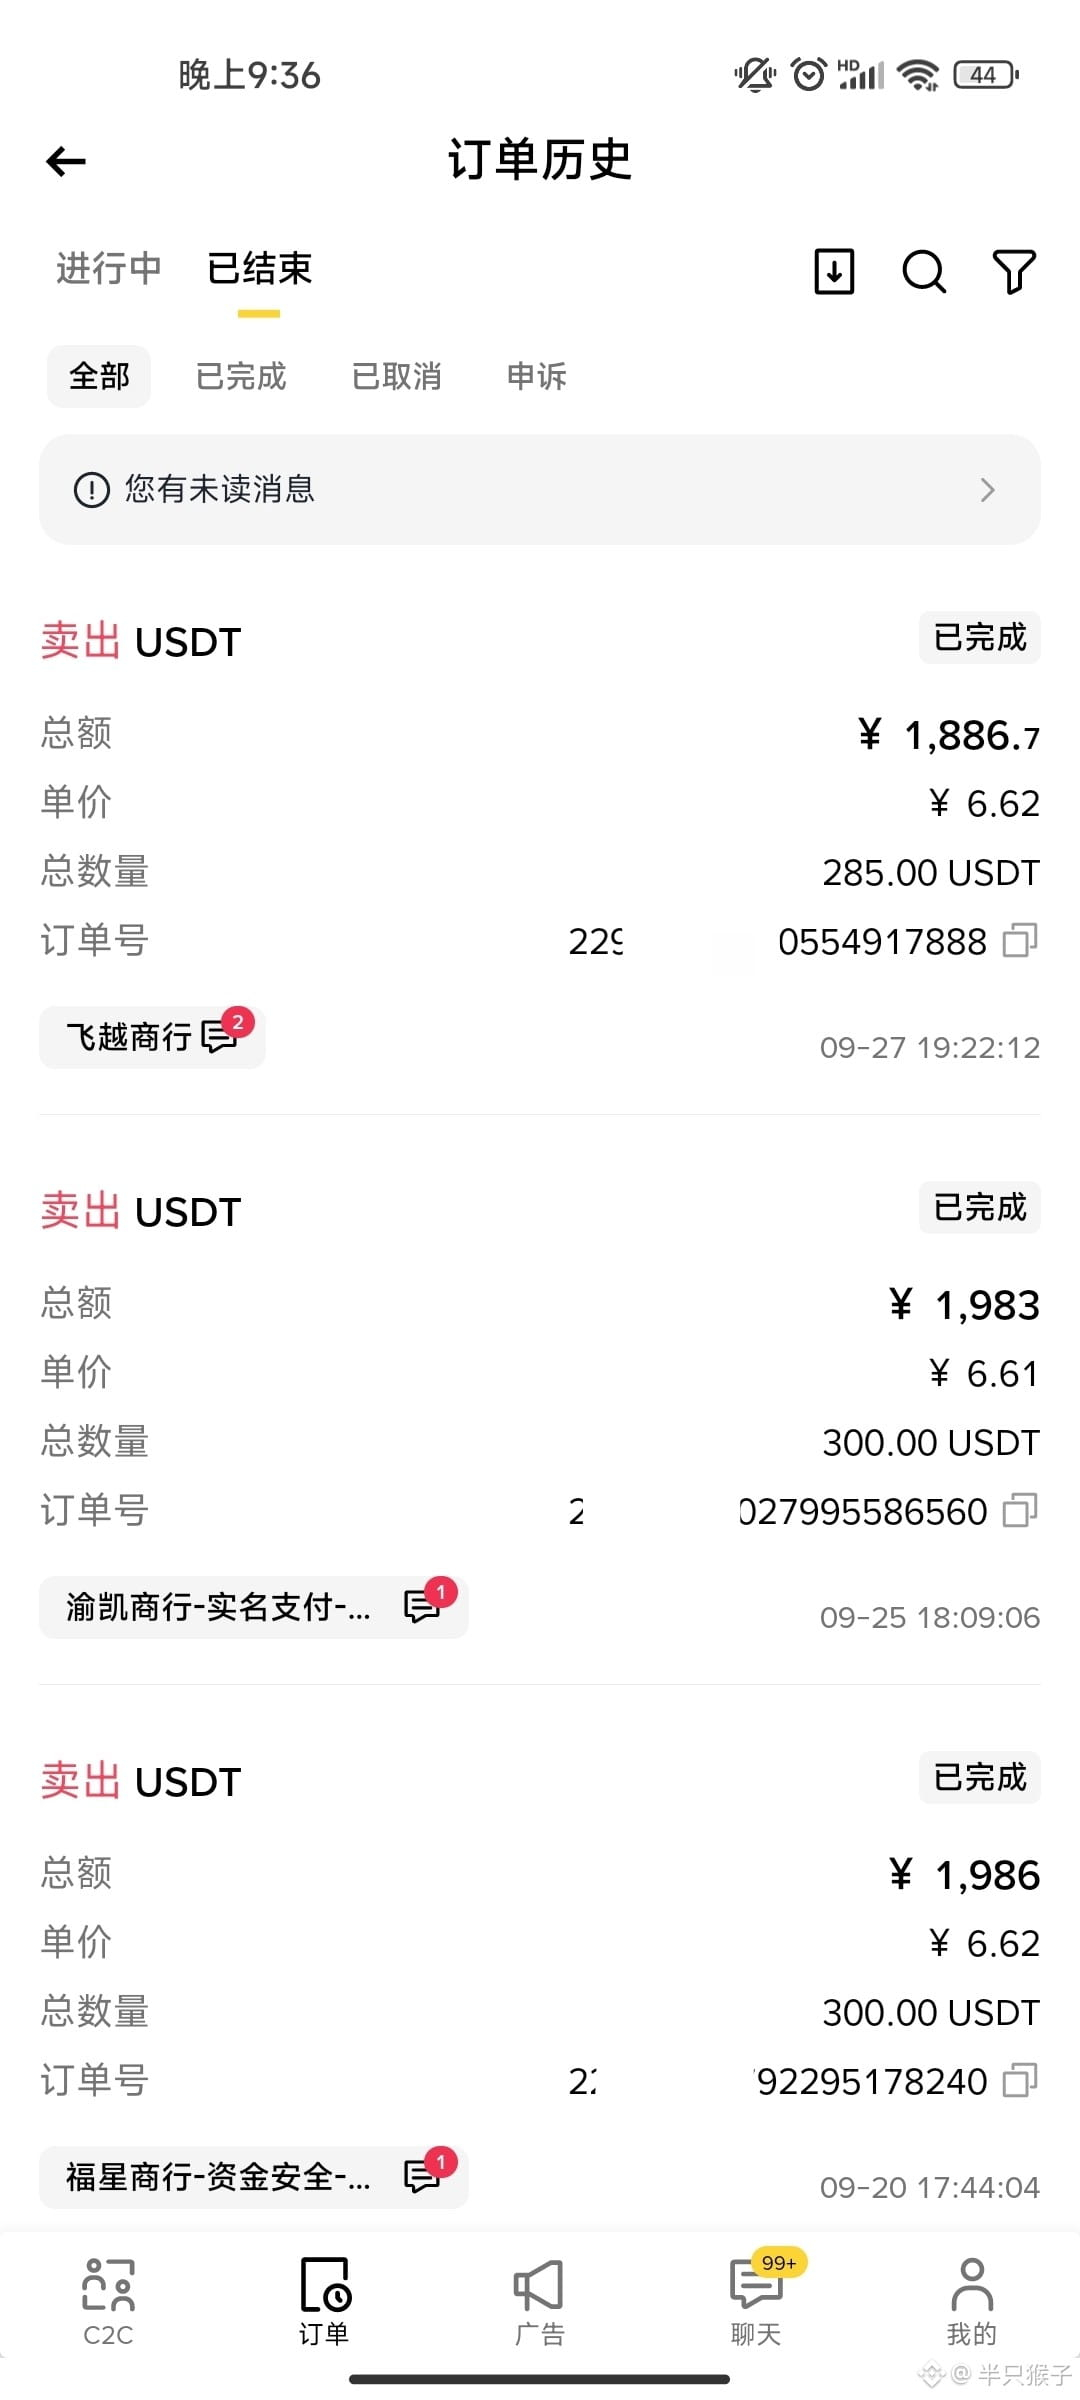
Turns out Mid-Autumn Festival really is expensive—every kind of expense, and I burned through 600 USD. This is precious principal of mine, and it feels like I didn’t even do anything. My available funds are only 1100 USD now. And in a moment it’s National Day—so panicked!
Maybe this is what they call “survival cost.” Until you break through the survival-cost line, it’s going to be uncomfortable.
1. There’s only $BNB left in spot;
2. The long positions are still open on Bitcoin $BTC . The key area is around 82,500. We’ll see if it can hold up there;
3. Still watching $ONDO and ENA closely;
4. PONS’s fundamentals have been too poor recently. In the past 24 hours, revenue was only 180,000 USD, and it keeps declining. I’ll wait to see when the fundamentals improve;
5. Then there’s the whole stack of memes. I currently don’t have any well-positioned trades. On the contrary, a few are traps—I’m crying.
Current overall approach: create content, and trade contracts and memes.
Strategy-wise, still using the barbell strategy—on one side, mainstream leading assets; on the other, pure memes.
{future}(ONDOUSDT)
7u Challenge One Hundred Million!
Day 38
Principal 7u, target one hundred million
Current: 3700u
Survival cost: 2600u
Available funds: 1100u+
Turns out Mid-Autumn Festival really is expensive—every kind of expense, and I burned through 600 USD. This is precious principal of mine, and it feels like I didn’t even do anything. My available funds are only 1100 USD now. And in a moment it’s National Day—so panicked!
Maybe this is what they call “survival cost.” Until you break through the survival-cost line, it’s going to be uncomfortable.
1. There’s only $BNB left in spot;
2. The long positions are still open on Bitcoin $BTC . The key area is around 82,500. We’ll see if it can hold up there;
3. Still watching $ONDO and ENA closely;
4. PONS’s fundamentals have been too poor recently. In the past 24 hours, revenue was only 180,000 USD, and it keeps declining. I’ll wait to see when the fundamentals improve;
5. Then there’s the whole stack of memes. I currently don’t have any well-positioned trades. On the contrary, a few are traps—I’m crying.
Current overall approach: create content, and trade contracts and memes.
Strategy-wise, still using the barbell strategy—on one side, mainstream leading assets; on the other, pure memes.
Day 38
Principal 7u, target one hundred million
Current: 3700u
Survival cost: 2600u
Available funds: 1100u+
Turns out Mid-Autumn Festival really is expensive—every kind of expense, and I burned through 600 USD. This is precious principal of mine, and it feels like I didn’t even do anything. My available funds are only 1100 USD now. And in a moment it’s National Day—so panicked!
Maybe this is what they call “survival cost.” Until you break through the survival-cost line, it’s going to be uncomfortable.
1. There’s only $BNB left in spot;
2. The long positions are still open on Bitcoin $BTC . The key area is around 82,500. We’ll see if it can hold up there;
3. Still watching $ONDO and ENA closely;
4. PONS’s fundamentals have been too poor recently. In the past 24 hours, revenue was only 180,000 USD, and it keeps declining. I’ll wait to see when the fundamentals improve;
5. Then there’s the whole stack of memes. I currently don’t have any well-positioned trades. On the contrary, a few are traps—I’m crying.
Current overall approach: create content, and trade contracts and memes.
Strategy-wise, still using the barbell strategy—on one side, mainstream leading assets; on the other, pure memes.
923
·
--
6.0B Shorts vs 2.6B Longs — Where Will BTC Go?
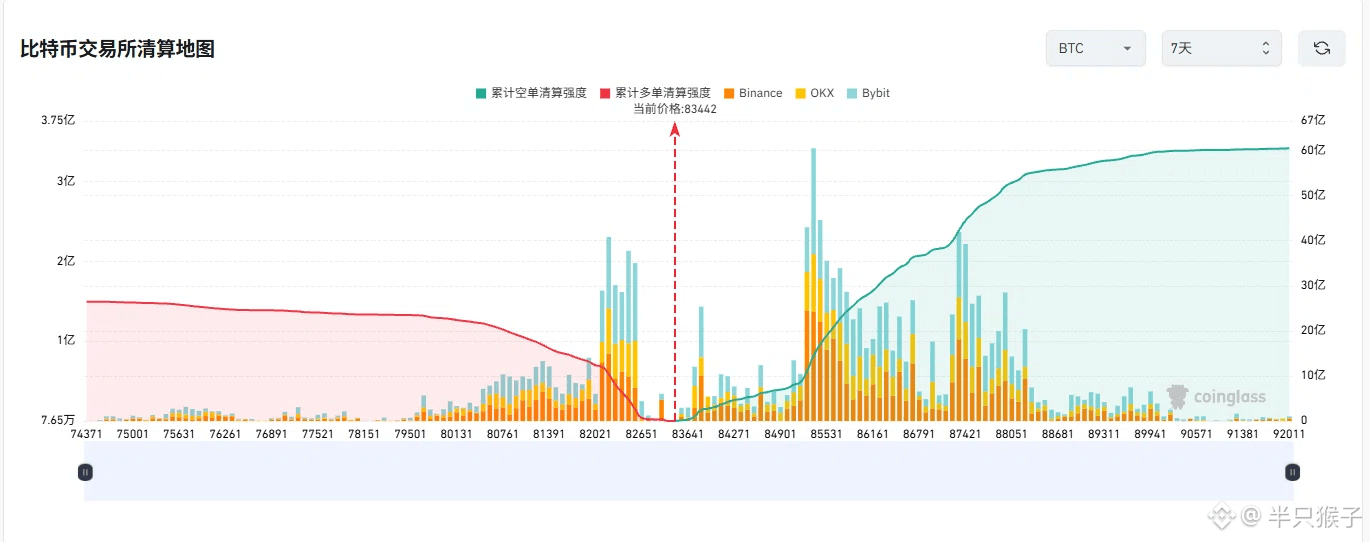
I just looked at the Bitcoin $BTC liquidation map. In this chart, two lines are fighting:
Red line: Cumulative long liquidation strength. Starting from 83,442, it climbs all the way to the left, reaching over $2.6B. This means that if the price drops, a large wave of long positions will be liquidated.
Green line: Cumulative short liquidation strength. Starting from 83,442, it climbs steadily upward, and on the right side it has already stacked up to more than $6B. This means that if the price moves up, there’s a big cluster of shorts above waiting to be liquidated.
Key levels:
Look at those dense bars—the high-leverage positions are mainly concentrated in two ranges: 82,500 and 85,000–88,000.
Longs and shorts have both amassed heavy forces in their respective upper and lower zones.
Are you bullish or bearish right now? Let’s discuss in the comments.
{future}(BTCUSDT)
6.0B Shorts vs 2.6B Longs — Where Will BTC Go?
I just looked at the Bitcoin $BTC liquidation map. In this chart, two lines are fighting:
Red line: Cumulative long liquidation strength. Starting from 83,442, it climbs all the way to the left, reaching over $2.6B. This means that if the price drops, a large wave of long positions will be liquidated.
Green line: Cumulative short liquidation strength. Starting from 83,442, it climbs steadily upward, and on the right side it has already stacked up to more than $6B. This means that if the price moves up, there’s a big cluster of shorts above waiting to be liquidated.
Key levels:
Look at those dense bars—the high-leverage positions are mainly concentrated in two ranges: 82,500 and 85,000–88,000.
Longs and shorts have both amassed heavy forces in their respective upper and lower zones.
Are you bullish or bearish right now? Let’s discuss in the comments.
I just looked at the Bitcoin $BTC liquidation map. In this chart, two lines are fighting:
Red line: Cumulative long liquidation strength. Starting from 83,442, it climbs all the way to the left, reaching over $2.6B. This means that if the price drops, a large wave of long positions will be liquidated.
Green line: Cumulative short liquidation strength. Starting from 83,442, it climbs steadily upward, and on the right side it has already stacked up to more than $6B. This means that if the price moves up, there’s a big cluster of shorts above waiting to be liquidated.
Key levels:
Look at those dense bars—the high-leverage positions are mainly concentrated in two ranges: 82,500 and 85,000–88,000.
Longs and shorts have both amassed heavy forces in their respective upper and lower zones.
Are you bullish or bearish right now? Let’s discuss in the comments.
375
Log in to explore more content
Join global crypto users on Binance Square
⚡️ Get latest and useful information about crypto.
💬 Trusted by the world’s largest crypto exchange.
👍 Discover real insights from verified creators.
Email / Phone number
Trending Topics
BNBSurpasses$790
11,712 views
92 Discussing
$BNB strategic long plan -> FOCUS NOW
BNB has created 2 strong lows after taking out internal liquidity
I'm expecting a move towards swing high $815-$830 and looking for a long on a retest of the green box
#BNBSurpasses$790 #bnb
Ghost Writer
·4 Likes
·5.7k views
ZamaRises15.99%ToIntradayHigh$0.09
6,540 views
77 Discussing
BitcoinSpotETFsDraw$6.34BInflowsInQ3
4,021 views
66 Discussing