
Miger米格
4.2k Posts

Miger米格
【推特(X): MIGER168】【公众号: 米格航行圈 】分析师兼交易员,每天更新美股以及热门币操作思路,跟单请进聊天室【手续费八折邀请码:MIGER16888】

BTC Holder
High-Frequency Trader
1.1 Years
20 Following
7.8K+ Followers
6.6K+ Liked
Posts
All
Quotes
Videos
PINNED
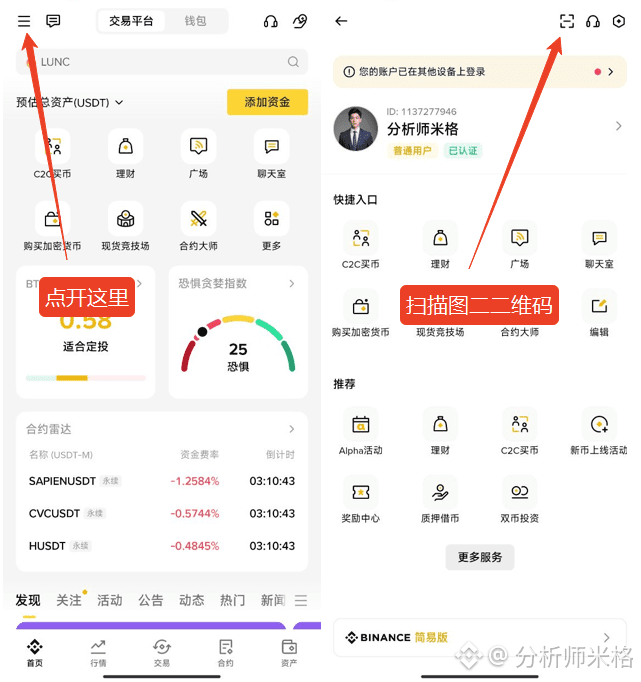
You can come directly find me on Mig!\n\nFeel free to hit me up for copy trading or analysis, I'll respond to everyone I see!!\n\nA lot of fans still can't find the chat room location.\n\nScan my Binance QR code below or just search my ID: 1137277946 to get in touch with me!\n\n$RIVER $XAU $SIREN \n\n#美国议员推动立法永久禁止CBDC #SolanaAI broker economic impact

PINNED
Keeping up with Mig's strategic pace is the key to safeguarding principal and stabilizing returns in investment!
With Mig's market-validated practical system, say goodbye to emotional trading, and let each decision be backed by data and grounded in logic.
Have you ever regretted missing out on the early dividends of Bitcoin and Ethereum? Have you experienced the sleepless nights of chasing highs and being trapped, unsure of how to proceed? Don't let regrets linger—come to Mig Village, where Mig will share specific entry and exit strategies and trading signals in real-time!
With Mig's market-validated practical system, say goodbye to emotional trading, and let each decision be backed by data and grounded in logic.
Have you ever regretted missing out on the early dividends of Bitcoin and Ethereum? Have you experienced the sleepless nights of chasing highs and being trapped, unsure of how to proceed? Don't let regrets linger—come to Mig Village, where Mig will share specific entry and exit strategies and trading signals in real-time!
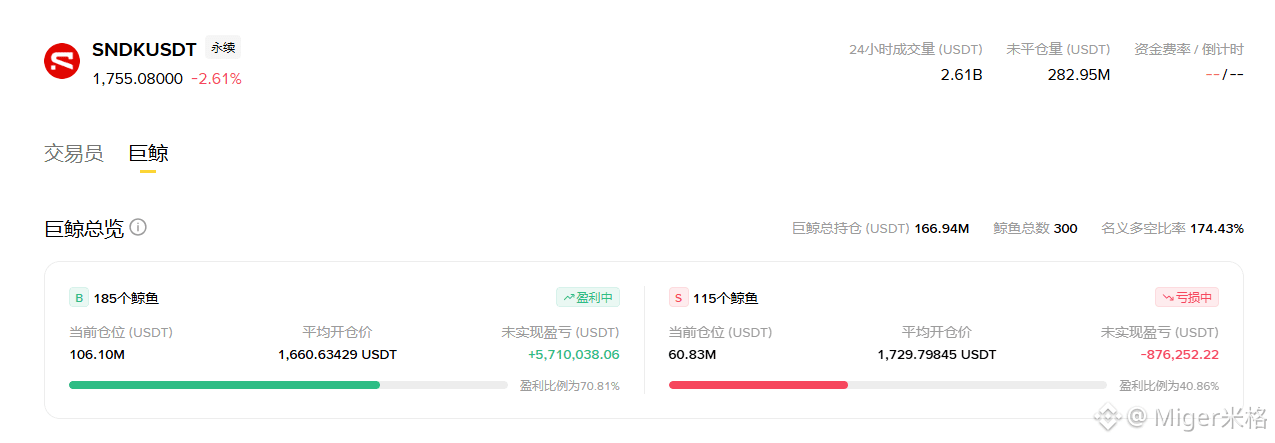
$SNDK sees a hidden “golden pit” drop! The 1-hour chart’s life-or-death line is exposed—if it breaks above 1768, buy the breakout and chase by 20%; if it falls below 1750, is it a waterfall? MiG’s exclusive long/short strategy—must-read for retail investors!
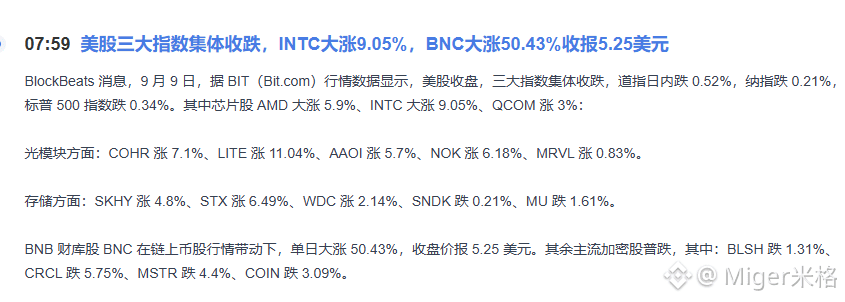
Overnight, the three major US stock indexes closed lower across the board, but the chip stocks turned into a celebration—INTC surged 9.05% and AMD rose 5.9%. The memory sector was just as exciting: SKHY rose 4.8%, STX jumped 6.49%, but SNDK was the only one to close down despite broad sector gains. On the news front, memory chip inventories are urgently tight. A Korean brokerage warned that next year could see the worst supply shortage in history. The fundamental logic hasn’t changed—this pullback in SNDK looks more like riding the momentum to shake out weak hands. The bulls are increasing volume and standing above 1768 to go long; the bears enter directly to short around 1780–1790.
Personal view: triple negative factors are converging—macro rate-hike expectations, good fundamentals already fully priced, and an imminent technical breakdown. In the long run, I’m optimistic, but in the short term, it’s still mainly about staying short/high-puts.
#伊朗称击中两艘美军驱逐舰 #美股收跌英特尔涨9% #道指下跌超600点
Overnight, the three major US stock indexes closed lower across the board, but the chip stocks turned into a celebration—INTC surged 9.05% and AMD rose 5.9%. The memory sector was just as exciting: SKHY rose 4.8%, STX jumped 6.49%, but SNDK was the only one to close down despite broad sector gains. On the news front, memory chip inventories are urgently tight. A Korean brokerage warned that next year could see the worst supply shortage in history. The fundamental logic hasn’t changed—this pullback in SNDK looks more like riding the momentum to shake out weak hands. The bulls are increasing volume and standing above 1768 to go long; the bears enter directly to short around 1780–1790.
Personal view: triple negative factors are converging—macro rate-hike expectations, good fundamentals already fully priced, and an imminent technical breakdown. In the long run, I’m optimistic, but in the short term, it’s still mainly about staying short/high-puts.
#伊朗称击中两艘美军驱逐舰 #美股收跌英特尔涨9% #道指下跌超600点
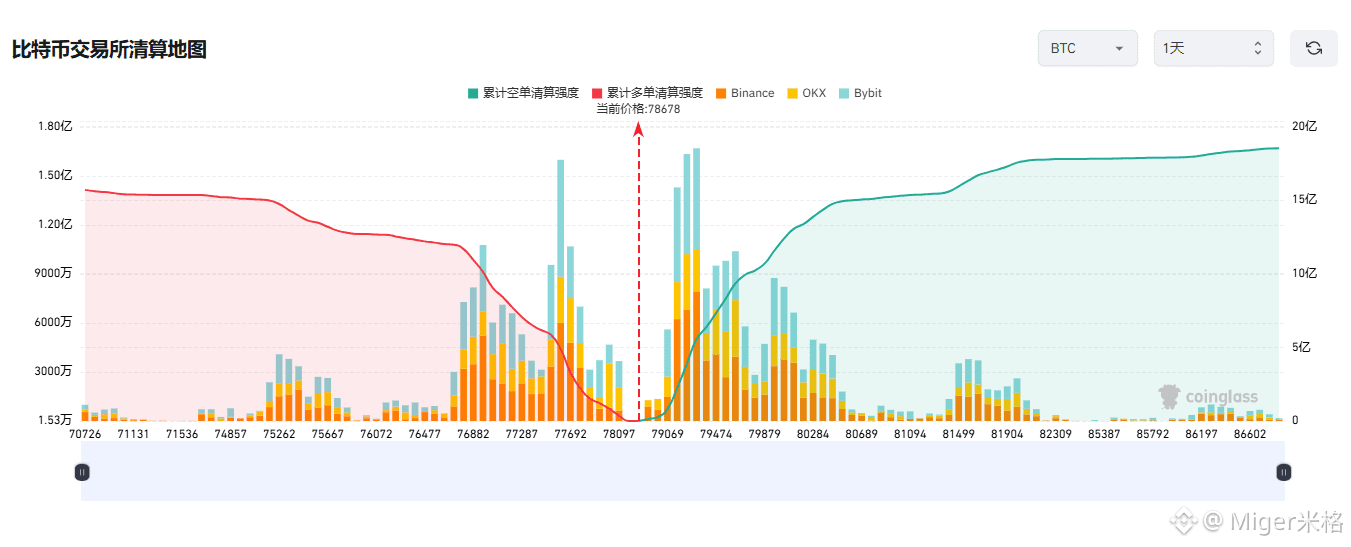
Alert! $BTC long position deeply trapped—3000 points! The Fed’s rate hike “axe” has fallen, and the 77k support line is hanging by a thread! MIG: In the final step, you can turn from being trapped to exiting in profit!
A crash isn’t the end of the world—holding on is the abyss! Only by recognizing the trend can you survive.
Reasons for the drop
The main negative catalyst is the surge in expectations for a Fed rate hike—US August nonfarm payrolls came in unexpectedly strong, and the probability of a September hike has already exceeded 60%, directly pressuring interest-free assets like BTC. In addition, the strong resistance at 82k has been rejected; big whales are taking profits and dumping, while liquidity continues to show sustained net outflows. The daily downtrend channel’s upper rail exerts clear pressure, making short-term bears dominant.
Untrapping strategy
Key support: the primary support is in the 77500 - 78000 range. If this level breaks, price could probe further down to 76000 and even 75500.
Reduce exposure on rebounds: 79500 - 80000 above is a strong resistance zone. If price rebounds up to this area, it should be an opportunity to reduce positions—not a place to chase profits.
My personal view
Unless rate-hike expectations reverse, BTC can hardly make a direct V-reversal from 82k. Friends who are trapped need to use rebounds to reduce their position size, not add more and bet on a reversal.
Different entry points mean different position sizes—and the untrapping strategies vary drastically. Bring your position screenshot to find MIG, and he’ll help you one-on-one to break down your “escape route”!
#美股收跌英特尔涨9% #道指下跌超600点 #美加关税战升级
A crash isn’t the end of the world—holding on is the abyss! Only by recognizing the trend can you survive.
Reasons for the drop
The main negative catalyst is the surge in expectations for a Fed rate hike—US August nonfarm payrolls came in unexpectedly strong, and the probability of a September hike has already exceeded 60%, directly pressuring interest-free assets like BTC. In addition, the strong resistance at 82k has been rejected; big whales are taking profits and dumping, while liquidity continues to show sustained net outflows. The daily downtrend channel’s upper rail exerts clear pressure, making short-term bears dominant.
Untrapping strategy
Key support: the primary support is in the 77500 - 78000 range. If this level breaks, price could probe further down to 76000 and even 75500.
Reduce exposure on rebounds: 79500 - 80000 above is a strong resistance zone. If price rebounds up to this area, it should be an opportunity to reduce positions—not a place to chase profits.
My personal view
Unless rate-hike expectations reverse, BTC can hardly make a direct V-reversal from 82k. Friends who are trapped need to use rebounds to reduce their position size, not add more and bet on a reversal.
Different entry points mean different position sizes—and the untrapping strategies vary drastically. Bring your position screenshot to find MIG, and he’ll help you one-on-one to break down your “escape route”!
#美股收跌英特尔涨9% #道指下跌超600点 #美加关税战升级

Verified
The moment the big guns roar, crude oil surges to triple digits! $CL in just one hour, the “life-and-death line” at 93.5—this is where the long-versus-short battle is decided, with MiG placing orders in advance!
The U.S. military destroys five Iranian oil tankers, and Iran launches 20 ballistic missiles striking a U.S. base in Jordan. Brent briefly touches 100; WTI closes at 93.03. Geopolitical panic is still spreading, and the hundred-dollar level is within arm’s reach. The MA7 and MA25 are aligned bullishly, but the previous high at 94.47 forms a strong resistance. There is a risk of a MACD death cross. Below, MA99 is the final bullish line of defense, and 93.5 becomes the intraday pivot between longs and shorts. For long positions, buy the pullback near 92.5–93; enter longs around 93.5 if you’re aggressive. For shorts, if 94.47 fails to break higher after two attempts and a top divergence appears, try a lightly sized short.
Personal view: The conflict is unlikely to be resolved in the short term; longs at lower levels are the priority. But at the hundred-dollar threshold, there will definitely be fierce competition—avoid chasing rallies with heavy positions.
#美股收跌英特尔涨9% #道指下跌超600点 #美加关税战升级
The U.S. military destroys five Iranian oil tankers, and Iran launches 20 ballistic missiles striking a U.S. base in Jordan. Brent briefly touches 100; WTI closes at 93.03. Geopolitical panic is still spreading, and the hundred-dollar level is within arm’s reach. The MA7 and MA25 are aligned bullishly, but the previous high at 94.47 forms a strong resistance. There is a risk of a MACD death cross. Below, MA99 is the final bullish line of defense, and 93.5 becomes the intraday pivot between longs and shorts. For long positions, buy the pullback near 92.5–93; enter longs around 93.5 if you’re aggressive. For shorts, if 94.47 fails to break higher after two attempts and a top divergence appears, try a lightly sized short.
Personal view: The conflict is unlikely to be resolved in the short term; longs at lower levels are the priority. But at the hundred-dollar threshold, there will definitely be fierce competition—avoid chasing rallies with heavy positions.
#美股收跌英特尔涨9% #道指下跌超600点 #美加关税战升级
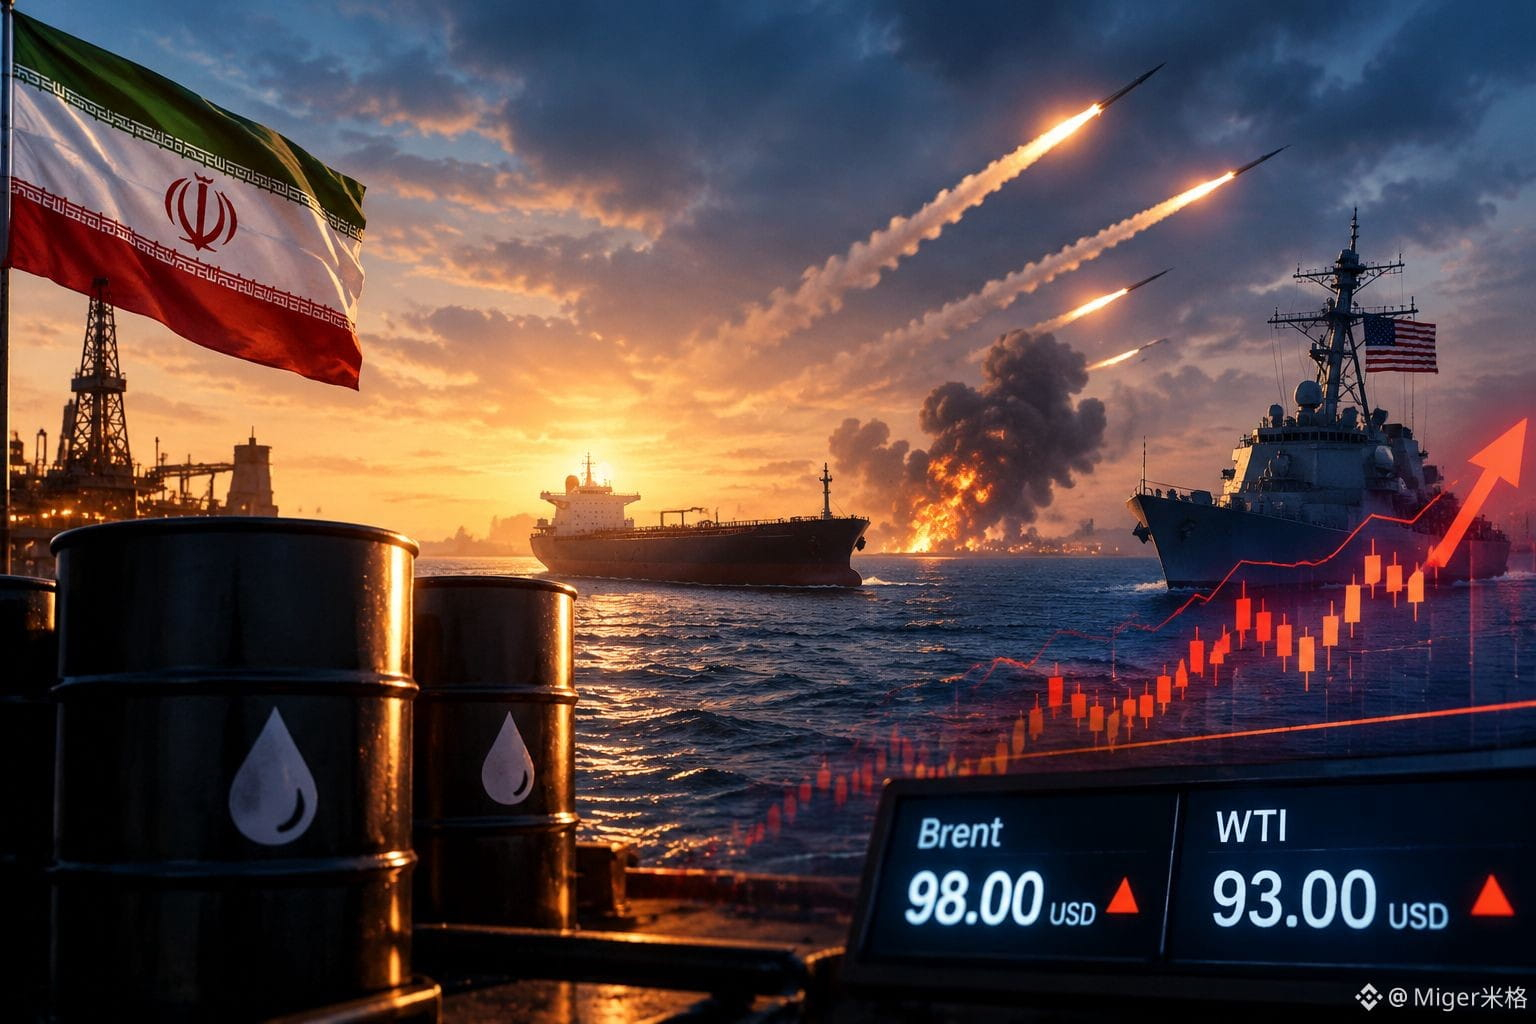
Houthi fires a shot to blow up the shorts! $CL Crude oil surges 2% to hit 94.5—MiG: How many nights can your short positions hold?
Brothers, yesterday you were still laughing at crude being weak—today the Houthi armed forces hit it with one shot and left the whole thing dazed. Aramco is attacked; geopolitical panic instantly detonates market sentiment. Oil ignores technical pressure and rockets straight up, hitting 94.5. Getting the direction wrong isn’t the scary part—the scary part is walking the wrong road and stubbornly refusing to stop.
This rally doesn’t have any complicated logic—just geopolitical emotion driving it. The Houthis attack Aramco; the market worries about Saudi retaliation causing supply disruptions, and the shorts are forced into a corner. Price momentum surges upward; when panic is in control, technical indicators become basically useless.
RSI has already fallen back from overbought territory to around 60. Price is far away from the moving averages, so a short-term pullback is indeed likely. But the real question is—can your position wait until then?
Ways to get out of the bind:
For shorts around 86 that you’ve held until now and are down nearly 10% on paper—"holding and waiting" is essentially waiting to die. If your position can still withstand it, around 94 you could consider adding to average down and then wait for the pullback to reduce and exit. If your position is already on the verge of liquidation, never add more—find a way to do T to lower risk.
Personal view:
The market will definitely pull back later, but whether your position can afford to wait is the biggest problem. Geopolitics comes fast and leaves fast, but liquidation doesn’t wait for anyone.
If you can’t read the chart signals, bring your position screenshot to find MiG—I’ll help you create a tailored risk-control plan and guide you out alive! Stay on the pace!
#美加关税战升级 #沙特南部能源设施遇袭停运 #美伊互袭油轮冲突升级
Brothers, yesterday you were still laughing at crude being weak—today the Houthi armed forces hit it with one shot and left the whole thing dazed. Aramco is attacked; geopolitical panic instantly detonates market sentiment. Oil ignores technical pressure and rockets straight up, hitting 94.5. Getting the direction wrong isn’t the scary part—the scary part is walking the wrong road and stubbornly refusing to stop.
This rally doesn’t have any complicated logic—just geopolitical emotion driving it. The Houthis attack Aramco; the market worries about Saudi retaliation causing supply disruptions, and the shorts are forced into a corner. Price momentum surges upward; when panic is in control, technical indicators become basically useless.
RSI has already fallen back from overbought territory to around 60. Price is far away from the moving averages, so a short-term pullback is indeed likely. But the real question is—can your position wait until then?
Ways to get out of the bind:
For shorts around 86 that you’ve held until now and are down nearly 10% on paper—"holding and waiting" is essentially waiting to die. If your position can still withstand it, around 94 you could consider adding to average down and then wait for the pullback to reduce and exit. If your position is already on the verge of liquidation, never add more—find a way to do T to lower risk.
Personal view:
The market will definitely pull back later, but whether your position can afford to wait is the biggest problem. Geopolitics comes fast and leaves fast, but liquidation doesn’t wait for anyone.
If you can’t read the chart signals, bring your position screenshot to find MiG—I’ll help you create a tailored risk-control plan and guide you out alive! Stay on the pace!
#美加关税战升级 #沙特南部能源设施遇袭停运 #美伊互袭油轮冲突升级

Partly True
Breaking! A Houthi missile blasts through Saudi oil fields! $CL crude oil surges to 94 in seconds—shorts get massacred! A million-lot position is a life-or-death showdown. Emergency entry!
The Yemeni Houthi forces said they would do it—and they did! On the 8th, dozens of missiles + drones delivered precise strikes on Saudi Aramco. Al Abqah and Jazan facilities were engulfed in flames, and an air base was hit! Saudi Arabia shelled for three straight days 121 times, and now it’s getting counterattacked. Crude jumps straight up from the ground—WTI rockets to 93.68 intraday. Short sellers are left strewn everywhere!
Technicals: Heavy pressure at 94.47—bulls and bears’ showdown is about to ignite! On the hourly chart, price is at 93.22. MA7 (93.73) is broken, but MA25 (92.90) is forming a golden cross to hold the floor. MACD is still positive—bulls aren’t completely dead. RSI 63.3 is slightly strong. But beware: long upper wicks tell you that chasing the high turns you into a chaser—cutting greens for others!
Bulls and bears both go off—how retail traders should play it:
For steady execution, wait for a pullback around 92 to 91.5 and then consider going long. For shorts, if there’s a rebound to 94.2–94.47 where it faces resistance, try shorting with a small position.
Personal view:
A news-driven explosive rally is most afraid of “clarifications” and “no material loss.” Once Saudi announces a restart of production, the premium evaporates in an instant!
#美加关税战升级 #沙特南部能源设施遇袭停运 #美伊互袭油轮冲突升级
The Yemeni Houthi forces said they would do it—and they did! On the 8th, dozens of missiles + drones delivered precise strikes on Saudi Aramco. Al Abqah and Jazan facilities were engulfed in flames, and an air base was hit! Saudi Arabia shelled for three straight days 121 times, and now it’s getting counterattacked. Crude jumps straight up from the ground—WTI rockets to 93.68 intraday. Short sellers are left strewn everywhere!
Technicals: Heavy pressure at 94.47—bulls and bears’ showdown is about to ignite! On the hourly chart, price is at 93.22. MA7 (93.73) is broken, but MA25 (92.90) is forming a golden cross to hold the floor. MACD is still positive—bulls aren’t completely dead. RSI 63.3 is slightly strong. But beware: long upper wicks tell you that chasing the high turns you into a chaser—cutting greens for others!
Bulls and bears both go off—how retail traders should play it:
For steady execution, wait for a pullback around 92 to 91.5 and then consider going long. For shorts, if there’s a rebound to 94.2–94.47 where it faces resistance, try shorting with a small position.
Personal view:
A news-driven explosive rally is most afraid of “clarifications” and “no material loss.” Once Saudi announces a restart of production, the premium evaporates in an instant!
#美加关税战升级 #沙特南部能源设施遇袭停运 #美伊互袭油轮冲突升级

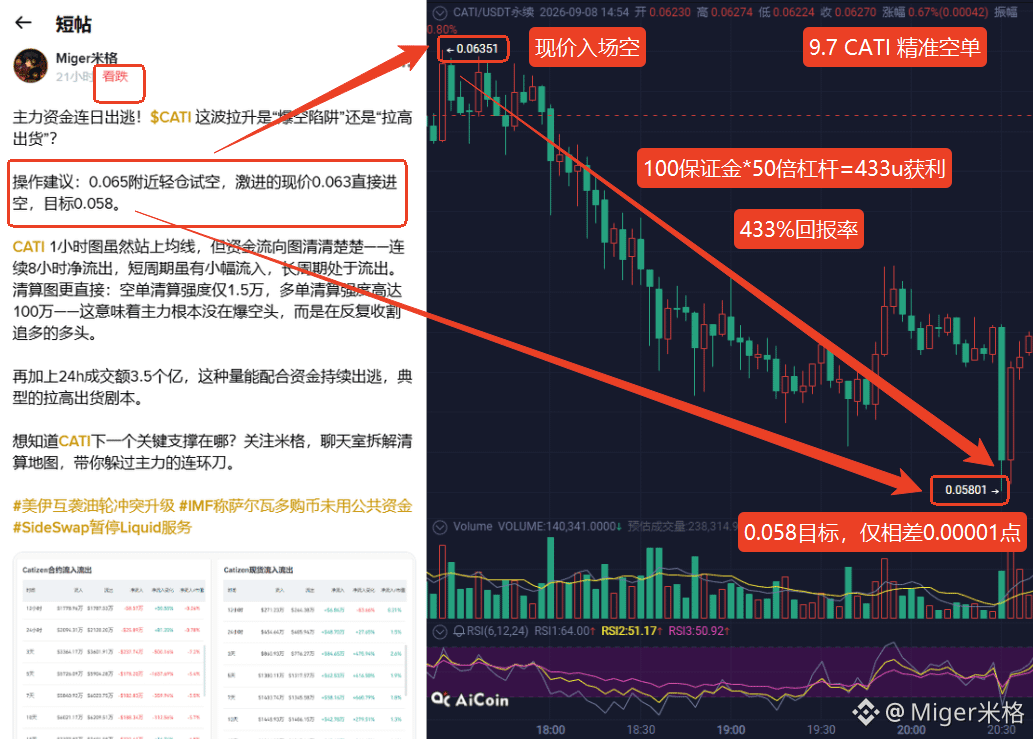
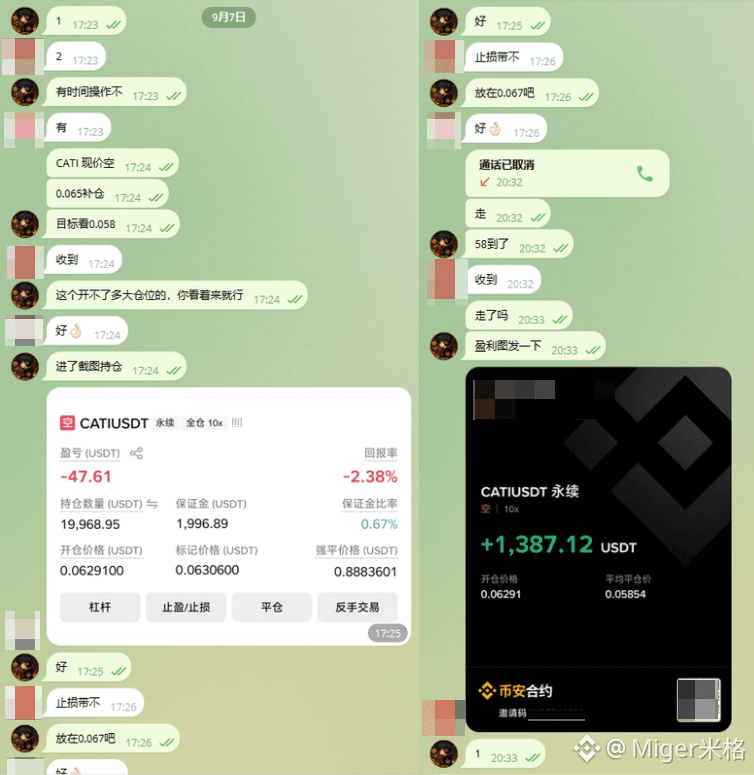
$CATI When things go to extremes, they reverse; going this high, and then dropping—let it cool down first
Still, congratulations to the brothers who followed the operation recommendations. It’s just a small profit, but better than having no profit to eat. Whether entering at 0.063 at the current price, or entering again at 0.065, there will be profit taken off the table. Target: 0.058; it’s only 0.0001 away from the lowest point—this was also a precise move.
If you want to keep pace with MiGe, come to the chat room to find MiGe!
#美加关税战升级 #沙特南部能源设施遇袭停运 #美伊互袭油轮冲突升级
Still, congratulations to the brothers who followed the operation recommendations. It’s just a small profit, but better than having no profit to eat. Whether entering at 0.063 at the current price, or entering again at 0.065, there will be profit taken off the table. Target: 0.058; it’s only 0.0001 away from the lowest point—this was also a precise move.
If you want to keep pace with MiGe, come to the chat room to find MiGe!
#美加关税战升级 #沙特南部能源设施遇袭停运 #美伊互袭油轮冲突升级
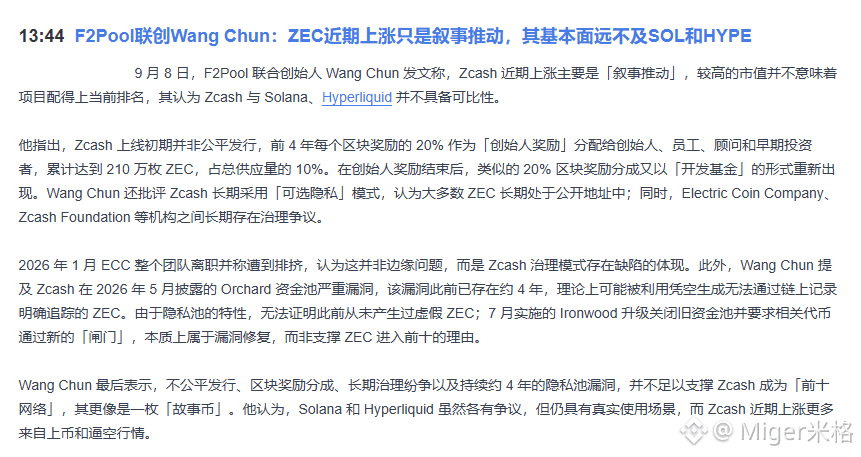
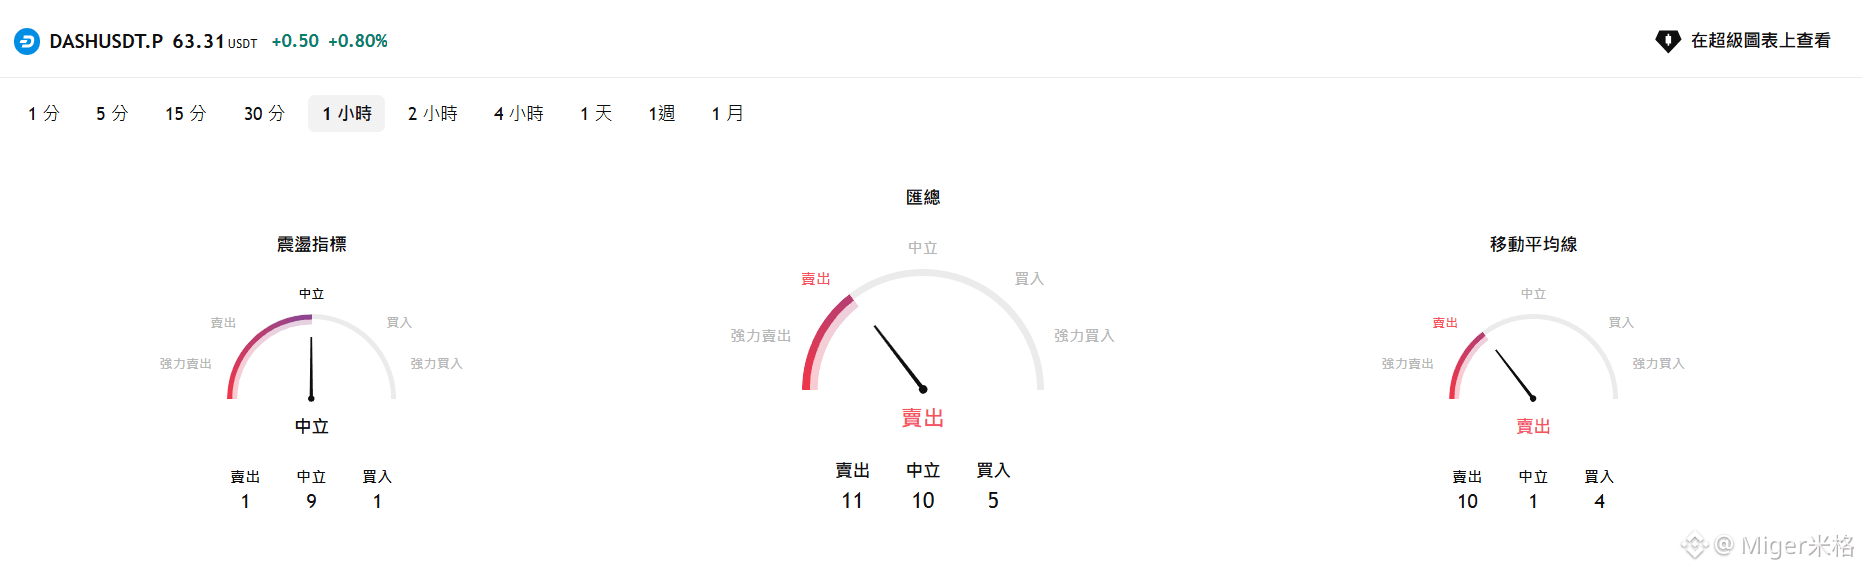
$ZEC deadly vulnerability + founder “cutting the wheat” scandal! 1-hour death cross confirmation: shorts smash $180 million, target 1050! Longs, don’t catch flying knives!
Today, ZEC is down 5.85%, with net capital outflows of $62.83 million. F2Pool co-founder Wang Chun just posted, directly calling ZEC a “narrative-driven” story coin—unfair issuance, the founders’ rewards taking 10%, an Orchard vulnerability lurking for 4 years, and fundamentals that simply don’t measure up to SOL or HYPE. Meanwhile, on the long side: the Zcash ETF listing by Grayscale has only been live for less than two weeks and has already attracted over $34 million, and Kamino has just launched ZEC-collateralized loans on Solana. The disagreement between bulls and bears has reached its peak. If you’re going long, wait for a pullback to 1097–1105 and enter with small size; if you’re short, on a rebound toward 1145–1160, consider shorting around there.
Core logic: fundamental flaws + ongoing capital flight + a technical death cross = medium-term bearish. ETF narrative and squeeze pressure can only prop things up for a while—it can’t last forever.
#日元突破155逼近年内新高 #美伊互袭油轮冲突升级 #加拿大对美关税正式生效
Today, ZEC is down 5.85%, with net capital outflows of $62.83 million. F2Pool co-founder Wang Chun just posted, directly calling ZEC a “narrative-driven” story coin—unfair issuance, the founders’ rewards taking 10%, an Orchard vulnerability lurking for 4 years, and fundamentals that simply don’t measure up to SOL or HYPE. Meanwhile, on the long side: the Zcash ETF listing by Grayscale has only been live for less than two weeks and has already attracted over $34 million, and Kamino has just launched ZEC-collateralized loans on Solana. The disagreement between bulls and bears has reached its peak. If you’re going long, wait for a pullback to 1097–1105 and enter with small size; if you’re short, on a rebound toward 1145–1160, consider shorting around there.
Core logic: fundamental flaws + ongoing capital flight + a technical death cross = medium-term bearish. ETF narrative and squeeze pressure can only prop things up for a while—it can’t last forever.
#日元突破155逼近年内新高 #美伊互袭油轮冲突升级 #加拿大对美关税正式生效
Verified
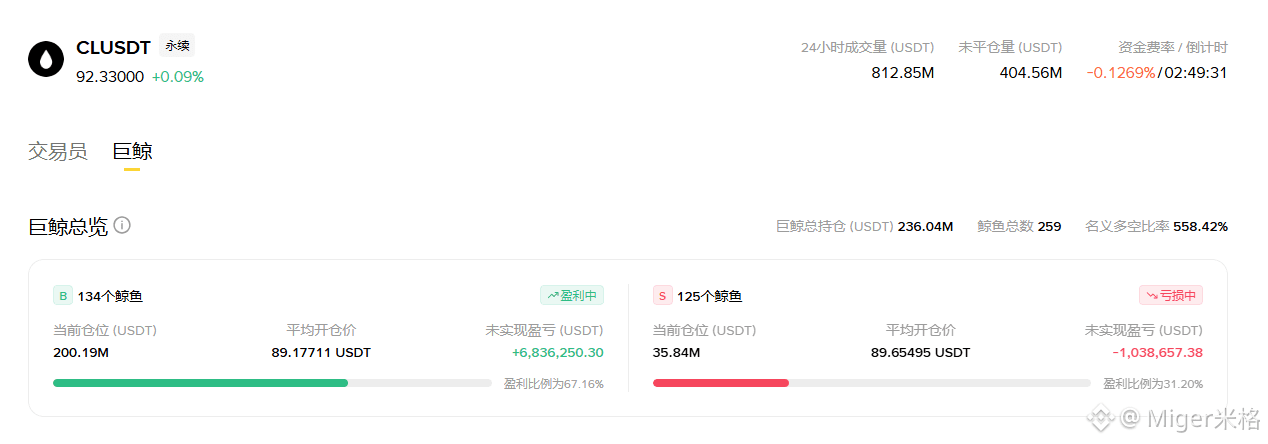
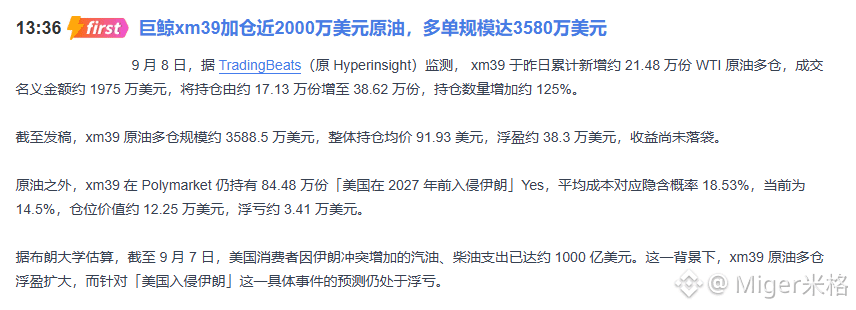
Giant Whale Bets $35.8 Million on Crude Oil! One-Hour Chart Releases Key Signals—Chase or Wait?
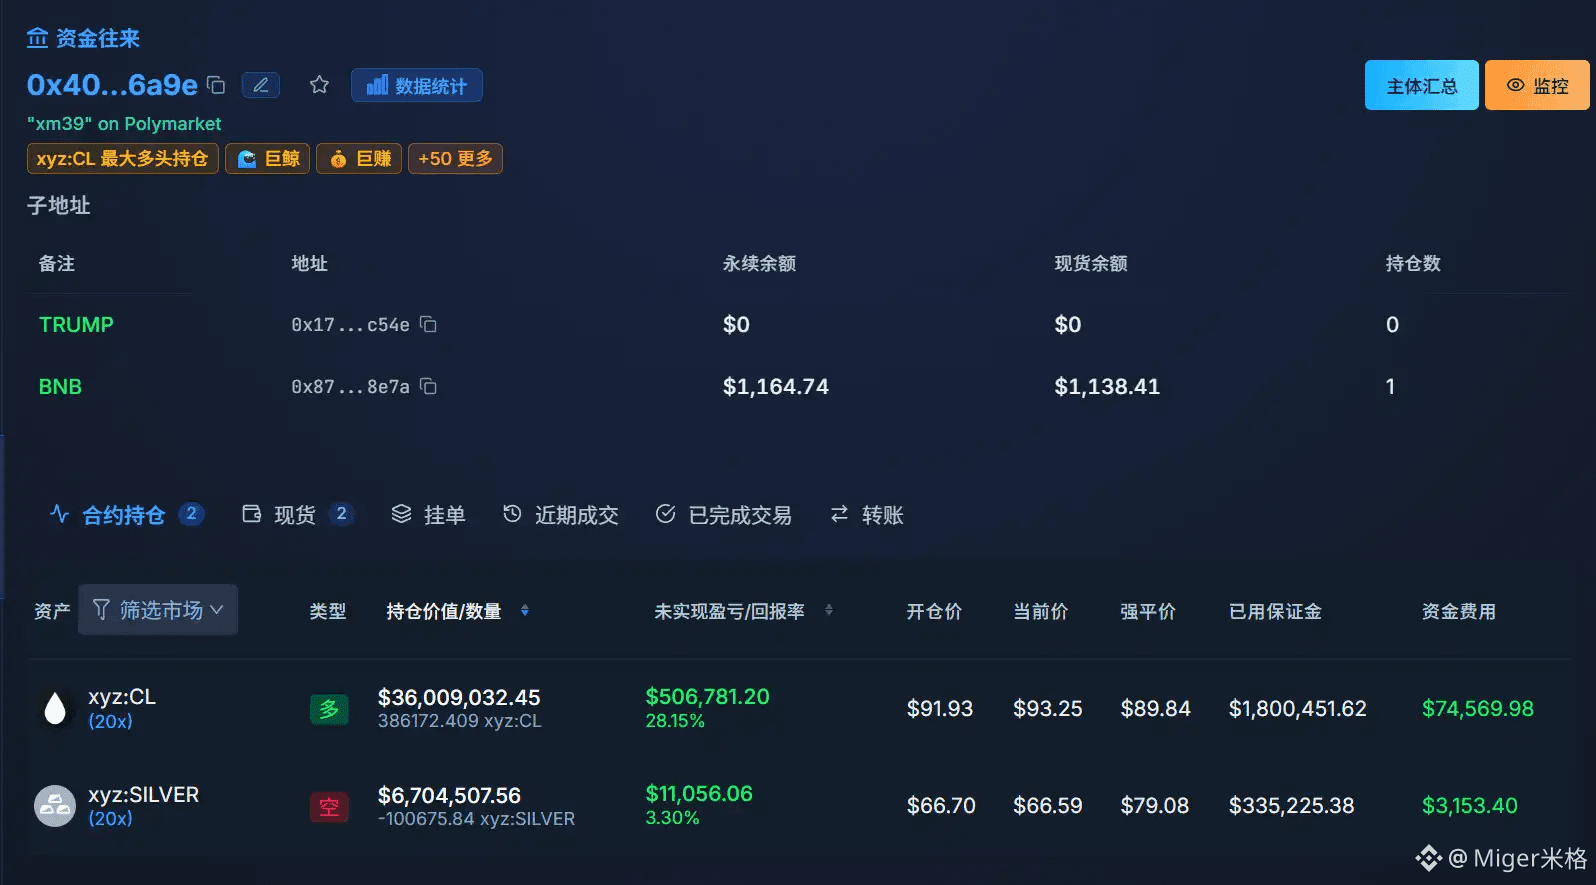
Tensions between Iran and Israel escalated over the weekend, with oil tankers targeted and the Strait of Hormuz in urgent trouble. OPEC+ paused crude output increases for the first time in seven months. Goldman Sachs urgently raised its oil price forecasts, warning that if shipping attacks intensify, prices could reach $120. The giant whale xm39 aggressively added nearly $20 million yesterday—long positions have grown to a total of $35.8 million. At an average entry price of $91.93, profits are currently in the black. Smart money is already making a bet!
Go long on a pullback around 92.8–93. If looking to short, only consider trying a small position if 94 is tested repeatedly and fails to break through effectively.
Personal view: The risk of disruption in the Middle East is unlikely to be resolved in the short term, but in the medium term I still lean bullish. However, Trump could release negotiation signals at any time, which may trigger a reversal of the premium. Volatility at high levels is intense, and leveraged trading carries extreme risk—make sure to set and follow stop-loss orders!
#库克卸任苹果CEO特纳斯接任 #日元突破155逼近年内新高 #美伊互袭油轮冲突升级 $CL $BTC $XAU
Tensions between Iran and Israel escalated over the weekend, with oil tankers targeted and the Strait of Hormuz in urgent trouble. OPEC+ paused crude output increases for the first time in seven months. Goldman Sachs urgently raised its oil price forecasts, warning that if shipping attacks intensify, prices could reach $120. The giant whale xm39 aggressively added nearly $20 million yesterday—long positions have grown to a total of $35.8 million. At an average entry price of $91.93, profits are currently in the black. Smart money is already making a bet!
Go long on a pullback around 92.8–93. If looking to short, only consider trying a small position if 94 is tested repeatedly and fails to break through effectively.
Personal view: The risk of disruption in the Middle East is unlikely to be resolved in the short term, but in the medium term I still lean bullish. However, Trump could release negotiation signals at any time, which may trigger a reversal of the premium. Volatility at high levels is intense, and leveraged trading carries extreme risk—make sure to set and follow stop-loss orders!
#库克卸任苹果CEO特纳斯接任 #日元突破155逼近年内新高 #美伊互袭油轮冲突升级 $CL $BTC $XAU
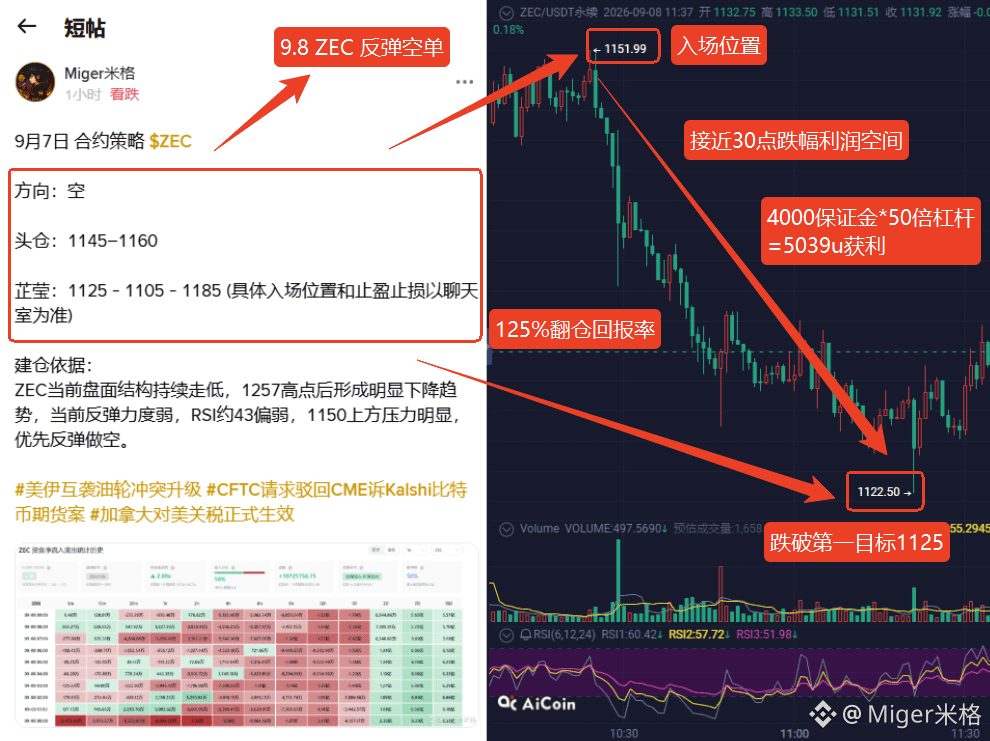
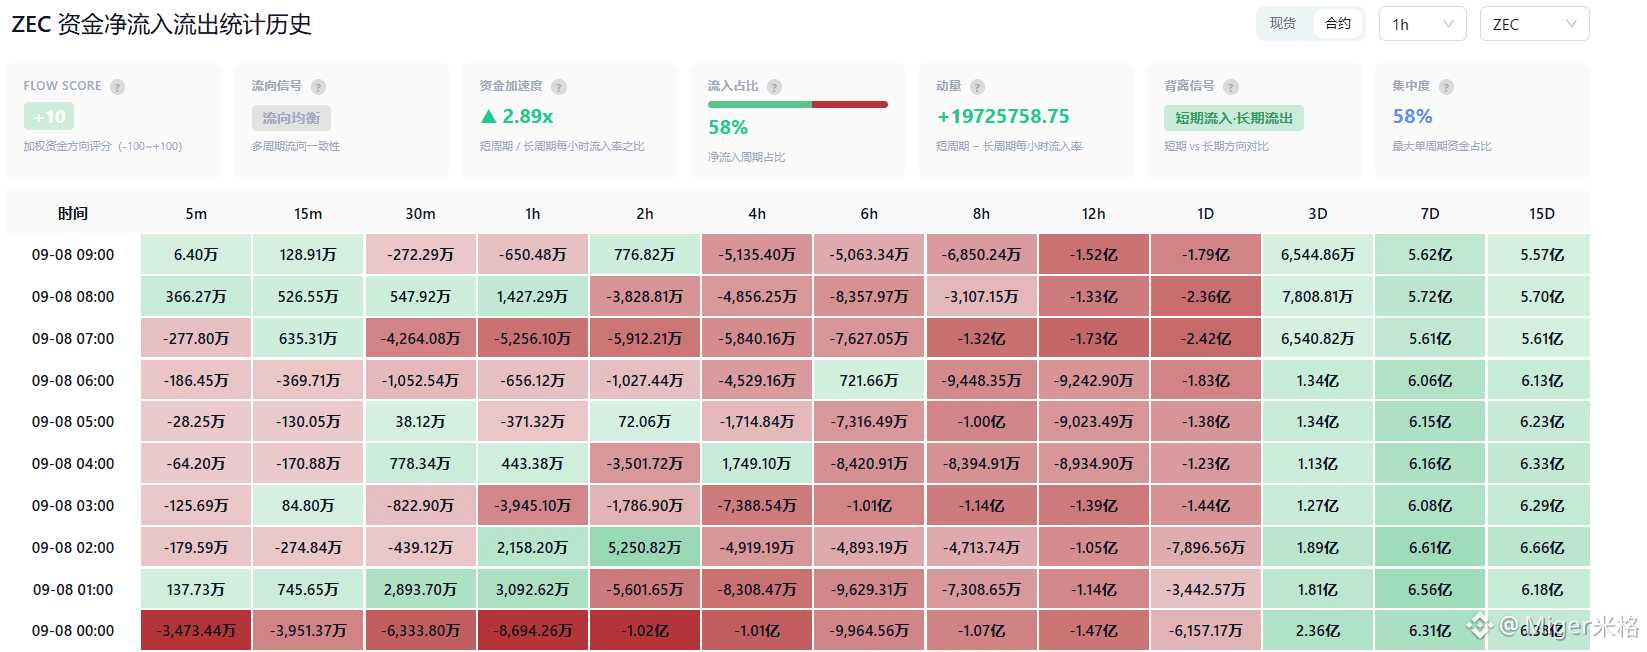
$ZEC in the morning updated operational suggestions for the brothers—ZEC bounced back short; did anyone follow along?
This morning, I’m going to enjoy a ZEC short trade first for 30 points. You can enter any position and still be able to take some profit. If you didn’t follow along, don’t feel discouraged—come to the Mig chat room, keep pace, and we’ll keep taking profit tonight!
#美伊互袭油轮冲突升级 #加拿大对美关税正式生效 #加拿大拟对美商品加征15%至50%关税
This morning, I’m going to enjoy a ZEC short trade first for 30 points. You can enter any position and still be able to take some profit. If you didn’t follow along, don’t feel discouraged—come to the Mig chat room, keep pace, and we’ll keep taking profit tonight!
#美伊互袭油轮冲突升级 #加拿大对美关税正式生效 #加拿大拟对美商品加征15%至50%关税
$ZEC 900 Short positions held firm to 1230, then dropped back to 1100! MiG: The bears aren’t dead yet—your trade still has a chance!
Brothers, if you’re shorting ZEC at 900, this pullback from 1230 to 1100—doesn’t it feel like dawn just broke? Don’t be so quick. Is this pullback an opportunity or a trap? MiG breaks it down for you.
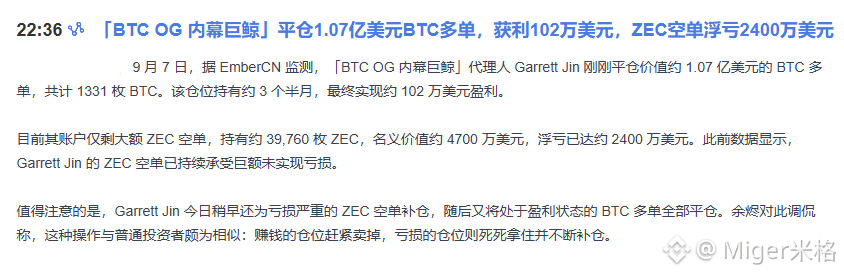
ZEC surged from 900 to 1230—yes, it was brutal. But a retracement back to around 1100 isn’t unexpected. Three reasons: RSI is severely overbought followed by a technical correction; the 4-hour chart tagged the upper Bollinger Band and naturally rolled over; and “big whale” GarrettJin’s short position on ZEC is sitting on an unrealized loss of 24 million, yet he hasn’t cut—he even added more, meaning the bears are still resisting. Plus, the weekend sentiment cooled down and profit-takers exited.
Unwinding strategy:
Right now price is around 1130, and the 4-hour Bollinger midline is the key level. Three-tier approach:
① If it breaks below 1100, wait for 1050–1080 and reduce positions in batches before exiting;
② If it rebounds to 1180–1200, you can add back to rebuild your average price;
③ If 1100 is lost, the downside opens up to 1000–1025, and at that time you must reduce positions.
Personal view:
This pullback is a healthy profit-taking retracement, not a trend reversal. But the whale’s short hasn’t blown up yet, which means sell-side pressure is still overhead—1100 to 1200 will keep getting tugged back and forth. Remember this line—when the bears aren’t dead, bulls can’t run out of steam. But once the bears truly die, the bulls are finished too.
Your short position is currently showing an unrealized loss—what’s the safest way to handle it? Bring your position screenshot to find MiG; I’ll take a look at your position size separately! Stay in sync with the moves!
#美伊互袭油轮冲突升级 #Zcash周涨45%创2016年来新高 #CFTC请求驳回CME诉Kalshi比特币期货案
Brothers, if you’re shorting ZEC at 900, this pullback from 1230 to 1100—doesn’t it feel like dawn just broke? Don’t be so quick. Is this pullback an opportunity or a trap? MiG breaks it down for you.
ZEC surged from 900 to 1230—yes, it was brutal. But a retracement back to around 1100 isn’t unexpected. Three reasons: RSI is severely overbought followed by a technical correction; the 4-hour chart tagged the upper Bollinger Band and naturally rolled over; and “big whale” GarrettJin’s short position on ZEC is sitting on an unrealized loss of 24 million, yet he hasn’t cut—he even added more, meaning the bears are still resisting. Plus, the weekend sentiment cooled down and profit-takers exited.
Unwinding strategy:
Right now price is around 1130, and the 4-hour Bollinger midline is the key level. Three-tier approach:
① If it breaks below 1100, wait for 1050–1080 and reduce positions in batches before exiting;
② If it rebounds to 1180–1200, you can add back to rebuild your average price;
③ If 1100 is lost, the downside opens up to 1000–1025, and at that time you must reduce positions.
Personal view:
This pullback is a healthy profit-taking retracement, not a trend reversal. But the whale’s short hasn’t blown up yet, which means sell-side pressure is still overhead—1100 to 1200 will keep getting tugged back and forth. Remember this line—when the bears aren’t dead, bulls can’t run out of steam. But once the bears truly die, the bulls are finished too.
Your short position is currently showing an unrealized loss—what’s the safest way to handle it? Bring your position screenshot to find MiG; I’ll take a look at your position size separately! Stay in sync with the moves!
#美伊互袭油轮冲突升级 #Zcash周涨45%创2016年来新高 #CFTC请求驳回CME诉Kalshi比特币期货案

$SKHYNIX inventory only has 10 days left. The 1-hour chart suddenly shows a “golden pit”*! Can you still chase it now? MIG shows you the way
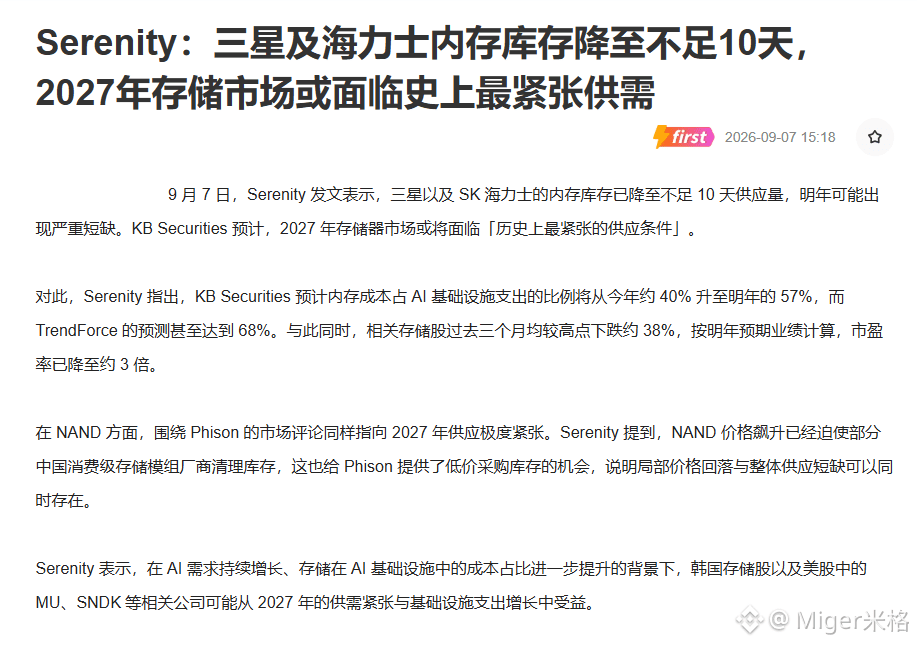
DRAM inventory from Samsung and SK hynix has fallen to less than 10 days of supply; KB Securities predicts the storage market will face “unprecedented shortages” in 2027. Over the past three months, storage stocks have dropped about 38% from their highs, and the P/E ratio has fallen to 3x. Both fundamentals and valuation clearly show double-bottom characteristics. The bulls can enter for a long near 1355–1365 on a pullback; aggressive traders can go long directly around 1380. The bears, if they cannot effectively break through near 1420–1440, can try a small short position. Pay attention to position sizing when entering!
Personal view: Strong fundamental support + a bullish technical setup, with a clear upside thesis for the medium term. Short-term consolidation is only to wash out floating positions; anything below 1350 is considered the golden pit.
#美伊互袭油轮冲突升级 #CFTC请求驳回CME诉Kalshi比特币期货案 #加拿大对美关税正式生效
DRAM inventory from Samsung and SK hynix has fallen to less than 10 days of supply; KB Securities predicts the storage market will face “unprecedented shortages” in 2027. Over the past three months, storage stocks have dropped about 38% from their highs, and the P/E ratio has fallen to 3x. Both fundamentals and valuation clearly show double-bottom characteristics. The bulls can enter for a long near 1355–1365 on a pullback; aggressive traders can go long directly around 1380. The bears, if they cannot effectively break through near 1420–1440, can try a small short position. Pay attention to position sizing when entering!
Personal view: Strong fundamental support + a bullish technical setup, with a clear upside thesis for the medium term. Short-term consolidation is only to wash out floating positions; anything below 1350 is considered the golden pit.
#美伊互袭油轮冲突升级 #CFTC请求驳回CME诉Kalshi比特币期货案 #加拿大对美关税正式生效
September 7 Contract Strategy $ZEC
Direction: Short
Long/Buy Position: 1145–1160
ZhiYing: 1125 - 1105 - 1185 (exact entry price and take-profit/stop-loss to follow the chat room)
Rationale for establishing the position:
ZEC’s current market structure is continuing to weaken. After the 1257 high, a clear downtrend formed. The current rebound strength is weak, RSI is about 43 and relatively weak. There is clear resistance above 1150. Prefer to short on the rebound.
#美伊互袭油轮冲突升级 #CFTC请求驳回CME诉Kalshi比特币期货案 #加拿大对美关税正式生效
Direction: Short
Long/Buy Position: 1145–1160
ZhiYing: 1125 - 1105 - 1185 (exact entry price and take-profit/stop-loss to follow the chat room)
Rationale for establishing the position:
ZEC’s current market structure is continuing to weaken. After the 1257 high, a clear downtrend formed. The current rebound strength is weak, RSI is about 43 and relatively weak. There is clear resistance above 1150. Prefer to short on the rebound.
#美伊互袭油轮冲突升级 #CFTC请求驳回CME诉Kalshi比特币期货案 #加拿大对美关税正式生效
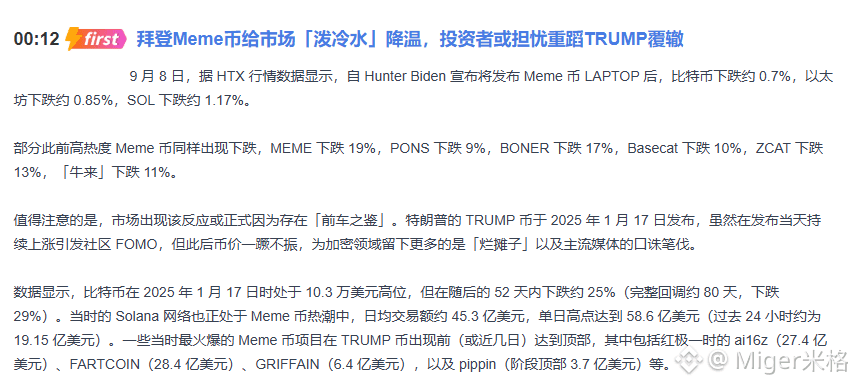
$SKHYNIX 提前埋伏,早上起床就收米米!海力士再一次拿下60点涨幅!
建仓逻辑:SKHYNIX趋势强势突破,量价配合良好,市场AI存储板块情绪同步升温;但短线RSI超买,等回调就是入场机会!
想跟上米格步伐的,来聊天室找米格!不再凭感觉操作,带着建仓依据入场,让你稳健增长!
#美伊互袭油轮冲突升级 #CFTC请求驳回CME诉Kalshi比特币期货案 #加拿大对美关税正式生效
建仓逻辑:SKHYNIX趋势强势突破,量价配合良好,市场AI存储板块情绪同步升温;但短线RSI超买,等回调就是入场机会!
想跟上米格步伐的,来聊天室找米格!不再凭感觉操作,带着建仓依据入场,让你稳健增长!
#美伊互袭油轮冲突升级 #CFTC请求驳回CME诉Kalshi比特币期货案 #加拿大对美关税正式生效
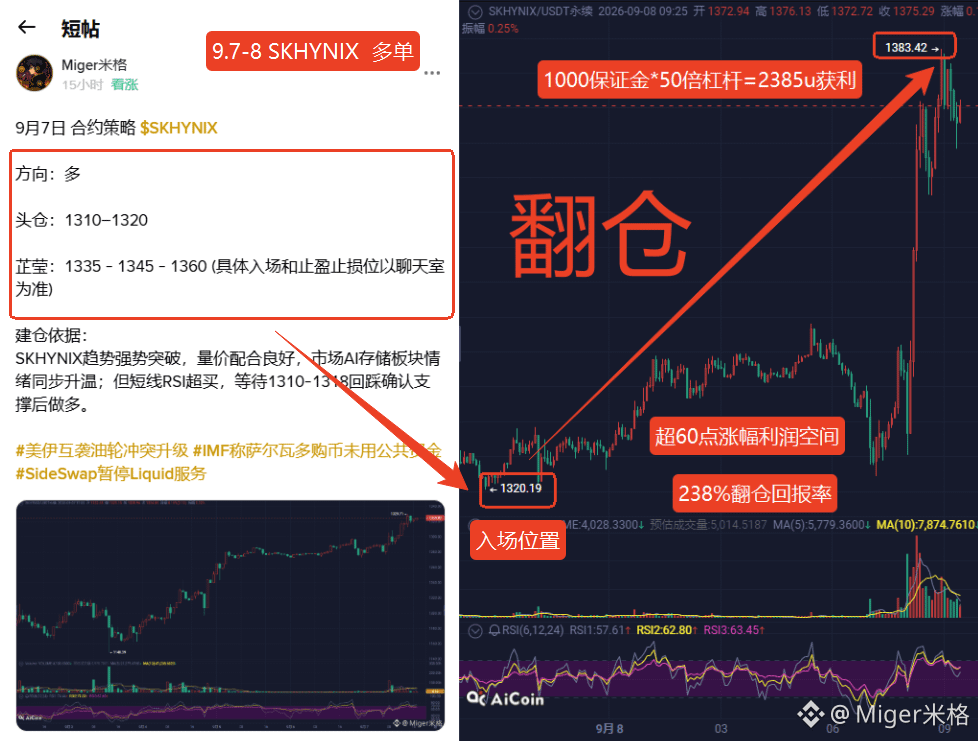
Biden's son issues a token and the whole market immediately gets scared shitless! TRUMP's horrific case is still fresh in everyone's mind
On September 8, Hunter Biden announced he would launch the Meme coin LAPTOP, scheduled to go live on Base on September 9. The moment the news broke, Bitcoin immediately dropped below $79,000, while Ethereum and SOL also slid down. MEME fell 19%, PONS dropped 9%, BONER sank 17%—everything turned bright green.
To put it plainly, I feel the market is genuinely scared of what TRUMP did. After the TRUMP coin was released on January 17 last year, Bitcoin fell from $103,000 all the way down by 25%. The TRUMP token itself dropped even more—by over 95%. Now the share of Meme coins in the altcoin market cap has already fallen to a historical low. Retail investors have long been cut and are afraid to get hurt again.
LAPTOP hasn’t even launched yet, and it already shook the broader market like this. After it goes live, who knows what will happen. In plain terms, these political celebrity coins are basically here to raise money—the team will even take 30% for themselves. My suggestion: everyone should watch more and move less. Don’t be the one left holding the bag.
If you want to catch the next updates on the market, hit follow—Migue will help you avoid traps!
#美伊互袭油轮冲突升级 #CFTC请求驳回CME诉Kalshi比特币期货案 #加拿大对美关税正式生效 $TRUMP $BTC $ETH
On September 8, Hunter Biden announced he would launch the Meme coin LAPTOP, scheduled to go live on Base on September 9. The moment the news broke, Bitcoin immediately dropped below $79,000, while Ethereum and SOL also slid down. MEME fell 19%, PONS dropped 9%, BONER sank 17%—everything turned bright green.
To put it plainly, I feel the market is genuinely scared of what TRUMP did. After the TRUMP coin was released on January 17 last year, Bitcoin fell from $103,000 all the way down by 25%. The TRUMP token itself dropped even more—by over 95%. Now the share of Meme coins in the altcoin market cap has already fallen to a historical low. Retail investors have long been cut and are afraid to get hurt again.
LAPTOP hasn’t even launched yet, and it already shook the broader market like this. After it goes live, who knows what will happen. In plain terms, these political celebrity coins are basically here to raise money—the team will even take 30% for themselves. My suggestion: everyone should watch more and move less. Don’t be the one left holding the bag.
If you want to catch the next updates on the market, hit follow—Migue will help you avoid traps!
#美伊互袭油轮冲突升级 #CFTC请求驳回CME诉Kalshi比特币期货案 #加拿大对美关税正式生效 $TRUMP $BTC $ETH
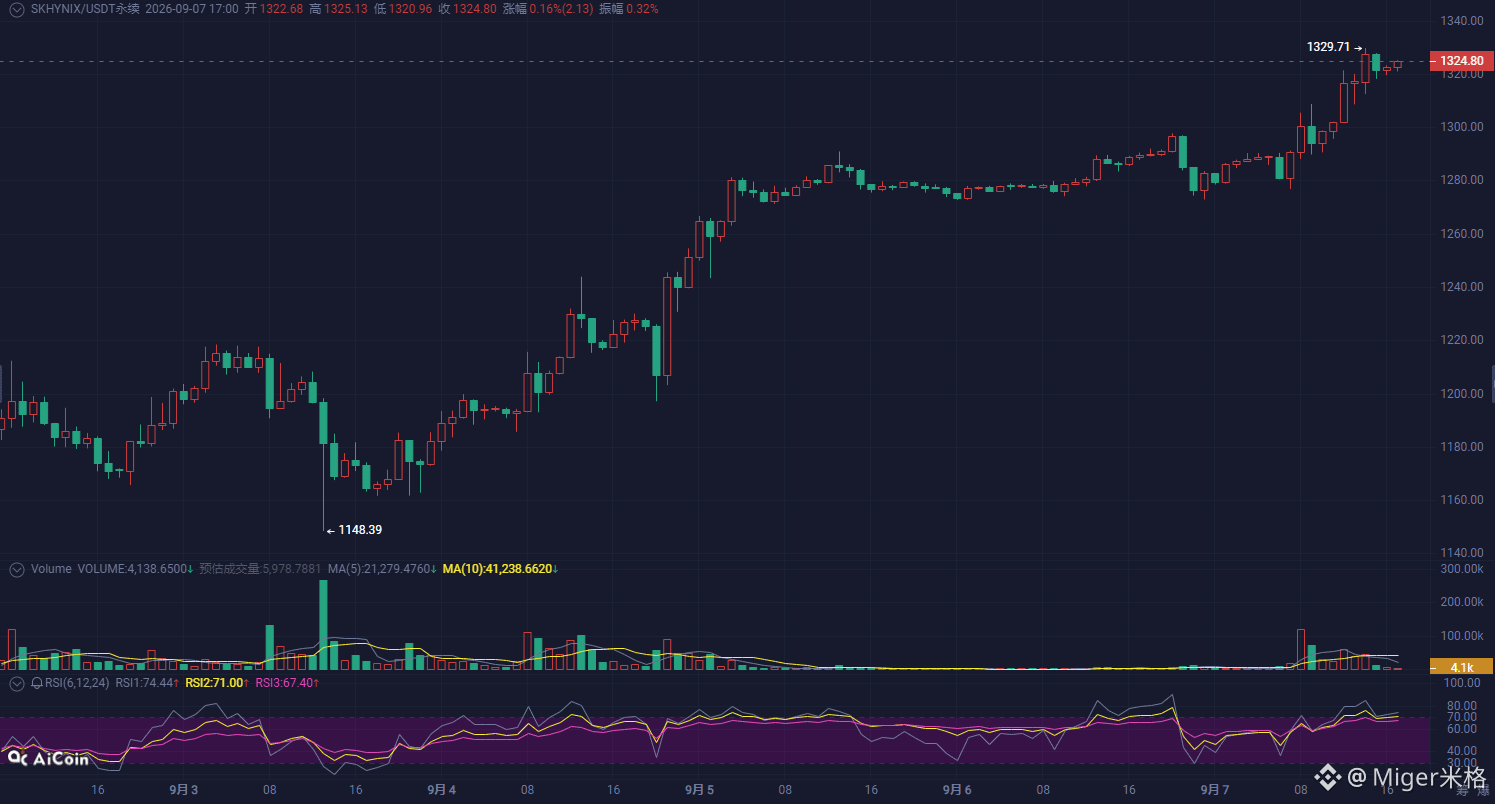
September 7 Contract Strategy $SKHYNIX
Direction: Long
Head position: 1310–1320
Ziying: 1335 - 1345 - 1360 (The specific entry and stop-loss/take-profit levels are subject to the chat room)
Rationale for opening the position:
SKHYNIX shows strong trend momentum with a breakout, with good volume-price alignment. The market sentiment for the AI memory storage sector is heating up in sync; however, the short-term RSI is overbought. Wait for a pullback to 1310-1318 to confirm support before going long.
#美伊互袭油轮冲突升级 #IMF称萨尔瓦多购币未用公共资金 #SideSwap暂停Liquid服务
Direction: Long
Head position: 1310–1320
Ziying: 1335 - 1345 - 1360 (The specific entry and stop-loss/take-profit levels are subject to the chat room)
Rationale for opening the position:
SKHYNIX shows strong trend momentum with a breakout, with good volume-price alignment. The market sentiment for the AI memory storage sector is heating up in sync; however, the short-term RSI is overbought. Wait for a pullback to 1310-1318 to confirm support before going long.
#美伊互袭油轮冲突升级 #IMF称萨尔瓦多购币未用公共资金 #SideSwap暂停Liquid服务
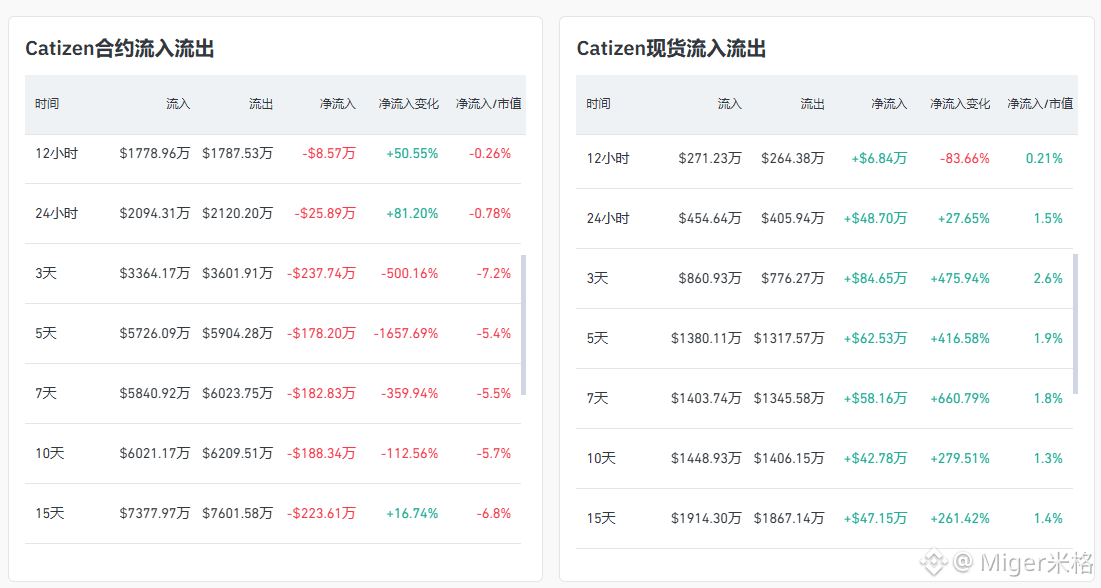
Major funds have been fleeing for days! This surge of $CATI — is it a “short-squeeze trap” or a “pump-and-dump”?
Trading advice: Lightly short around 0.065. For aggressive traders, short directly at the current price of 0.063. Target: 0.058.
On the CATI 1-hour chart, it may be above the moving averages, but the capital flow chart is crystal clear—net outflows for 8 consecutive hours. While there are small inflows on the short cycle, the long cycle is still in outflow. The liquidation chart is even more direct: the liquidation strength of shorts is only 15,000, while the liquidation strength of longs reaches 1,000,000. That means the main players are not “squeezing shorts”; they are repeatedly harvesting longs chasing higher prices.
Plus, the 24h trading volume is 350 million (350 million yuan). This kind of volume can support continuous fund outflows—an典型 pump-and-dump script.
Want to know where CATI’s next key support lies? Follow Mi Ge. We’ll break down the liquidation map in the chat room and help you dodge the main players’ chained blades.
#美伊互袭油轮冲突升级 #IMF称萨尔瓦多购币未用公共资金 #SideSwap暂停Liquid服务
Trading advice: Lightly short around 0.065. For aggressive traders, short directly at the current price of 0.063. Target: 0.058.
On the CATI 1-hour chart, it may be above the moving averages, but the capital flow chart is crystal clear—net outflows for 8 consecutive hours. While there are small inflows on the short cycle, the long cycle is still in outflow. The liquidation chart is even more direct: the liquidation strength of shorts is only 15,000, while the liquidation strength of longs reaches 1,000,000. That means the main players are not “squeezing shorts”; they are repeatedly harvesting longs chasing higher prices.
Plus, the 24h trading volume is 350 million (350 million yuan). This kind of volume can support continuous fund outflows—an典型 pump-and-dump script.
Want to know where CATI’s next key support lies? Follow Mi Ge. We’ll break down the liquidation map in the chat room and help you dodge the main players’ chained blades.
#美伊互袭油轮冲突升级 #IMF称萨尔瓦多购币未用公共资金 #SideSwap暂停Liquid服务
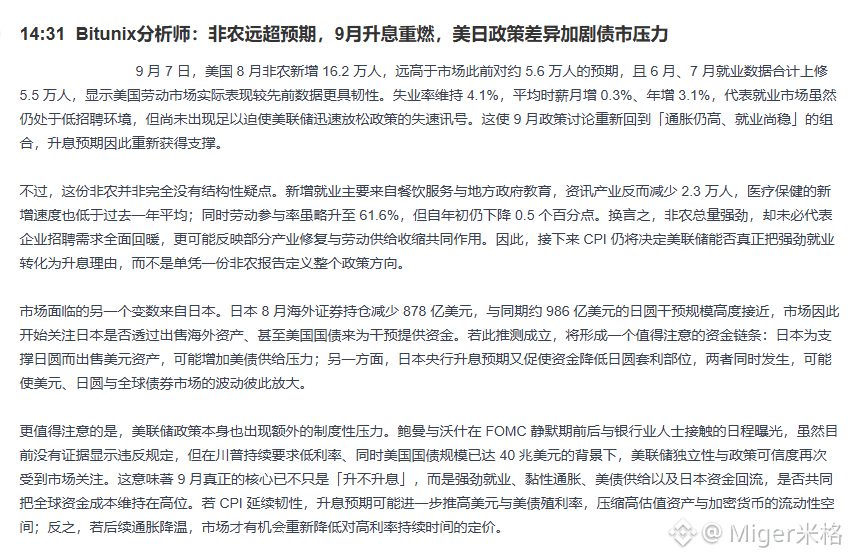
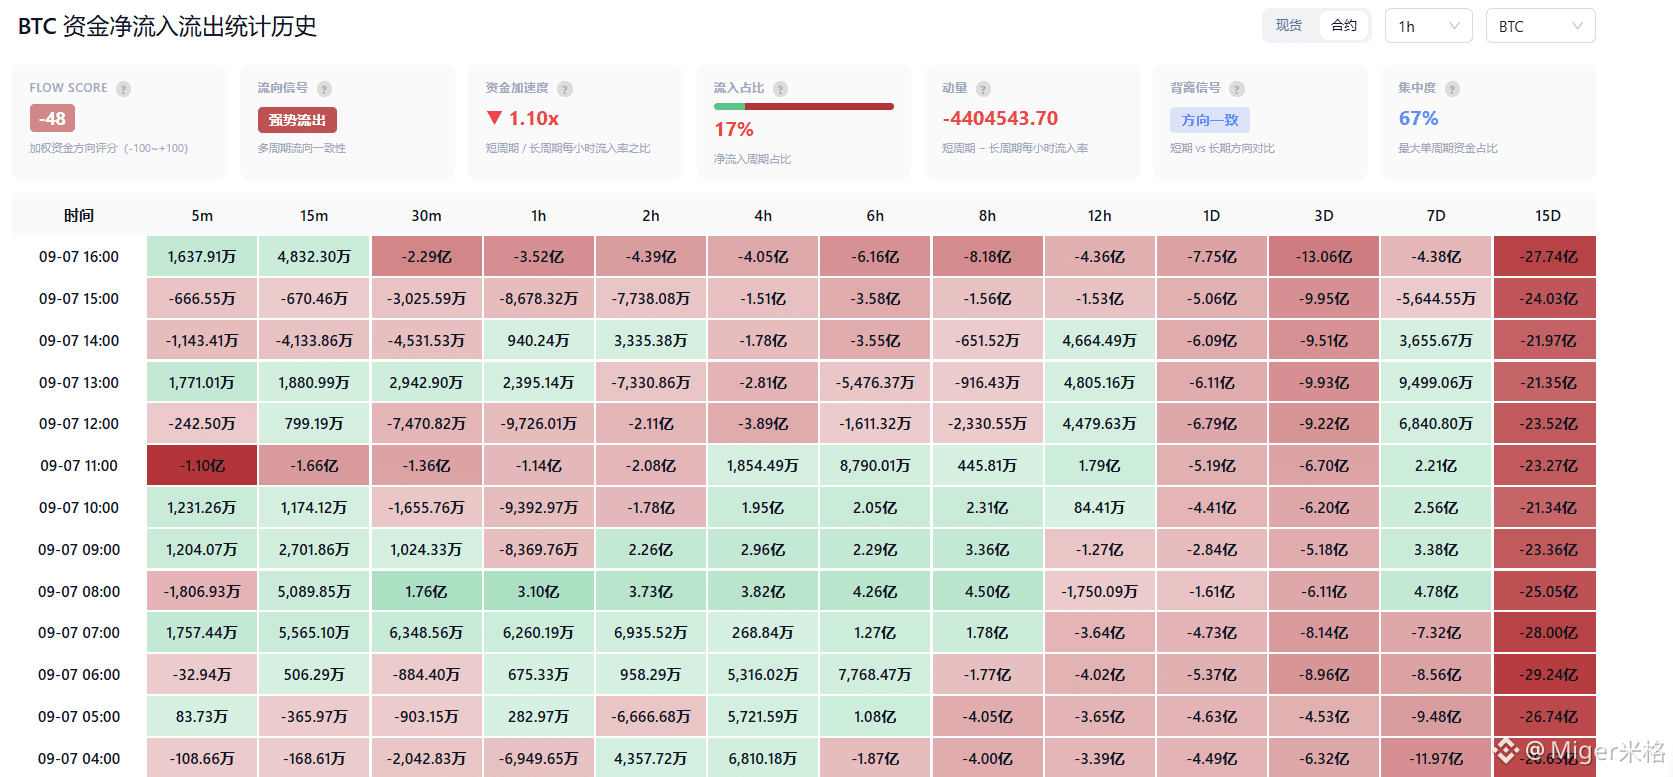
Nonfarm came in 3 times above expectations, triggering rate-hike panic! Japan sells U.S. Treasuries, quietly aiding the shorts; $BTC 7.9 hundred million (ten-thousands) is teetering on the brink—shorts target 78,000!
“While the Fed’s rate-hike blade hangs in the air, Japan quietly withdraws liquidity from U.S. Treasuries in the background—Bitcoin’s ‘safe-haven’ halo is being strangled by the global cost of capital.”
In the U.S., August Nonfarm payrolls added 162,000; the probability of a Fed rate hike in September has surged to nearly 60%.
More dangerously, Japan sold about $87.8 billion in overseas bonds during the same period. The market suspects it is selling U.S. Treasuries to intervene in the yen, creating a double squeeze on global funding costs. Bitunix warns: If CPI again exceeds expectations, the continued risk of high interest rates will completely shut the door on risk assets.
For trades:
Short on rebounds: 79,800 - 80,000 under resistance to short;
Long on pullbacks: 78,200 - 78,500 as it stabilizes—light position.
Personal view: The prior CPI range of 78,500 - 80,500 is choppy and bearish overall. Avoid heavy positioning with trend-following orders before the data is confirmed. For the short term, focus mainly on going short at higher levels; if it breaks below 78,000, selling will accelerate.
#美伊互袭油轮冲突升级 #SideSwap暂停Liquid服务 #俄乌交火库什纳维特科夫赴基辅
“While the Fed’s rate-hike blade hangs in the air, Japan quietly withdraws liquidity from U.S. Treasuries in the background—Bitcoin’s ‘safe-haven’ halo is being strangled by the global cost of capital.”
In the U.S., August Nonfarm payrolls added 162,000; the probability of a Fed rate hike in September has surged to nearly 60%.
More dangerously, Japan sold about $87.8 billion in overseas bonds during the same period. The market suspects it is selling U.S. Treasuries to intervene in the yen, creating a double squeeze on global funding costs. Bitunix warns: If CPI again exceeds expectations, the continued risk of high interest rates will completely shut the door on risk assets.
For trades:
Short on rebounds: 79,800 - 80,000 under resistance to short;
Long on pullbacks: 78,200 - 78,500 as it stabilizes—light position.
Personal view: The prior CPI range of 78,500 - 80,500 is choppy and bearish overall. Avoid heavy positioning with trend-following orders before the data is confirmed. For the short term, focus mainly on going short at higher levels; if it breaks below 78,000, selling will accelerate.
#美伊互袭油轮冲突升级 #SideSwap暂停Liquid服务 #俄乌交火库什纳维特科夫赴基辅
Log in to explore more content