
Metalheadxvv
5.8k Posts

Metalheadxvv
Report
Block User
What is cryptocurrency? freedom or trading or government?
Frequent Trader
4.7 Years
6 Following
2.6K+ Followers
5.0K+ Liked
Posts
All
Quotes
·
--

Article
How Professional Traders Size Positions — The Exact Math📈📉
89% of futures traders are liquidated in their first month. Here is what the 11% do differently. When I first started, I treated my $5,400 capital like a lottery ticket, entering full-size positions on $ETH and getting wiped out by a single wick. I realized that gambling on a "perfect entry" is the fastest way to zero. Real pros don't hunt the bottom; we build a foundation. If I am looking to go long on $ETH, I don't click buy once. I divide my total intended position into three equal tranches. I enter the first at my primary technical level, the second if the price dips 1.5% against me to confirm support, and the third only if the momentum clearly shifts back in my favor. This "scaling in" method keeps my average entry...
How Professional Traders Size Positions — The Exact Math
📈📉
89% of futures traders are liquidated in their first month. Here is what the 11% do differently. When I first started, I treated my $5,400 capital like a lottery ticket, entering full-size positions on $ETH and getting wiped out by a single wick. I realized that gambling on a "perfect entry" is the fastest way to zero. Real pros don't hunt the bottom; we build a foundation. If I am looking to go long on $ETH , I don't click buy once. I divide my total intended position into three equal tranches. I enter the first at my primary technical level, the second if the price dips 1.5% against me to confirm support, and the third only if the momentum clearly shifts back in my favor. This "scaling in" method keeps my average entry...
89% of futures traders are liquidated in their first month. Here is what the 11% do differently. When I first started, I treated my $5,400 capital like a lottery ticket, entering full-size positions on $ETH and getting wiped out by a single wick. I realized that gambling on a "perfect entry" is the fastest way to zero. Real pros don't hunt the bottom; we build a foundation. If I am looking to go long on $ETH , I don't click buy once. I divide my total intended position into three equal tranches. I enter the first at my primary technical level, the second if the price dips 1.5% against me to confirm support, and the third only if the momentum clearly shifts back in my favor. This "scaling in" method keeps my average entry...
·
--
Article
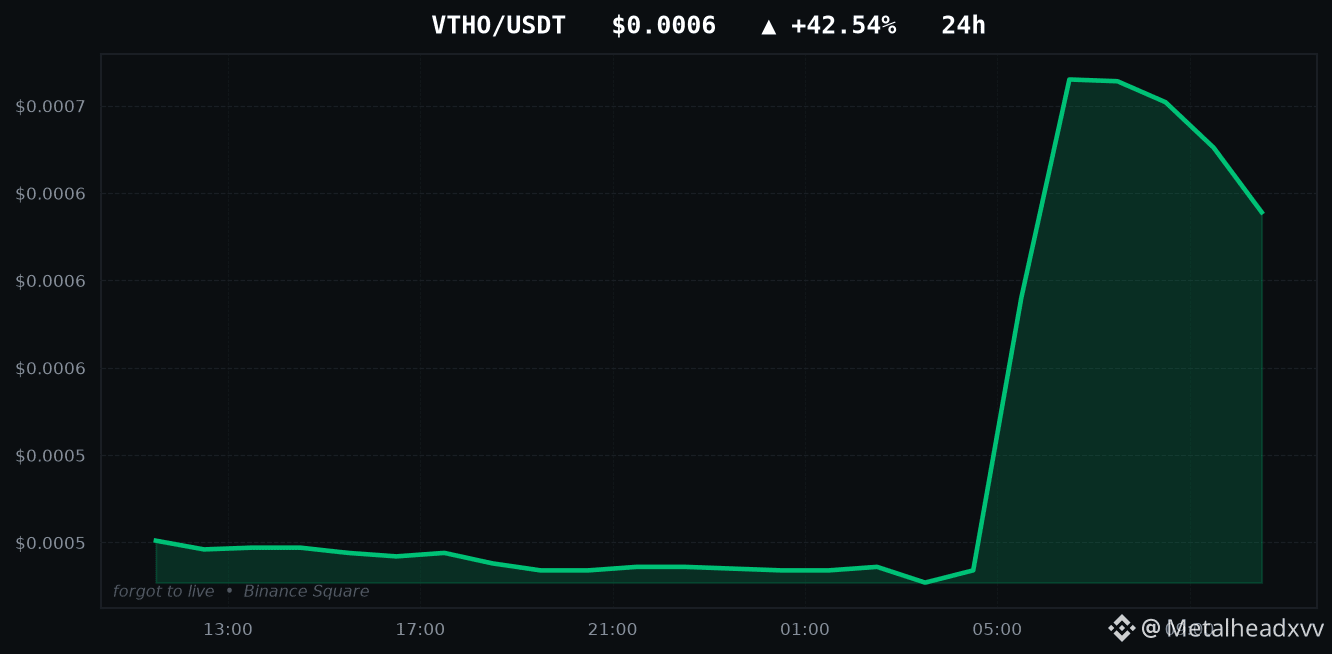
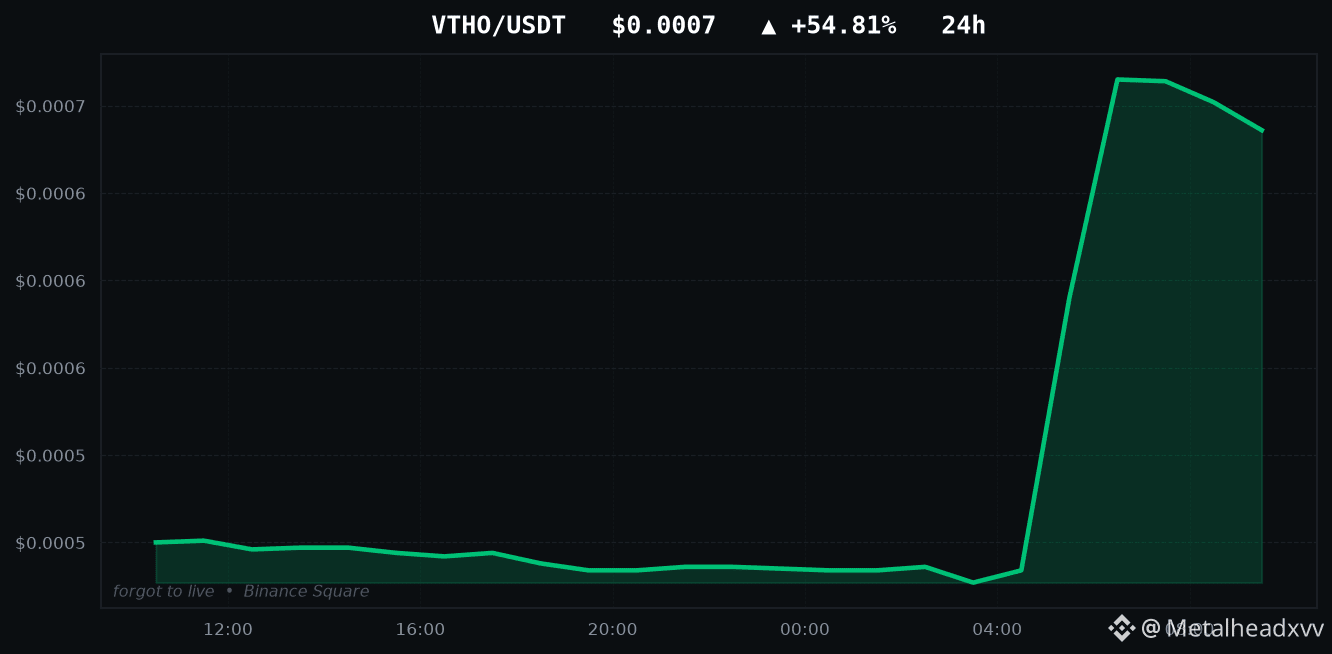
Why $ETH and $OP Are Setting Up for a Violent Reversal🚀 $ETH at $2,350. The market is currently obsessed with chasing 40% pumps like VTHO, but 92% of the retail liquidity I see today is heading straight into a value trap. I spent two years digging out of a $5,400 hole because I chased exactly this kind of noise instead of focusing on structural leaders. While everyone stares at the high-percentage gainers, the real institutional money is quietly preparing to rotate back into $ETH and $OP. Markets don't move in a straight line, and the disconnect between these trending micro-caps and the base layer is a screaming signal that a volatility expansion is imminent. I’m not saying we’ve hit the bottom, but the risk-to-reward on a structural play here is the only trade worth taking when the rest of the market is gambling on volatility.
COIN & PRICE
$ETH/USDT is currently trading at $2,350.
SETUP TYPE
This is a mean reversion breakout trade, targeting a liquidity sweep of the recent range highs before a potential retest of the daily support.
ENTRY ZONE
I am looking to enter between $2,320 and $2,345. This zone aligns with the previous consolidation shelf on the 4-hour chart, providing a high-volume base to anchor the trade.
STOP LOSS
My hard stop is placed at $2,240. If we lose this level, the thesis that we are finding local support is dead, and the structure flips to bearish momentum.
TARGETS
Target 1 is set at $2,480, where I will take 50% profit to secure the trade. Target 2 is set at $2,620, which is the overhead resistance cluster where I expect significant selling pressure to return.
RISK/REWARD
This setup offers a 1:2.8 risk-to-reward ratio. It is not perfect, and I acknowledge that $OP remains highly sensitive to broader market sentiment, which is why I...
Why $ETH and $OP Are Setting Up for a Violent Reversal
🚀 $ETH at $2,350. The market is currently obsessed with chasing 40% pumps like VTHO, but 92% of the retail liquidity I see today is heading straight into a value trap. I spent two years digging out of a $5,400 hole because I chased exactly this kind of noise instead of focusing on structural leaders. While everyone stares at the high-percentage gainers, the real institutional money is quietly preparing to rotate back into $ETH and $OP . Markets don't move in a straight line, and the disconnect between these trending micro-caps and the base layer is a screaming signal that a volatility expansion is imminent. I’m not saying we’ve hit the bottom, but the risk-to-reward on a structural play here is the only trade worth taking when the rest of the market is gambling on volatility.
COIN & PRICE
$ETH /USDT is currently trading at $2,350.
SETUP TYPE
This is a mean reversion breakout trade, targeting a liquidity sweep of the recent range highs before a potential retest of the daily support.
ENTRY ZONE
I am looking to enter between $2,320 and $2,345. This zone aligns with the previous consolidation shelf on the 4-hour chart, providing a high-volume base to anchor the trade.
STOP LOSS
My hard stop is placed at $2,240. If we lose this level, the thesis that we are finding local support is dead, and the structure flips to bearish momentum.
TARGETS
Target 1 is set at $2,480, where I will take 50% profit to secure the trade. Target 2 is set at $2,620, which is the overhead resistance cluster where I expect significant selling pressure to return.
RISK/REWARD
This setup offers a 1:2.8 risk-to-reward ratio. It is not perfect, and I acknowledge that $OP remains highly sensitive to broader market sentiment, which is why I...
COIN & PRICE
$ETH /USDT is currently trading at $2,350.
SETUP TYPE
This is a mean reversion breakout trade, targeting a liquidity sweep of the recent range highs before a potential retest of the daily support.
ENTRY ZONE
I am looking to enter between $2,320 and $2,345. This zone aligns with the previous consolidation shelf on the 4-hour chart, providing a high-volume base to anchor the trade.
STOP LOSS
My hard stop is placed at $2,240. If we lose this level, the thesis that we are finding local support is dead, and the structure flips to bearish momentum.
TARGETS
Target 1 is set at $2,480, where I will take 50% profit to secure the trade. Target 2 is set at $2,620, which is the overhead resistance cluster where I expect significant selling pressure to return.
RISK/REWARD
This setup offers a 1:2.8 risk-to-reward ratio. It is not perfect, and I acknowledge that $OP remains highly sensitive to broader market sentiment, which is why I...
19
·
--

Article
Bitcoin Dips Below $78.5K as Macro Headwinds Intensify, Altcoins Offer Targeted PlaysBitcoin ($BTC) is trading at $78,459.5900, marking a -1.11% decline over the past 24 hours, hitting a low of $77,770.0000. This is the fourth consecutive day of a downturn, testing crucial support levels as the global crypto market capitalization saw a modest 0.9% dip to $2.76 trillion. The current slide is not isolated, reflecting a broader market pullback fueled by macro risk aversion, escalating geopolitical tensions pushing Brent crude past $100, renewed inflation fears impacting the Fed's rate outlook, and sustained high U.S. Treasury yields. Despite this, on-chain data shows Bitcoin's sell-side risk at a one-month low, with long-term holders slowing profit-taking, though aggressive exchange selling still outpaces buying. A glimmer of institutional confidence emerged with a Paris-listed firm, Capital B, acquiring 376 BTC valued at $29.4 million on September 7th, hinting at underlying demand beneath the surface volatility.
The market's reaction to Bitcoin's slide has seen broad-based losses across altcoins, with many seeing sharper declines than BTC itself. However, for traders focused on fundamentals, not every altcoin narrative is playing out the same. Take $SOL, which saw significant news today as its crucial Transaction V1 mainnet activation was officially delayed to September 15th, allowing for more ecosystem testing and integration. While an upgrade delay might sound bearish, the longer-term picture for Solana was significantly de-risked recently when a judge dismissed a class-action lawsuit against Solana Labs and its executives concerning alleged wrongdoing linked to Pump.fun. This development removes a major overhang, suggesting that despite general market weakness, fundamental risks for $SOL are reducing, positioning it for potential strength once broader sentiment recovers.
Meanwhile, $NEAR Protocol is actively navigating the current environment with...
Bitcoin Dips Below $78.5K as Macro Headwinds Intensify, Altcoins Offer Targeted Plays
Bitcoin ($BTC ) is trading at $78,459.5900, marking a -1.11% decline over the past 24 hours, hitting a low of $77,770.0000. This is the fourth consecutive day of a downturn, testing crucial support levels as the global crypto market capitalization saw a modest 0.9% dip to $2.76 trillion. The current slide is not isolated, reflecting a broader market pullback fueled by macro risk aversion, escalating geopolitical tensions pushing Brent crude past $100, renewed inflation fears impacting the Fed's rate outlook, and sustained high U.S. Treasury yields. Despite this, on-chain data shows Bitcoin's sell-side risk at a one-month low, with long-term holders slowing profit-taking, though aggressive exchange selling still outpaces buying. A glimmer of institutional confidence emerged with a Paris-listed firm, Capital B, acquiring 376 BTC valued at $29.4 million on September 7th, hinting at underlying demand beneath the surface volatility.
The market's reaction to Bitcoin's slide has seen broad-based losses across altcoins, with many seeing sharper declines than BTC itself. However, for traders focused on fundamentals, not every altcoin narrative is playing out the same. Take $SOL , which saw significant news today as its crucial Transaction V1 mainnet activation was officially delayed to September 15th, allowing for more ecosystem testing and integration. While an upgrade delay might sound bearish, the longer-term picture for Solana was significantly de-risked recently when a judge dismissed a class-action lawsuit against Solana Labs and its executives concerning alleged wrongdoing linked to Pump.fun. This development removes a major overhang, suggesting that despite general market weakness, fundamental risks for $SOL are reducing, positioning it for potential strength once broader sentiment recovers.
Meanwhile, $NEAR Protocol is actively navigating the current environment with...
The market's reaction to Bitcoin's slide has seen broad-based losses across altcoins, with many seeing sharper declines than BTC itself. However, for traders focused on fundamentals, not every altcoin narrative is playing out the same. Take $SOL , which saw significant news today as its crucial Transaction V1 mainnet activation was officially delayed to September 15th, allowing for more ecosystem testing and integration. While an upgrade delay might sound bearish, the longer-term picture for Solana was significantly de-risked recently when a judge dismissed a class-action lawsuit against Solana Labs and its executives concerning alleged wrongdoing linked to Pump.fun. This development removes a major overhang, suggesting that despite general market weakness, fundamental risks for $SOL are reducing, positioning it for potential strength once broader sentiment recovers.
Meanwhile, $NEAR Protocol is actively navigating the current environment with...
1
·
--
Article
The Math That Prevents You From Getting Wiped Out Forever📈📉
89% of futures traders are liquidated in their first month. Here is what the 11% do differently. When I lost my initial $5,400, I didn't lose it to market manipulation or bad luck; I lost it because I treated leverage like a turbo button rather than a risk multiplier. You are not a trader until you know the exact price where your position vanishes. The formula is Liquidation Price = Entry Price * (1 - (1 / Leverage) + (Maintenance Margin Rate / Leverage)). For simplicity, let’s assume a 0.5% maintenance margin requirement.
Imagine you have a $1,000 account and decide to go long on $SOL at $60,000 equivalent market exposure. If you use 10x leverage, your liquidation price sits roughly 9.5% away from your entry, landing...
The Math That Prevents You From Getting Wiped Out Forever
📈📉
89% of futures traders are liquidated in their first month. Here is what the 11% do differently. When I lost my initial $5,400, I didn't lose it to market manipulation or bad luck; I lost it because I treated leverage like a turbo button rather than a risk multiplier. You are not a trader until you know the exact price where your position vanishes. The formula is Liquidation Price = Entry Price * (1 - (1 / Leverage) + (Maintenance Margin Rate / Leverage)). For simplicity, let’s assume a 0.5% maintenance margin requirement.
Imagine you have a $1,000 account and decide to go long on $SOL at $60,000 equivalent market exposure. If you use 10x leverage, your liquidation price sits roughly 9.5% away from your entry, landing...
89% of futures traders are liquidated in their first month. Here is what the 11% do differently. When I lost my initial $5,400, I didn't lose it to market manipulation or bad luck; I lost it because I treated leverage like a turbo button rather than a risk multiplier. You are not a trader until you know the exact price where your position vanishes. The formula is Liquidation Price = Entry Price * (1 - (1 / Leverage) + (Maintenance Margin Rate / Leverage)). For simplicity, let’s assume a 0.5% maintenance margin requirement.
Imagine you have a $1,000 account and decide to go long on $SOL at $60,000 equivalent market exposure. If you use 10x leverage, your liquidation price sits roughly 9.5% away from your entry, landing...
5
·
--
Article
$RAY is catching the wave, but $SOL and $NEAR hold the keys🚀 $RAY $1.3615 (+10.78%)
It is statistically improbable that $RAY sustains this 10% pump without a corresponding, sustained breakout in $SOL, yet 90% of the retail crowd currently chasing this candle is ignoring the Layer-1 foundation entirely.
THE CATALYST: The move in $RAY is purely reflexive, driven by a localized liquidity injection into the Solana ecosystem as developers and liquidity providers rotate capital back into decentralized exchanges. We are seeing a classic "ecosystem beta" play where traders use smaller, more volatile assets to capture leverage on the underlying move of the main chain.
THE NARRATIVE: The market is telling itself that we are entering a new cycle of hyper-growth for Solana-based protocols. The narrative is fueled by the hope that if $SOL breaks through its local resistance, everything downstream will follow suit. However, this relies on the assumption that retail interest is actually returning to the ecosystem rather than just rotating within the same pool of stagnant liquidity.
THE CONTEXT: This is a textbook continuation pattern following a consolidation base near the $1.20 support level. The volume at $29.1M indicates genuine interest rather than a low-liquidity flash spike, but we are approaching the $1.47 range high, which acts as a massive psychological ceiling for the bulls.
THE RISK: The primary danger isn't the token itself; it’s the lack of conviction from $NEAR. If $NEAR starts to show weakness or breaks its own structural support, the entire "alt-season" narrative will likely collapse, and $RAY will be the first to dump as leverage unwinds. You have to watch the big caps; if $SOL fails to hold its current floor, the move here is nothing more than a...
$RAY is catching the wave, but $SOL and $NEAR hold the keys
🚀 $RAY $1.3615 (+10.78%)
It is statistically improbable that $RAY sustains this 10% pump without a corresponding, sustained breakout in $SOL , yet 90% of the retail crowd currently chasing this candle is ignoring the Layer-1 foundation entirely.
THE CATALYST: The move in $RAY is purely reflexive, driven by a localized liquidity injection into the Solana ecosystem as developers and liquidity providers rotate capital back into decentralized exchanges. We are seeing a classic "ecosystem beta" play where traders use smaller, more volatile assets to capture leverage on the underlying move of the main chain.
THE NARRATIVE: The market is telling itself that we are entering a new cycle of hyper-growth for Solana-based protocols. The narrative is fueled by the hope that if $SOL breaks through its local resistance, everything downstream will follow suit. However, this relies on the assumption that retail interest is actually returning to the ecosystem rather than just rotating within the same pool of stagnant liquidity.
THE CONTEXT: This is a textbook continuation pattern following a consolidation base near the $1.20 support level. The volume at $29.1M indicates genuine interest rather than a low-liquidity flash spike, but we are approaching the $1.47 range high, which acts as a massive psychological ceiling for the bulls.
THE RISK: The primary danger isn't the token itself; it’s the lack of conviction from $NEAR . If $NEAR starts to show weakness or breaks its own structural support, the entire "alt-season" narrative will likely collapse, and $RAY will be the first to dump as leverage unwinds. You have to watch the big caps; if $SOL fails to hold its current floor, the move here is nothing more than a...
It is statistically improbable that $RAY sustains this 10% pump without a corresponding, sustained breakout in $SOL , yet 90% of the retail crowd currently chasing this candle is ignoring the Layer-1 foundation entirely.
THE CATALYST: The move in $RAY is purely reflexive, driven by a localized liquidity injection into the Solana ecosystem as developers and liquidity providers rotate capital back into decentralized exchanges. We are seeing a classic "ecosystem beta" play where traders use smaller, more volatile assets to capture leverage on the underlying move of the main chain.
THE NARRATIVE: The market is telling itself that we are entering a new cycle of hyper-growth for Solana-based protocols. The narrative is fueled by the hope that if $SOL breaks through its local resistance, everything downstream will follow suit. However, this relies on the assumption that retail interest is actually returning to the ecosystem rather than just rotating within the same pool of stagnant liquidity.
THE CONTEXT: This is a textbook continuation pattern following a consolidation base near the $1.20 support level. The volume at $29.1M indicates genuine interest rather than a low-liquidity flash spike, but we are approaching the $1.47 range high, which acts as a massive psychological ceiling for the bulls.
THE RISK: The primary danger isn't the token itself; it’s the lack of conviction from $NEAR . If $NEAR starts to show weakness or breaks its own structural support, the entire "alt-season" narrative will likely collapse, and $RAY will be the first to dump as leverage unwinds. You have to watch the big caps; if $SOL fails to hold its current floor, the move here is nothing more than a...
29
·
--
First week with real discipline: 4 trades, 3 wins, 1 controlled loss. This is what that looks like.
My bedroom was freezing. No adrenaline, no heart racing, just a notebook and a sub-account. Two years prior, $DOGE liquidations at 50x felt like a casino. Now? It felt like accounting. I missed the moonshots, but I didn't wake up broke. That first month wasn't about riches; it was about proving I could stop the bleeding. My ego wanted a 100% gain; my brain took a 2% profit.
What’s the one trade you regret because you didn't have a plan?
#crypto #trading #riskmanagement #discipline #daytrading
First week with real discipline: 4 trades, 3 wins, 1 controlled loss. This is what that looks like.
My bedroom was freezing. No adrenaline, no heart racing, just a notebook and a sub-account. Two years prior, $DOGE liquidations at 50x felt like a casino. Now? It felt like accounting. I missed the moonshots, but I didn't wake up broke. That first month wasn't about riches; it was about proving I could stop the bleeding. My ego wanted a 100% gain; my brain took a 2% profit.
What’s the one trade you regret because you didn't have a plan?
#crypto #trading #riskmanagement #discipline #daytrading
My bedroom was freezing. No adrenaline, no heart racing, just a notebook and a sub-account. Two years prior, $DOGE liquidations at 50x felt like a casino. Now? It felt like accounting. I missed the moonshots, but I didn't wake up broke. That first month wasn't about riches; it was about proving I could stop the bleeding. My ego wanted a 100% gain; my brain took a 2% profit.
What’s the one trade you regret because you didn't have a plan?
#crypto #trading #riskmanagement #discipline #daytrading
10
·
--

Article
NFPrompt ($NFP) Death Spiral: 65.85% Drop Proves Delisting KillsToday, NFPrompt, or $NFP, plunged by a staggering 65.85% to just $0.0018. This dramatic single-day capitulation isn't a sudden shock but the bitter end of a long, painful fall for a project that once debuted at $1.17 in December 2023, now down over 99% from its all-time high. The immediate catalyst for this final flush of selling pressure was the hard deadline yesterday, September 9, 2026, for all remaining NFP withdrawals from Binance, formally sealing its delisting which began back on July 10, 2026. Binance cited "falling user activity and a lack of token utility" for the delisting, a stark reminder that exchange listings are not a business model.
Looking for dead cat signals in NFP’s chart is like sifting through ashes for gold. While the price might technically bounce on smaller, illiquid exchanges where it now trades, any such movement would be pure speculative noise, not a genuine sign of recovery. The token’s Relative Strength Index (RSI) sitting around a neutral 38.17 as of yesterday means nothing when the fundamentals are nonexistent. This isn't a temporary dip; it's a project bleeding out due to a lack of substance, leaving it highly vulnerable to wild price distortions from even small orders.
A real reversal for NFP would demand a complete overhaul: a reworked product with measurable usage and new, credible exchange listings, for which there is currently no evidence. We see how established assets like $BTC can weather significant macro news, even a strong US Non-Farm Payrolls report like we had last week, which initially cooled broader market sentiment for risk assets. Bitcoin’s resilience comes from its proven network and utility. NFP, however, faces project-specific existential threats; no shifting macro winds will save it.
This is the ultimate trap that catches countless retail traders, myself included, in my early, costly days when I lost $5,400....
NFPrompt ($NFP) Death Spiral: 65.85% Drop Proves Delisting Kills
Today, NFPrompt, or $NFP, plunged by a staggering 65.85% to just $0.0018. This dramatic single-day capitulation isn't a sudden shock but the bitter end of a long, painful fall for a project that once debuted at $1.17 in December 2023, now down over 99% from its all-time high. The immediate catalyst for this final flush of selling pressure was the hard deadline yesterday, September 9, 2026, for all remaining NFP withdrawals from Binance, formally sealing its delisting which began back on July 10, 2026. Binance cited "falling user activity and a lack of token utility" for the delisting, a stark reminder that exchange listings are not a business model.
Looking for dead cat signals in NFP’s chart is like sifting through ashes for gold. While the price might technically bounce on smaller, illiquid exchanges where it now trades, any such movement would be pure speculative noise, not a genuine sign of recovery. The token’s Relative Strength Index (RSI) sitting around a neutral 38.17 as of yesterday means nothing when the fundamentals are nonexistent. This isn't a temporary dip; it's a project bleeding out due to a lack of substance, leaving it highly vulnerable to wild price distortions from even small orders.
A real reversal for NFP would demand a complete overhaul: a reworked product with measurable usage and new, credible exchange listings, for which there is currently no evidence. We see how established assets like $BTC can weather significant macro news, even a strong US Non-Farm Payrolls report like we had last week, which initially cooled broader market sentiment for risk assets. Bitcoin’s resilience comes from its proven network and utility. NFP, however, faces project-specific existential threats; no shifting macro winds will save it.
This is the ultimate trap that catches countless retail traders, myself included, in my early, costly days when I lost $5,400....
Looking for dead cat signals in NFP’s chart is like sifting through ashes for gold. While the price might technically bounce on smaller, illiquid exchanges where it now trades, any such movement would be pure speculative noise, not a genuine sign of recovery. The token’s Relative Strength Index (RSI) sitting around a neutral 38.17 as of yesterday means nothing when the fundamentals are nonexistent. This isn't a temporary dip; it's a project bleeding out due to a lack of substance, leaving it highly vulnerable to wild price distortions from even small orders.
A real reversal for NFP would demand a complete overhaul: a reworked product with measurable usage and new, credible exchange listings, for which there is currently no evidence. We see how established assets like $BTC can weather significant macro news, even a strong US Non-Farm Payrolls report like we had last week, which initially cooled broader market sentiment for risk assets. Bitcoin’s resilience comes from its proven network and utility. NFP, however, faces project-specific existential threats; no shifting macro winds will save it.
This is the ultimate trap that catches countless retail traders, myself included, in my early, costly days when I lost $5,400....
4
·
--
Article
Why Price Action Lies Without Open Interest Data📊📈
89% of futures traders are liquidated in their first month because they trade price in a vacuum. Back when I lost my first $5,400, I was staring at $BTC candles like they were tea leaves, ignoring the massive engine underneath the hood: Open Interest. Open Interest (OI) represents the total number of outstanding derivative contracts that haven't been settled. When OI rises, new money is flowing into the market, suggesting a strengthening trend. When it falls, money is exiting, usually signaling a trend exhaustion or a massive flush.
To read the market, you must combine OI with price action. If $BTC price is pushing up while OI is rising, the trend is supported by fresh capital and likely has legs. However, if $BTC is climbing...
Why Price Action Lies Without Open Interest Data
📊📈
89% of futures traders are liquidated in their first month because they trade price in a vacuum. Back when I lost my first $5,400, I was staring at $BTC candles like they were tea leaves, ignoring the massive engine underneath the hood: Open Interest. Open Interest (OI) represents the total number of outstanding derivative contracts that haven't been settled. When OI rises, new money is flowing into the market, suggesting a strengthening trend. When it falls, money is exiting, usually signaling a trend exhaustion or a massive flush.
To read the market, you must combine OI with price action. If $BTC price is pushing up while OI is rising, the trend is supported by fresh capital and likely has legs. However, if $BTC is climbing...
89% of futures traders are liquidated in their first month because they trade price in a vacuum. Back when I lost my first $5,400, I was staring at $BTC candles like they were tea leaves, ignoring the massive engine underneath the hood: Open Interest. Open Interest (OI) represents the total number of outstanding derivative contracts that haven't been settled. When OI rises, new money is flowing into the market, suggesting a strengthening trend. When it falls, money is exiting, usually signaling a trend exhaustion or a massive flush.
To read the market, you must combine OI with price action. If $BTC price is pushing up while OI is rising, the trend is supported by fresh capital and likely has legs. However, if $BTC is climbing...
7
·
--
Article
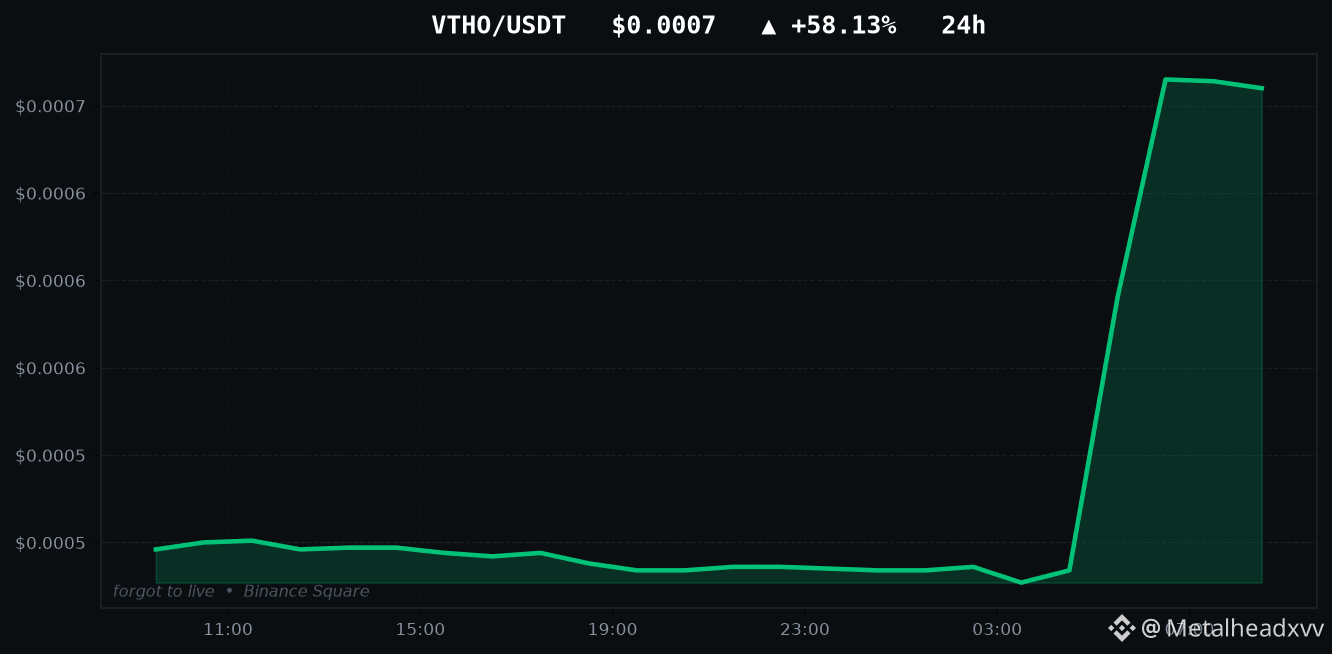
IOST is surging 47% but $BTC and $FET dictate the exit📈 $IOST $0.0013. Most retail traders see a 47.88% gain and immediately open a long, but 92% of these parabolic pumps end in a liquidity grab that wipes out the late arrivals. Looking at the data, $IOST is currently the king of the volume list with $54.7M in flow, but I’ve been here before. Two years ago, losing $5,400 taught me that following a green candle is a fast way to go broke. Today, I’m watching $BTC and $FET more than I’m watching this pump because, regardless of individual altcoin performance, the market tide is set by the giants. If $BTC loses its footing, every altcoin on this list will bleed, no matter how strong the daily chart looks.
TREND: The coin is currently in a fierce short-term uptrend, characterized by extreme volatility and an aggressive push away from its daily low of $0.0008. While the momentum is undeniably bullish on the lower timeframes, it is approaching a critical exhaustion point.
KEY LEVELS: The primary resistance levels to monitor are $0.0024, which served as the daily high, and $0.0028, a psychological barrier where massive sell-side pressure likely waits. On the downside, immediate support sits at $0.0011, with a secondary, much more vital floor at $0.0008, where the initial move started.
VOLUME: Volume is absolutely explosive at $54,788,034, which confirms heavy institutional or whale participation. However, high volume at a daily peak often signals the "climax" phase where smart money begins offloading their bags to retail FOMO buyers.
INDICATORS: The RSI is currently deep in overbought territory, flashing red warnings that a cooling-off period is mandatory. The moving averages are lagging behind the price action significantly, indicating that this move is pure...
IOST is surging 47% but $BTC and $FET dictate the exit
📈 $IOST $0.0013. Most retail traders see a 47.88% gain and immediately open a long, but 92% of these parabolic pumps end in a liquidity grab that wipes out the late arrivals. Looking at the data, $IOST is currently the king of the volume list with $54.7M in flow, but I’ve been here before. Two years ago, losing $5,400 taught me that following a green candle is a fast way to go broke. Today, I’m watching $BTC and $FET more than I’m watching this pump because, regardless of individual altcoin performance, the market tide is set by the giants. If $BTC loses its footing, every altcoin on this list will bleed, no matter how strong the daily chart looks.
TREND: The coin is currently in a fierce short-term uptrend, characterized by extreme volatility and an aggressive push away from its daily low of $0.0008. While the momentum is undeniably bullish on the lower timeframes, it is approaching a critical exhaustion point.
KEY LEVELS: The primary resistance levels to monitor are $0.0024, which served as the daily high, and $0.0028, a psychological barrier where massive sell-side pressure likely waits. On the downside, immediate support sits at $0.0011, with a secondary, much more vital floor at $0.0008, where the initial move started.
VOLUME: Volume is absolutely explosive at $54,788,034, which confirms heavy institutional or whale participation. However, high volume at a daily peak often signals the "climax" phase where smart money begins offloading their bags to retail FOMO buyers.
INDICATORS: The RSI is currently deep in overbought territory, flashing red warnings that a cooling-off period is mandatory. The moving averages are lagging behind the price action significantly, indicating that this move is pure...
TREND: The coin is currently in a fierce short-term uptrend, characterized by extreme volatility and an aggressive push away from its daily low of $0.0008. While the momentum is undeniably bullish on the lower timeframes, it is approaching a critical exhaustion point.
KEY LEVELS: The primary resistance levels to monitor are $0.0024, which served as the daily high, and $0.0028, a psychological barrier where massive sell-side pressure likely waits. On the downside, immediate support sits at $0.0011, with a secondary, much more vital floor at $0.0008, where the initial move started.
VOLUME: Volume is absolutely explosive at $54,788,034, which confirms heavy institutional or whale participation. However, high volume at a daily peak often signals the "climax" phase where smart money begins offloading their bags to retail FOMO buyers.
INDICATORS: The RSI is currently deep in overbought territory, flashing red warnings that a cooling-off period is mandatory. The moving averages are lagging behind the price action significantly, indicating that this move is pure...
214
·
--

Article
The Survivorship Bias Trap: Why Your Feed Is Lying To You3am. Red portfolio. Liquidated. One tab open. I learned everything that night after my last $5,400 went up in smoke on a reckless 50x $FET long. That loss was the final tuition payment for a lesson I’d been dodging: social media is a hall of mirrors designed to make you feel like a failure while the loudest voices hide their bodies in the graveyard. We call this survivorship bias. You see the guy flaunting a 400% win on $BTC, but you don’t see the forty other accounts he blew to get that one screenshot. This distorted reality creates a "gambler’s dopamine loop" where you think 50x leverage is the standard path to wealth. It isn't. It is a one-way ticket to zero.
When you scroll through your feed, you are looking at the...
The Survivorship Bias Trap: Why Your Feed Is Lying To You
3am. Red portfolio. Liquidated. One tab open. I learned everything that night after my last $5,400 went up in smoke on a reckless 50x $FET long. That loss was the final tuition payment for a lesson I’d been dodging: social media is a hall of mirrors designed to make you feel like a failure while the loudest voices hide their bodies in the graveyard. We call this survivorship bias. You see the guy flaunting a 400% win on $BTC , but you don’t see the forty other accounts he blew to get that one screenshot. This distorted reality creates a "gambler’s dopamine loop" where you think 50x leverage is the standard path to wealth. It isn't. It is a one-way ticket to zero.
When you scroll through your feed, you are looking at the...
When you scroll through your feed, you are looking at the...
71
·
--
Article
BNB Dips 3.28% Today Despite NFT Volume Surging 1,042%$BNB is trading at $724.4500, down 3.28% in the last 24 hours, with a high of $757.7800 and a low of $716.1800. This drop comes despite several bullish developments on the Binance ecosystem, a classic example of market dynamics often ignoring immediate positive news.
Today, we're seeing some real fundamental action for the Binance ecosystem. For starters, BNB Chain just flexed, flipping Ethereum in NFT sales volume with a massive 1,042% jump to $32.75 million in the past week, even as overall trade counts fell. That’s significant capital flowing into the chain. Additionally, Binance officially opened withdrawals for the new 牛来 (牛来) token today, which is built on BNB Smart Chain and comes with a Seed Tag, indicating new listings are still pushing the ecosystem forward. Binance Alpha 2.0 is also supporting a contract swap for Nesa (NES) on BNB Smart Chain following a security incident, with trading expected to resume today at 08:00 UTC – a clear move to protect users and maintain chain integrity. Lastly, Binance Futures is adjusting funding intervals for certain TradFi perpetual contracts, an operational refinement indicating continuous platform evolution.
Given these positive ecosystem developments, $BNB's 3.28% dip today suggests profit-taking after its impressive 10% rally over the last seven days. The market often doesn't react linearly to news. We saw the Pasteur hardfork earlier this month, which strengthened network security and governance, setting a solid foundation for growth. Today's price action could simply be a recalibration, or a broader market headwind, as many altcoins, including something like $TON, are navigating general sentiment without specific catalysts right now. It shows that even with strong fundamentals, short-term price movements can be technical. The smart money often looks at early plays like the Pepeto presale, a meme coin with a 0%...
BNB Dips 3.28% Today Despite NFT Volume Surging 1,042%
$BNB is trading at $724.4500, down 3.28% in the last 24 hours, with a high of $757.7800 and a low of $716.1800. This drop comes despite several bullish developments on the Binance ecosystem, a classic example of market dynamics often ignoring immediate positive news.
Today, we're seeing some real fundamental action for the Binance ecosystem. For starters, BNB Chain just flexed, flipping Ethereum in NFT sales volume with a massive 1,042% jump to $32.75 million in the past week, even as overall trade counts fell. That’s significant capital flowing into the chain. Additionally, Binance officially opened withdrawals for the new 牛来 (牛来) token today, which is built on BNB Smart Chain and comes with a Seed Tag, indicating new listings are still pushing the ecosystem forward. Binance Alpha 2.0 is also supporting a contract swap for Nesa (NES) on BNB Smart Chain following a security incident, with trading expected to resume today at 08:00 UTC – a clear move to protect users and maintain chain integrity. Lastly, Binance Futures is adjusting funding intervals for certain TradFi perpetual contracts, an operational refinement indicating continuous platform evolution.
Given these positive ecosystem developments, $BNB 's 3.28% dip today suggests profit-taking after its impressive 10% rally over the last seven days. The market often doesn't react linearly to news. We saw the Pasteur hardfork earlier this month, which strengthened network security and governance, setting a solid foundation for growth. Today's price action could simply be a recalibration, or a broader market headwind, as many altcoins, including something like $TON, are navigating general sentiment without specific catalysts right now. It shows that even with strong fundamentals, short-term price movements can be technical. The smart money often looks at early plays like the Pepeto presale, a meme coin with a 0%...
Today, we're seeing some real fundamental action for the Binance ecosystem. For starters, BNB Chain just flexed, flipping Ethereum in NFT sales volume with a massive 1,042% jump to $32.75 million in the past week, even as overall trade counts fell. That’s significant capital flowing into the chain. Additionally, Binance officially opened withdrawals for the new 牛来 (牛来) token today, which is built on BNB Smart Chain and comes with a Seed Tag, indicating new listings are still pushing the ecosystem forward. Binance Alpha 2.0 is also supporting a contract swap for Nesa (NES) on BNB Smart Chain following a security incident, with trading expected to resume today at 08:00 UTC – a clear move to protect users and maintain chain integrity. Lastly, Binance Futures is adjusting funding intervals for certain TradFi perpetual contracts, an operational refinement indicating continuous platform evolution.
Given these positive ecosystem developments, $BNB 's 3.28% dip today suggests profit-taking after its impressive 10% rally over the last seven days. The market often doesn't react linearly to news. We saw the Pasteur hardfork earlier this month, which strengthened network security and governance, setting a solid foundation for growth. Today's price action could simply be a recalibration, or a broader market headwind, as many altcoins, including something like $TON, are navigating general sentiment without specific catalysts right now. It shows that even with strong fundamentals, short-term price movements can be technical. The smart money often looks at early plays like the Pepeto presale, a meme coin with a 0%...
22
·
--
Article
The Exit Strategy That Keeps My Gains From Turning Into Losses🎯📉
89% of futures traders are liquidated in their first month because they enter a trade with a target, but exit with an emotion. When I was down $5,400, my biggest flaw wasn't my entry—it was my exit. I watched $BNB pump, felt the dopamine hit, and decided that "a little more" profit was just around the corner, only to watch the entire position reverse into a stop loss. Professionals do not trade like this. A professional sets the exit before the order is even executed. You must decide exactly where the trade becomes invalid or where the upside potential is exhausted before you commit a single dollar of your margin.
The difference between a hard TP and scaling out comes down to market structure. If I am trading a...
The Exit Strategy That Keeps My Gains From Turning Into Losses
🎯📉
89% of futures traders are liquidated in their first month because they enter a trade with a target, but exit with an emotion. When I was down $5,400, my biggest flaw wasn't my entry—it was my exit. I watched $BNB pump, felt the dopamine hit, and decided that "a little more" profit was just around the corner, only to watch the entire position reverse into a stop loss. Professionals do not trade like this. A professional sets the exit before the order is even executed. You must decide exactly where the trade becomes invalid or where the upside potential is exhausted before you commit a single dollar of your margin.
The difference between a hard TP and scaling out comes down to market structure. If I am trading a...
89% of futures traders are liquidated in their first month because they enter a trade with a target, but exit with an emotion. When I was down $5,400, my biggest flaw wasn't my entry—it was my exit. I watched $BNB pump, felt the dopamine hit, and decided that "a little more" profit was just around the corner, only to watch the entire position reverse into a stop loss. Professionals do not trade like this. A professional sets the exit before the order is even executed. You must decide exactly where the trade becomes invalid or where the upside potential is exhausted before you commit a single dollar of your margin.
The difference between a hard TP and scaling out comes down to market structure. If I am trading a...
6
·
--
Article
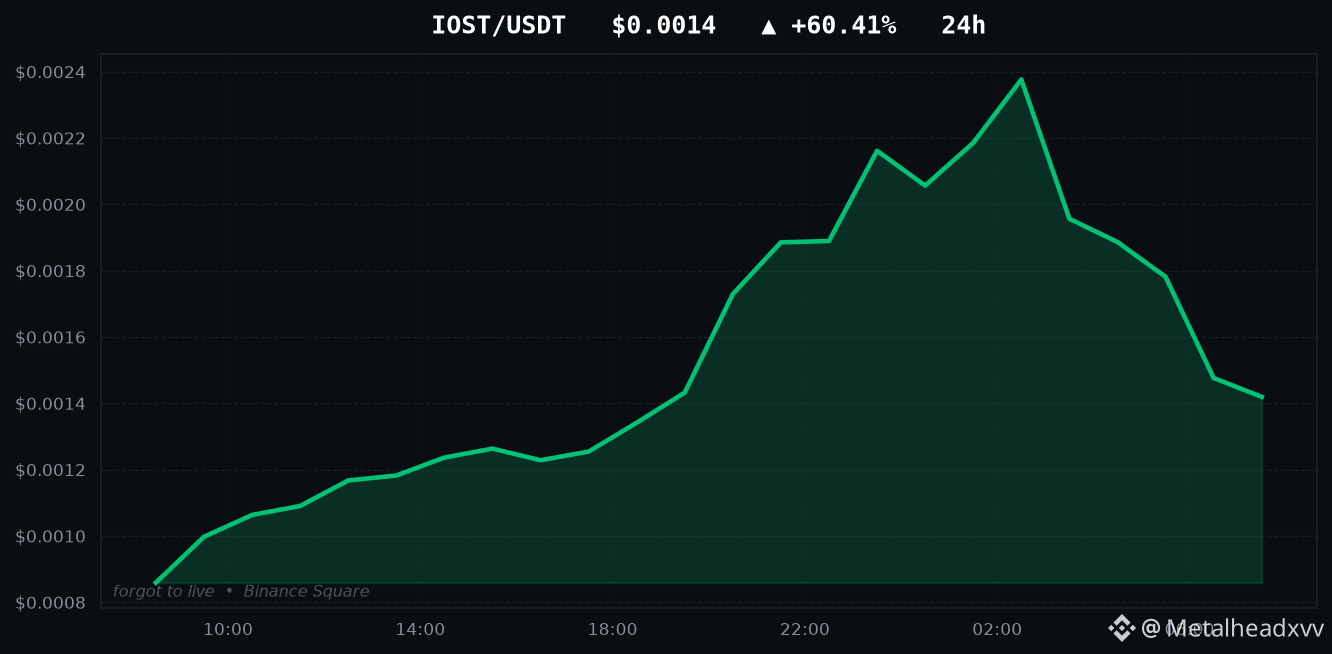
Why $IOST is a dangerous distraction while $BNB and $TON stabilize📈 $IOST/USDT at $0.0014. Watching a 60% pump on $IOST reminds me of the exact moment I lost my first $5,400 trying to chase volatility instead of following the structural leaders. While the retail crowd is currently salivating over the IOST candle, I am looking at the only two assets that actually dictate the direction of my portfolio: $BNB and $TON. You can gamble on low-cap momentum, but when the market liquidity shifts, it is the big caps that define the trend, not these 24-hour outliers. I am not playing IOST because the risk of a parabolic reversal is at 90% when volume isn't supported by major exchange ecosystem demand.
SETUP TYPE: Pullback.
ENTRY ZONE: I am looking for a re-entry on $BNB around the $490 support level. This zone has acted as a historical floor for liquidity and provides a structural anchor that IOST simply does not have. By avoiding the FOMO of a 60% gain, I am positioning for the inevitable rotation of capital back into reliable ecosystems once the high-volatility hype dies down in the next 48 hours.
STOP LOSS: My hard stop is placed at $472. If the price breaks this level, it invalidates the recent consolidation pattern and suggests the broader market is heading for a deeper correction that no amount of momentum chasing can survive.
TARGETS: Target 1 is set at $525, which marks the recent local high. Target 2 is $550, assuming the broader market sentiment remains bullish and volume continues to favor $BNB as a store of value compared to transient trending coins.
RISK/REWARD: This trade offers a solid 1:2.5 risk-to-reward ratio. I am risking a small portion of my capital for a significantly higher upside, keeping my emotions detached from the outcome.
POSITION SIZE...
Why $IOST is a dangerous distraction while $BNB and $TON stabilize
📈 $IOST /USDT at $0.0014. Watching a 60% pump on $IOST reminds me of the exact moment I lost my first $5,400 trying to chase volatility instead of following the structural leaders. While the retail crowd is currently salivating over the IOST candle, I am looking at the only two assets that actually dictate the direction of my portfolio: $BNB and $TON. You can gamble on low-cap momentum, but when the market liquidity shifts, it is the big caps that define the trend, not these 24-hour outliers. I am not playing IOST because the risk of a parabolic reversal is at 90% when volume isn't supported by major exchange ecosystem demand.
SETUP TYPE: Pullback.
ENTRY ZONE: I am looking for a re-entry on $BNB around the $490 support level. This zone has acted as a historical floor for liquidity and provides a structural anchor that IOST simply does not have. By avoiding the FOMO of a 60% gain, I am positioning for the inevitable rotation of capital back into reliable ecosystems once the high-volatility hype dies down in the next 48 hours.
STOP LOSS: My hard stop is placed at $472. If the price breaks this level, it invalidates the recent consolidation pattern and suggests the broader market is heading for a deeper correction that no amount of momentum chasing can survive.
TARGETS: Target 1 is set at $525, which marks the recent local high. Target 2 is $550, assuming the broader market sentiment remains bullish and volume continues to favor $BNB as a store of value compared to transient trending coins.
RISK/REWARD: This trade offers a solid 1:2.5 risk-to-reward ratio. I am risking a small portion of my capital for a significantly higher upside, keeping my emotions detached from the outcome.
POSITION SIZE...
SETUP TYPE: Pullback.
ENTRY ZONE: I am looking for a re-entry on $BNB around the $490 support level. This zone has acted as a historical floor for liquidity and provides a structural anchor that IOST simply does not have. By avoiding the FOMO of a 60% gain, I am positioning for the inevitable rotation of capital back into reliable ecosystems once the high-volatility hype dies down in the next 48 hours.
STOP LOSS: My hard stop is placed at $472. If the price breaks this level, it invalidates the recent consolidation pattern and suggests the broader market is heading for a deeper correction that no amount of momentum chasing can survive.
TARGETS: Target 1 is set at $525, which marks the recent local high. Target 2 is $550, assuming the broader market sentiment remains bullish and volume continues to favor $BNB as a store of value compared to transient trending coins.
RISK/REWARD: This trade offers a solid 1:2.5 risk-to-reward ratio. I am risking a small portion of my capital for a significantly higher upside, keeping my emotions detached from the outcome.
POSITION SIZE...
78
·
--
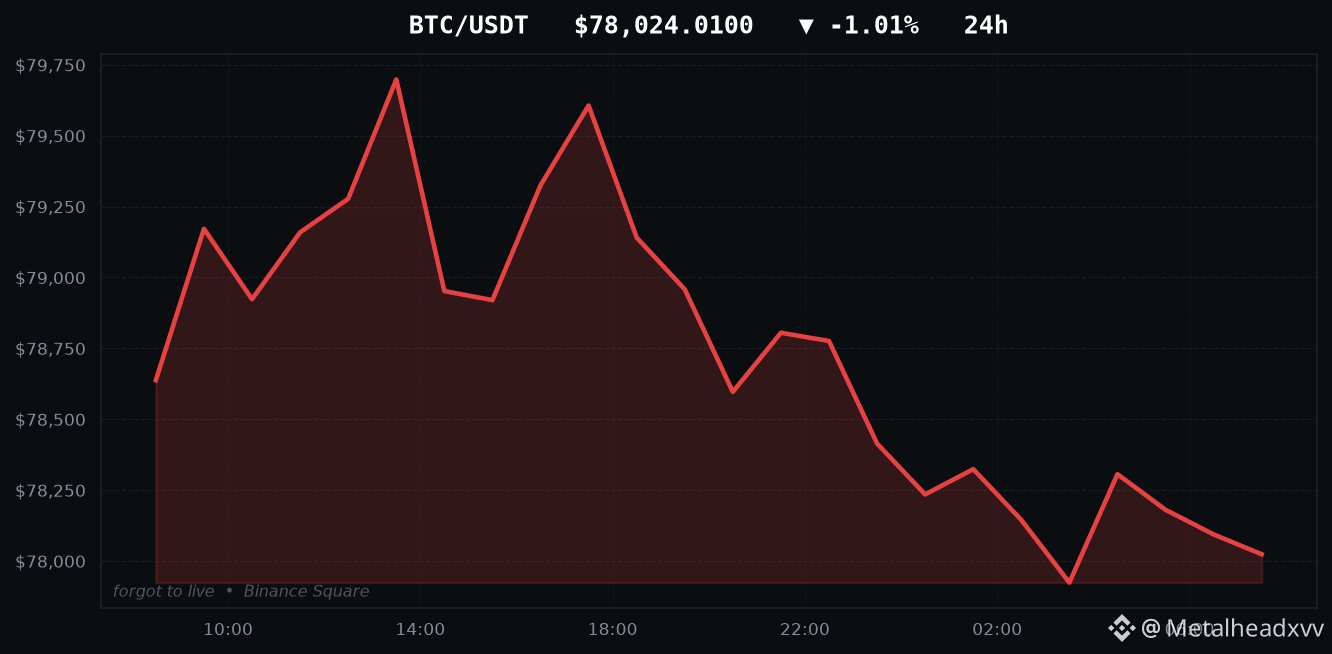
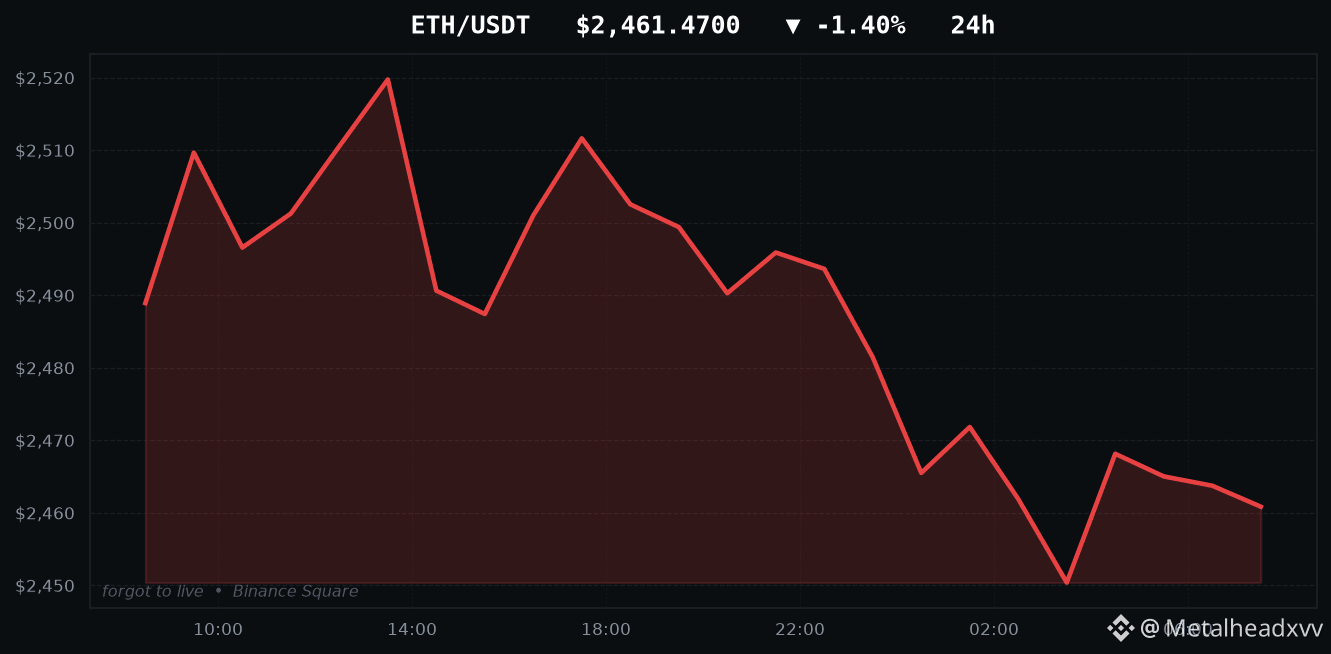
The day I stopped trying to predict the market and started reading it — everything changed. Back when I torched that $5,400, I was obsessed with the next move of every shitcoin. Now, I watch $BNB and $TON like a hawk because they tell me where the liquidity is actually hiding. $BNB is currently dragging against the $716 floor; if that snaps, the entire exchange-token thesis for the month is dead on arrival. Meanwhile, $TON is acting as the canary in the coal mine for institutional sentiment. When BTC dips to $77,770 like it is now, I don't panic. I watch if $TON holds its relative strength or bleeds out. My bias is neutral-bearish because we are hovering too close to the edge of a cascade. The market is screaming for a flush. Watch $77,500 on BTC. If that goes, the stop-loss hunts will be...
The day I stopped trying to predict the market and started reading it — everything changed. Back when I torched that $5,400, I was obsessed with the next move of every shitcoin. Now, I watch $BNB and $TON like a hawk because they tell me where the liquidity is actually hiding. $BNB is currently dragging against the $716 floor; if that snaps, the entire exchange-token thesis for the month is dead on arrival. Meanwhile, $TON is acting as the canary in the coal mine for institutional sentiment. When BTC dips to $77,770 like it is now, I don't panic. I watch if $TON holds its relative strength or bleeds out. My bias is neutral-bearish because we are hovering too close to the edge of a cascade. The market is screaming for a flush. Watch $77,500 on BTC. If that goes, the stop-loss hunts will be...
9
·
--

Article
$XRP Dips 2.30% as Key Ledger Upgrade Looms & Clarity Act Vote NearsA critical fix bundle, "fixCleanup3_3_0," for the XRP Ledger is set to go live tomorrow, September 11, bringing 11 fixes across vaults, lending, and trading pools. This on-chain development comes as $XRP faces a slight pullback today, trading at $1.3834, down 2.30% over the last 24 hours. The market's attention is squarely on the upcoming Senate cloture vote on the Digital Asset Market Clarity Act (CLARITY Act) on September 15, a procedural step that could define the regulatory landscape for digital assets, a narrative that impacts more than just one coin.
**COIN & PRICE**
$XRP is currently trading at $1.3834 against USDT, marking a 2.30% decline over the past 24 hours. Its daily range saw a high of $1.4458 and a low of $1.3770. While the broader crypto market shows mixed signals, XRP's price action today is a direct reflection of underlying market sentiment ahead of pivotal regulatory and technical milestones.
**TODAY'S NEWS**
The primary tangible news for $XRP today centers on the impending "fixCleanup3_3_0" upgrade to the XRP Ledger, scheduled for September 11. This bundle of 11 fixes targets crucial DeFi functionalities like vaults, lending, and trading pools, requiring over 80% validator support for 14 days to activate. This is big for the ecosystem's robustness. Beyond this, the market is digesting a complex regulatory environment. The US Senate's cloture vote on the CLARITY Act, set for September 15, remains a significant talking point. While not directly altering XRP's legal status (which was classified as a digital commodity by the SEC/CFTC in March 2026), its passage would solidify a federal framework, moving beyond agency interpretations. Ripple's stablecoin, RLUSD, already boasts a $2.4 billion circulation and New York regulatory approval, showcasing Ripple's parallel efforts in the regulated stablecoin space.
**MARKET REACTION**
Today's 2.30% dip for...
$XRP Dips 2.30% as Key Ledger Upgrade Looms & Clarity Act Vote Nears
A critical fix bundle, "fixCleanup3_3_0," for the XRP Ledger is set to go live tomorrow, September 11, bringing 11 fixes across vaults, lending, and trading pools. This on-chain development comes as $XRP faces a slight pullback today, trading at $1.3834, down 2.30% over the last 24 hours. The market's attention is squarely on the upcoming Senate cloture vote on the Digital Asset Market Clarity Act (CLARITY Act) on September 15, a procedural step that could define the regulatory landscape for digital assets, a narrative that impacts more than just one coin.
**COIN & PRICE**
$XRP is currently trading at $1.3834 against USDT, marking a 2.30% decline over the past 24 hours. Its daily range saw a high of $1.4458 and a low of $1.3770. While the broader crypto market shows mixed signals, XRP's price action today is a direct reflection of underlying market sentiment ahead of pivotal regulatory and technical milestones.
**TODAY'S NEWS**
The primary tangible news for $XRP today centers on the impending "fixCleanup3_3_0" upgrade to the XRP Ledger, scheduled for September 11. This bundle of 11 fixes targets crucial DeFi functionalities like vaults, lending, and trading pools, requiring over 80% validator support for 14 days to activate. This is big for the ecosystem's robustness. Beyond this, the market is digesting a complex regulatory environment. The US Senate's cloture vote on the CLARITY Act, set for September 15, remains a significant talking point. While not directly altering XRP's legal status (which was classified as a digital commodity by the SEC/CFTC in March 2026), its passage would solidify a federal framework, moving beyond agency interpretations. Ripple's stablecoin, RLUSD, already boasts a $2.4 billion circulation and New York regulatory approval, showcasing Ripple's parallel efforts in the regulated stablecoin space.
**MARKET REACTION**
Today's 2.30% dip for...
**COIN & PRICE**
$XRP is currently trading at $1.3834 against USDT, marking a 2.30% decline over the past 24 hours. Its daily range saw a high of $1.4458 and a low of $1.3770. While the broader crypto market shows mixed signals, XRP's price action today is a direct reflection of underlying market sentiment ahead of pivotal regulatory and technical milestones.
**TODAY'S NEWS**
The primary tangible news for $XRP today centers on the impending "fixCleanup3_3_0" upgrade to the XRP Ledger, scheduled for September 11. This bundle of 11 fixes targets crucial DeFi functionalities like vaults, lending, and trading pools, requiring over 80% validator support for 14 days to activate. This is big for the ecosystem's robustness. Beyond this, the market is digesting a complex regulatory environment. The US Senate's cloture vote on the CLARITY Act, set for September 15, remains a significant talking point. While not directly altering XRP's legal status (which was classified as a digital commodity by the SEC/CFTC in March 2026), its passage would solidify a federal framework, moving beyond agency interpretations. Ripple's stablecoin, RLUSD, already boasts a $2.4 billion circulation and New York regulatory approval, showcasing Ripple's parallel efforts in the regulated stablecoin space.
**MARKET REACTION**
Today's 2.30% dip for...
23
·
--

Article
Stop Losses Are Not Optional. Here Is Why I Ignored Them.📉🛑
89% of futures traders are liquidated in their first month. Here is what the 11% do differently. When I first started, I treated my stop loss like a suggestion. I thought I was smarter than the chart, holding through $BTC drops because I "knew" it would bounce. I lost $5,400 that year because I refused to accept that the market does not care about my entry price. A stop loss is not a tool to protect your ego; it is a mathematical guarantee that you stay in the game to trade another day.
To set a proper stop, you must look at market structure, not a random percentage. If I am long on $BTC at $57,000, placing a stop at 2% is gambling. I place my stop just below the most recent swing low where the market invalidated the...
Stop Losses Are Not Optional. Here Is Why I Ignored Them.
📉🛑
89% of futures traders are liquidated in their first month. Here is what the 11% do differently. When I first started, I treated my stop loss like a suggestion. I thought I was smarter than the chart, holding through $BTC drops because I "knew" it would bounce. I lost $5,400 that year because I refused to accept that the market does not care about my entry price. A stop loss is not a tool to protect your ego; it is a mathematical guarantee that you stay in the game to trade another day.
To set a proper stop, you must look at market structure, not a random percentage. If I am long on $BTC at $57,000, placing a stop at 2% is gambling. I place my stop just below the most recent swing low where the market invalidated the...
89% of futures traders are liquidated in their first month. Here is what the 11% do differently. When I first started, I treated my stop loss like a suggestion. I thought I was smarter than the chart, holding through $BTC drops because I "knew" it would bounce. I lost $5,400 that year because I refused to accept that the market does not care about my entry price. A stop loss is not a tool to protect your ego; it is a mathematical guarantee that you stay in the game to trade another day.
To set a proper stop, you must look at market structure, not a random percentage. If I am long on $BTC at $57,000, placing a stop at 2% is gambling. I place my stop just below the most recent swing low where the market invalidated the...
·
--
Article
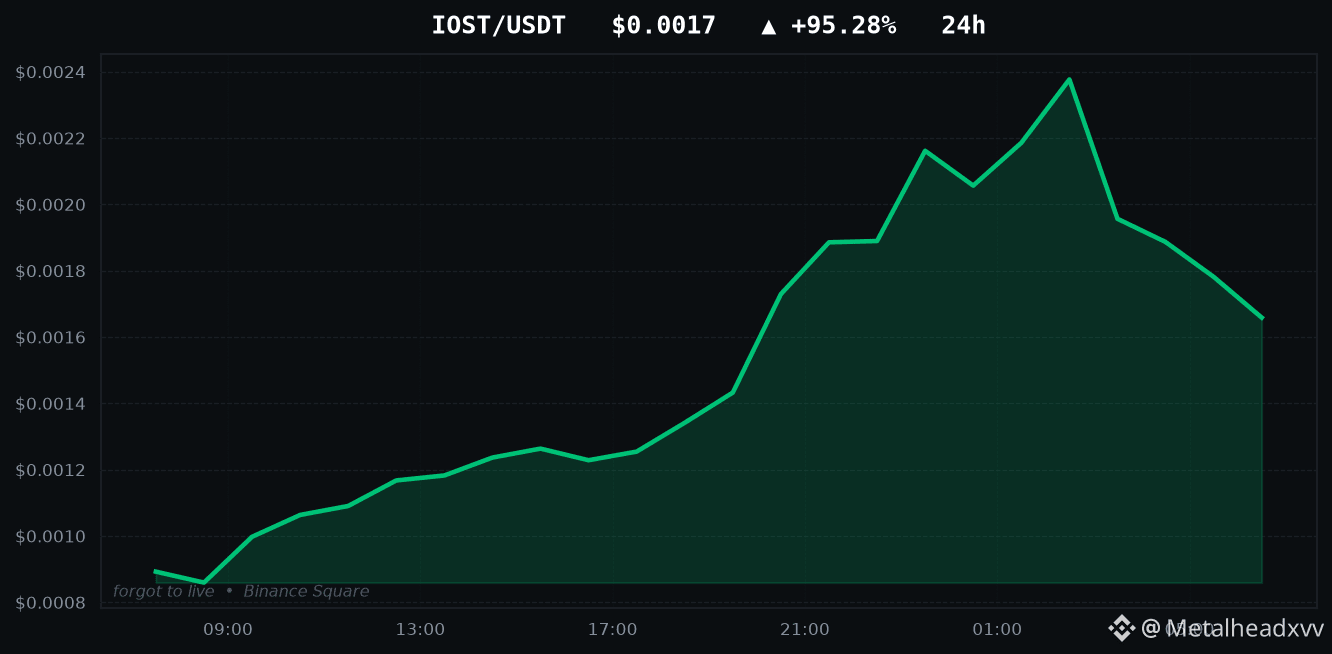
$IOST is pumping 95% while $BTC and $ADA are sleeping📈 $IOST $0.0017 (+95.28%)
THE CATALYST
The massive 95% surge in $IOST is largely a classic liquidity trap disguised as a breakout. While retail traders are chasing the $0.0024 high, the move isn't backed by a fundamental shift in the ecosystem. Instead, it’s being fueled by thin order books and a rotation of speculative capital that has temporarily abandoned $BTC and $ADA. When market leaders like $BTC enter a consolidation phase, lower-cap assets often see these aggressive, violent pumps that serve primarily to shake out late-stage longs before the real move happens elsewhere.
THE NARRATIVE
The market is currently telling itself a story of "altseason," trying to convince anyone watching the charts that money is finally rotating out of the big caps. However, this is a dangerous illusion. Investors are desperately looking for the next 2x, forgetting that $BTC remains the ultimate anchor for liquidity. $ADA holders, in particular, are feeling frustrated by the lack of price action, leading them to gamble on micro-caps like this to recover lost time.
THE CONTEXT
This is a sudden, volatile spike from a low of $0.0008, not a structural breakout from a multi-month base. The volume of $52,191,633 is high, but it’s concentrated in a very short window. We are seeing a vertical move that lacks the support of higher-timeframe consolidation, which is why it feels more like an exit liquidity event for whales than a trend reversal for the coin.
THE RISK
The primary risk is the inevitable "rug-pull" effect on the order book. Once the buy-side pressure exhausts, there is zero meaningful support below the current price to catch a falling knife. If $BTC flashes even a moderate red candle, liquidity will evaporate from...
$IOST is pumping 95% while $BTC and $ADA are sleeping
📈 $IOST $0.0017 (+95.28%)
THE CATALYST
The massive 95% surge in $IOST is largely a classic liquidity trap disguised as a breakout. While retail traders are chasing the $0.0024 high, the move isn't backed by a fundamental shift in the ecosystem. Instead, it’s being fueled by thin order books and a rotation of speculative capital that has temporarily abandoned $BTC and $ADA . When market leaders like $BTC enter a consolidation phase, lower-cap assets often see these aggressive, violent pumps that serve primarily to shake out late-stage longs before the real move happens elsewhere.
THE NARRATIVE
The market is currently telling itself a story of "altseason," trying to convince anyone watching the charts that money is finally rotating out of the big caps. However, this is a dangerous illusion. Investors are desperately looking for the next 2x, forgetting that $BTC remains the ultimate anchor for liquidity. $ADA holders, in particular, are feeling frustrated by the lack of price action, leading them to gamble on micro-caps like this to recover lost time.
THE CONTEXT
This is a sudden, volatile spike from a low of $0.0008, not a structural breakout from a multi-month base. The volume of $52,191,633 is high, but it’s concentrated in a very short window. We are seeing a vertical move that lacks the support of higher-timeframe consolidation, which is why it feels more like an exit liquidity event for whales than a trend reversal for the coin.
THE RISK
The primary risk is the inevitable "rug-pull" effect on the order book. Once the buy-side pressure exhausts, there is zero meaningful support below the current price to catch a falling knife. If $BTC flashes even a moderate red candle, liquidity will evaporate from...
THE CATALYST
The massive 95% surge in $IOST is largely a classic liquidity trap disguised as a breakout. While retail traders are chasing the $0.0024 high, the move isn't backed by a fundamental shift in the ecosystem. Instead, it’s being fueled by thin order books and a rotation of speculative capital that has temporarily abandoned $BTC and $ADA . When market leaders like $BTC enter a consolidation phase, lower-cap assets often see these aggressive, violent pumps that serve primarily to shake out late-stage longs before the real move happens elsewhere.
THE NARRATIVE
The market is currently telling itself a story of "altseason," trying to convince anyone watching the charts that money is finally rotating out of the big caps. However, this is a dangerous illusion. Investors are desperately looking for the next 2x, forgetting that $BTC remains the ultimate anchor for liquidity. $ADA holders, in particular, are feeling frustrated by the lack of price action, leading them to gamble on micro-caps like this to recover lost time.
THE CONTEXT
This is a sudden, volatile spike from a low of $0.0008, not a structural breakout from a multi-month base. The volume of $52,191,633 is high, but it’s concentrated in a very short window. We are seeing a vertical move that lacks the support of higher-timeframe consolidation, which is why it feels more like an exit liquidity event for whales than a trend reversal for the coin.
THE RISK
The primary risk is the inevitable "rug-pull" effect on the order book. Once the buy-side pressure exhausts, there is zero meaningful support below the current price to catch a falling knife. If $BTC flashes even a moderate red candle, liquidity will evaporate from...
128
·
--

Article
The Hidden Tax That Slowly Bleeds Your Crypto Account Dry3am. Red portfolio. Liquidated. One tab open. I learned everything that night after my $5,400 evaporated into thin air. Back then, I thought leverage was just a multiplier for my gains, but I didn't realize I was paying a "silence tax" every single hour. Most traders focus on the volatility of $BTC or $ADA, ignoring the funding rates and exchange fees that act like a slow leak in a boat. Imagine you are trying to fill a bucket with water, but someone has drilled a hundred tiny pinpricks into the bottom. You might get a little bit of water in, but eventually, you are just working hard to keep a sinking vessel afloat.
Let’s look at the math that kills accounts. When you open a 50x long on $ADA, the exchange doesn't just...
The Hidden Tax That Slowly Bleeds Your Crypto Account Dry
3am. Red portfolio. Liquidated. One tab open. I learned everything that night after my $5,400 evaporated into thin air. Back then, I thought leverage was just a multiplier for my gains, but I didn't realize I was paying a "silence tax" every single hour. Most traders focus on the volatility of $BTC or $ADA , ignoring the funding rates and exchange fees that act like a slow leak in a boat. Imagine you are trying to fill a bucket with water, but someone has drilled a hundred tiny pinpricks into the bottom. You might get a little bit of water in, but eventually, you are just working hard to keep a sinking vessel afloat.
Let’s look at the math that kills accounts. When you open a 50x long on $ADA , the exchange doesn't just...
Let’s look at the math that kills accounts. When you open a 50x long on $ADA , the exchange doesn't just...
38
·
--
Article
$NFP's 65% CRASH: Binance Exits, Liquidity EvaporatesNFP just cratered, plunging a brutal 65.85% today to $0.0018, with a 24-hour range swinging wildly from a high of $0.0057 down to a gut-wrenching $0.0017. This isn't just a bad day; this is an absolute bloodbath for holders.
The real reason for this dramatic sell-off isn't hard to find. Binance officially halted withdrawals for $NFP on September 9, 2026, for its EU users, effectively kicking the token off a major liquidity source as the exchange winds down its EU operations. This isn't some vague macro fear; this is a direct, concrete hit to the token's market access and a stark reminder of centralized exchange risk. While foundational assets like $ETH and robust DeFi protocols like $UNI thrive on decentralized liquidity and a global, permissionless ecosystem, smaller altcoins like NFP remain highly vulnerable to single-point-of-failure events like this. We saw Bitcoin take a 3.2% hit last week after the stronger-than-expected US NFP jobs report fueled fears of continued Fed hawkishness, pressuring all risk assets, but NFP's plunge is an entirely different beast — a project-specific disaster amplified by a liquidity crunch.
When a major exchange pulls the plug on withdrawals, technical support levels become meaningless. NFP has blown through any semblance of previous support. At a 65% drop in hours, there's no "key level" that held; the floor simply fell out, triggered by the loss of a primary trading venue for a significant portion of its user base.
How far can it fall? Until buyers emerge at a price that reflects its severely diminished liquidity and utility. With major exchange access compromised for European traders, the bid side is thin. Without new positive catalysts, it could retest its all-time lows or even fade further into obscurity. Expect extreme volatility on low volume as remaining holders try to exit.
This is an unequivocal AVOID. When a token...
$NFP's 65% CRASH: Binance Exits, Liquidity Evaporates
NFP just cratered, plunging a brutal 65.85% today to $0.0018, with a 24-hour range swinging wildly from a high of $0.0057 down to a gut-wrenching $0.0017. This isn't just a bad day; this is an absolute bloodbath for holders.
The real reason for this dramatic sell-off isn't hard to find. Binance officially halted withdrawals for $NFP on September 9, 2026, for its EU users, effectively kicking the token off a major liquidity source as the exchange winds down its EU operations. This isn't some vague macro fear; this is a direct, concrete hit to the token's market access and a stark reminder of centralized exchange risk. While foundational assets like $ETH and robust DeFi protocols like $UNI thrive on decentralized liquidity and a global, permissionless ecosystem, smaller altcoins like NFP remain highly vulnerable to single-point-of-failure events like this. We saw Bitcoin take a 3.2% hit last week after the stronger-than-expected US NFP jobs report fueled fears of continued Fed hawkishness, pressuring all risk assets, but NFP's plunge is an entirely different beast — a project-specific disaster amplified by a liquidity crunch.
When a major exchange pulls the plug on withdrawals, technical support levels become meaningless. NFP has blown through any semblance of previous support. At a 65% drop in hours, there's no "key level" that held; the floor simply fell out, triggered by the loss of a primary trading venue for a significant portion of its user base.
How far can it fall? Until buyers emerge at a price that reflects its severely diminished liquidity and utility. With major exchange access compromised for European traders, the bid side is thin. Without new positive catalysts, it could retest its all-time lows or even fade further into obscurity. Expect extreme volatility on low volume as remaining holders try to exit.
This is an unequivocal AVOID. When a token...
The real reason for this dramatic sell-off isn't hard to find. Binance officially halted withdrawals for $NFP on September 9, 2026, for its EU users, effectively kicking the token off a major liquidity source as the exchange winds down its EU operations. This isn't some vague macro fear; this is a direct, concrete hit to the token's market access and a stark reminder of centralized exchange risk. While foundational assets like $ETH and robust DeFi protocols like $UNI thrive on decentralized liquidity and a global, permissionless ecosystem, smaller altcoins like NFP remain highly vulnerable to single-point-of-failure events like this. We saw Bitcoin take a 3.2% hit last week after the stronger-than-expected US NFP jobs report fueled fears of continued Fed hawkishness, pressuring all risk assets, but NFP's plunge is an entirely different beast — a project-specific disaster amplified by a liquidity crunch.
When a major exchange pulls the plug on withdrawals, technical support levels become meaningless. NFP has blown through any semblance of previous support. At a 65% drop in hours, there's no "key level" that held; the floor simply fell out, triggered by the loss of a primary trading venue for a significant portion of its user base.
How far can it fall? Until buyers emerge at a price that reflects its severely diminished liquidity and utility. With major exchange access compromised for European traders, the bid side is thin. Without new positive catalysts, it could retest its all-time lows or even fade further into obscurity. Expect extreme volatility on low volume as remaining holders try to exit.
This is an unequivocal AVOID. When a token...
22
·
--
Article
Master Order Execution: How Professional Traders Manage Every Setup📉📉
89% of futures traders are liquidated in their first month. Here is what the 11% do differently. When I first started trading $ETH and $UNI, I treated my exchange interface like a video game, clicking market orders whenever I felt the impulse to move. That habit cost me $5,400 in a single volatile week because I didn't understand the invisible tax of slippage.
A market order is the quickest way to get inside a position, but it is also the quickest way to destroy your R:R ratio. When volatility spikes on $ETH, hitting a market buy order means you are taking whatever the liquidity pool gives you, often at a price significantly higher than the ticker shows. Beginners think this is "fast" trading; pros know it is...
Master Order Execution: How Professional Traders Manage Every Setup
📉📉
89% of futures traders are liquidated in their first month. Here is what the 11% do differently. When I first started trading $ETH and $UNI , I treated my exchange interface like a video game, clicking market orders whenever I felt the impulse to move. That habit cost me $5,400 in a single volatile week because I didn't understand the invisible tax of slippage.
A market order is the quickest way to get inside a position, but it is also the quickest way to destroy your R:R ratio. When volatility spikes on $ETH , hitting a market buy order means you are taking whatever the liquidity pool gives you, often at a price significantly higher than the ticker shows. Beginners think this is "fast" trading; pros know it is...
89% of futures traders are liquidated in their first month. Here is what the 11% do differently. When I first started trading $ETH and $UNI , I treated my exchange interface like a video game, clicking market orders whenever I felt the impulse to move. That habit cost me $5,400 in a single volatile week because I didn't understand the invisible tax of slippage.
A market order is the quickest way to get inside a position, but it is also the quickest way to destroy your R:R ratio. When volatility spikes on $ETH , hitting a market buy order means you are taking whatever the liquidity pool gives you, often at a price significantly higher than the ticker shows. Beginners think this is "fast" trading; pros know it is...
49
Log in to explore more content
Join global crypto users on Binance Square
⚡️ Get latest and useful information about crypto.
💬 Trusted by the world’s largest crypto exchange.
👍 Discover real insights from verified creators.
Email / Phone number
Trending Topics
AppleDebutsFoldablePhone
12,518 views
302 Discussing
#appledebutsfoldablephone I Got My Hands on the iPhone Duo, Apple’s First Foldable Phone. Here’s What Stands Out
The palm-size phone is Apple's boldest handset in years, with a 5.4-inch cover screen and a 7.6-inch main display. I spent some time with the Duo before its October launch.It’s finally here: Apple on Wednesday unveiled its first foldable iPhone, called the iPhone Duo.
iPhone Duo design and build
The iPhone Duo is compact, with a passport-size design. It has a 7.6-inch display on the inside and a 5.4-inch outer display. It fits squarely in my palm, with dimensions similar to Samsung’s Galaxy Z Fold 8, which has a 7.6-inch inner display and a 5.5-inch cover display.
Apple says the Duo is the thinnest iPhone ever when open, measuring 5.2mm. It’s 11.3mm thick when closed. A titanium frame keeps it lightweight at 254 grams.
One of the key differences in feel between Apple’s and Samsung’s phones is that the iPhone Duo has a matte, nano-textured finish on the inner display, which reduces the phone’s crease while also curbing reflections. It has a satisfying feel and really makes the crease virtually disappear when the screen is on. I find it even harder to notice than the Z Fold 8’s, which also has an anti-reflective display.$ONG $IMX $TAC
Isabella-I
·4 Likes
·1k views
EUExtendsCentralContactPointToCASPs
773 views
65 Discussing
US10YTreasuryYieldHitsHighestSinceNov2023
15,584 views
293 Discussing