

Maxim S
10.2k Posts

Maxim S
Report
Block User
Крипто-инвестор & Трейдер 💵 | Сложная аналитика простыми словами 🧠 | В рынке 24/7. 🚀
Open Trade
Frequent Trader
2.4 Years
25 Following
7.3K+ Followers
33.0K+ Liked
Posts
Portfolio
All
Quotes
PINNED
·
--
Article
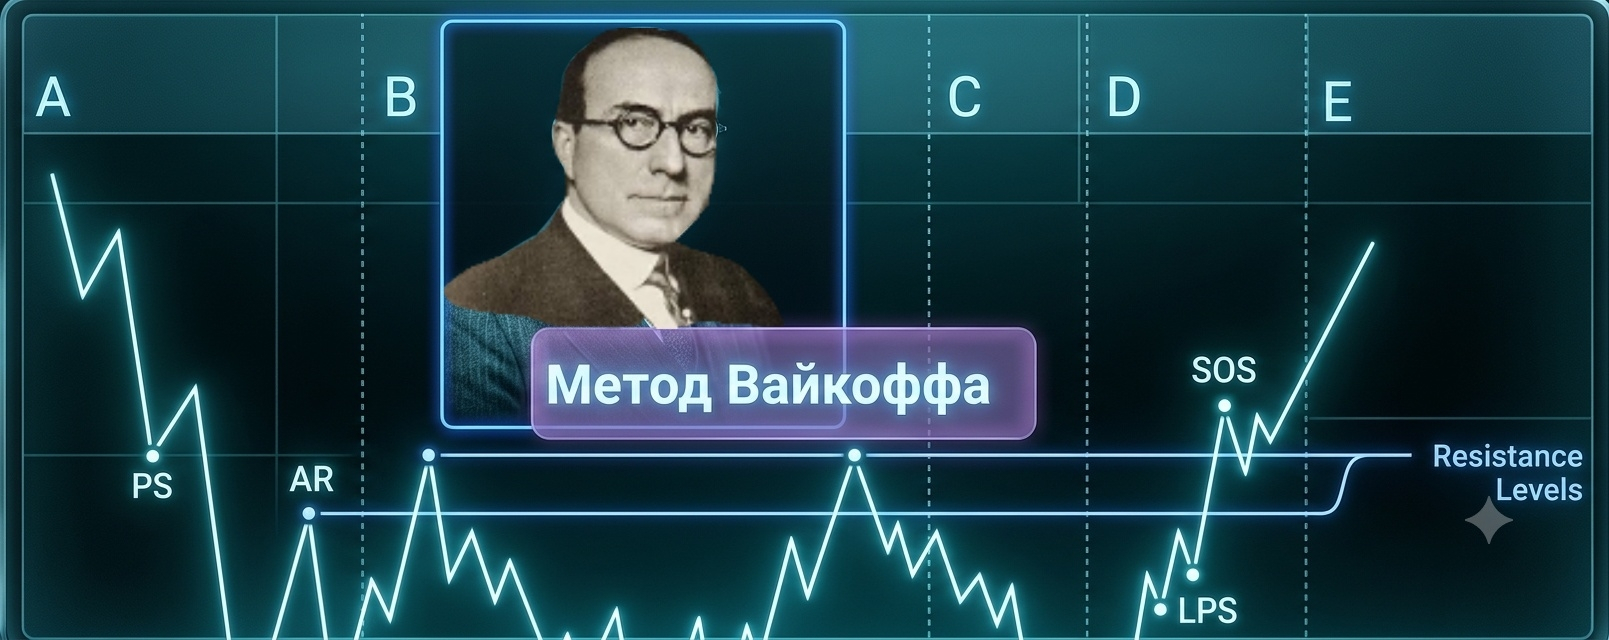
🧠 It’s simpler than you think!!! X-ray of the chart — Wyckoff’s Method!Many look at the chart and see chaos. But 100 years ago, legendary Richard Wyckoff proved: the market is not ruled by chaos, but by the Composite Man (big capital, market makers, “smart money”). Their only goal is to take your money. They buy from you in panic for cheap, and then sell you back on the hype—threefold.
🧠 It’s simpler than you think!!! X-ray of the chart — Wyckoff’s Method!
Many look at the chart and see chaos. But 100 years ago, legendary Richard Wyckoff proved: the market is not ruled by chaos, but by the Composite Man (big capital, market makers, “smart money”). Their only goal is to take your money. They buy from you in panic for cheap, and then sell you back on the hype—threefold.
1
17
671
PINNED
·
--
Article
How Pros Grow a Deposit With Minimal Risk 🧠🔥Many think that growing a deposit is always a huge risk and trading «all-in». But professionals use a completely different approach: they increase the position only when the market has already confirmed that they’re right. This method is called pyramiding.
Instead of entering a trade with the full volume right away, the position is built gradually.
How Pros Grow a Deposit With Minimal Risk 🧠🔥
Many think that growing a deposit is always a huge risk and trading «all-in». But professionals use a completely different approach: they increase the position only when the market has already confirmed that they’re right. This method is called pyramiding.
Instead of entering a trade with the full volume right away, the position is built gradually.
Instead of entering a trade with the full volume right away, the position is built gradually.
2
1
33
5.3k
·
--
Bullish
🔥 MEW/USDT
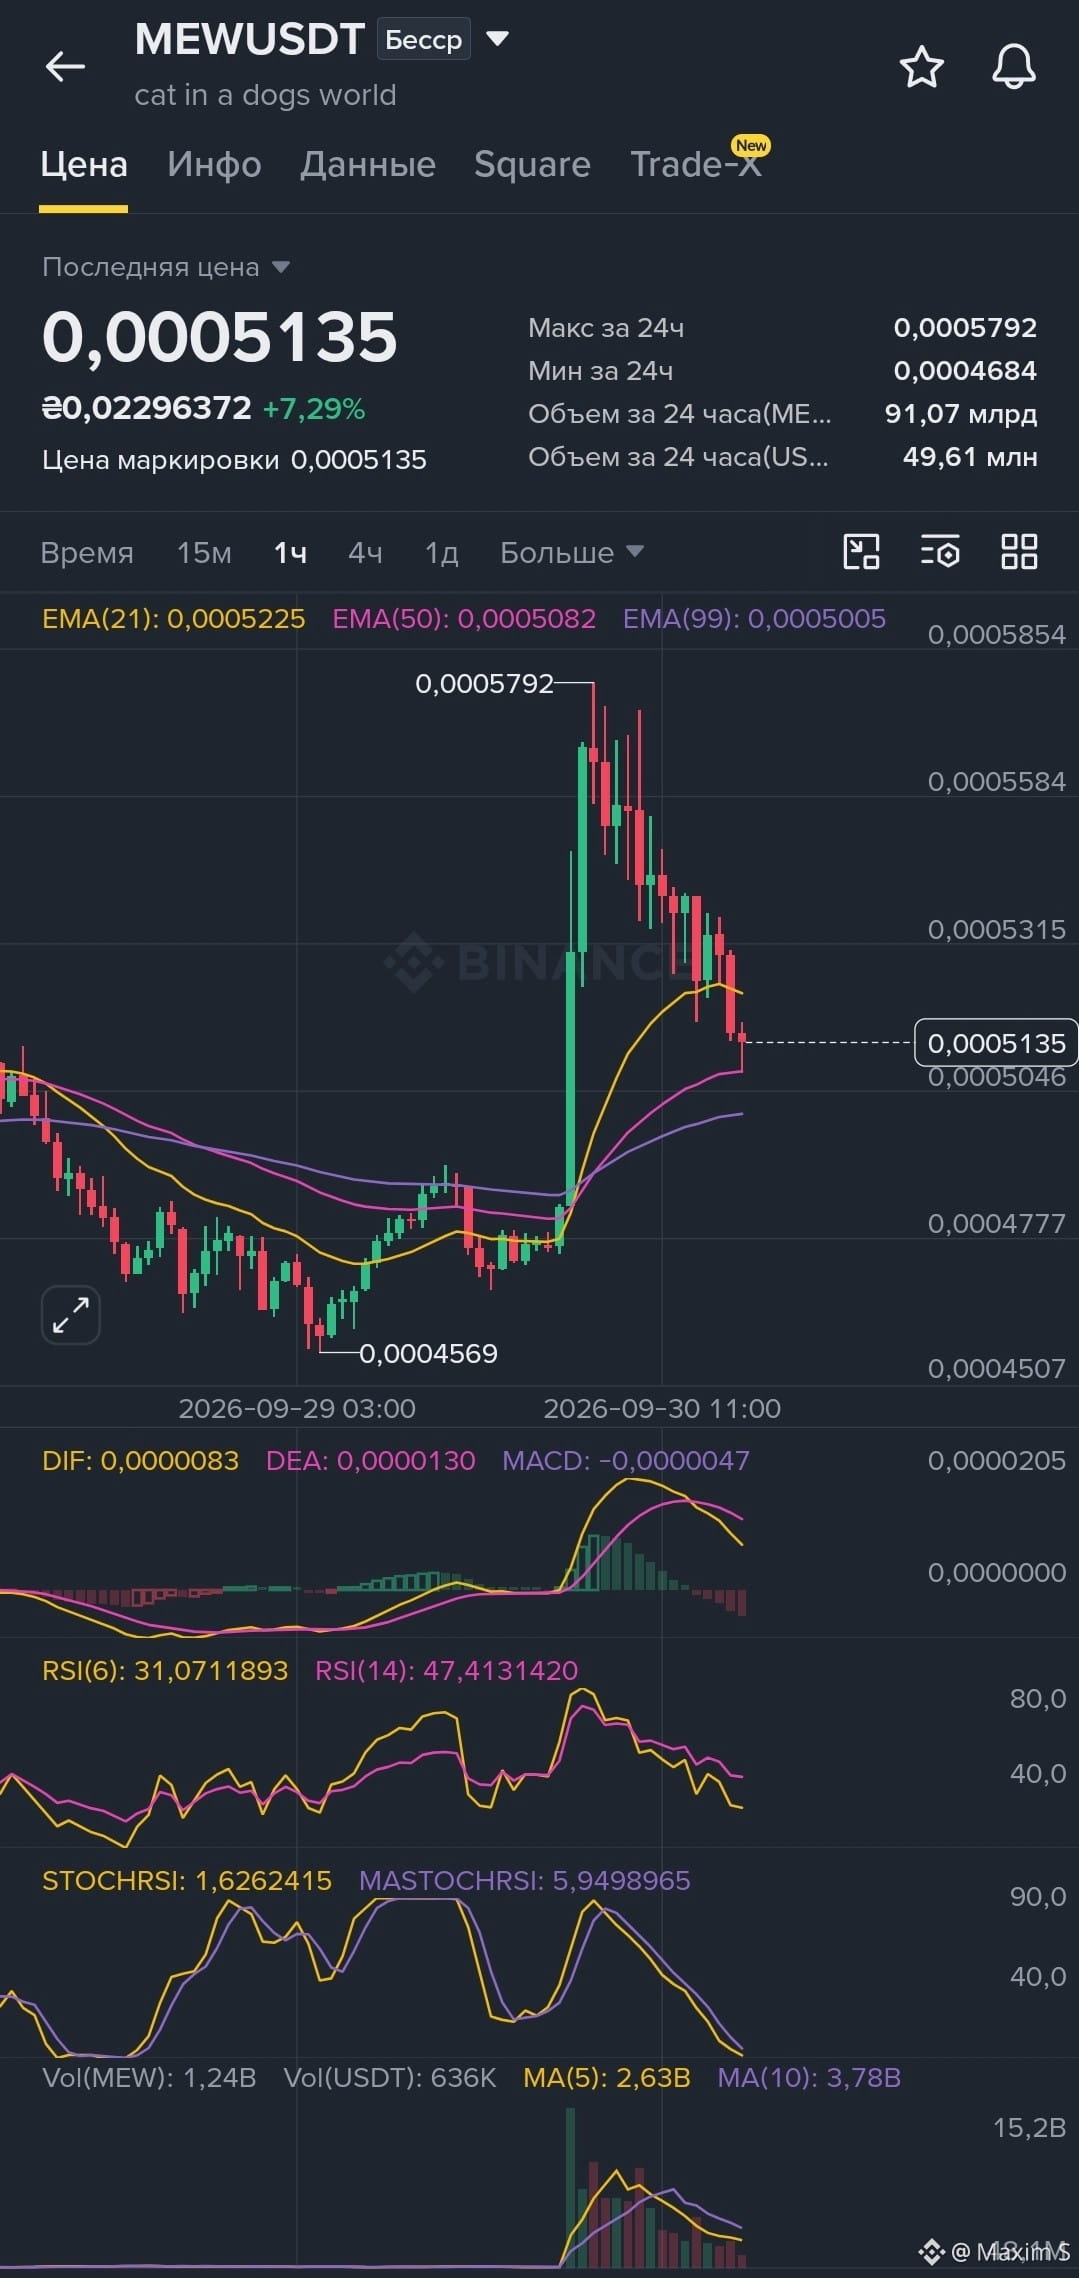
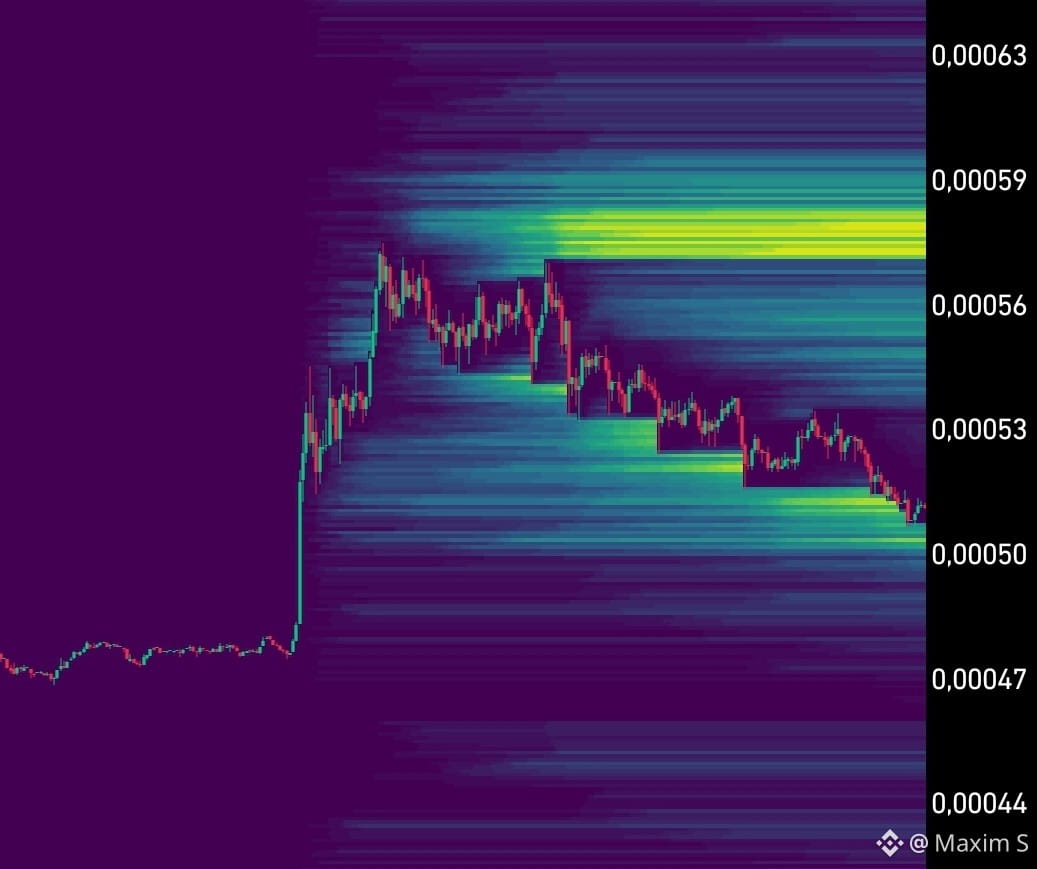
Structure: after a powerful impulse from 0,0004569 to 0,0005792, the price moved into a correction. Now MEW is pulling back to the EMA50 (0,0005082) and forming a pin bar here — the first reaction from buyers to this dynamic support.
📊 Indicators:
EMA99: 0,0005005 — additional support.
RSI6: 31 — close to oversold.
RSI14: 47 — neutral zone.
StochRSI: practically 0 — strong local oversold conditions.
MACD: the histogram is negative, but the main downward move has already slowed down significantly.
Volumes: after the impulsive spike, volumes are noticeably decreasing, which looks more like a correction.
🎯 Long scenario
Aggressive: 0,000508–0,000513 after a pin-bar confirmation.
Conservative: holding above EMA21 0,0005225.
TP1: 0,0005315
TP2: 0,0005580
TP3: 0,0005790
🛑 SL: below 0,0005000.
The key right now is holding EMA50. If the pin bar gets confirmation and the price returns above EMA21, the correction may end with a continuation of the upward move. A break below EMA99 will invalidate this scenario.
Trading 👉$MEW
{future}(MEWUSDT)
🔥 MEW/USDT
Structure: after a powerful impulse from 0,0004569 to 0,0005792, the price moved into a correction. Now MEW is pulling back to the EMA50 (0,0005082) and forming a pin bar here — the first reaction from buyers to this dynamic support.
📊 Indicators:
EMA99: 0,0005005 — additional support.
RSI6: 31 — close to oversold.
RSI14: 47 — neutral zone.
StochRSI: practically 0 — strong local oversold conditions.
MACD: the histogram is negative, but the main downward move has already slowed down significantly.
Volumes: after the impulsive spike, volumes are noticeably decreasing, which looks more like a correction.
🎯 Long scenario
Aggressive: 0,000508–0,000513 after a pin-bar confirmation.
Conservative: holding above EMA21 0,0005225.
TP1: 0,0005315
TP2: 0,0005580
TP3: 0,0005790
🛑 SL: below 0,0005000.
The key right now is holding EMA50. If the pin bar gets confirmation and the price returns above EMA21, the correction may end with a continuation of the upward move. A break below EMA99 will invalidate this scenario.
Trading 👉$MEW
Structure: after a powerful impulse from 0,0004569 to 0,0005792, the price moved into a correction. Now MEW is pulling back to the EMA50 (0,0005082) and forming a pin bar here — the first reaction from buyers to this dynamic support.
📊 Indicators:
EMA99: 0,0005005 — additional support.
RSI6: 31 — close to oversold.
RSI14: 47 — neutral zone.
StochRSI: practically 0 — strong local oversold conditions.
MACD: the histogram is negative, but the main downward move has already slowed down significantly.
Volumes: after the impulsive spike, volumes are noticeably decreasing, which looks more like a correction.
🎯 Long scenario
Aggressive: 0,000508–0,000513 after a pin-bar confirmation.
Conservative: holding above EMA21 0,0005225.
TP1: 0,0005315
TP2: 0,0005580
TP3: 0,0005790
🛑 SL: below 0,0005000.
The key right now is holding EMA50. If the pin bar gets confirmation and the price returns above EMA21, the correction may end with a continuation of the upward move. A break below EMA99 will invalidate this scenario.
Trading 👉$MEW
1
16
·
--
Bullish
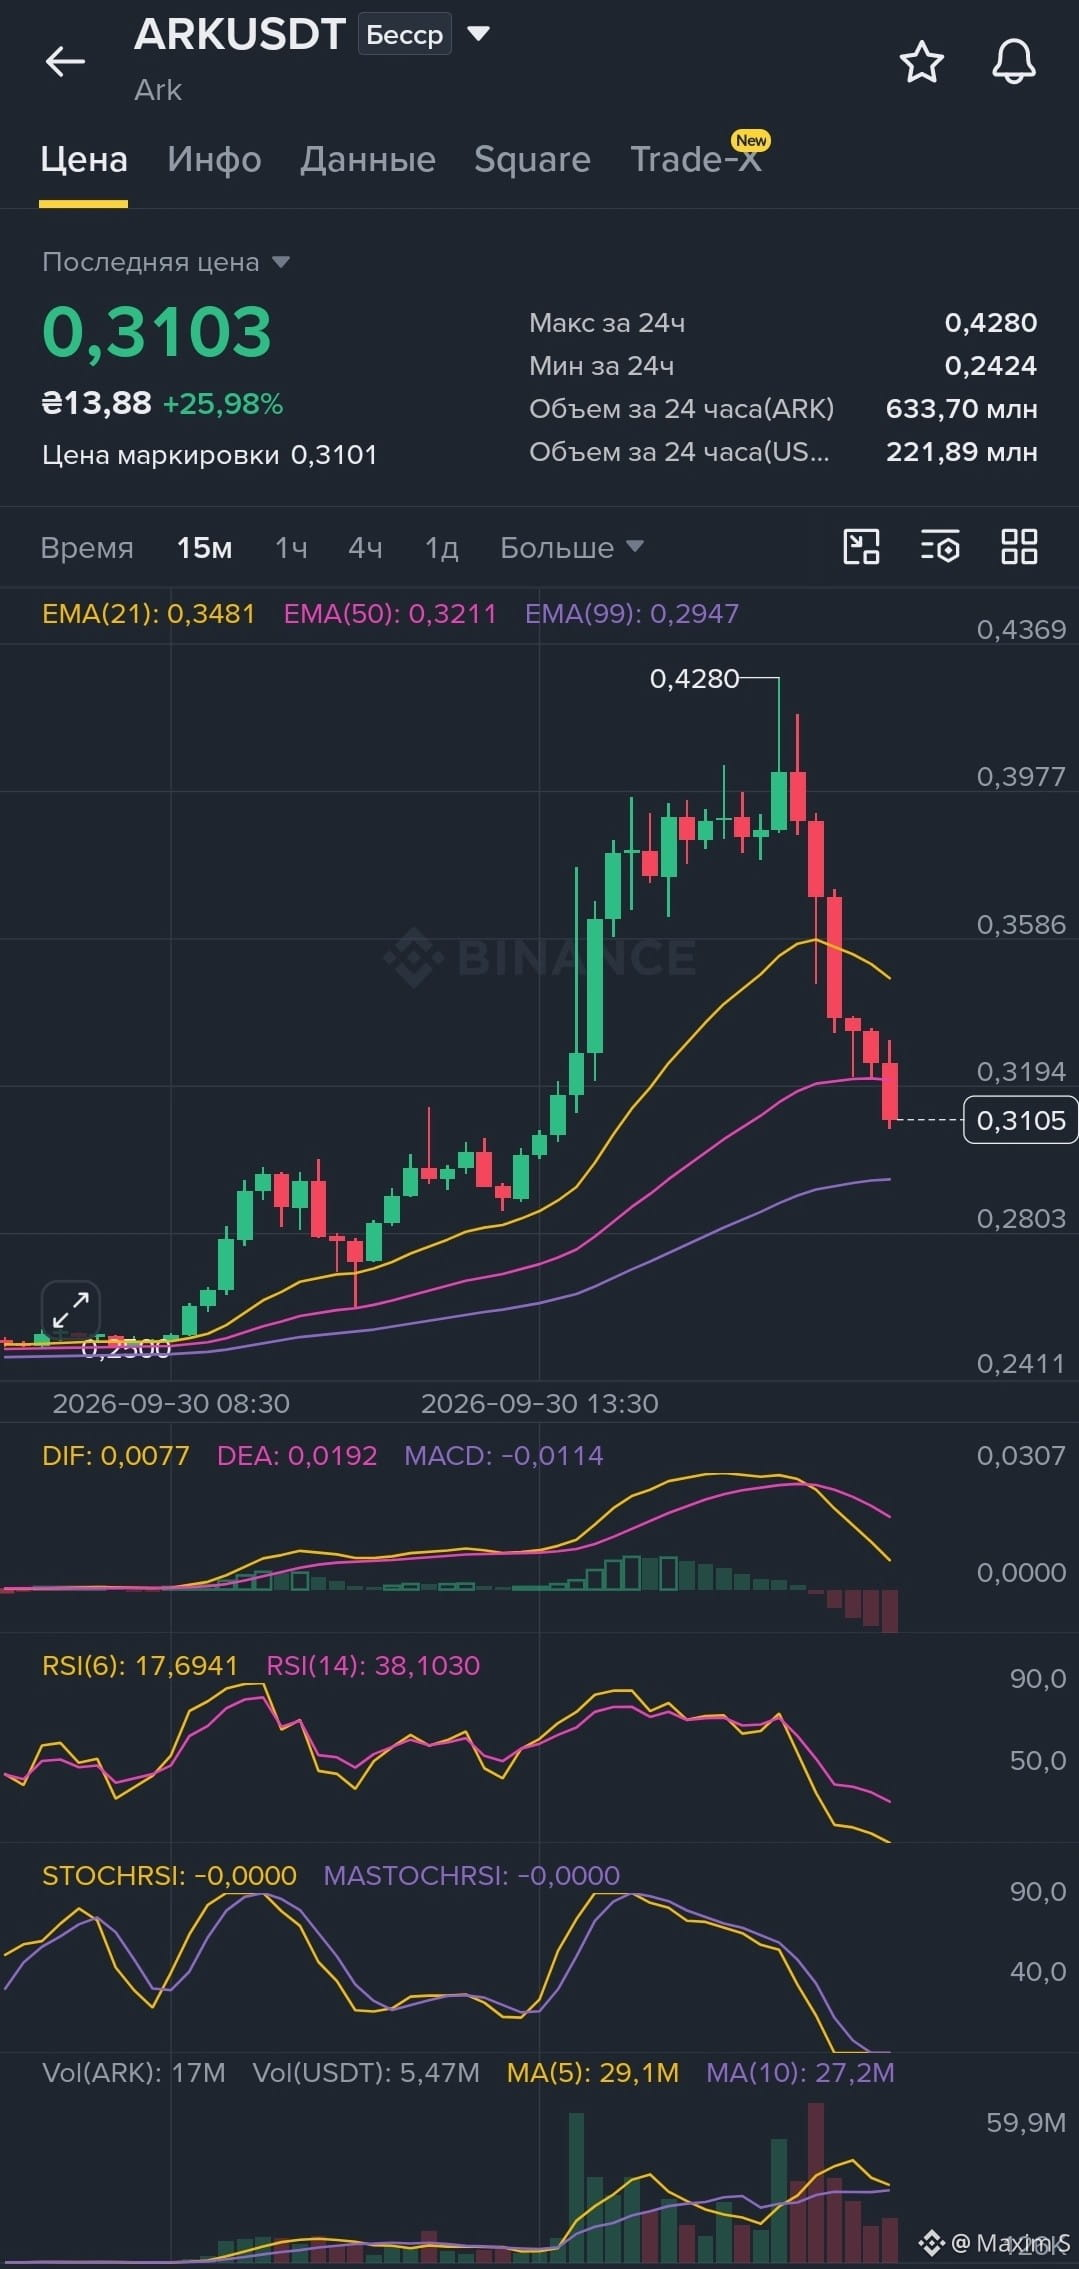
🔥 ARK: bounce off EMA99 — catching the move? 👀
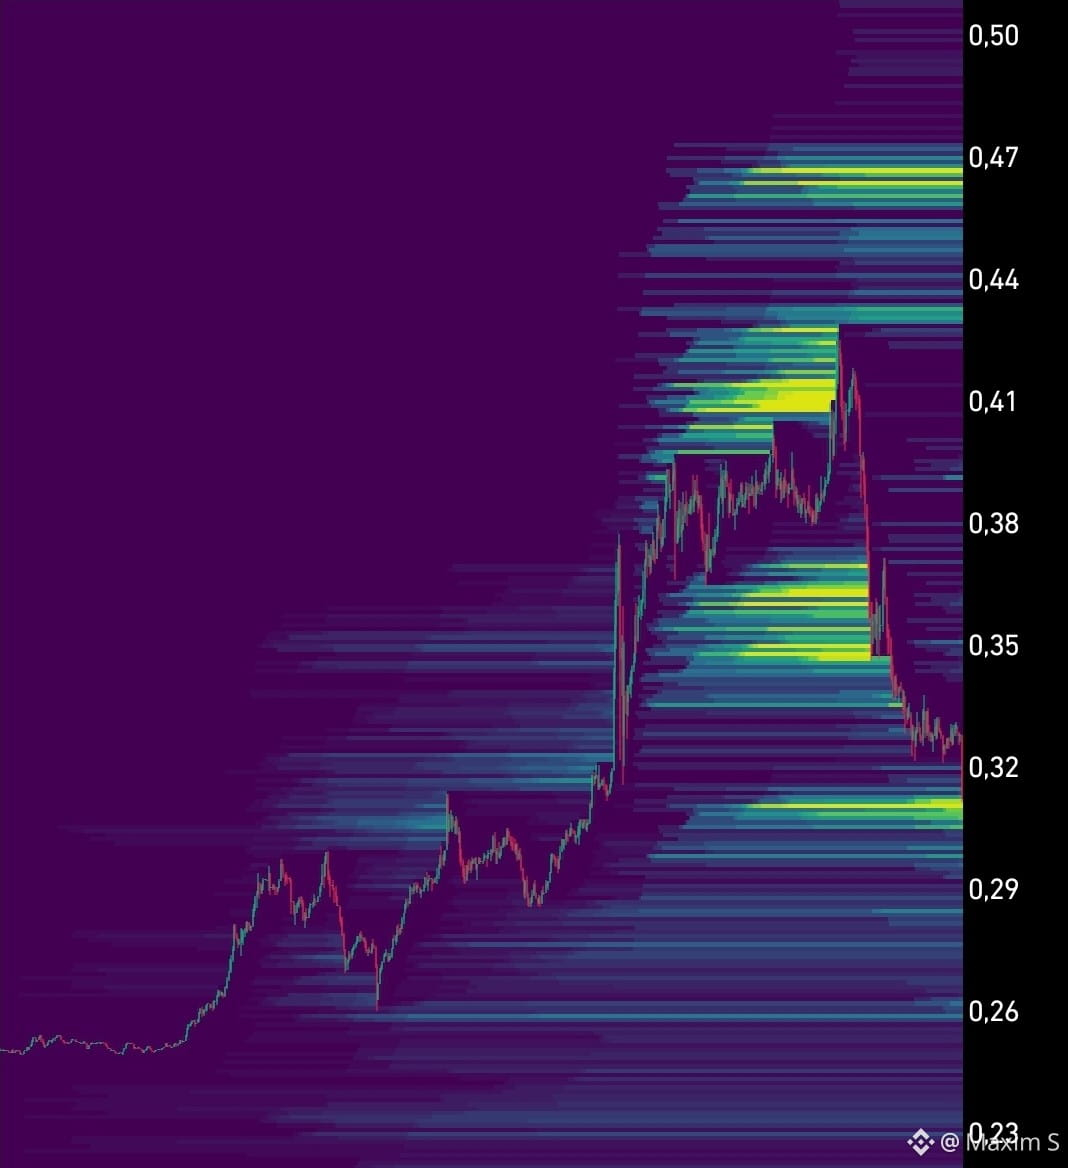
After a powerful impulse 0.25 → 0.428 (+70%), the asset went into a sharp correction and is currently holding below the EMA50. After the sell-off, volumes noticeably dropped; RSI(6) is around 27, and StochRSI is at the very bottom — sellers are gradually running out of steam.
📊 What matters: EMA21 > EMA50 > EMA99 — the 15m structure is bullish so far. But the MACD is still bearish, so entry needs to be controlled.
📈 Scenario: LONG
🔹 Conservative: consolidation above 0.325
🔸 Aggressive: from EMA99
🎯 TP1: 0.3498 (+6%)
🎯 TP2: 0.3720 (+13%)
🎯 TP3: 0.3977 (+21%)
🛑 SL: 0.3000 (~−4%)
⚠️ Closing below 0.315 cancels the scenario. The next support is EMA99 around 0.295.
Trading 👉$ARK
{future}(ARKUSDT)
🔥 ARK: bounce off EMA99 — catching the move? 👀
After a powerful impulse 0.25 → 0.428 (+70%), the asset went into a sharp correction and is currently holding below the EMA50. After the sell-off, volumes noticeably dropped; RSI(6) is around 27, and StochRSI is at the very bottom — sellers are gradually running out of steam.
📊 What matters: EMA21 > EMA50 > EMA99 — the 15m structure is bullish so far. But the MACD is still bearish, so entry needs to be controlled.
📈 Scenario: LONG
🔹 Conservative: consolidation above 0.325
🔸 Aggressive: from EMA99
🎯 TP1: 0.3498 (+6%)
🎯 TP2: 0.3720 (+13%)
🎯 TP3: 0.3977 (+21%)
🛑 SL: 0.3000 (~−4%)
⚠️ Closing below 0.315 cancels the scenario. The next support is EMA99 around 0.295.
Trading 👉$ARK
After a powerful impulse 0.25 → 0.428 (+70%), the asset went into a sharp correction and is currently holding below the EMA50. After the sell-off, volumes noticeably dropped; RSI(6) is around 27, and StochRSI is at the very bottom — sellers are gradually running out of steam.
📊 What matters: EMA21 > EMA50 > EMA99 — the 15m structure is bullish so far. But the MACD is still bearish, so entry needs to be controlled.
📈 Scenario: LONG
🔹 Conservative: consolidation above 0.325
🔸 Aggressive: from EMA99
🎯 TP1: 0.3498 (+6%)
🎯 TP2: 0.3720 (+13%)
🎯 TP3: 0.3977 (+21%)
🛑 SL: 0.3000 (~−4%)
⚠️ Closing below 0.315 cancels the scenario. The next support is EMA99 around 0.295.
Trading 👉$ARK
1
56
·
--
Bullish
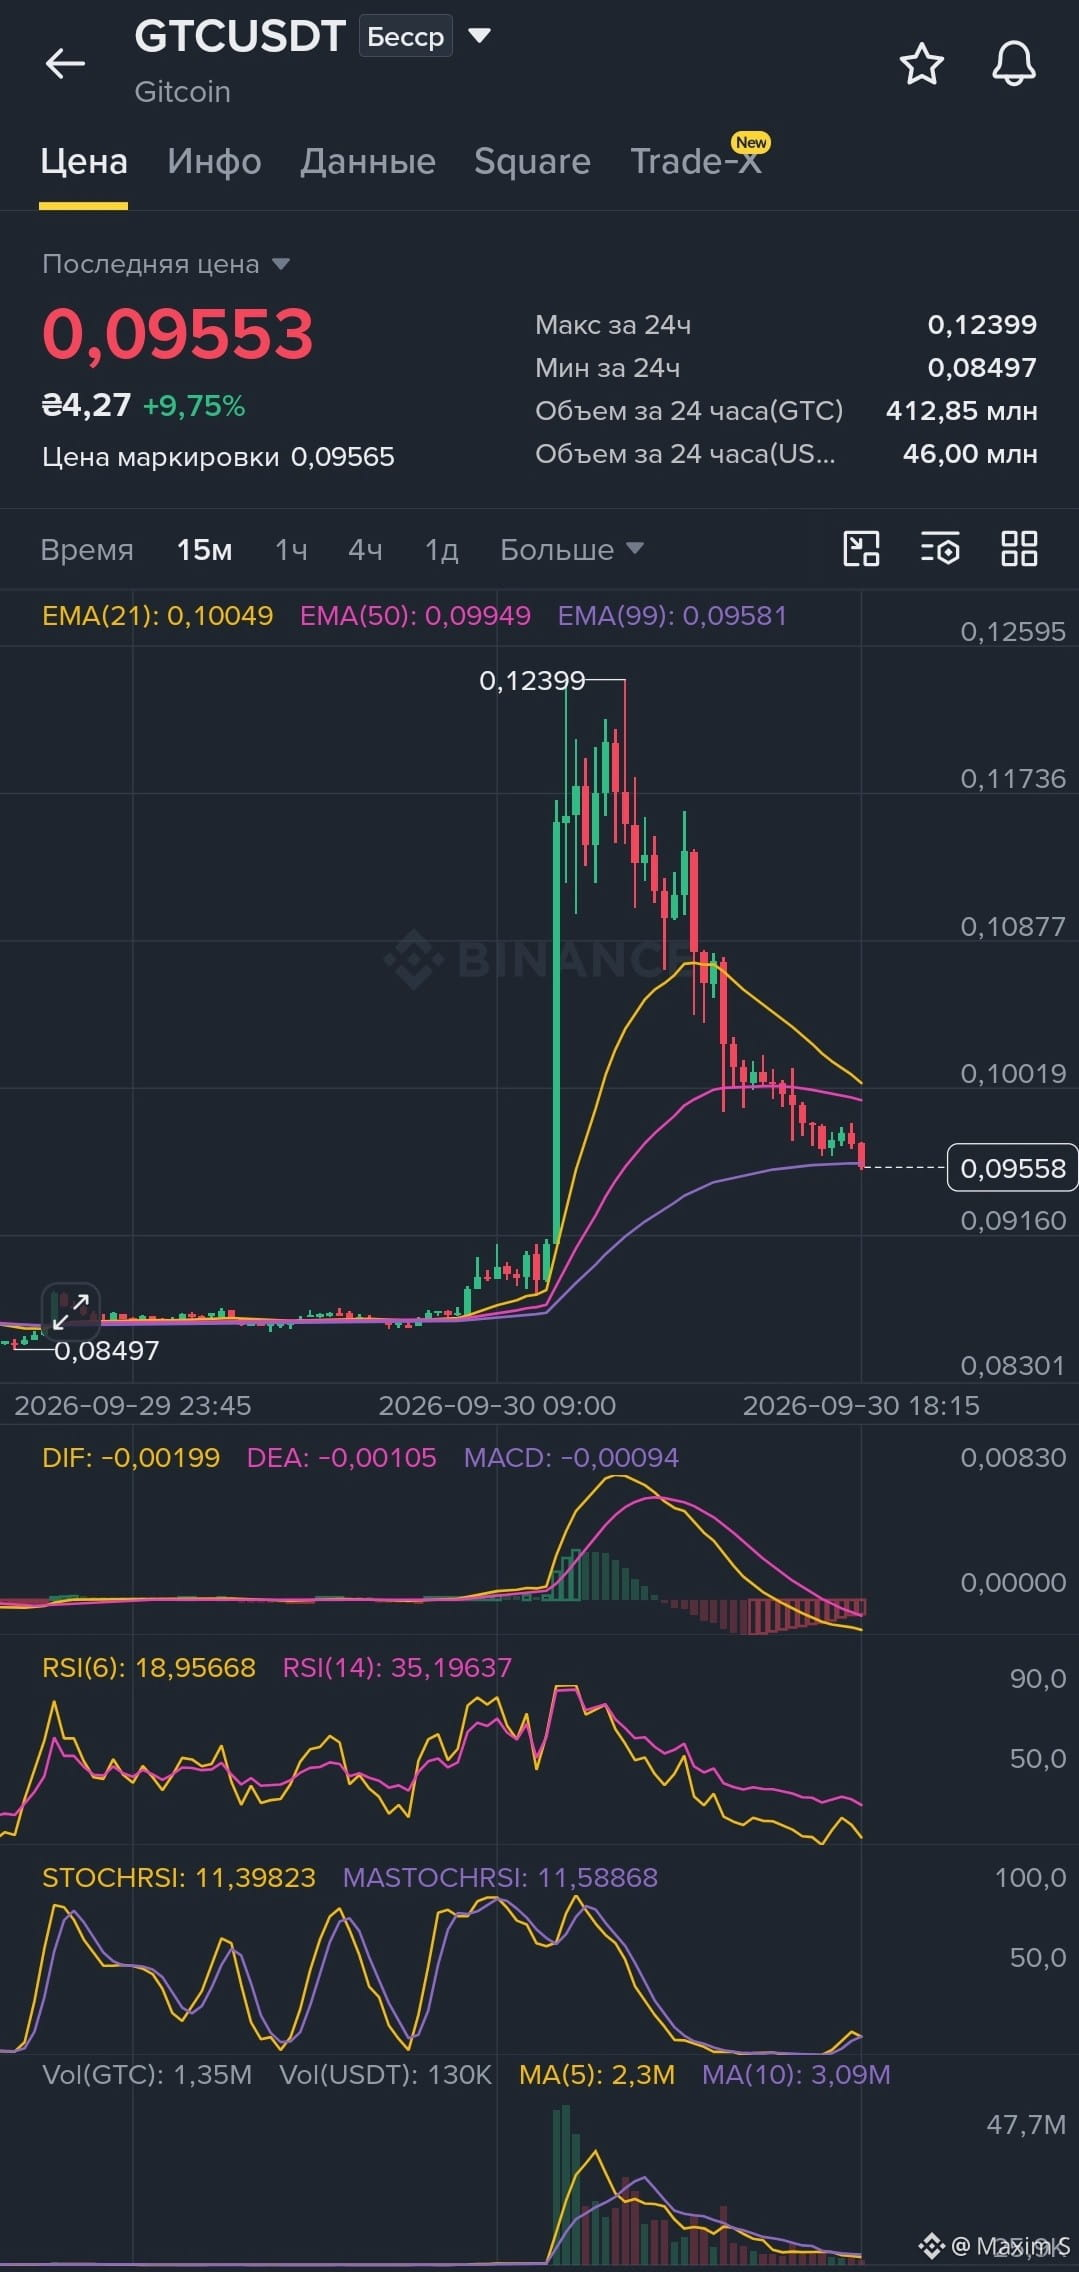
GTC/USDT: Is a second impulse being prepared after the sell-off? 🚀
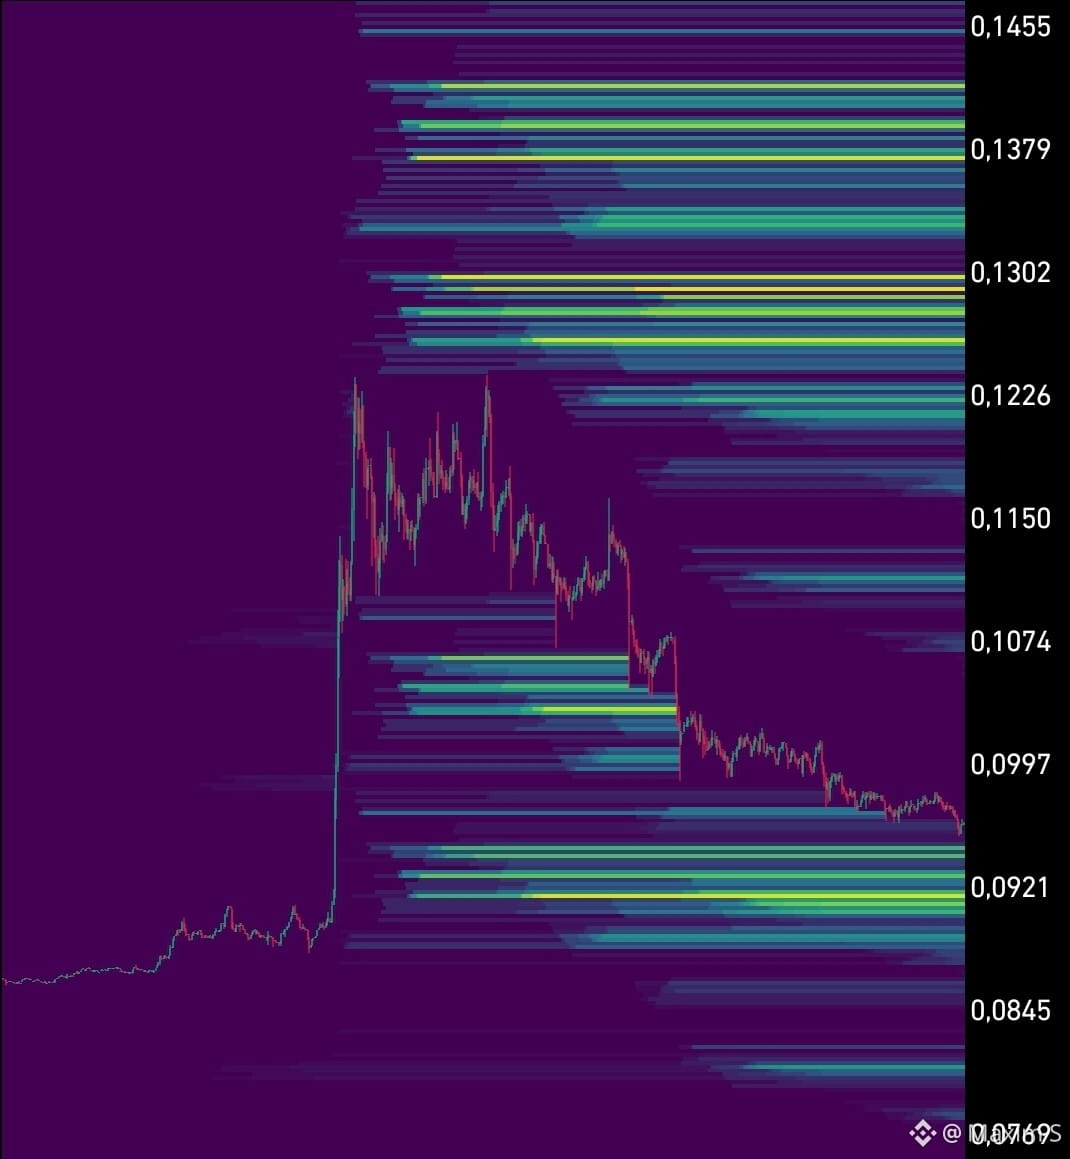
After a powerful surge from $0.085 to $0.124, the coin went into a logical, steady pullback. Now the price is squeezed in a key support zone around the EMA(99). The RSI and StochRSI indicators have fully cooled down and entered the deep oversold area, hinting at an upcoming local rebound.
📊 Trading plan: LONG (Main scenario)
We consider the current fading of selling pressure a good opportunity to enter with a clear risk profile and potential for a reactive upward move.
Aggressive entry: $0.0950 – $0.0958 (buy from the current support levels of EMA(99) from the market).
Conservative entry: $0.1005 (entry after the price consolidates above EMA(21) / EMA(50) on the 15-minute timeframe).
🎯 Move targets:
Take-Profit 1: $0.1020 (+6.8% — return to the averages)
Take-Profit 2: $0.1110 (+16.2% — breaking through the 50% Fib retracement)
Take-Profit 3: $0.1220 (+27.7% — retesting the local high)
🛡 Stop-loss: $0.0910 (-4.7% from the aggressive entry point, below the local consolidation level)
Trade 👉$GTC
{future}(GTCUSDT)
GTC/USDT: Is a second impulse being prepared after the sell-off? 🚀
After a powerful surge from $0.085 to $0.124, the coin went into a logical, steady pullback. Now the price is squeezed in a key support zone around the EMA(99). The RSI and StochRSI indicators have fully cooled down and entered the deep oversold area, hinting at an upcoming local rebound.
📊 Trading plan: LONG (Main scenario)
We consider the current fading of selling pressure a good opportunity to enter with a clear risk profile and potential for a reactive upward move.
Aggressive entry: $0.0950 – $0.0958 (buy from the current support levels of EMA(99) from the market).
Conservative entry: $0.1005 (entry after the price consolidates above EMA(21) / EMA(50) on the 15-minute timeframe).
🎯 Move targets:
Take-Profit 1: $0.1020 (+6.8% — return to the averages)
Take-Profit 2: $0.1110 (+16.2% — breaking through the 50% Fib retracement)
Take-Profit 3: $0.1220 (+27.7% — retesting the local high)
🛡 Stop-loss: $0.0910 (-4.7% from the aggressive entry point, below the local consolidation level)
Trade 👉$GTC
After a powerful surge from $0.085 to $0.124, the coin went into a logical, steady pullback. Now the price is squeezed in a key support zone around the EMA(99). The RSI and StochRSI indicators have fully cooled down and entered the deep oversold area, hinting at an upcoming local rebound.
📊 Trading plan: LONG (Main scenario)
We consider the current fading of selling pressure a good opportunity to enter with a clear risk profile and potential for a reactive upward move.
Aggressive entry: $0.0950 – $0.0958 (buy from the current support levels of EMA(99) from the market).
Conservative entry: $0.1005 (entry after the price consolidates above EMA(21) / EMA(50) on the 15-minute timeframe).
🎯 Move targets:
Take-Profit 1: $0.1020 (+6.8% — return to the averages)
Take-Profit 2: $0.1110 (+16.2% — breaking through the 50% Fib retracement)
Take-Profit 3: $0.1220 (+27.7% — retesting the local high)
🛡 Stop-loss: $0.0910 (-4.7% from the aggressive entry point, below the local consolidation level)
Trade 👉$GTC
1
47
·
--
Bullish
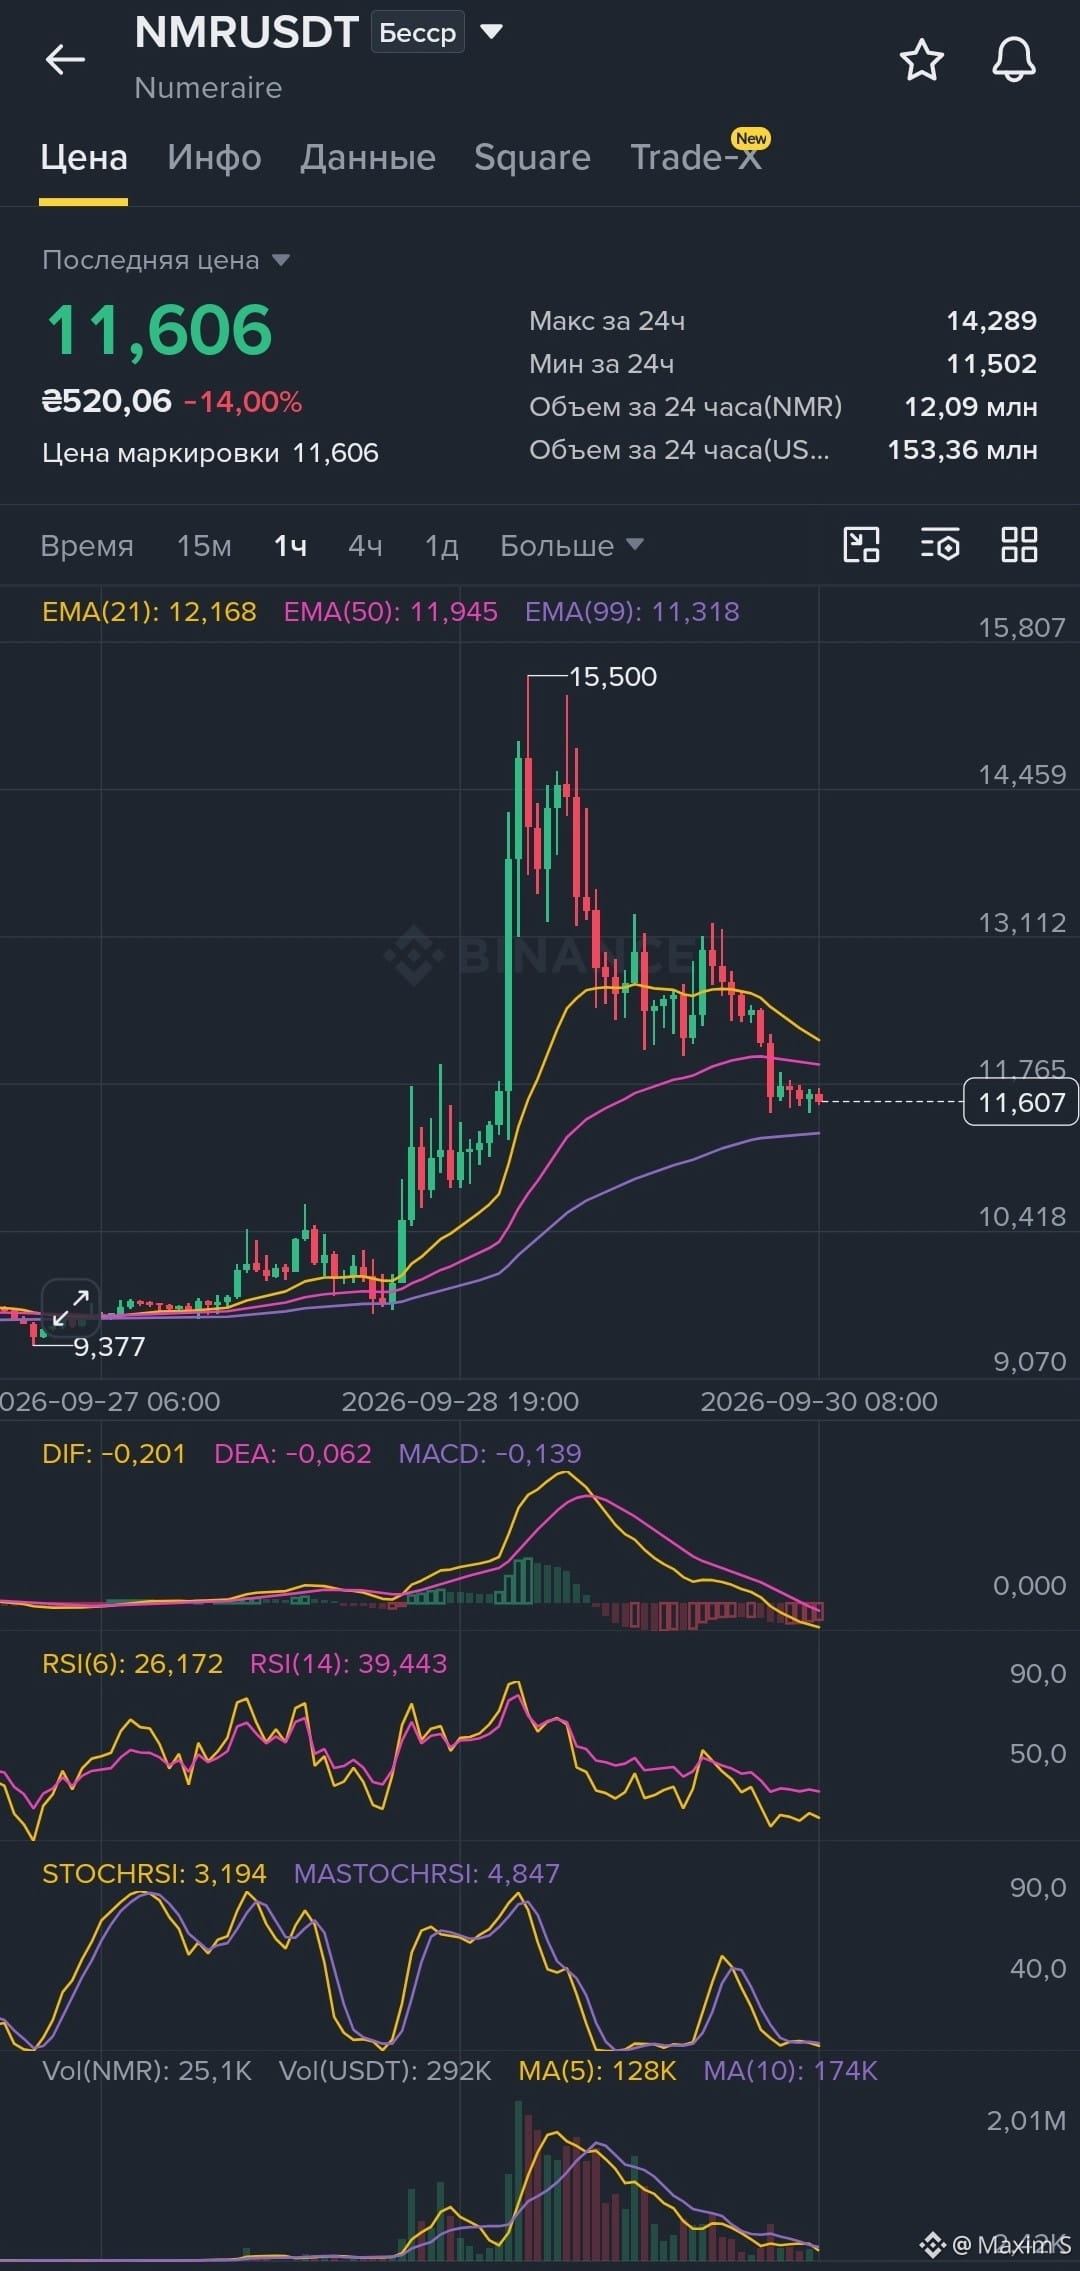
🎯 NMR: oversold near EMA99 — is a rebound being prepared?
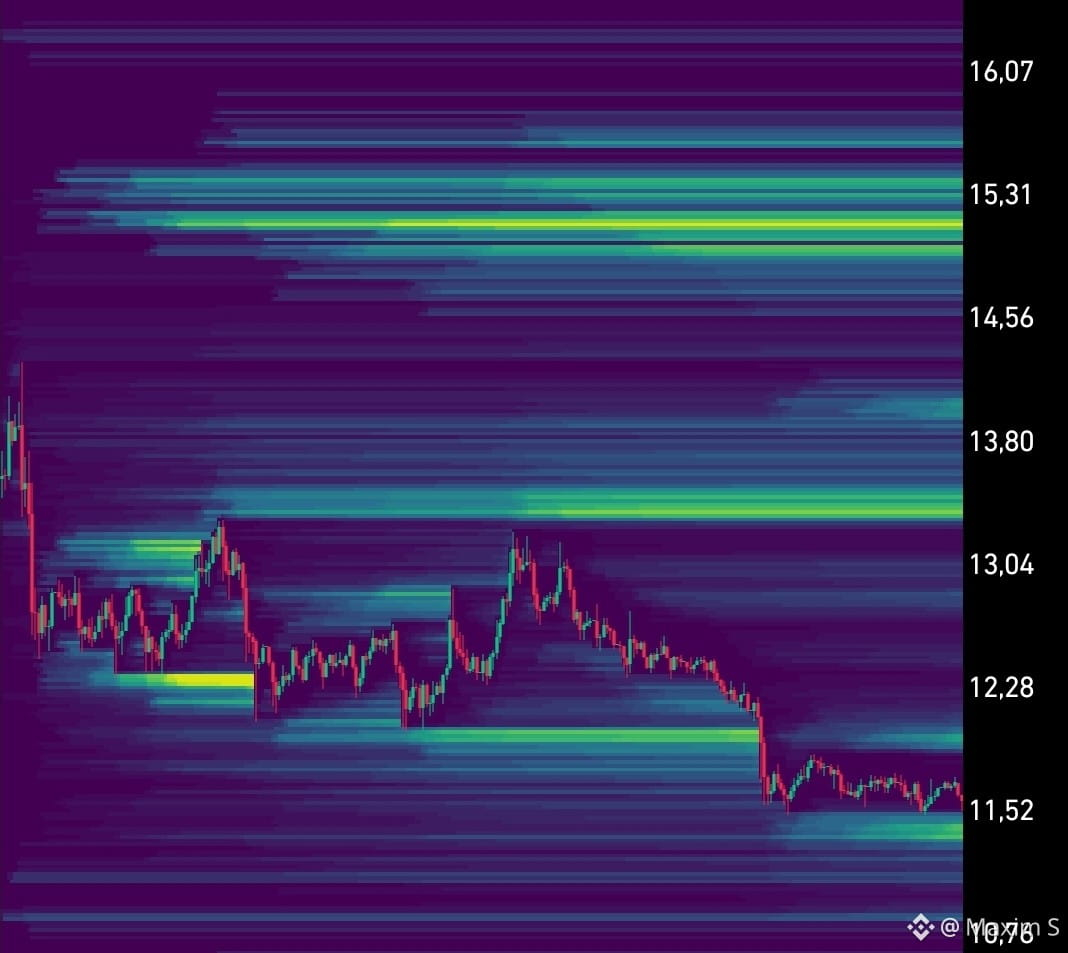
After the impulse to 15.5, the price pulled back by ~25% and compressed at EMA99 (11.32) — the latest dynamic support.
📊 Indicators: RSI(6) = 26, RSI(14) = 39 — oversold.
StochRSI = 3/4.8 — extreme bottom.
MACD is bearish, but the histogram is contracting — selling pressure is weakening.
Volume has sharply dropped: 25K vs MA5 128K.
📈 Scenario: LONG
🔹 Aggressive: 11.55–11.65
🔹 Conservative: after a 1h close above 11.80
🎯 TP1: 11.95 (+3%)
🎯 TP2: 12.17 (+5%)
🎯 TP3: 13.00 (+12%)
🛑 SL: 11.20 (−3%)
A break of 11.30 invalidates the scenario and opens the way to ~10.4. Wait for confirmation, don’t catch a falling knife. DYOR.
Trading 👉$NMR
{future}(NMRUSDT)
🎯 NMR: oversold near EMA99 — is a rebound being prepared?
After the impulse to 15.5, the price pulled back by ~25% and compressed at EMA99 (11.32) — the latest dynamic support.
📊 Indicators: RSI(6) = 26, RSI(14) = 39 — oversold.
StochRSI = 3/4.8 — extreme bottom.
MACD is bearish, but the histogram is contracting — selling pressure is weakening.
Volume has sharply dropped: 25K vs MA5 128K.
📈 Scenario: LONG
🔹 Aggressive: 11.55–11.65
🔹 Conservative: after a 1h close above 11.80
🎯 TP1: 11.95 (+3%)
🎯 TP2: 12.17 (+5%)
🎯 TP3: 13.00 (+12%)
🛑 SL: 11.20 (−3%)
A break of 11.30 invalidates the scenario and opens the way to ~10.4. Wait for confirmation, don’t catch a falling knife. DYOR.
Trading 👉$NMR
After the impulse to 15.5, the price pulled back by ~25% and compressed at EMA99 (11.32) — the latest dynamic support.
📊 Indicators: RSI(6) = 26, RSI(14) = 39 — oversold.
StochRSI = 3/4.8 — extreme bottom.
MACD is bearish, but the histogram is contracting — selling pressure is weakening.
Volume has sharply dropped: 25K vs MA5 128K.
📈 Scenario: LONG
🔹 Aggressive: 11.55–11.65
🔹 Conservative: after a 1h close above 11.80
🎯 TP1: 11.95 (+3%)
🎯 TP2: 12.17 (+5%)
🎯 TP3: 13.00 (+12%)
🛑 SL: 11.20 (−3%)
A break of 11.30 invalidates the scenario and opens the way to ~10.4. Wait for confirmation, don’t catch a falling knife. DYOR.
Trading 👉$NMR
1
4
260
·
--
Bullish
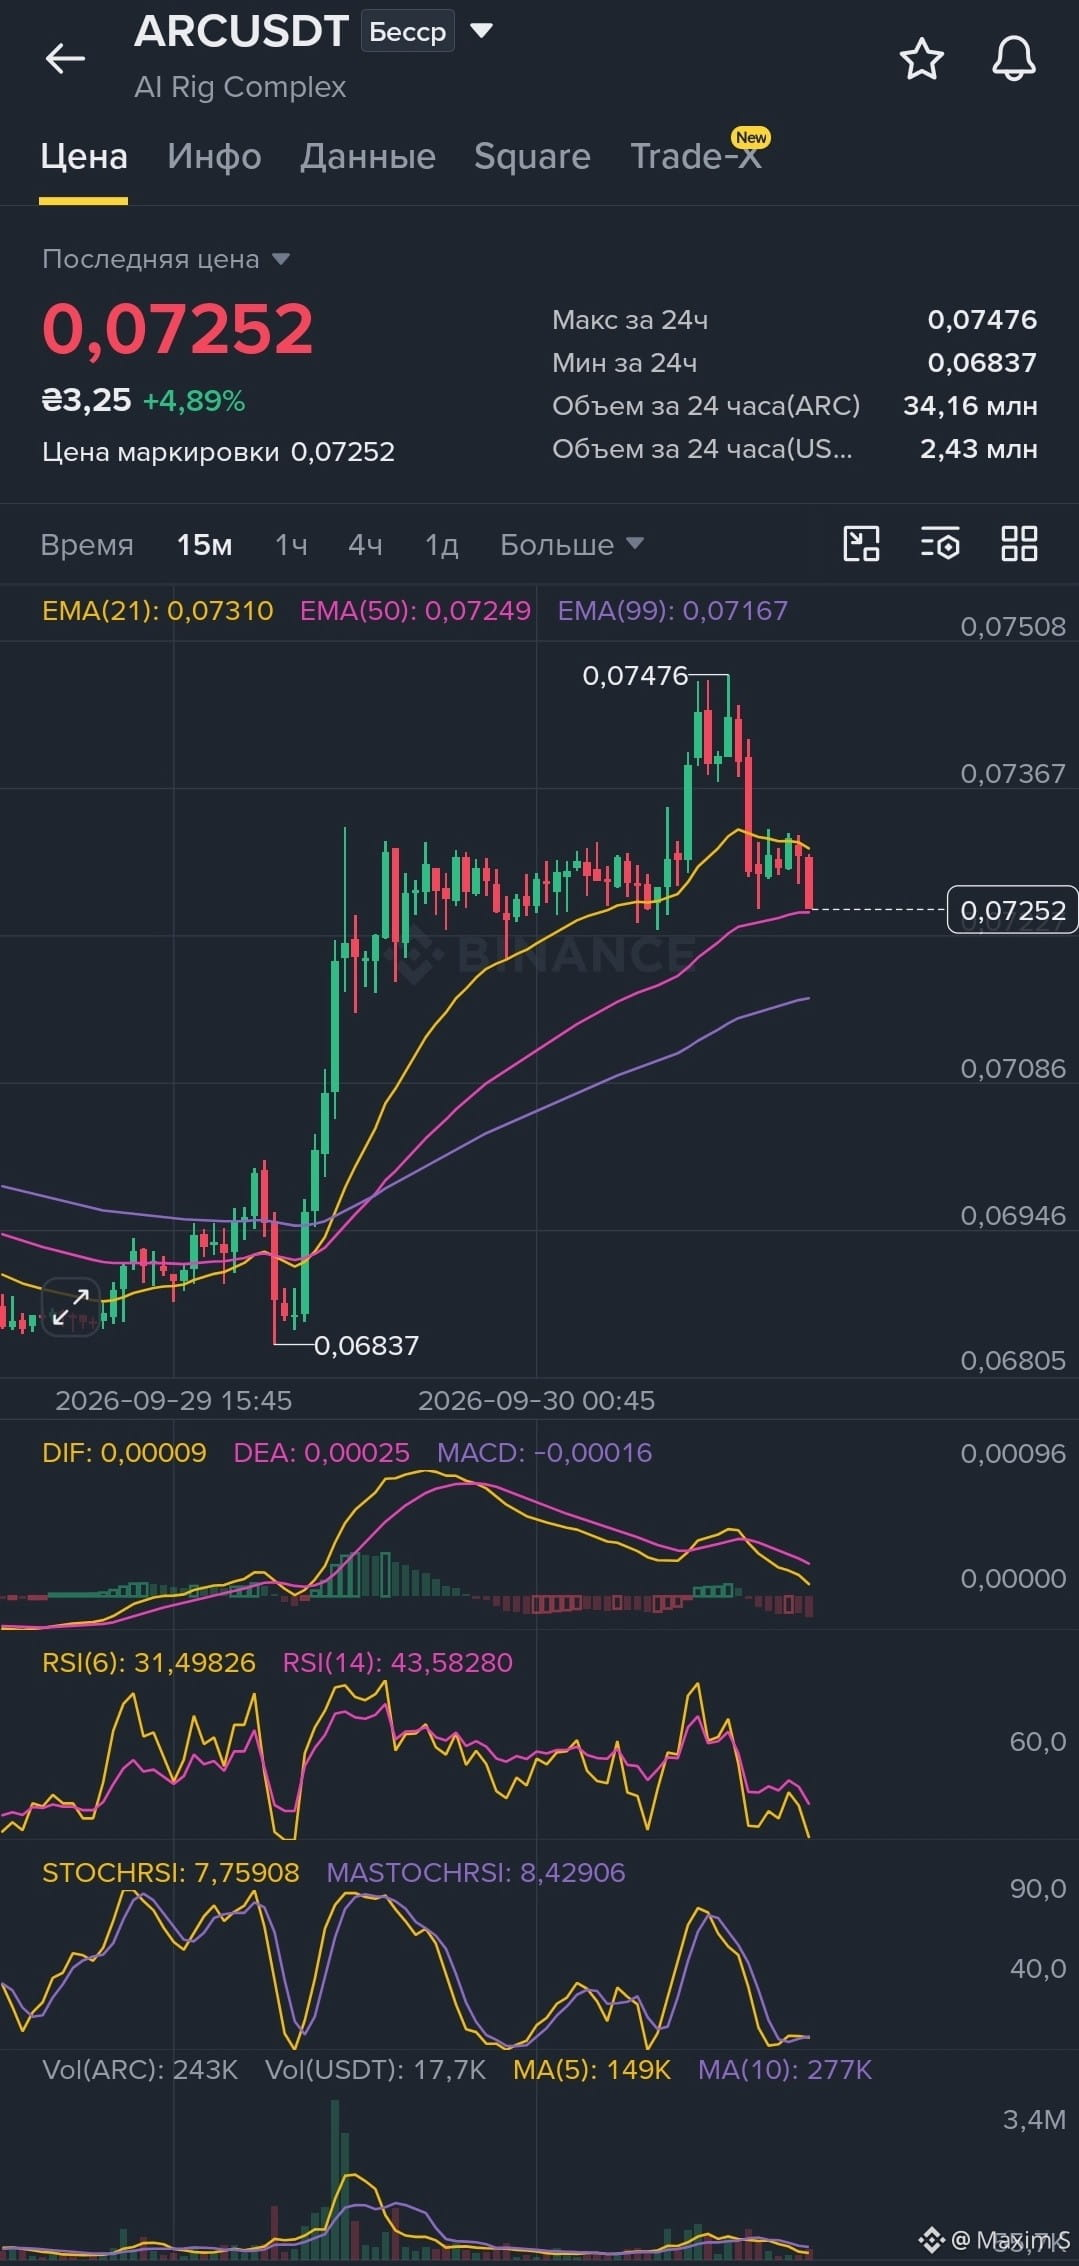
ARC/USDT: Preparing for a new impulse? A look at 15M
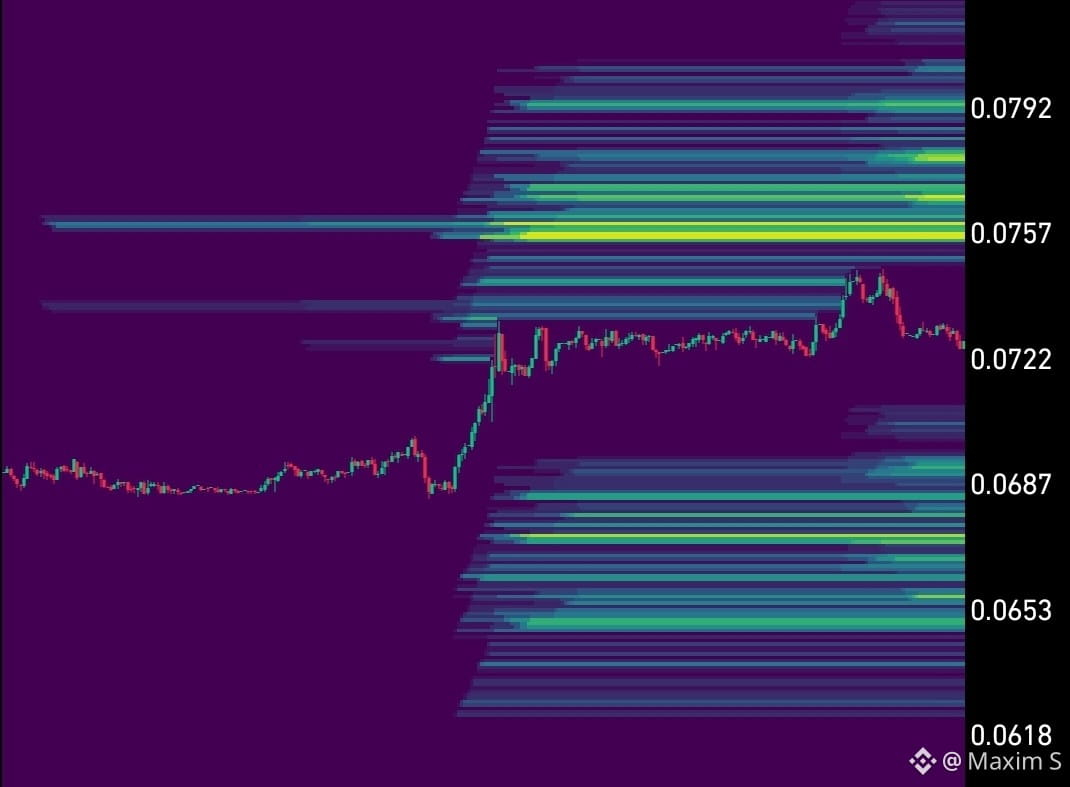
After a strong bullish surge to 0.07476, the $ARC pair moved into a phase of smooth correction. Right now, the price is squeezed within a narrow range around the key support of the EMA50 (0.07249), forming a structure in anticipation of a possible continuation of the trend.
What do the indicators say?
RSI and StochRSI have eased off and entered the zone of deep oversold conditions (StochRSI < 8). Trading volumes during the decline are falling, indicating that sellers are losing momentum while the level is being held by buyers.
📈 TRADING PLAN (Main scenario: LONG)
Aggressive entry: 0.07230 – 0.07255 USDT (current EMA50 support zone).
Conservative entry: 0.07160 – 0.07180 USDT (retest of EMA99 and the lower boundary of the squeeze).
🎯 Targets:
0.07320 USDT (+1.0% – breakout of EMA21)
0.07470 USDT (+3.0% – retest of the local high)
0.07680 USDT (+6.0% – new highs and exit from the consolidation)
🛡 Stop-loss: 0.07080 USDT (below the EMA99 level and the local low).
Trade 👉$ARC
{future}(ARCUSDT)
ARC/USDT: Preparing for a new impulse? A look at 15M
After a strong bullish surge to 0.07476, the $ARC pair moved into a phase of smooth correction. Right now, the price is squeezed within a narrow range around the key support of the EMA50 (0.07249), forming a structure in anticipation of a possible continuation of the trend.
What do the indicators say?
RSI and StochRSI have eased off and entered the zone of deep oversold conditions (StochRSI < 8). Trading volumes during the decline are falling, indicating that sellers are losing momentum while the level is being held by buyers.
📈 TRADING PLAN (Main scenario: LONG)
Aggressive entry: 0.07230 – 0.07255 USDT (current EMA50 support zone).
Conservative entry: 0.07160 – 0.07180 USDT (retest of EMA99 and the lower boundary of the squeeze).
🎯 Targets:
0.07320 USDT (+1.0% – breakout of EMA21)
0.07470 USDT (+3.0% – retest of the local high)
0.07680 USDT (+6.0% – new highs and exit from the consolidation)
🛡 Stop-loss: 0.07080 USDT (below the EMA99 level and the local low).
Trade 👉$ARC
After a strong bullish surge to 0.07476, the $ARC pair moved into a phase of smooth correction. Right now, the price is squeezed within a narrow range around the key support of the EMA50 (0.07249), forming a structure in anticipation of a possible continuation of the trend.
What do the indicators say?
RSI and StochRSI have eased off and entered the zone of deep oversold conditions (StochRSI < 8). Trading volumes during the decline are falling, indicating that sellers are losing momentum while the level is being held by buyers.
📈 TRADING PLAN (Main scenario: LONG)
Aggressive entry: 0.07230 – 0.07255 USDT (current EMA50 support zone).
Conservative entry: 0.07160 – 0.07180 USDT (retest of EMA99 and the lower boundary of the squeeze).
🎯 Targets:
0.07320 USDT (+1.0% – breakout of EMA21)
0.07470 USDT (+3.0% – retest of the local high)
0.07680 USDT (+6.0% – new highs and exit from the consolidation)
🛡 Stop-loss: 0.07080 USDT (below the EMA99 level and the local low).
Trade 👉$ARC
2
419
·
--
Bullish
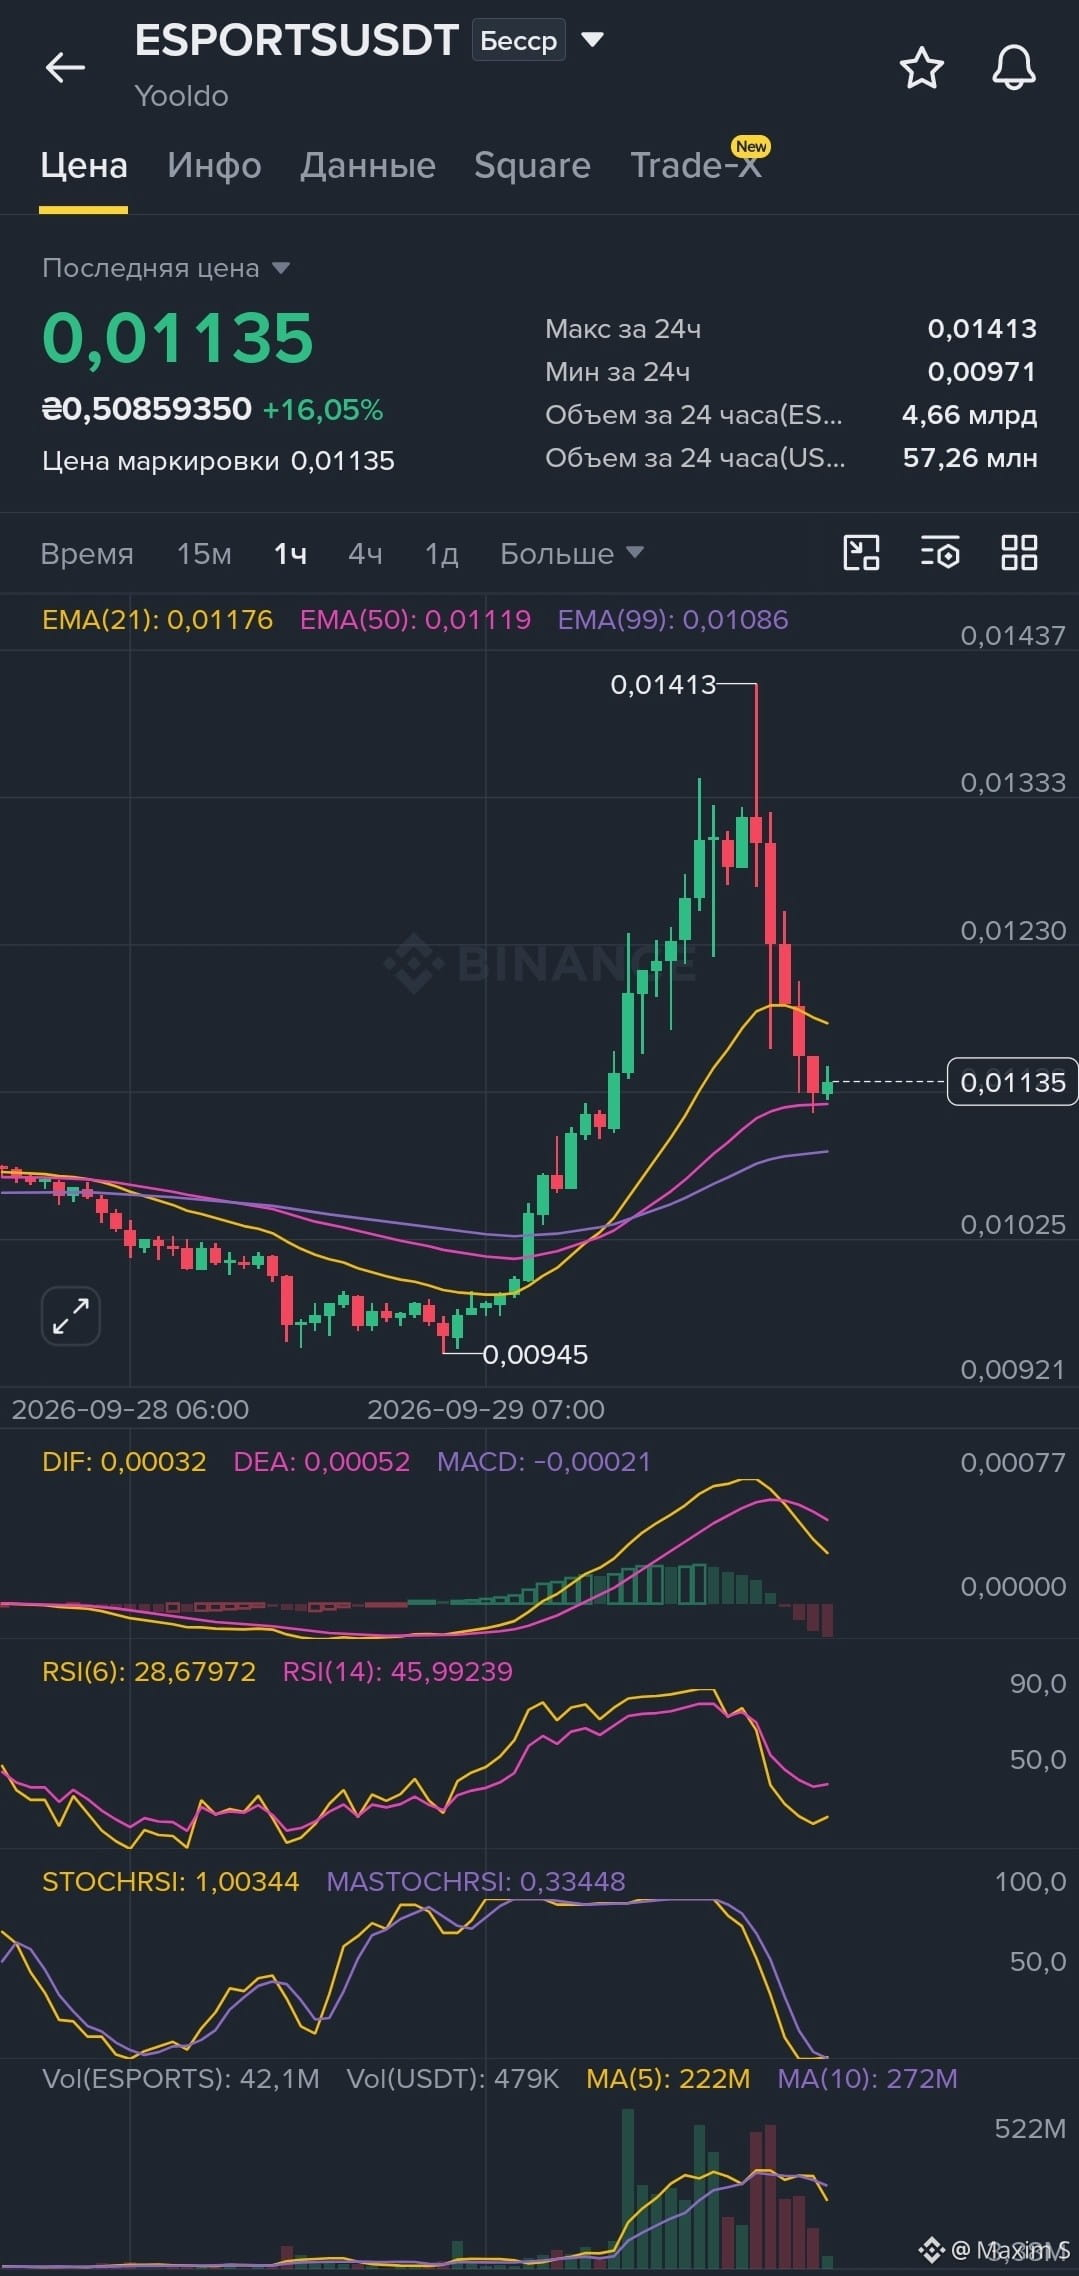
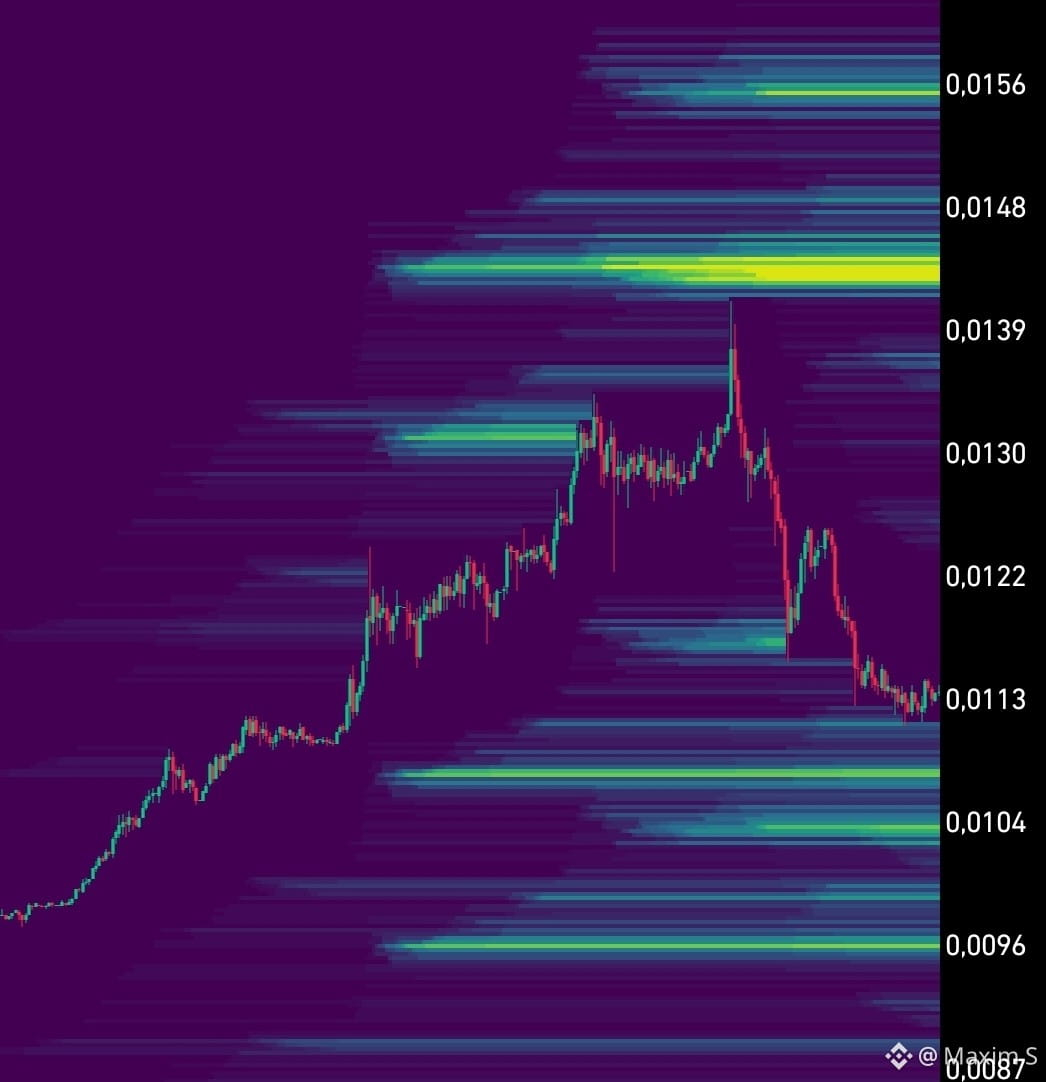
🔥 ESPORTS/USDT: Did we feel the bottom before the new impulse?
After a powerful surge from $0.00945 to a high of $0.01413, the price has gone through the necessary technical cooldown. Right now, we’re seeing a classic smooth pullback directly into the dynamic support zone EMA(50) ($0.01119). In this area, the price compresses, slowing the decline—something that often precedes a bullish reversal.
📊 What the indicators say?
• RSI (6) dropped to 28.67 — deep oversold conditions on the 1H timeframe.
• Stoch RSI fell to the very bottom (1.00).
• EMA(99) at 0.01086 will serve as a reliable safety net.
All oscillators point to this: the correction is running out of steam, and the market is ready for another retest of the highs.
📈 Trading plan (Main scenario: LONG)
• Conservative entry: 0.01177 (after a candle close above EMA21)
• Aggressive entry: 0.01120 – 0.01135 (from the current price / from EMA50)
🎯 Targets:
$0.01230 (+8.3% / +4.2%)
$0.01330 (+17.1% / +12.7%)
$0.01410 (+24.2% / +19.5%)
🛡 Stop-loss: 0.01070 (below the EMA99 level)
Trading 👉$ESPORTS
{future}(ESPORTSUSDT)
🔥 ESPORTS/USDT: Did we feel the bottom before the new impulse?
After a powerful surge from $0.00945 to a high of $0.01413, the price has gone through the necessary technical cooldown. Right now, we’re seeing a classic smooth pullback directly into the dynamic support zone EMA(50) ($0.01119). In this area, the price compresses, slowing the decline—something that often precedes a bullish reversal.
📊 What the indicators say?
• RSI (6) dropped to 28.67 — deep oversold conditions on the 1H timeframe.
• Stoch RSI fell to the very bottom (1.00).
• EMA(99) at 0.01086 will serve as a reliable safety net.
All oscillators point to this: the correction is running out of steam, and the market is ready for another retest of the highs.
📈 Trading plan (Main scenario: LONG)
• Conservative entry: 0.01177 (after a candle close above EMA21)
• Aggressive entry: 0.01120 – 0.01135 (from the current price / from EMA50)
🎯 Targets:
$0.01230 (+8.3% / +4.2%)
$0.01330 (+17.1% / +12.7%)
$0.01410 (+24.2% / +19.5%)
🛡 Stop-loss: 0.01070 (below the EMA99 level)
Trading 👉$ESPORTS
After a powerful surge from $0.00945 to a high of $0.01413, the price has gone through the necessary technical cooldown. Right now, we’re seeing a classic smooth pullback directly into the dynamic support zone EMA(50) ($0.01119). In this area, the price compresses, slowing the decline—something that often precedes a bullish reversal.
📊 What the indicators say?
• RSI (6) dropped to 28.67 — deep oversold conditions on the 1H timeframe.
• Stoch RSI fell to the very bottom (1.00).
• EMA(99) at 0.01086 will serve as a reliable safety net.
All oscillators point to this: the correction is running out of steam, and the market is ready for another retest of the highs.
📈 Trading plan (Main scenario: LONG)
• Conservative entry: 0.01177 (after a candle close above EMA21)
• Aggressive entry: 0.01120 – 0.01135 (from the current price / from EMA50)
🎯 Targets:
$0.01230 (+8.3% / +4.2%)
$0.01330 (+17.1% / +12.7%)
$0.01410 (+24.2% / +19.5%)
🛡 Stop-loss: 0.01070 (below the EMA99 level)
Trading 👉$ESPORTS
1
4
357
·
--
Bullish
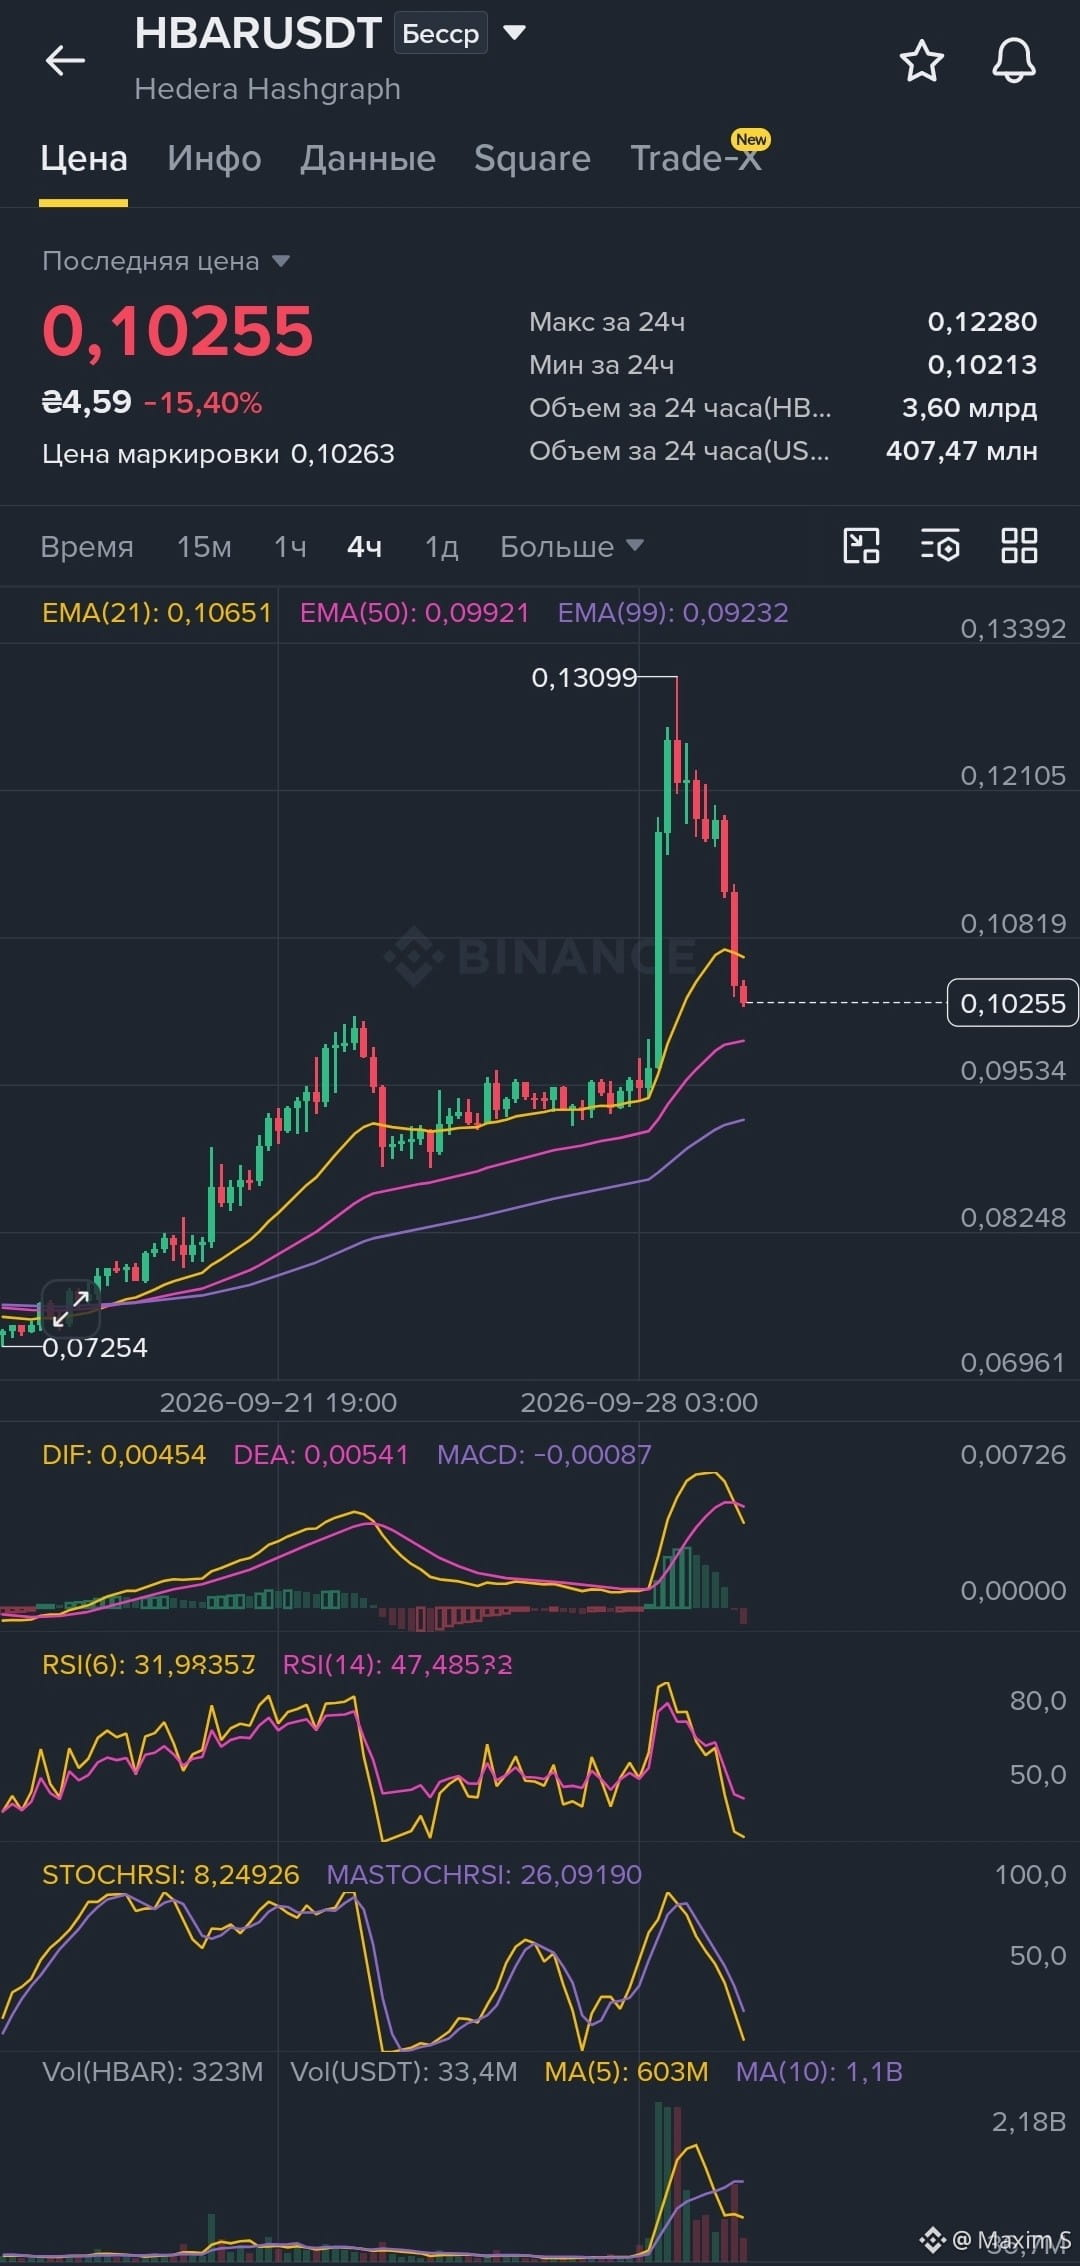
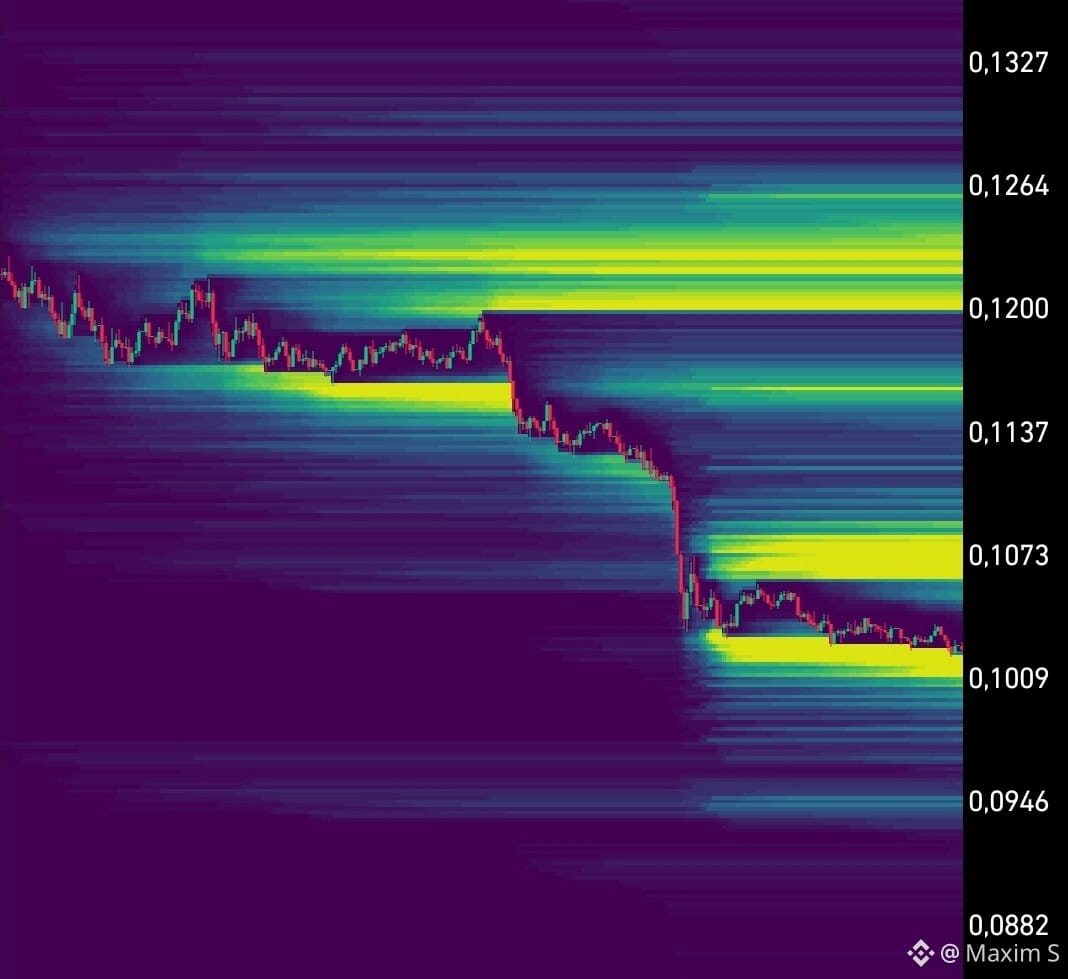
HBAR: Preparing a reversal after an impulse correction? 📈
After a strong surge to the level of $0,13099 $HBAR , it entered a phase of technical correction. Right now, the price is testing the $0,1025 zone, and the Stoch RSI indicator has already dropped deep into oversold territory (8,25). Approaching the dynamic support of EMA50 ($0,0992) creates favorable conditions to look for LONG entry points on a trend bounce.
🎯 Trading plan (LONG):
Main scenario: Enter a long position after confirmation of protection of the EMA50 level ($0,0992–$0,1010) or a retest of the local minimum.
Entry points:
Aggressive: $0,1015 – $0,1025 (current levels with low volume).
Conservative: $0,0985 – $0,0995 (in the interaction zone with EMA50 after a reversal candle forms).
🎯 Take-profit targets:
Target 1: $0,1080 (+6,4% — reclaim above EMA21)
Target 2: $0,1165 (+14,8% — test 50% of the impulse correction)
Target 3: $0,1280 (+26,1% — retest of local highs)
Stop-loss: $0,0948 (cut loss below the EMA50 level and local structure).
Trading 👉$HBAR
{future}(HBARUSDT)
HBAR: Preparing a reversal after an impulse correction? 📈
After a strong surge to the level of $0,13099 $HBAR , it entered a phase of technical correction. Right now, the price is testing the $0,1025 zone, and the Stoch RSI indicator has already dropped deep into oversold territory (8,25). Approaching the dynamic support of EMA50 ($0,0992) creates favorable conditions to look for LONG entry points on a trend bounce.
🎯 Trading plan (LONG):
Main scenario: Enter a long position after confirmation of protection of the EMA50 level ($0,0992–$0,1010) or a retest of the local minimum.
Entry points:
Aggressive: $0,1015 – $0,1025 (current levels with low volume).
Conservative: $0,0985 – $0,0995 (in the interaction zone with EMA50 after a reversal candle forms).
🎯 Take-profit targets:
Target 1: $0,1080 (+6,4% — reclaim above EMA21)
Target 2: $0,1165 (+14,8% — test 50% of the impulse correction)
Target 3: $0,1280 (+26,1% — retest of local highs)
Stop-loss: $0,0948 (cut loss below the EMA50 level and local structure).
Trading 👉$HBAR
After a strong surge to the level of $0,13099 $HBAR , it entered a phase of technical correction. Right now, the price is testing the $0,1025 zone, and the Stoch RSI indicator has already dropped deep into oversold territory (8,25). Approaching the dynamic support of EMA50 ($0,0992) creates favorable conditions to look for LONG entry points on a trend bounce.
🎯 Trading plan (LONG):
Main scenario: Enter a long position after confirmation of protection of the EMA50 level ($0,0992–$0,1010) or a retest of the local minimum.
Entry points:
Aggressive: $0,1015 – $0,1025 (current levels with low volume).
Conservative: $0,0985 – $0,0995 (in the interaction zone with EMA50 after a reversal candle forms).
🎯 Take-profit targets:
Target 1: $0,1080 (+6,4% — reclaim above EMA21)
Target 2: $0,1165 (+14,8% — test 50% of the impulse correction)
Target 3: $0,1280 (+26,1% — retest of local highs)
Stop-loss: $0,0948 (cut loss below the EMA50 level and local structure).
Trading 👉$HBAR
3
327
·
--
Bearish
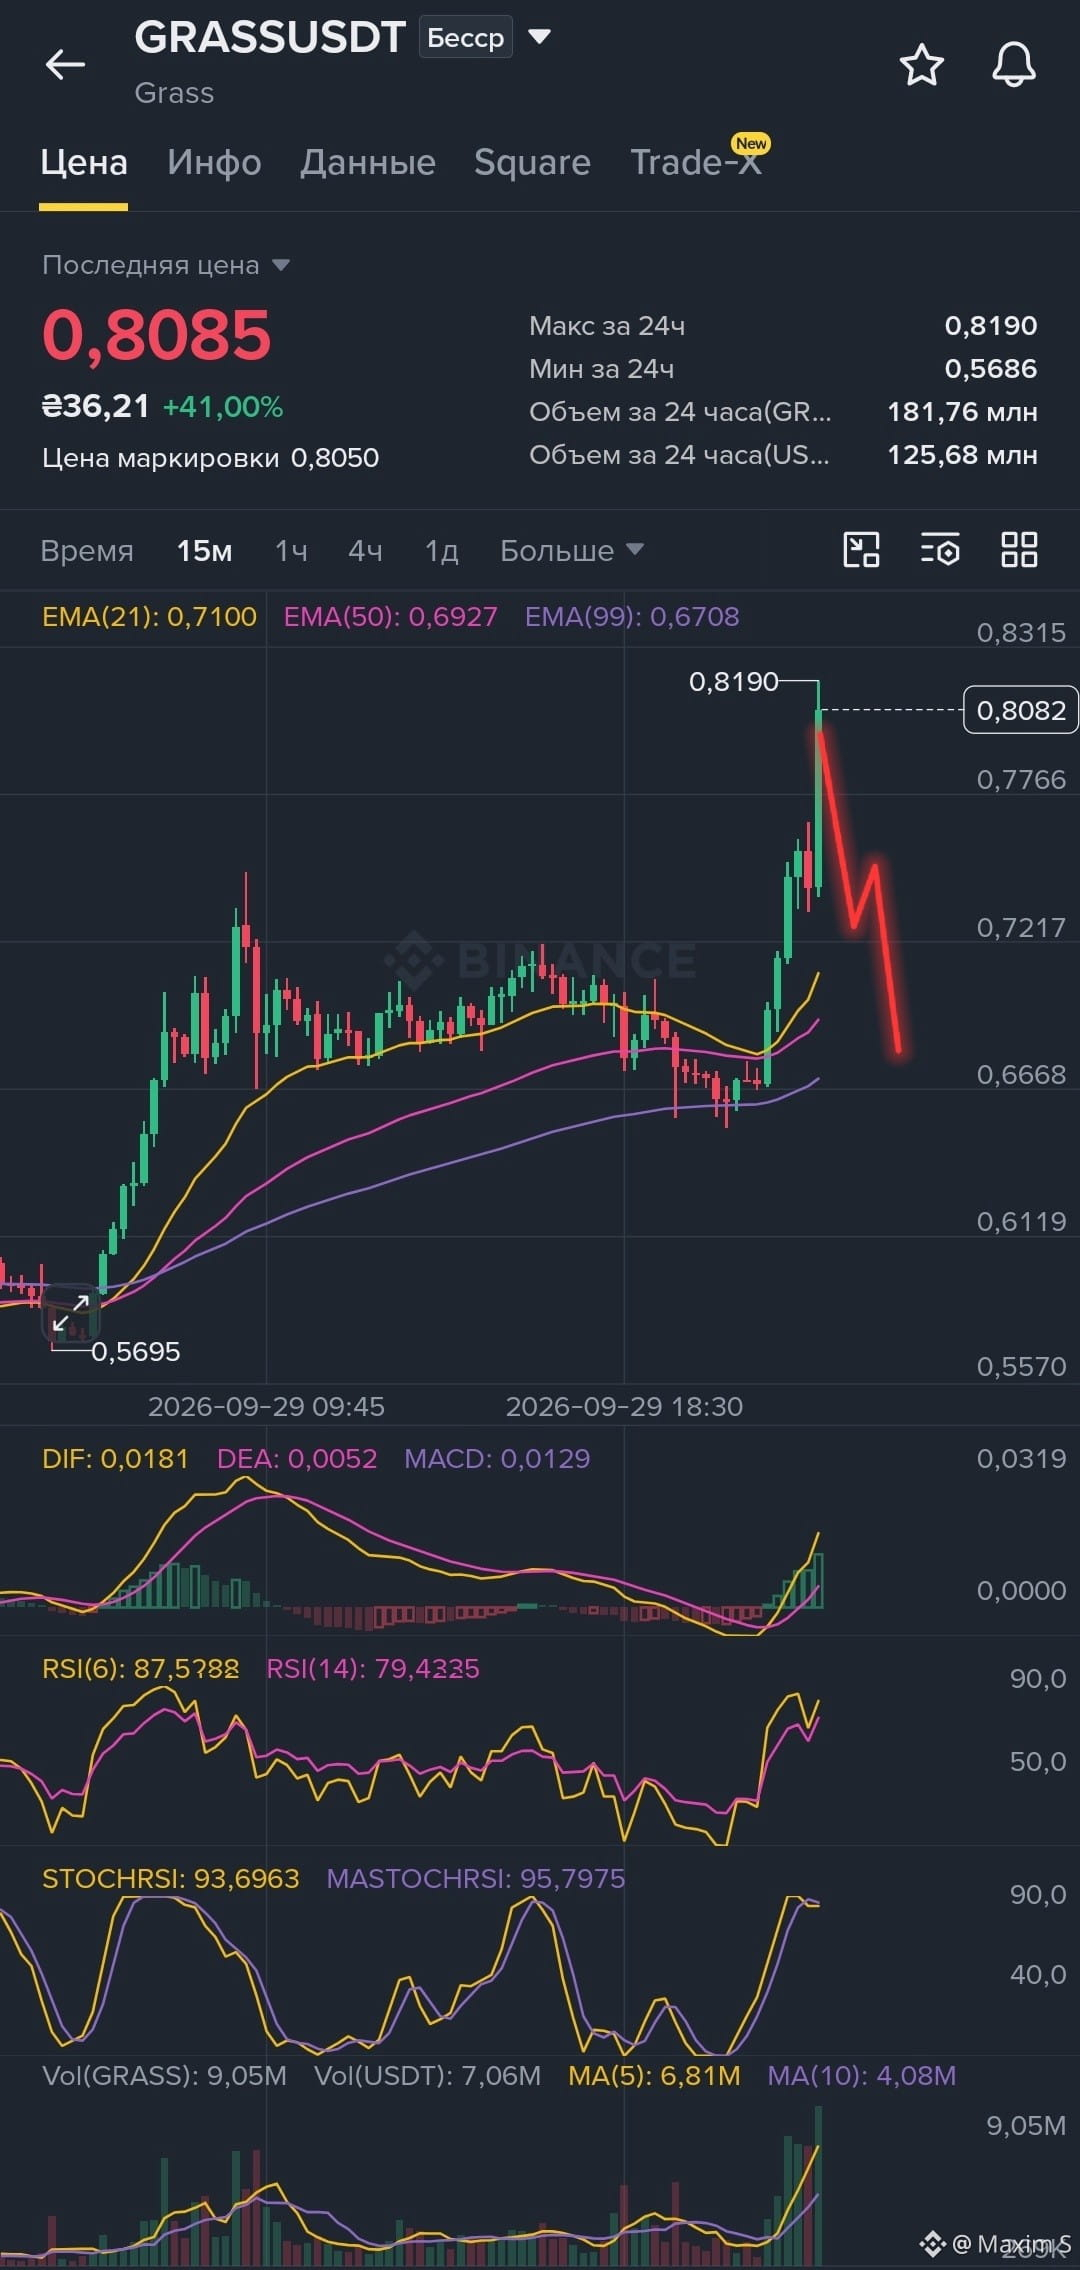
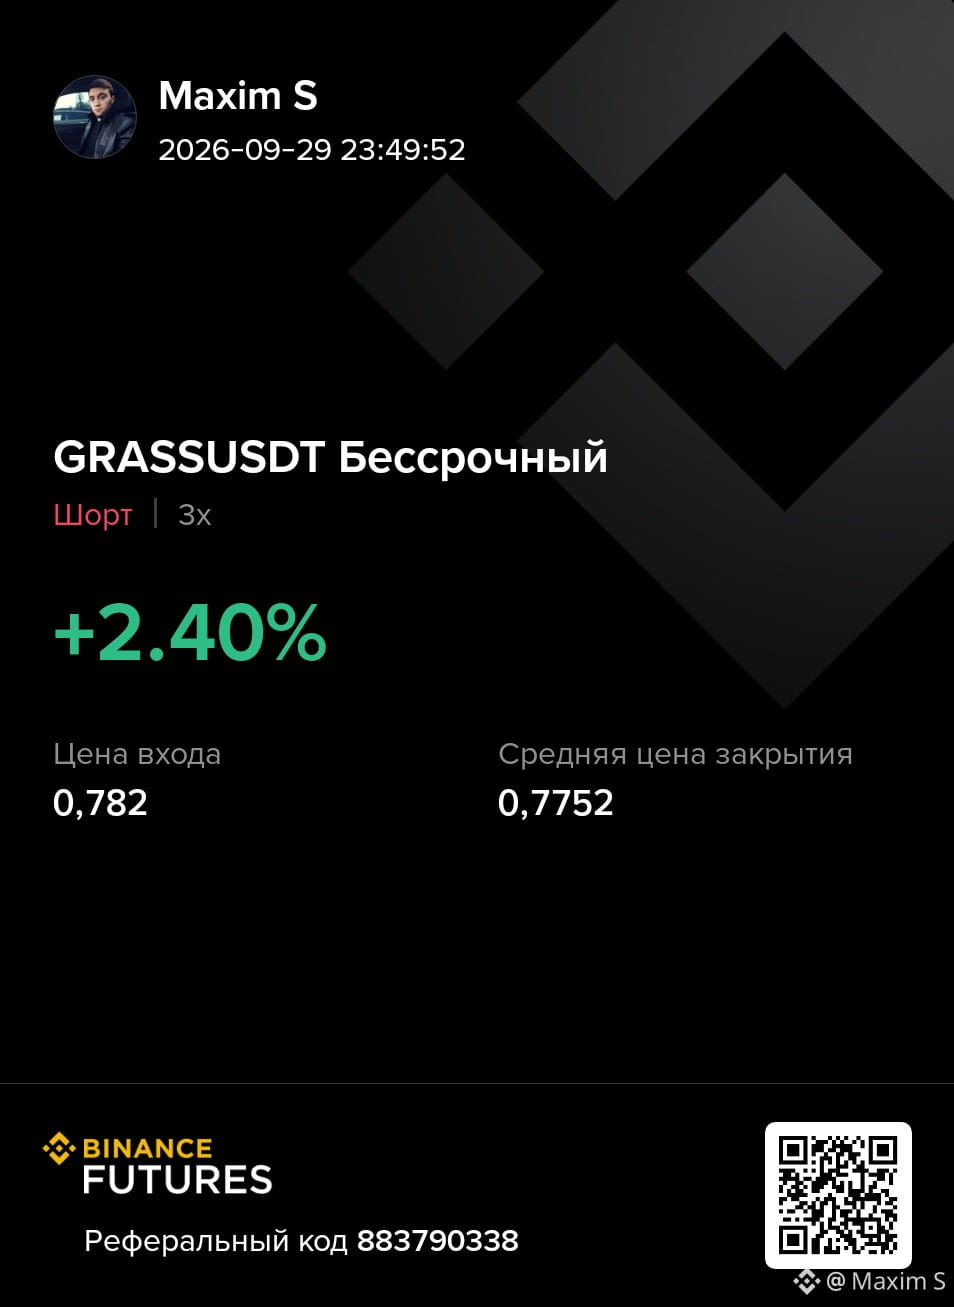
GRASS/USDT — clear overheating 🔥
After the impulse of +41%, the price reached 0.8190, practically vertically breaking away from the EMA21/50/99. Now we have a classic situation: the move is strong, but the market is already significantly overheated.
Indicator information 📊
RSI6: 87.6
RSI14: 79.4
StochRSI: 93.7
MACD is sharply expanding upward.
Volumes have increased significantly — on such an impulse, it confirms the excitement, but after a vertical move it also increases the risk of a sudden sell-off.
🔴 Scenario: SHORT
Aggressive:
Entry 0.8050–0.8190 on the appearance of a reversal candle / rejection from 0.8190.
Conservative:
Wait for a pullback below 0.7760, then a retest of this zone from below.
🎯 TP1: 0.7760
🎯 TP2: 0.7220
🎯 TP3: 0.7000–0.6927
🛑 SL: above 0.8250–0.8300
Idea: go short specifically from overheating, not trying to catch the top blindly. As long as the price holds above 0.7760, the impulse remains strong. For a confirmed reversal, this zone must be broken.
Priority: SHORT after reversal confirmation.
GRASS/USDT — clear overheating 🔥
After the impulse of +41%, the price reached 0.8190, practically vertically breaking away from the EMA21/50/99. Now we have a classic situation: the move is strong, but the market is already significantly overheated.
Indicator information 📊
RSI6: 87.6
RSI14: 79.4
StochRSI: 93.7
MACD is sharply expanding upward.
Volumes have increased significantly — on such an impulse, it confirms the excitement, but after a vertical move it also increases the risk of a sudden sell-off.
🔴 Scenario: SHORT
Aggressive:
Entry 0.8050–0.8190 on the appearance of a reversal candle / rejection from 0.8190.
Conservative:
Wait for a pullback below 0.7760, then a retest of this zone from below.
🎯 TP1: 0.7760
🎯 TP2: 0.7220
🎯 TP3: 0.7000–0.6927
🛑 SL: above 0.8250–0.8300
Idea: go short specifically from overheating, not trying to catch the top blindly. As long as the price holds above 0.7760, the impulse remains strong. For a confirmed reversal, this zone must be broken.
Priority: SHORT after reversal confirmation.
After the impulse of +41%, the price reached 0.8190, practically vertically breaking away from the EMA21/50/99. Now we have a classic situation: the move is strong, but the market is already significantly overheated.
Indicator information 📊
RSI6: 87.6
RSI14: 79.4
StochRSI: 93.7
MACD is sharply expanding upward.
Volumes have increased significantly — on such an impulse, it confirms the excitement, but after a vertical move it also increases the risk of a sudden sell-off.
🔴 Scenario: SHORT
Aggressive:
Entry 0.8050–0.8190 on the appearance of a reversal candle / rejection from 0.8190.
Conservative:
Wait for a pullback below 0.7760, then a retest of this zone from below.
🎯 TP1: 0.7760
🎯 TP2: 0.7220
🎯 TP3: 0.7000–0.6927
🛑 SL: above 0.8250–0.8300
Idea: go short specifically from overheating, not trying to catch the top blindly. As long as the price holds above 0.7760, the impulse remains strong. For a confirmed reversal, this zone must be broken.
Priority: SHORT after reversal confirmation.
1
182
·
--
Bullish
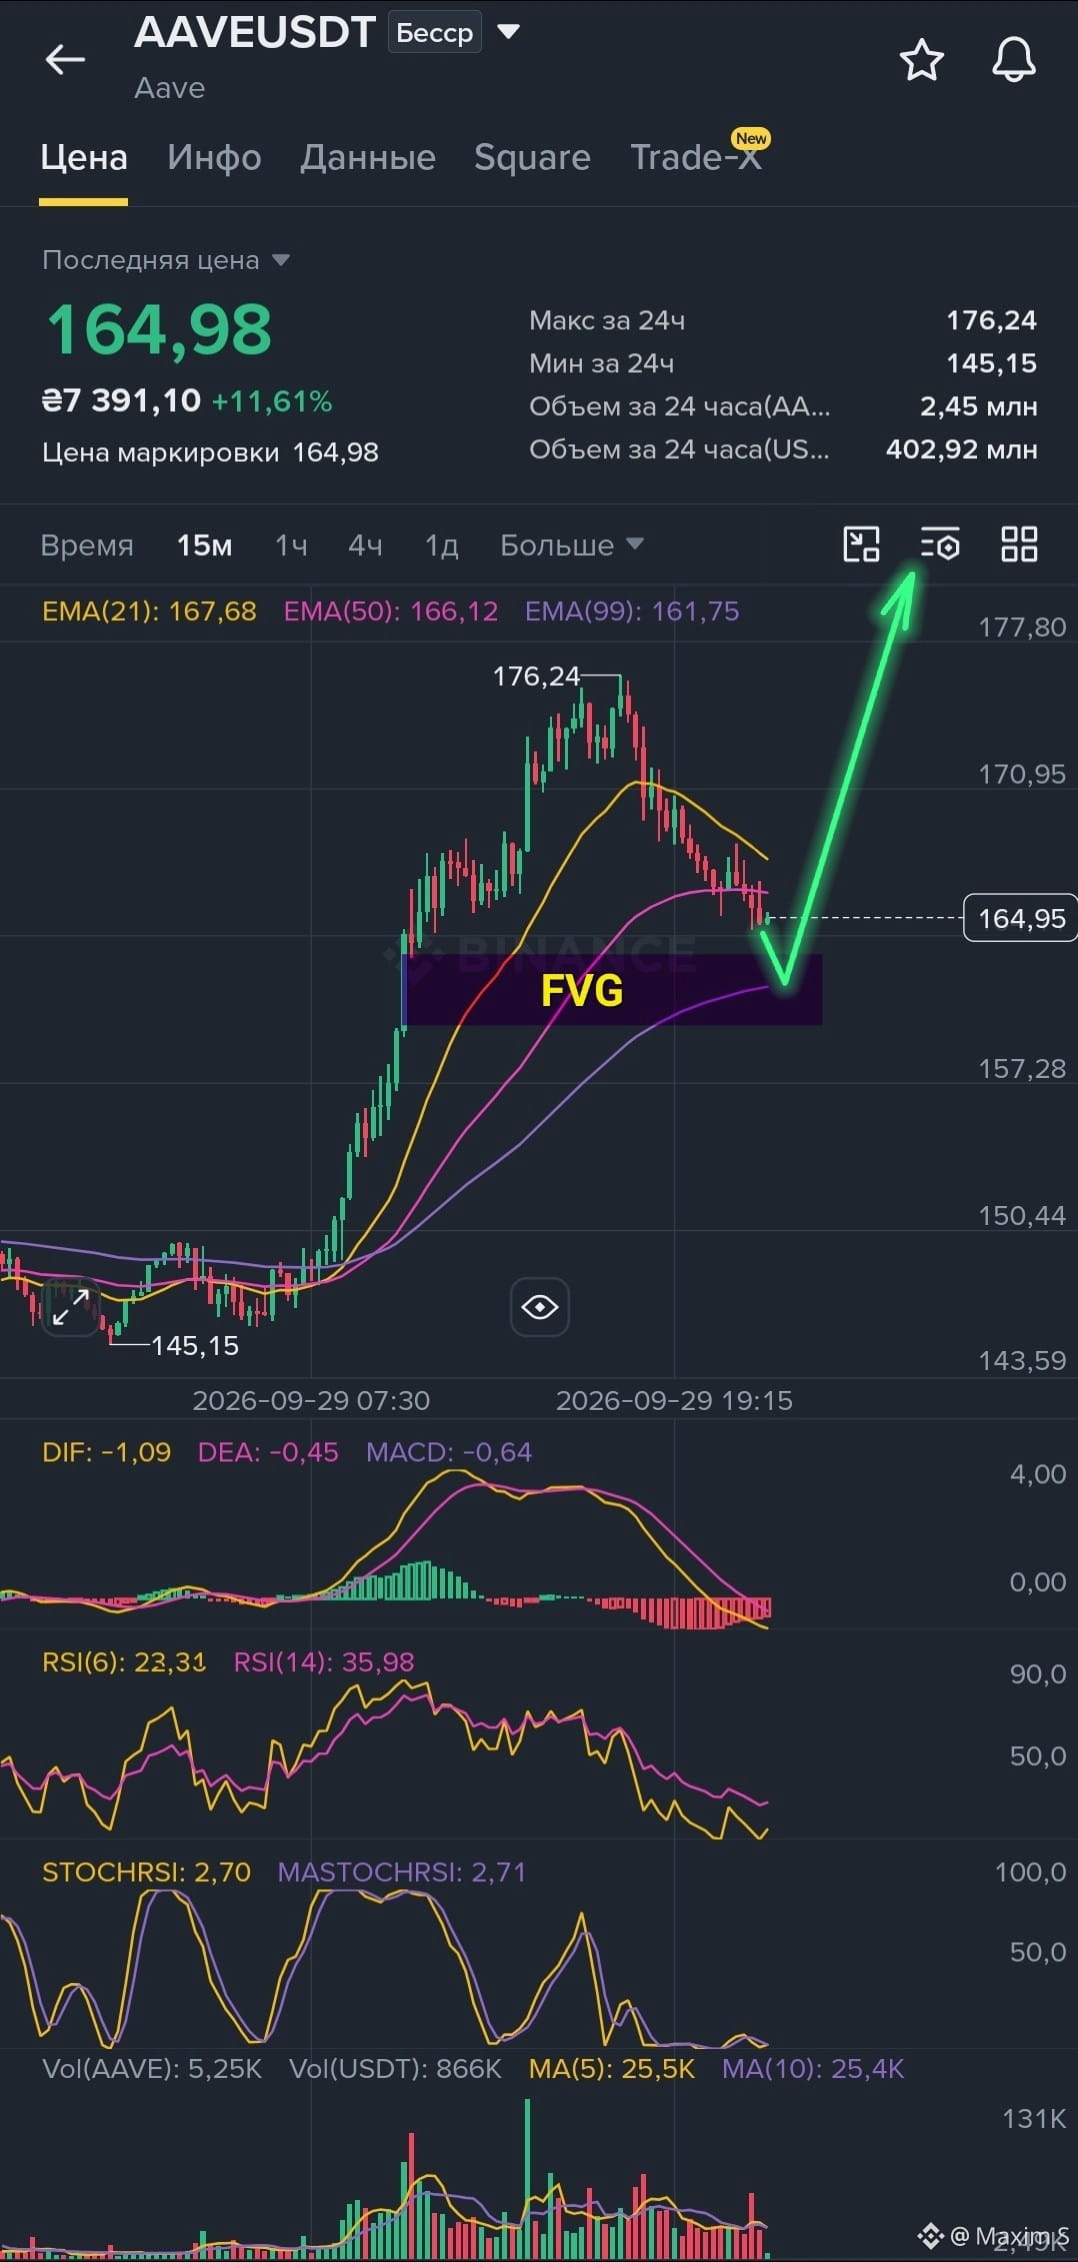
🔥 AAVE: Testing imbalance and EMA99 — are we preparing a long setup?
After a powerful impulse rally up to $176.24, coin $AAVE moved into the planned correction. Now the price is entering the ideal zone of buyer interest — the imbalance (FVG) overlap with dynamic EMA99 support ($161.75).
RSI (23.3) and StochRSI (2.7) are oversold — the market shook out weak hands and is ready for a new upswing.
📈 Main scenario: LONG (Buy on Dips)
🎯 Targets:
• Target 1: $167.70 (+3.5%) — test of EMA21
• Target 2: $171.50 (+5.8%) — intermediate level
• Target 3: $176.20 (+8.7%) — updating the local high
📌 Entry points:
• Aggressive: $164.50 – $165.00 (current levels at the first signs of a reversal)
• Conservative: $161.80 – $162.50 (adding in the FVG zone / EMA99)
🛡 Stop-loss: $159.20 (cutting the loss if the structure breaks and price moves below EMA99
Trading 👉$AAVE
{future}(AAVEUSDT)
🔥 AAVE: Testing imbalance and EMA99 — are we preparing a long setup?
After a powerful impulse rally up to $176.24, coin $AAVE moved into the planned correction. Now the price is entering the ideal zone of buyer interest — the imbalance (FVG) overlap with dynamic EMA99 support ($161.75).
RSI (23.3) and StochRSI (2.7) are oversold — the market shook out weak hands and is ready for a new upswing.
📈 Main scenario: LONG (Buy on Dips)
🎯 Targets:
• Target 1: $167.70 (+3.5%) — test of EMA21
• Target 2: $171.50 (+5.8%) — intermediate level
• Target 3: $176.20 (+8.7%) — updating the local high
📌 Entry points:
• Aggressive: $164.50 – $165.00 (current levels at the first signs of a reversal)
• Conservative: $161.80 – $162.50 (adding in the FVG zone / EMA99)
🛡 Stop-loss: $159.20 (cutting the loss if the structure breaks and price moves below EMA99
Trading 👉$AAVE
After a powerful impulse rally up to $176.24, coin $AAVE moved into the planned correction. Now the price is entering the ideal zone of buyer interest — the imbalance (FVG) overlap with dynamic EMA99 support ($161.75).
RSI (23.3) and StochRSI (2.7) are oversold — the market shook out weak hands and is ready for a new upswing.
📈 Main scenario: LONG (Buy on Dips)
🎯 Targets:
• Target 1: $167.70 (+3.5%) — test of EMA21
• Target 2: $171.50 (+5.8%) — intermediate level
• Target 3: $176.20 (+8.7%) — updating the local high
📌 Entry points:
• Aggressive: $164.50 – $165.00 (current levels at the first signs of a reversal)
• Conservative: $161.80 – $162.50 (adding in the FVG zone / EMA99)
🛡 Stop-loss: $159.20 (cutting the loss if the structure breaks and price moves below EMA99
Trading 👉$AAVE
1
188
·
--
Bullish
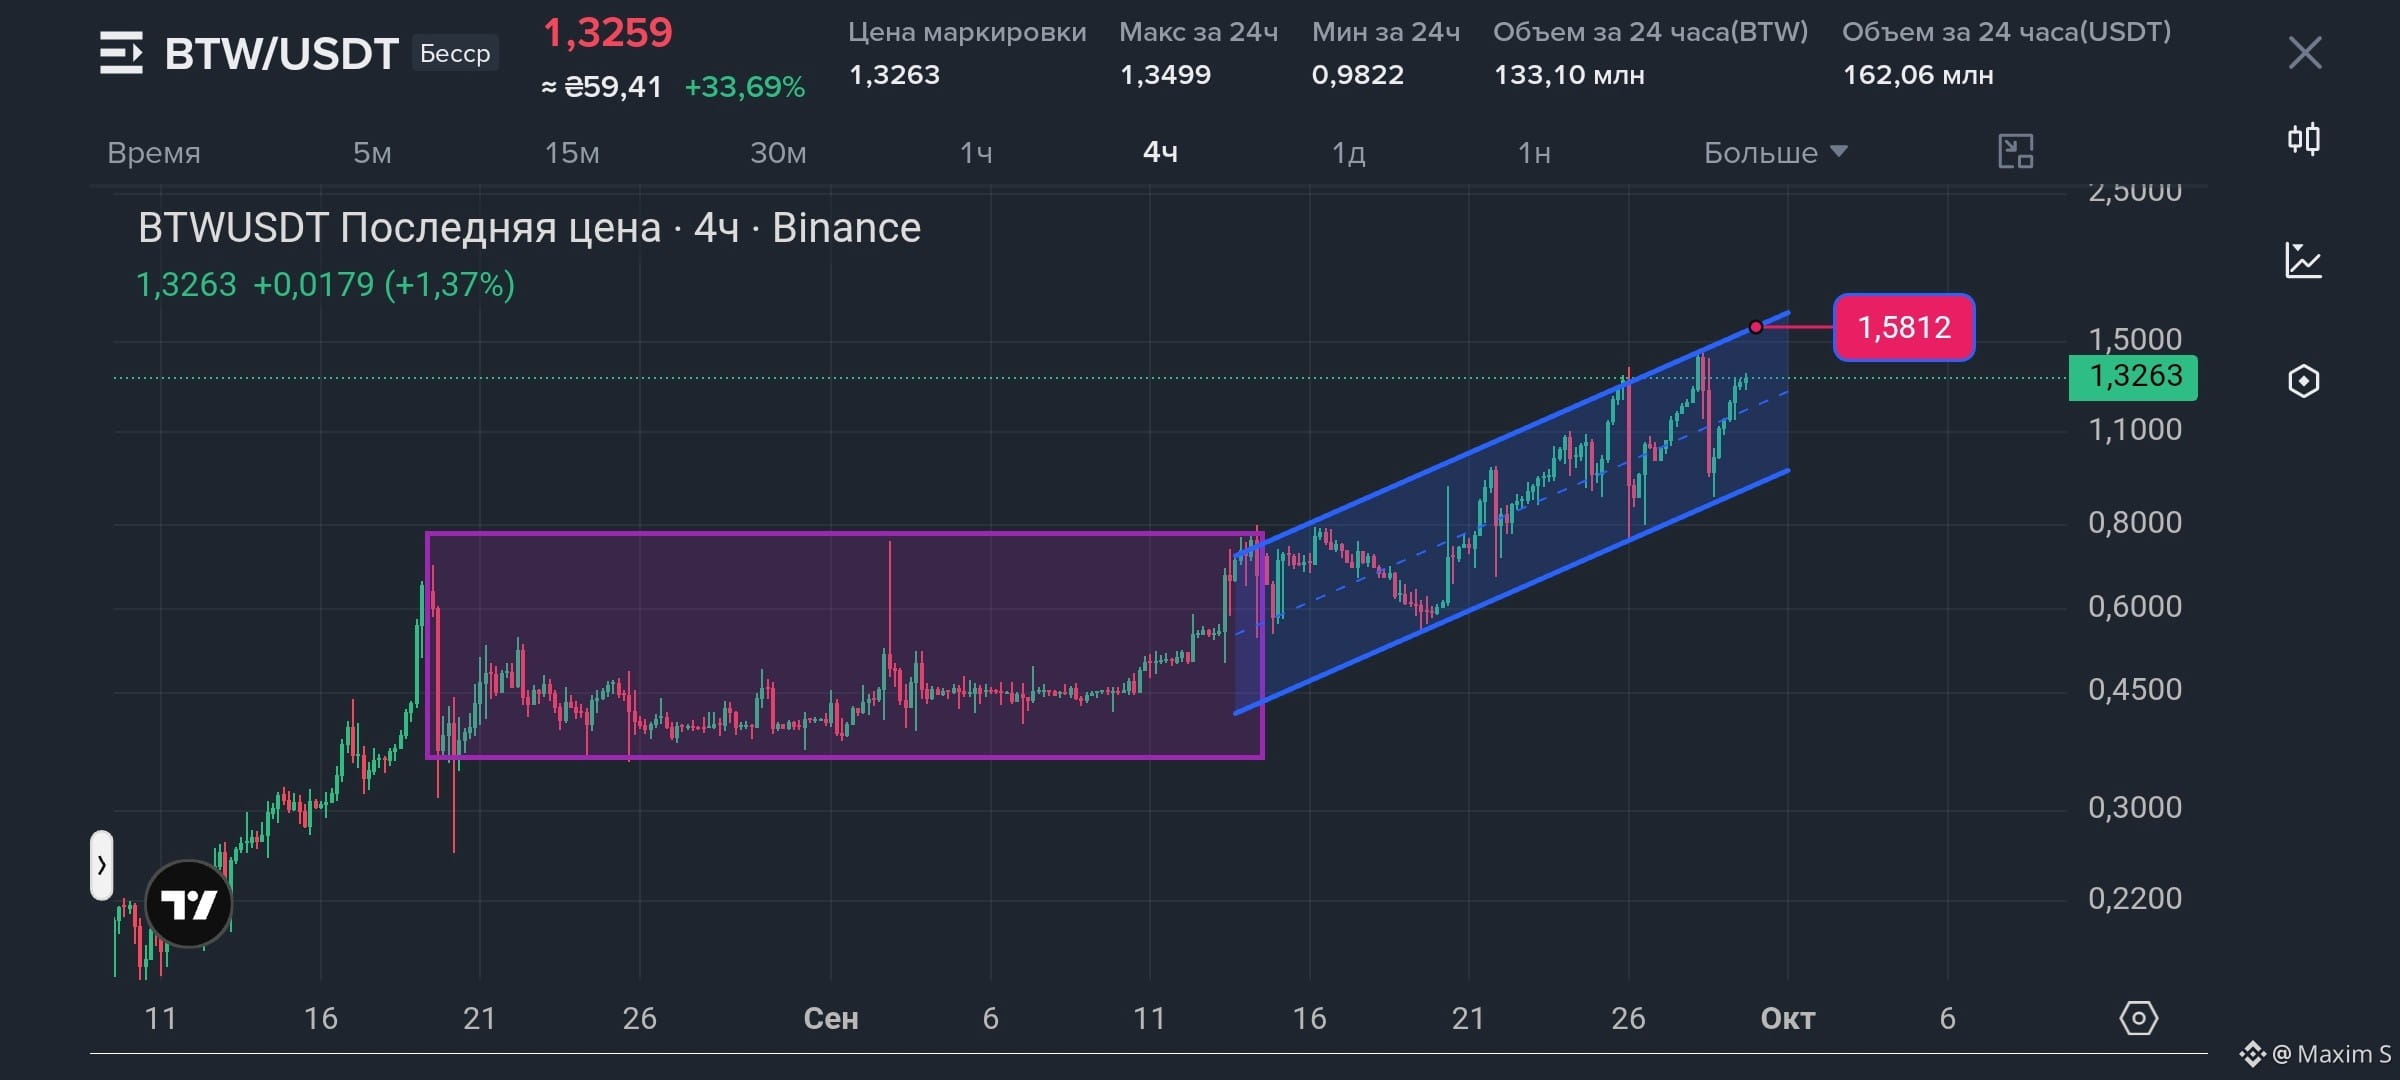
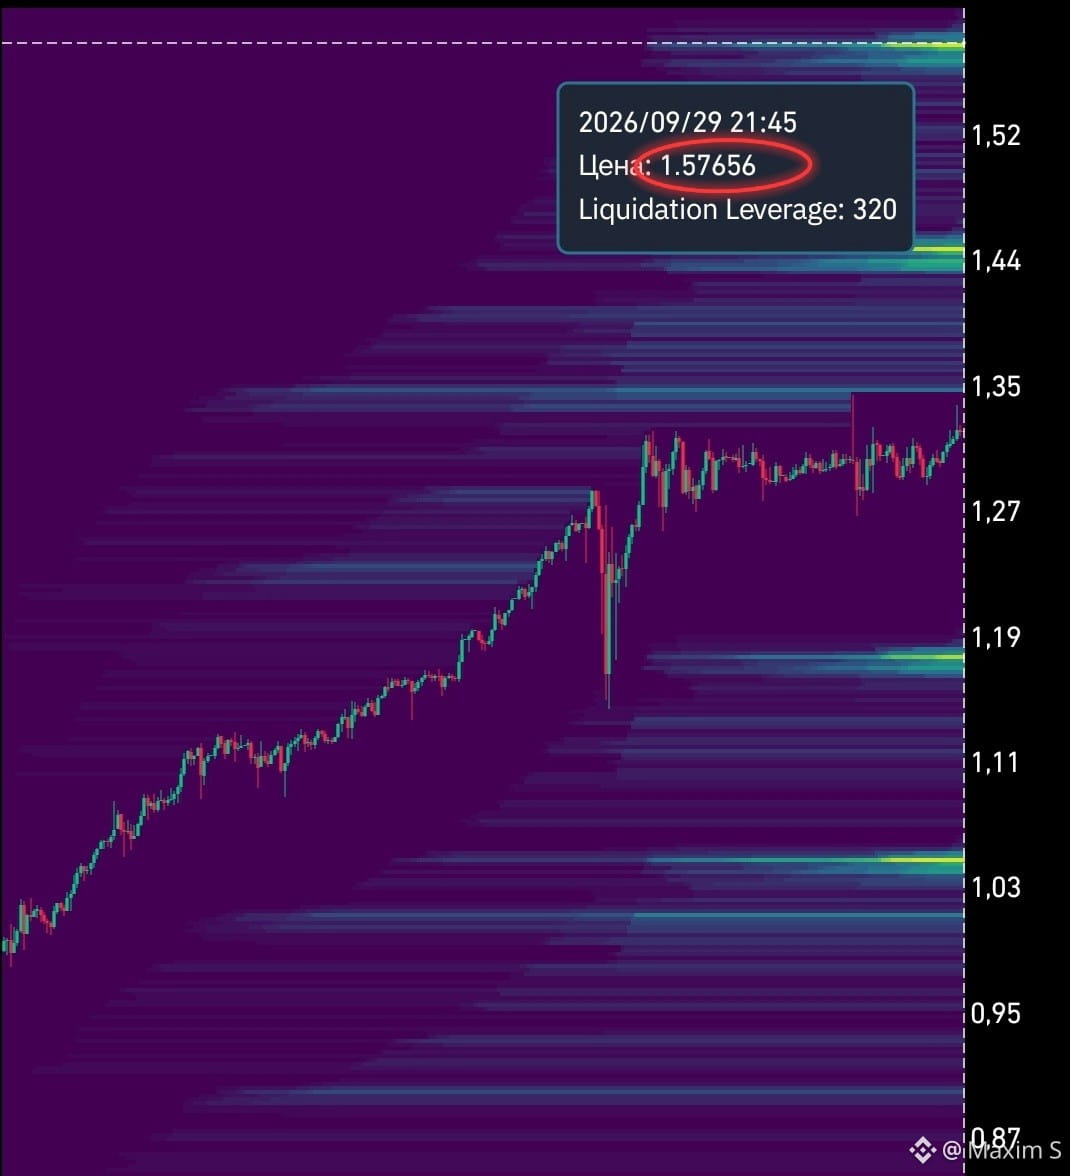
$BTW we move in a clear uptrend channel📈 I’m waiting for a move up to 1.58 (there’s an approximate boundary of the channel and liquidity) from there you can already enter a good short 📉 Let’s see what happens 🟢
{future}(BTWUSDT)
$BTW we move in a clear uptrend channel📈 I’m waiting for a move up to 1.58 (there’s an approximate boundary of the channel and liquidity) from there you can already enter a good short 📉 Let’s see what happens 🟢
4
227
·
--
Bullish
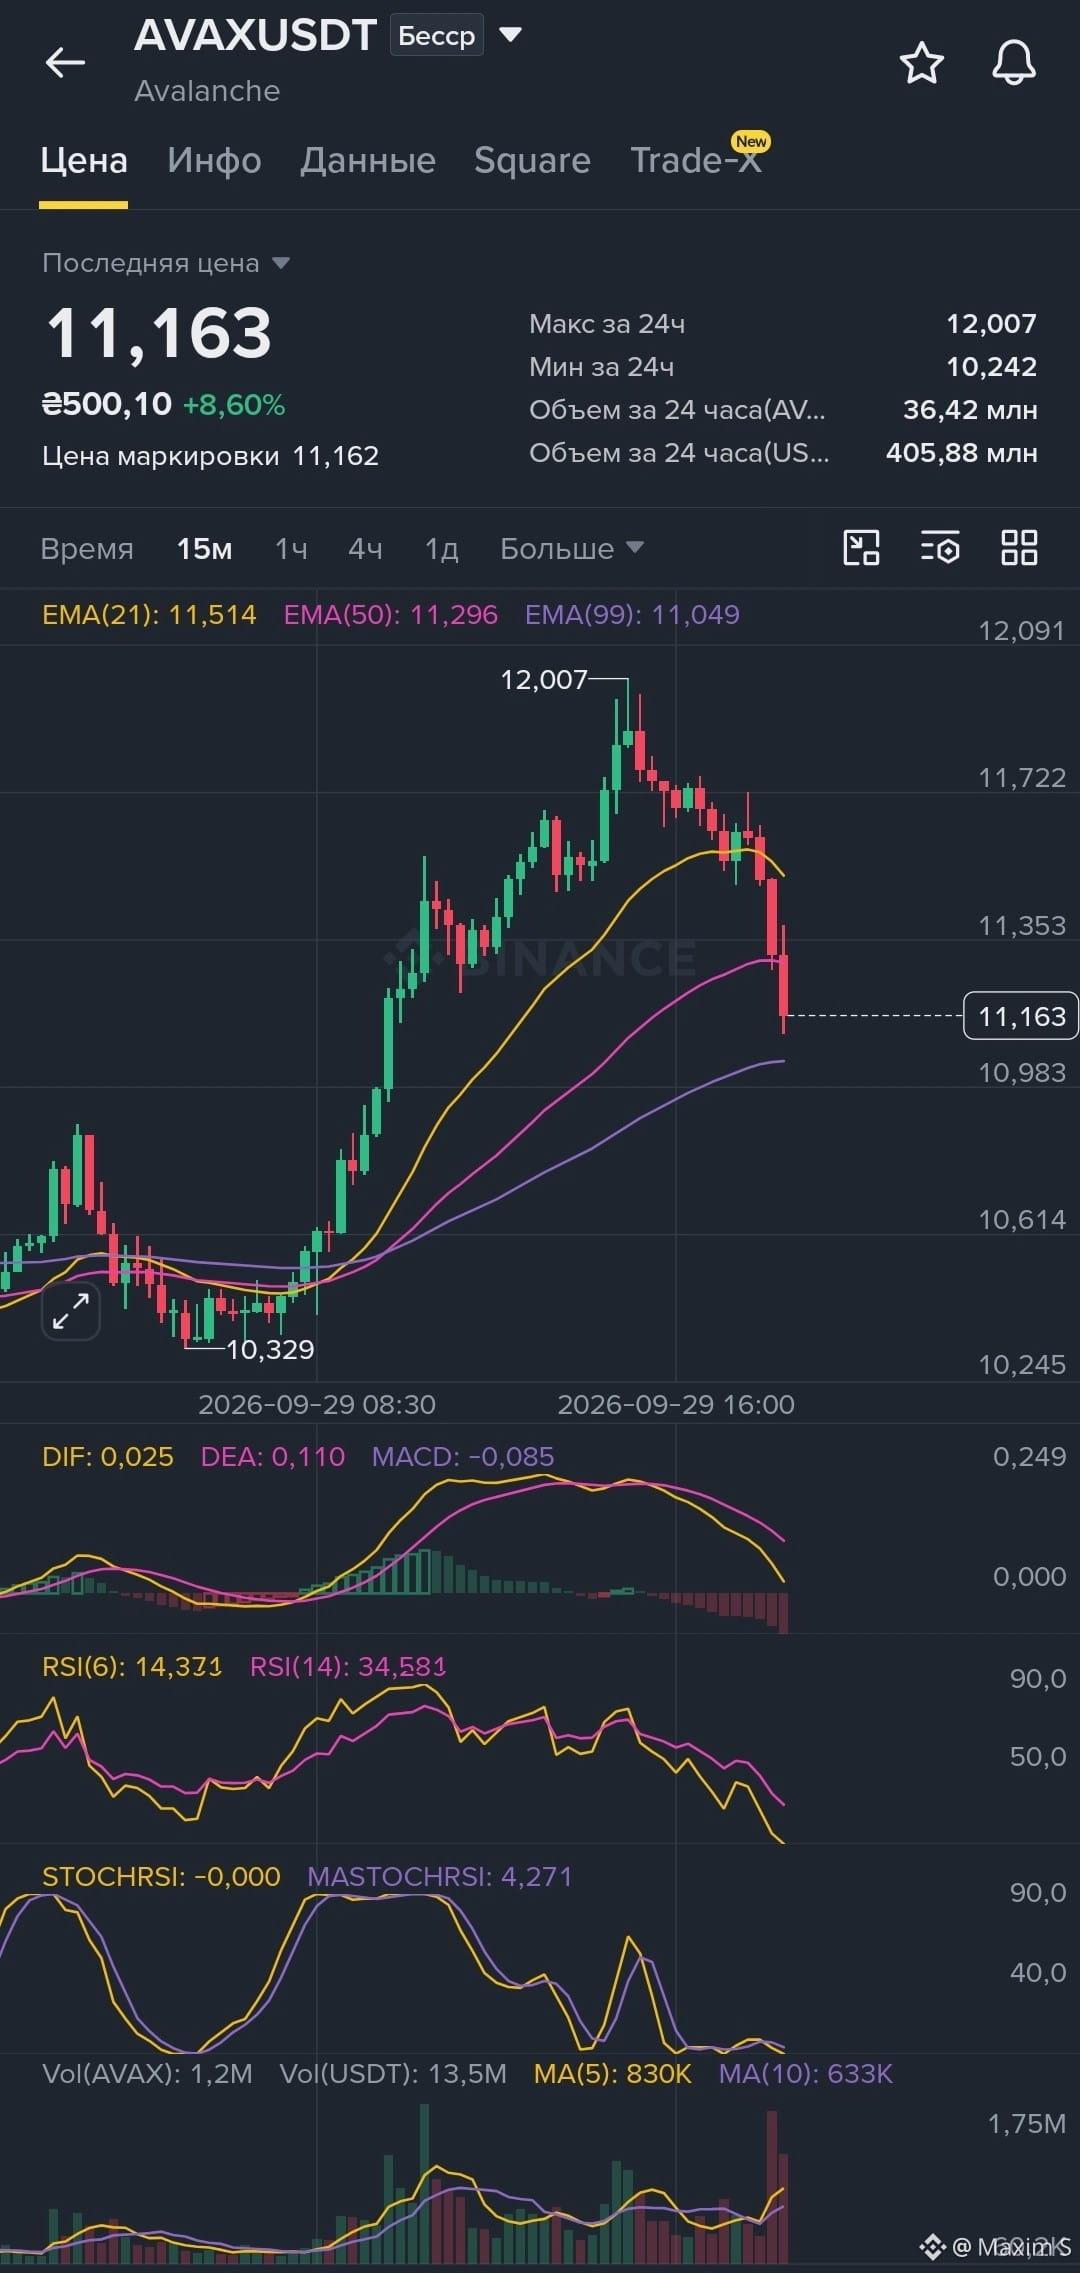
AVAX/USDT: Is a bounce from EMA99 being prepared? 📉➡️📈
After a strong move from $10.329 to $12.007, coin $AVAX went into a smooth correction, which ended with a quick test of key dynamic support.
Now the price is consolidating around EMA99 ($11.049). Meanwhile, the oscillators have reached extreme zones: RSI(6) has dropped to 14.37, and StochRSI has fallen to 0.00. Such strong oversold conditions on the 15-minute timeframe often act as a trigger for a technical rebound or the resumption of a bullish impulse.
🎯 Trading plan: LONG (Main scenario)
Aggressive entry: $11.12 – $11.16 (current levels, anticipating a reaction from the EMA99 zone).
Conservative entry: $11.05 – $11.08 (on a retest of EMA99 and the appearance of a reversal candlestick pattern-model).
Stop-loss: $10.95 (a close below EMA99 and the local support level).
📊 Take-profits:
Target 1: $11.35 (~1.8% – 2.0%) — return to EMA50.
Target 2: $11.51 (~3.2% – 3.5%) — test of EMA21 and the nearest resistance block.
Target 3: $11.75 (~5.3% – 5.6%) — updating the local correction highs.
Did you like the breakdown? Support it with a reaction 👍
{future}(AVAXUSDT)
AVAX/USDT: Is a bounce from EMA99 being prepared? 📉➡️📈
After a strong move from $10.329 to $12.007, coin $AVAX went into a smooth correction, which ended with a quick test of key dynamic support.
Now the price is consolidating around EMA99 ($11.049). Meanwhile, the oscillators have reached extreme zones: RSI(6) has dropped to 14.37, and StochRSI has fallen to 0.00. Such strong oversold conditions on the 15-minute timeframe often act as a trigger for a technical rebound or the resumption of a bullish impulse.
🎯 Trading plan: LONG (Main scenario)
Aggressive entry: $11.12 – $11.16 (current levels, anticipating a reaction from the EMA99 zone).
Conservative entry: $11.05 – $11.08 (on a retest of EMA99 and the appearance of a reversal candlestick pattern-model).
Stop-loss: $10.95 (a close below EMA99 and the local support level).
📊 Take-profits:
Target 1: $11.35 (~1.8% – 2.0%) — return to EMA50.
Target 2: $11.51 (~3.2% – 3.5%) — test of EMA21 and the nearest resistance block.
Target 3: $11.75 (~5.3% – 5.6%) — updating the local correction highs.
Did you like the breakdown? Support it with a reaction 👍
After a strong move from $10.329 to $12.007, coin $AVAX went into a smooth correction, which ended with a quick test of key dynamic support.
Now the price is consolidating around EMA99 ($11.049). Meanwhile, the oscillators have reached extreme zones: RSI(6) has dropped to 14.37, and StochRSI has fallen to 0.00. Such strong oversold conditions on the 15-minute timeframe often act as a trigger for a technical rebound or the resumption of a bullish impulse.
🎯 Trading plan: LONG (Main scenario)
Aggressive entry: $11.12 – $11.16 (current levels, anticipating a reaction from the EMA99 zone).
Conservative entry: $11.05 – $11.08 (on a retest of EMA99 and the appearance of a reversal candlestick pattern-model).
Stop-loss: $10.95 (a close below EMA99 and the local support level).
📊 Take-profits:
Target 1: $11.35 (~1.8% – 2.0%) — return to EMA50.
Target 2: $11.51 (~3.2% – 3.5%) — test of EMA21 and the nearest resistance block.
Target 3: $11.75 (~5.3% – 5.6%) — updating the local correction highs.
Did you like the breakdown? Support it with a reaction 👍
2
252
·
--
Bullish
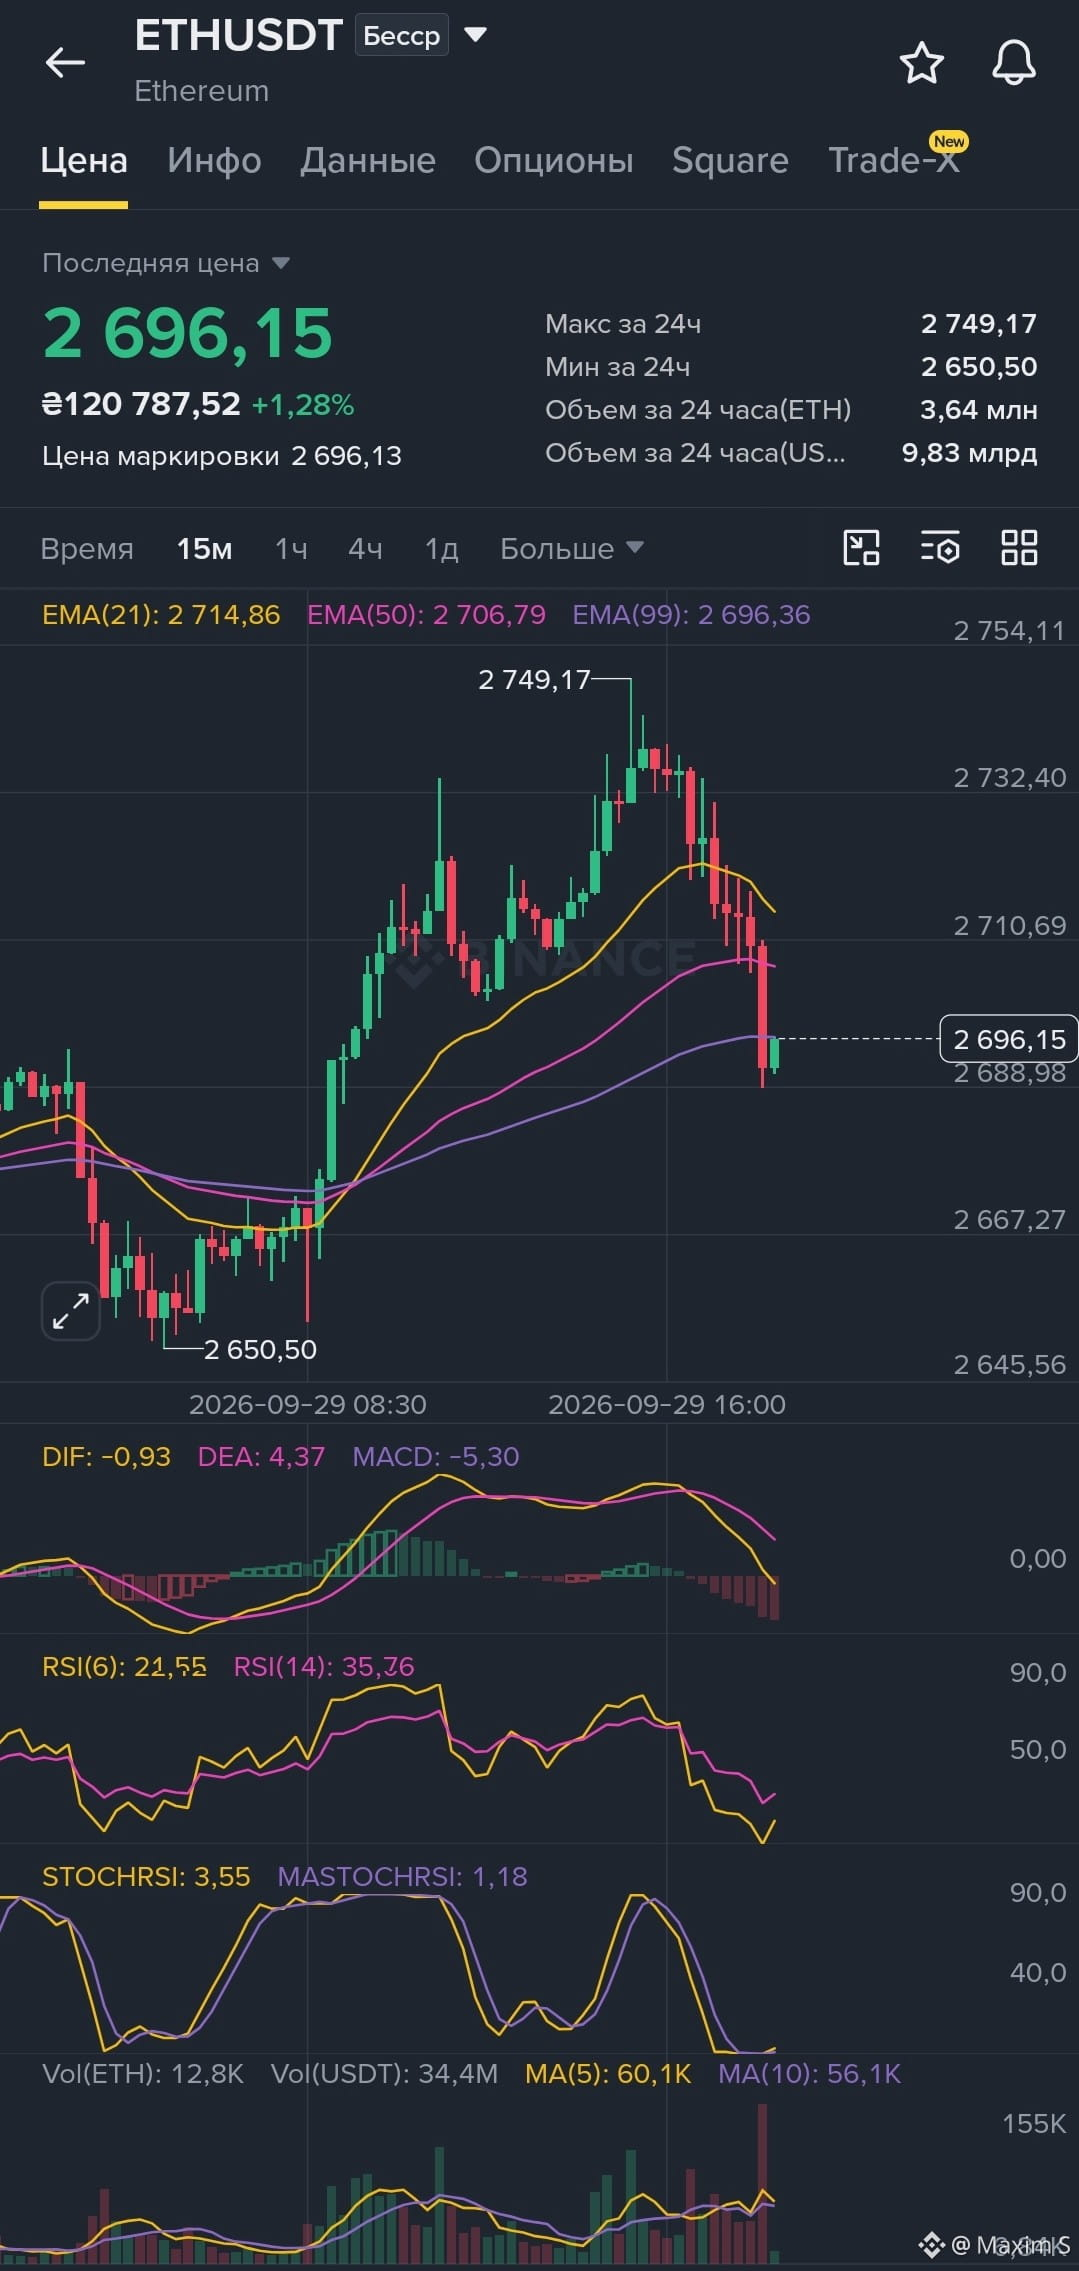
🔥 ETH/USDT: Correction over? Looking for an entry point on a bounce 📈
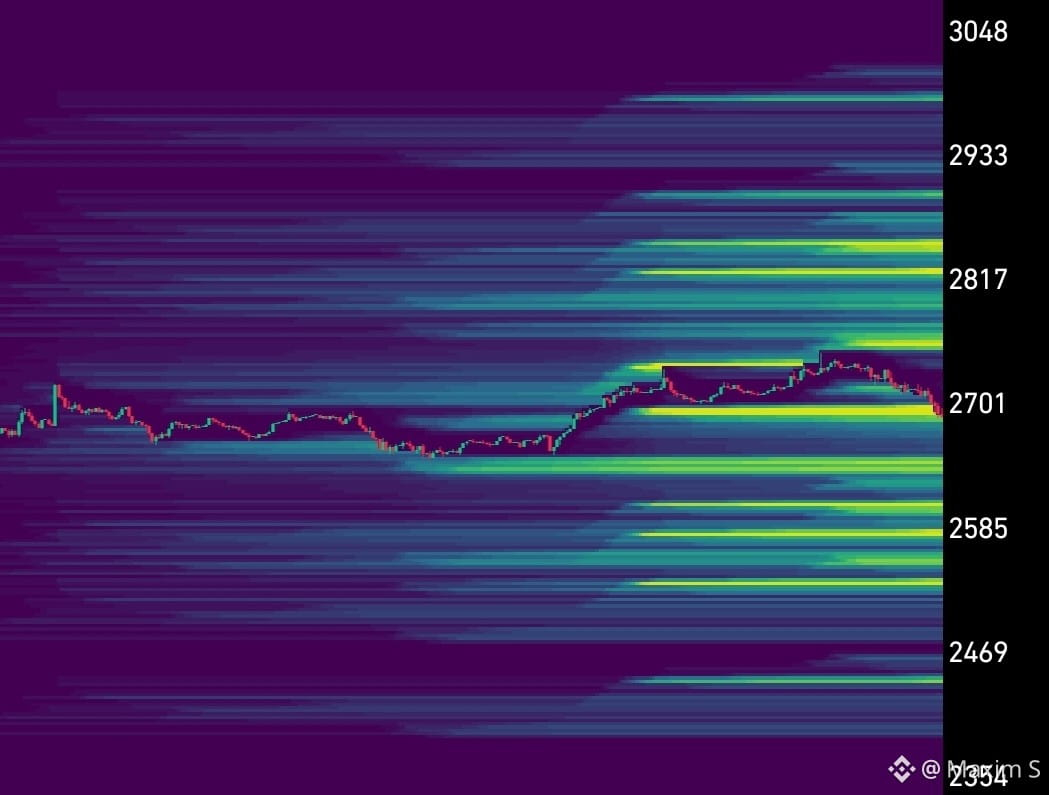
After a strong impulse to $2,749, Ether went into a planned correction, technically unloading the oscillators. Price dropped to a key dynamic support — EMA(99) (~$2,696). In this zone, compression is visible and the first buyer reaction appears.
RSI(6) (21.55) and StochRSI (3.55) have entered deep oversold territory, which on the 15-minute timeframe gives a high chance of a local reversal and the resumption of the uptrend.
🎯 TRADING PLAN (Main scenario — LONG)
• Conservative entry: $2,708 – $2,712 (after the price closes above EMA(50) and a reversal is confirmed).
• Aggressive entry: $2,690 – $2,697 (current market levels near the moving EMA(99)).
🎯 Price movement targets:
$2,725 (+1.1%) — local resistance / return to EMA(21).
$2,749 (+2.0%) — retest of the local high.
$2,780 (+3.1%) — continuation of the bullish impulse.
⛔ Stop-loss: $2,675 (below the local support level and the correction candle wick).
Trading 👉$ETH
{future}(ETHUSDT)
🔥 ETH/USDT: Correction over? Looking for an entry point on a bounce 📈
After a strong impulse to $2,749, Ether went into a planned correction, technically unloading the oscillators. Price dropped to a key dynamic support — EMA(99) (~$2,696). In this zone, compression is visible and the first buyer reaction appears.
RSI(6) (21.55) and StochRSI (3.55) have entered deep oversold territory, which on the 15-minute timeframe gives a high chance of a local reversal and the resumption of the uptrend.
🎯 TRADING PLAN (Main scenario — LONG)
• Conservative entry: $2,708 – $2,712 (after the price closes above EMA(50) and a reversal is confirmed).
• Aggressive entry: $2,690 – $2,697 (current market levels near the moving EMA(99)).
🎯 Price movement targets:
$2,725 (+1.1%) — local resistance / return to EMA(21).
$2,749 (+2.0%) — retest of the local high.
$2,780 (+3.1%) — continuation of the bullish impulse.
⛔ Stop-loss: $2,675 (below the local support level and the correction candle wick).
Trading 👉$ETH
After a strong impulse to $2,749, Ether went into a planned correction, technically unloading the oscillators. Price dropped to a key dynamic support — EMA(99) (~$2,696). In this zone, compression is visible and the first buyer reaction appears.
RSI(6) (21.55) and StochRSI (3.55) have entered deep oversold territory, which on the 15-minute timeframe gives a high chance of a local reversal and the resumption of the uptrend.
🎯 TRADING PLAN (Main scenario — LONG)
• Conservative entry: $2,708 – $2,712 (after the price closes above EMA(50) and a reversal is confirmed).
• Aggressive entry: $2,690 – $2,697 (current market levels near the moving EMA(99)).
🎯 Price movement targets:
$2,725 (+1.1%) — local resistance / return to EMA(21).
$2,749 (+2.0%) — retest of the local high.
$2,780 (+3.1%) — continuation of the bullish impulse.
⛔ Stop-loss: $2,675 (below the local support level and the correction candle wick).
Trading 👉$ETH
2
186
·
--
Bullish
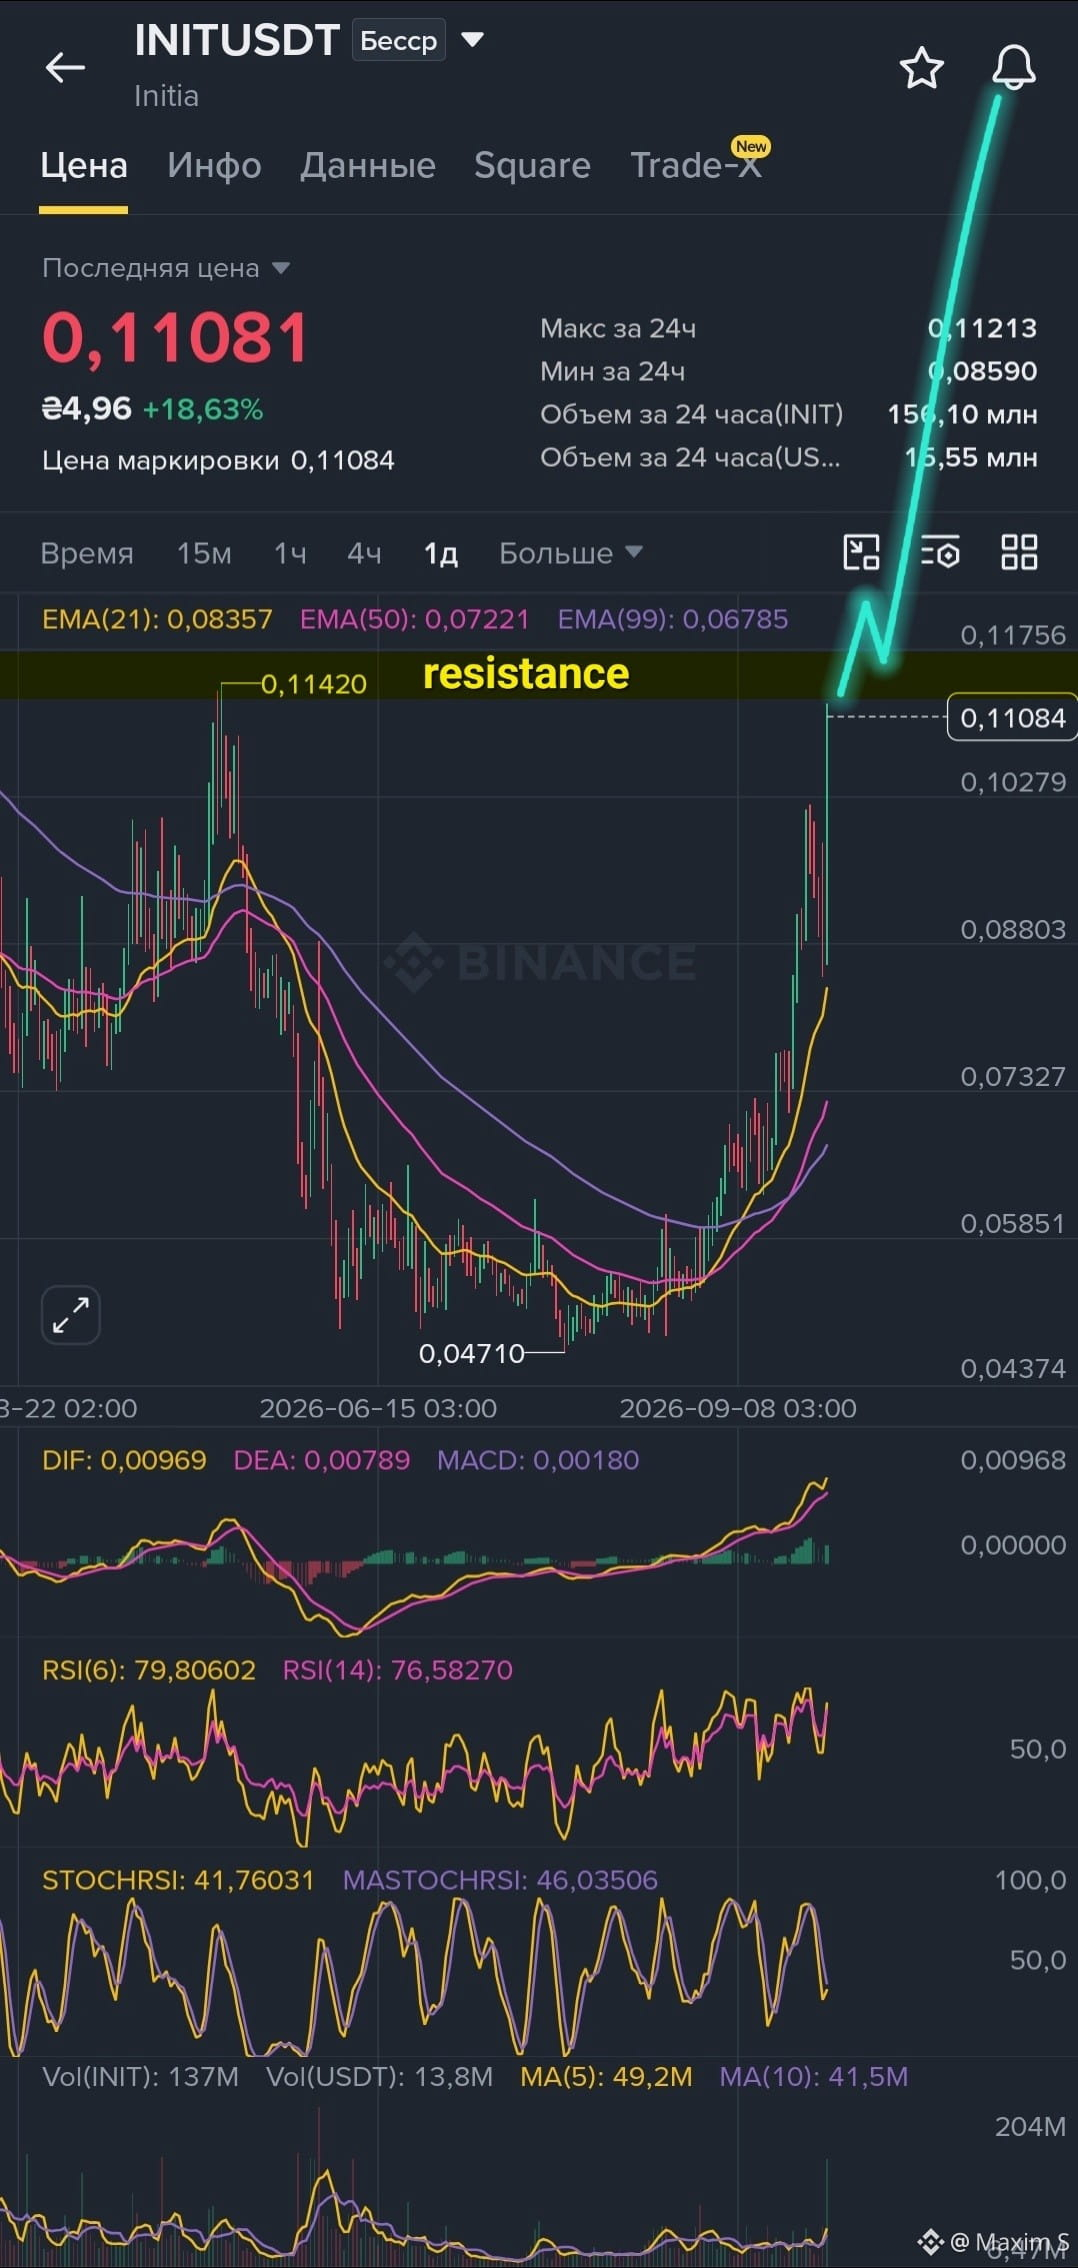
🔥 INIT/USDT — moment of truth at strong daily resistance!
After a long decline, the asset formed a rounded bottom from 0.04710, followed by a powerful impulse. Now the price is above all EMAs and has come right up to the key resistance at 0.110–0.1142.
📊 Indicators:
• MACD — bullish, histogram is positive
• RSI14 — 76.6 / RSI6 — 79.8 🔥
• Volume 137M vs MA10 41.5M — growth confirmed.
🎯 Scenarios: LONG: breakout of 0.1142 on volume + consolidation and retest of the level.
⚡️ The rounded bottom has already delivered a strong impulse. Now the main question is: will it break above 0.1142 or get rejected at the resistance?
$INIT
{future}(INITUSDT)
🔥 INIT/USDT — moment of truth at strong daily resistance!
After a long decline, the asset formed a rounded bottom from 0.04710, followed by a powerful impulse. Now the price is above all EMAs and has come right up to the key resistance at 0.110–0.1142.
📊 Indicators:
• MACD — bullish, histogram is positive
• RSI14 — 76.6 / RSI6 — 79.8 🔥
• Volume 137M vs MA10 41.5M — growth confirmed.
🎯 Scenarios: LONG: breakout of 0.1142 on volume + consolidation and retest of the level.
⚡️ The rounded bottom has already delivered a strong impulse. Now the main question is: will it break above 0.1142 or get rejected at the resistance?
$INIT
After a long decline, the asset formed a rounded bottom from 0.04710, followed by a powerful impulse. Now the price is above all EMAs and has come right up to the key resistance at 0.110–0.1142.
📊 Indicators:
• MACD — bullish, histogram is positive
• RSI14 — 76.6 / RSI6 — 79.8 🔥
• Volume 137M vs MA10 41.5M — growth confirmed.
🎯 Scenarios: LONG: breakout of 0.1142 on volume + consolidation and retest of the level.
⚡️ The rounded bottom has already delivered a strong impulse. Now the main question is: will it break above 0.1142 or get rejected at the resistance?
$INIT
2
141
·
--
Bullish
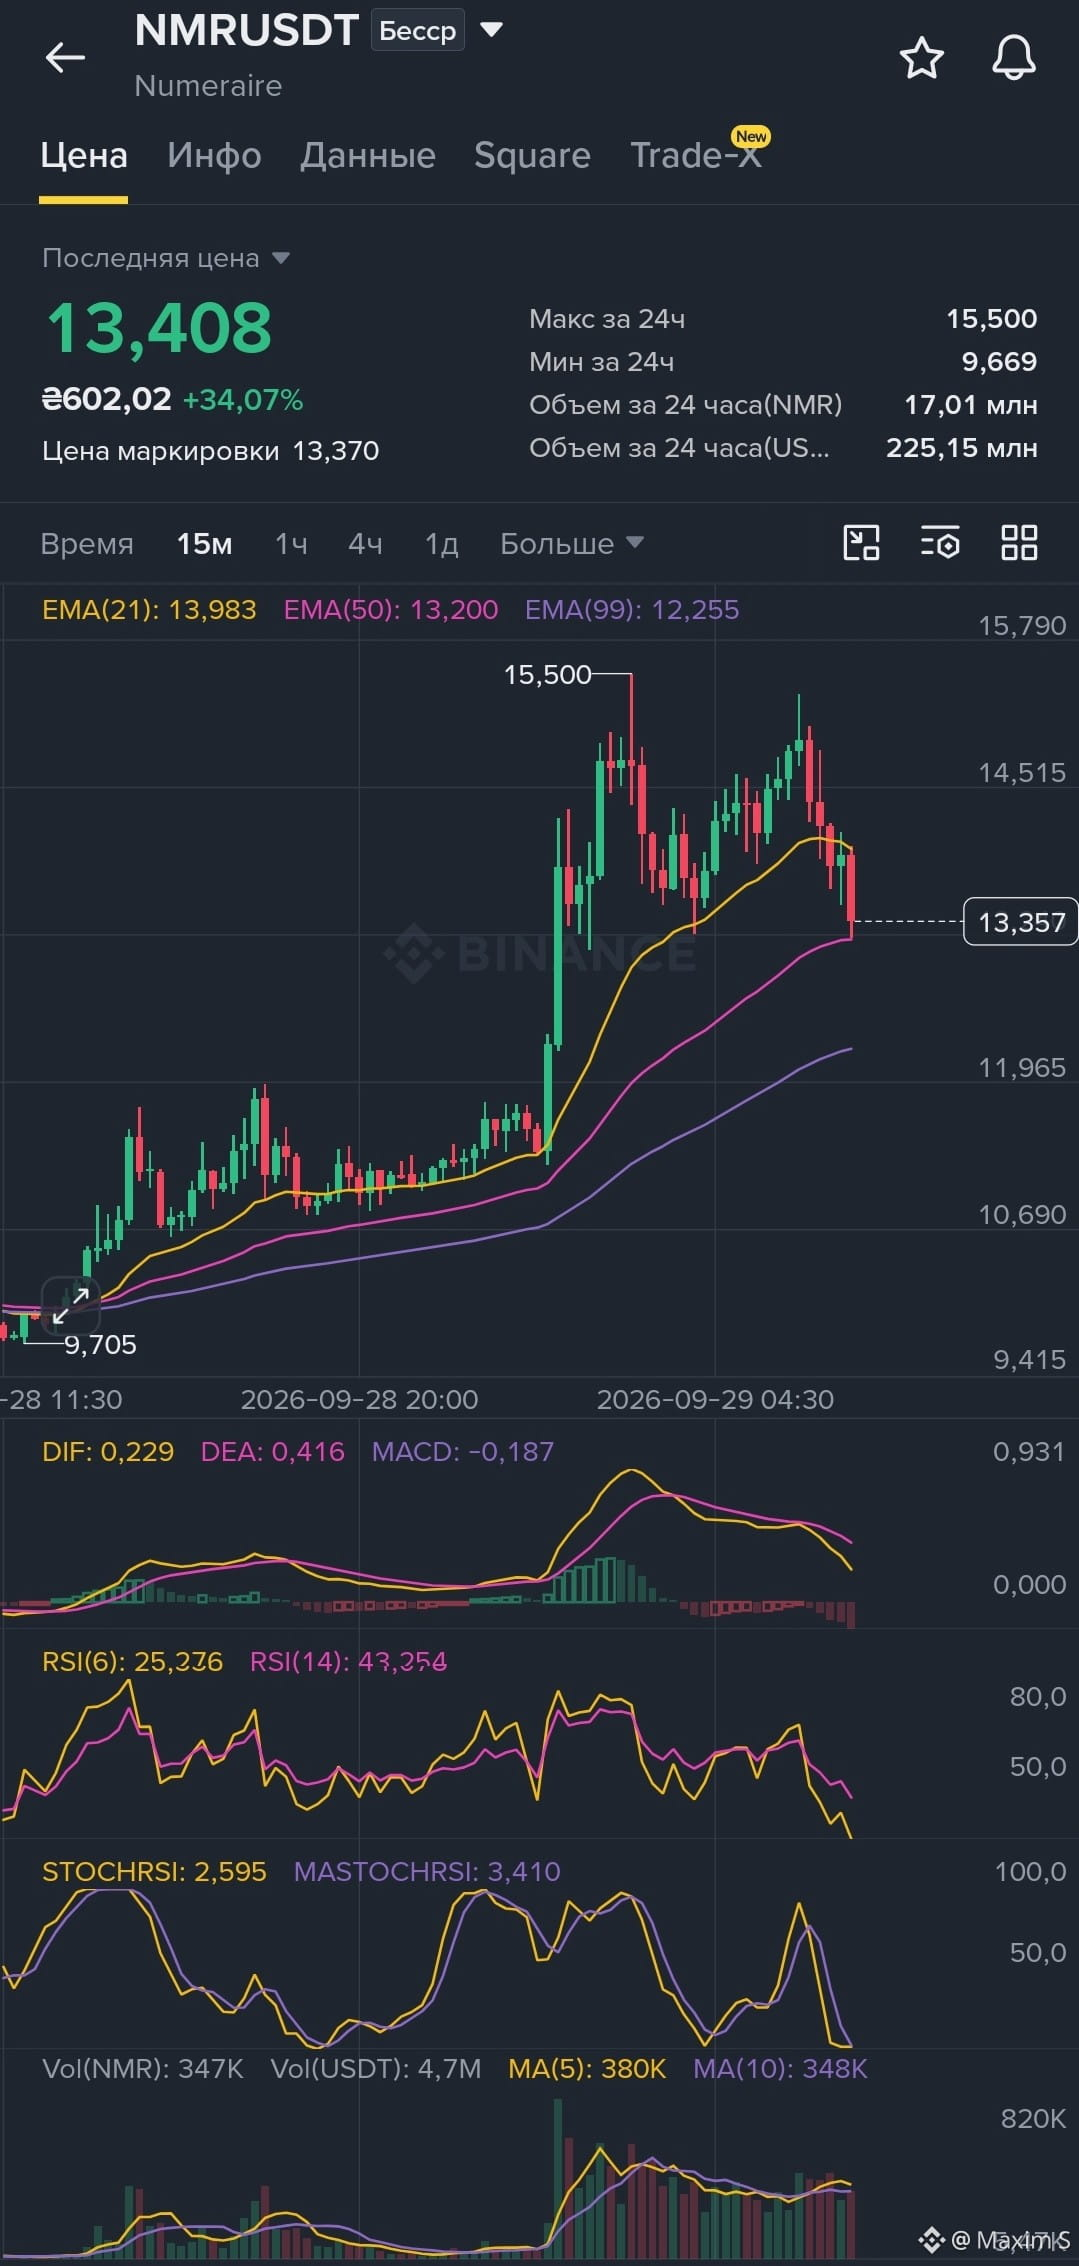
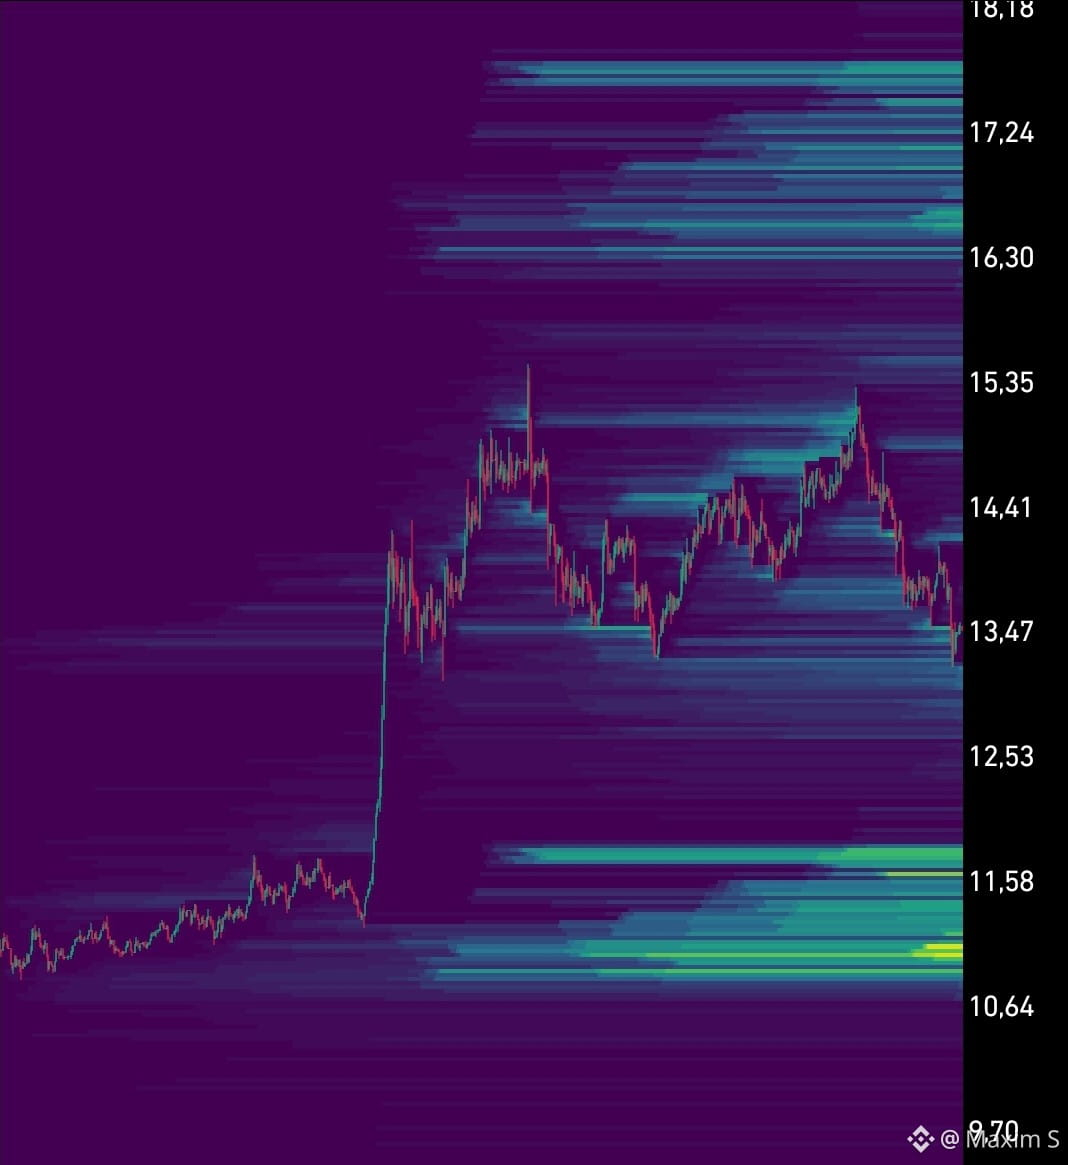
NMR: pullback into the power zone — is a rebound close? 🎯
After impulse 11.0 → 15.5 (+34%), the price formed a lower high and retreated to the EMA50 (13.20). Currently 13.36–13.41 — sellers are losing pressure.
📊 Indicators:
StochRSI 2.6 and RSI(6) 25 — strong oversold conditions. MACD is still bearish, and volumes are declining.
🔥 Scenario: LONG
• Conservative: 13.65–13.75 after consolidating above 13.60
• Aggressive: 13.25–13.40 from the EMA50
🎯 Targets:
13.98 — +4%
14.55 — +8.5%
15.30 — +14%
🛑 SL: 12.95 (-3.5%)
The idea works as long as the EMA50 holds. A 15m close below 13.20 invalidates the scenario and opens the way to EMA99 ~12.25.
Trading 👉$NMR
{future}(NMRUSDT)
NMR: pullback into the power zone — is a rebound close? 🎯
After impulse 11.0 → 15.5 (+34%), the price formed a lower high and retreated to the EMA50 (13.20). Currently 13.36–13.41 — sellers are losing pressure.
📊 Indicators:
StochRSI 2.6 and RSI(6) 25 — strong oversold conditions. MACD is still bearish, and volumes are declining.
🔥 Scenario: LONG
• Conservative: 13.65–13.75 after consolidating above 13.60
• Aggressive: 13.25–13.40 from the EMA50
🎯 Targets:
13.98 — +4%
14.55 — +8.5%
15.30 — +14%
🛑 SL: 12.95 (-3.5%)
The idea works as long as the EMA50 holds. A 15m close below 13.20 invalidates the scenario and opens the way to EMA99 ~12.25.
Trading 👉$NMR
After impulse 11.0 → 15.5 (+34%), the price formed a lower high and retreated to the EMA50 (13.20). Currently 13.36–13.41 — sellers are losing pressure.
📊 Indicators:
StochRSI 2.6 and RSI(6) 25 — strong oversold conditions. MACD is still bearish, and volumes are declining.
🔥 Scenario: LONG
• Conservative: 13.65–13.75 after consolidating above 13.60
• Aggressive: 13.25–13.40 from the EMA50
🎯 Targets:
13.98 — +4%
14.55 — +8.5%
15.30 — +14%
🛑 SL: 12.95 (-3.5%)
The idea works as long as the EMA50 holds. A 15m close below 13.20 invalidates the scenario and opens the way to EMA99 ~12.25.
Trading 👉$NMR
2
240
·
--
Bullish
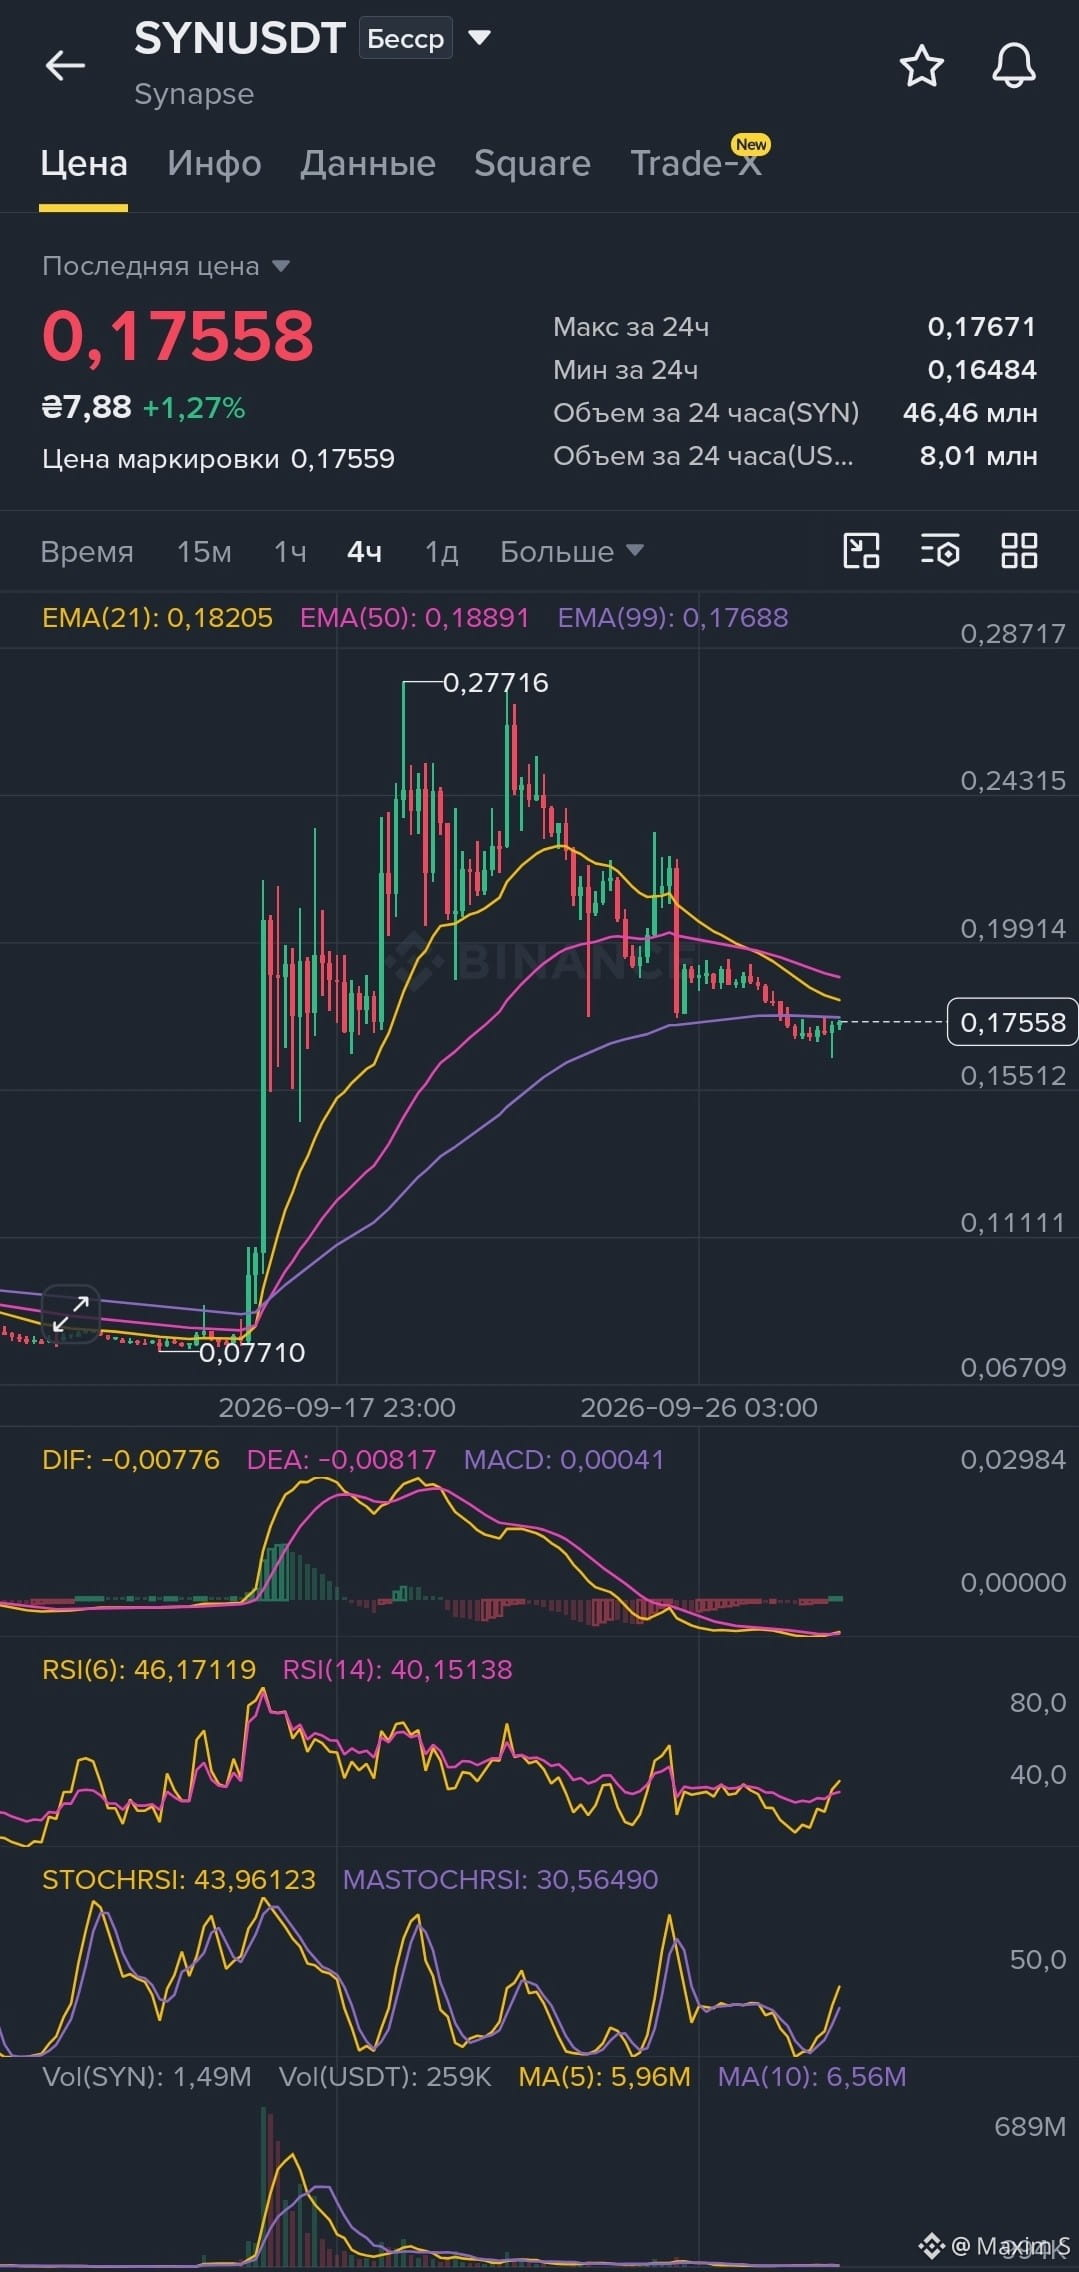
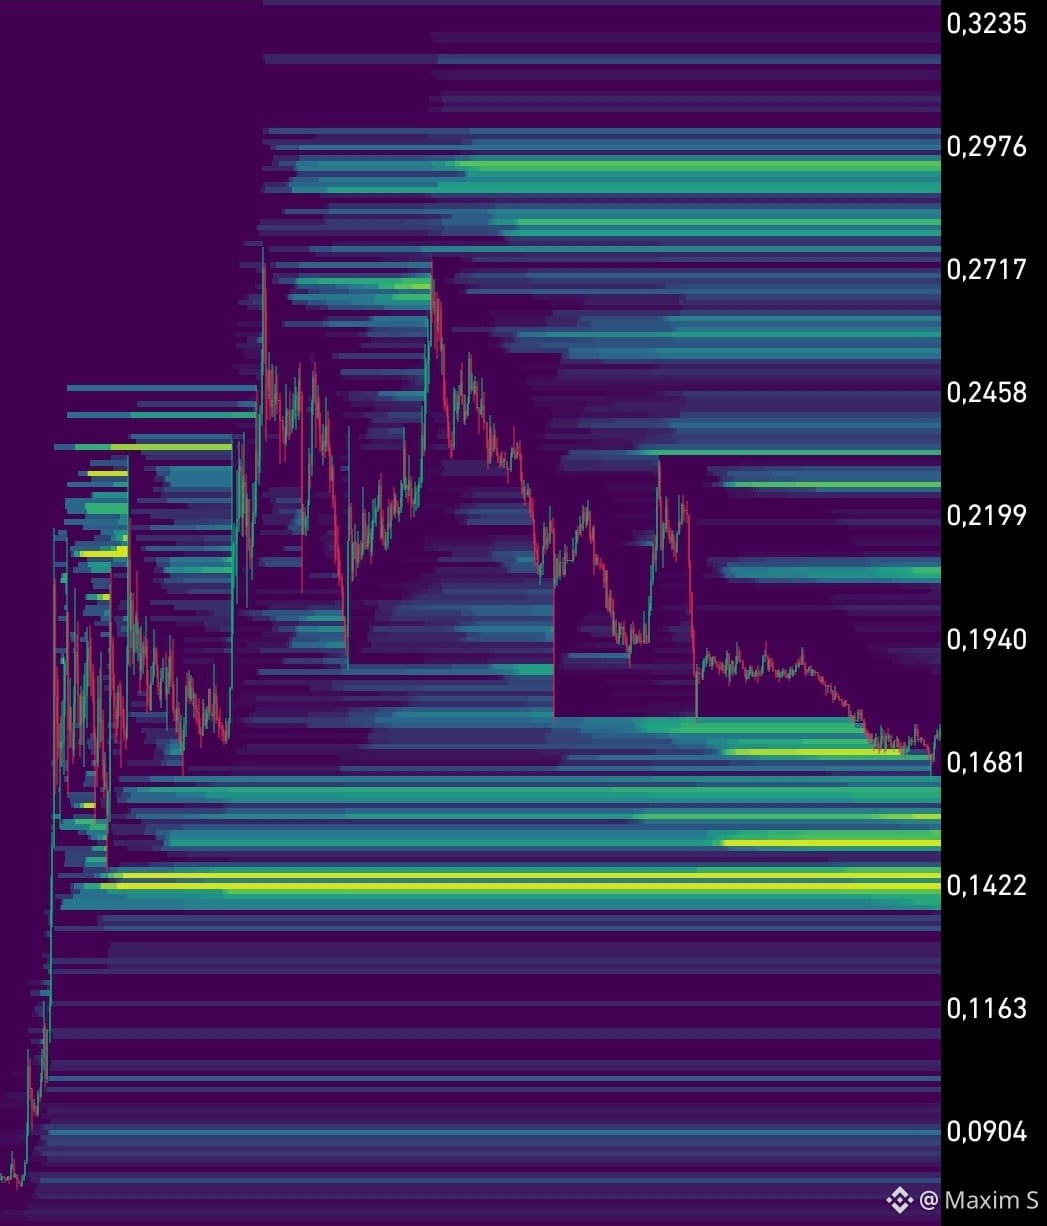
🔥 $SYN: Pullback to EMA99 — is a rebound being prepared?
After a strong impulse from 0.077 to 0.277 (+260%), the price corrected to 0.1648–0.1769 — this is where the 50% Fibonacci level and EMA99 meet. As long as the key support holds.
📊 Indicators:
MACD is preparing a bullish crossover, StochRSI has turned upward after coming out of oversold, and RSI is starting to recover. Trading volume has noticeably decreased — selling pressure is weakening.
📈 Scenario: LONG
🟢 Aggressive: 0.1740–0.1760
🔵 Conservative: 4H close above 0.1820 + retest
🎯 TP:
1️⃣ 0.1820 (+3.6%)
2️⃣ 0.1890 (+7.6%)
3️⃣ 0.2000 (+13.9%)
🛑 SL: 0.1640
⚠️ Losing 0.1648 cancels the rebound scenario. Next zones are 0.155 and 0.111.
The moment of truth — will EMA99 hold the price? 👀
Trading 👉$SYN
{future}(SYNUSDT)
🔥 $SYN : Pullback to EMA99 — is a rebound being prepared?
After a strong impulse from 0.077 to 0.277 (+260%), the price corrected to 0.1648–0.1769 — this is where the 50% Fibonacci level and EMA99 meet. As long as the key support holds.
📊 Indicators:
MACD is preparing a bullish crossover, StochRSI has turned upward after coming out of oversold, and RSI is starting to recover. Trading volume has noticeably decreased — selling pressure is weakening.
📈 Scenario: LONG
🟢 Aggressive: 0.1740–0.1760
🔵 Conservative: 4H close above 0.1820 + retest
🎯 TP:
1️⃣ 0.1820 (+3.6%)
2️⃣ 0.1890 (+7.6%)
3️⃣ 0.2000 (+13.9%)
🛑 SL: 0.1640
⚠️ Losing 0.1648 cancels the rebound scenario. Next zones are 0.155 and 0.111.
The moment of truth — will EMA99 hold the price? 👀
Trading 👉$SYN
After a strong impulse from 0.077 to 0.277 (+260%), the price corrected to 0.1648–0.1769 — this is where the 50% Fibonacci level and EMA99 meet. As long as the key support holds.
📊 Indicators:
MACD is preparing a bullish crossover, StochRSI has turned upward after coming out of oversold, and RSI is starting to recover. Trading volume has noticeably decreased — selling pressure is weakening.
📈 Scenario: LONG
🟢 Aggressive: 0.1740–0.1760
🔵 Conservative: 4H close above 0.1820 + retest
🎯 TP:
1️⃣ 0.1820 (+3.6%)
2️⃣ 0.1890 (+7.6%)
3️⃣ 0.2000 (+13.9%)
🛑 SL: 0.1640
⚠️ Losing 0.1648 cancels the rebound scenario. Next zones are 0.155 and 0.111.
The moment of truth — will EMA99 hold the price? 👀
Trading 👉$SYN
2
213
·
--
Bearish
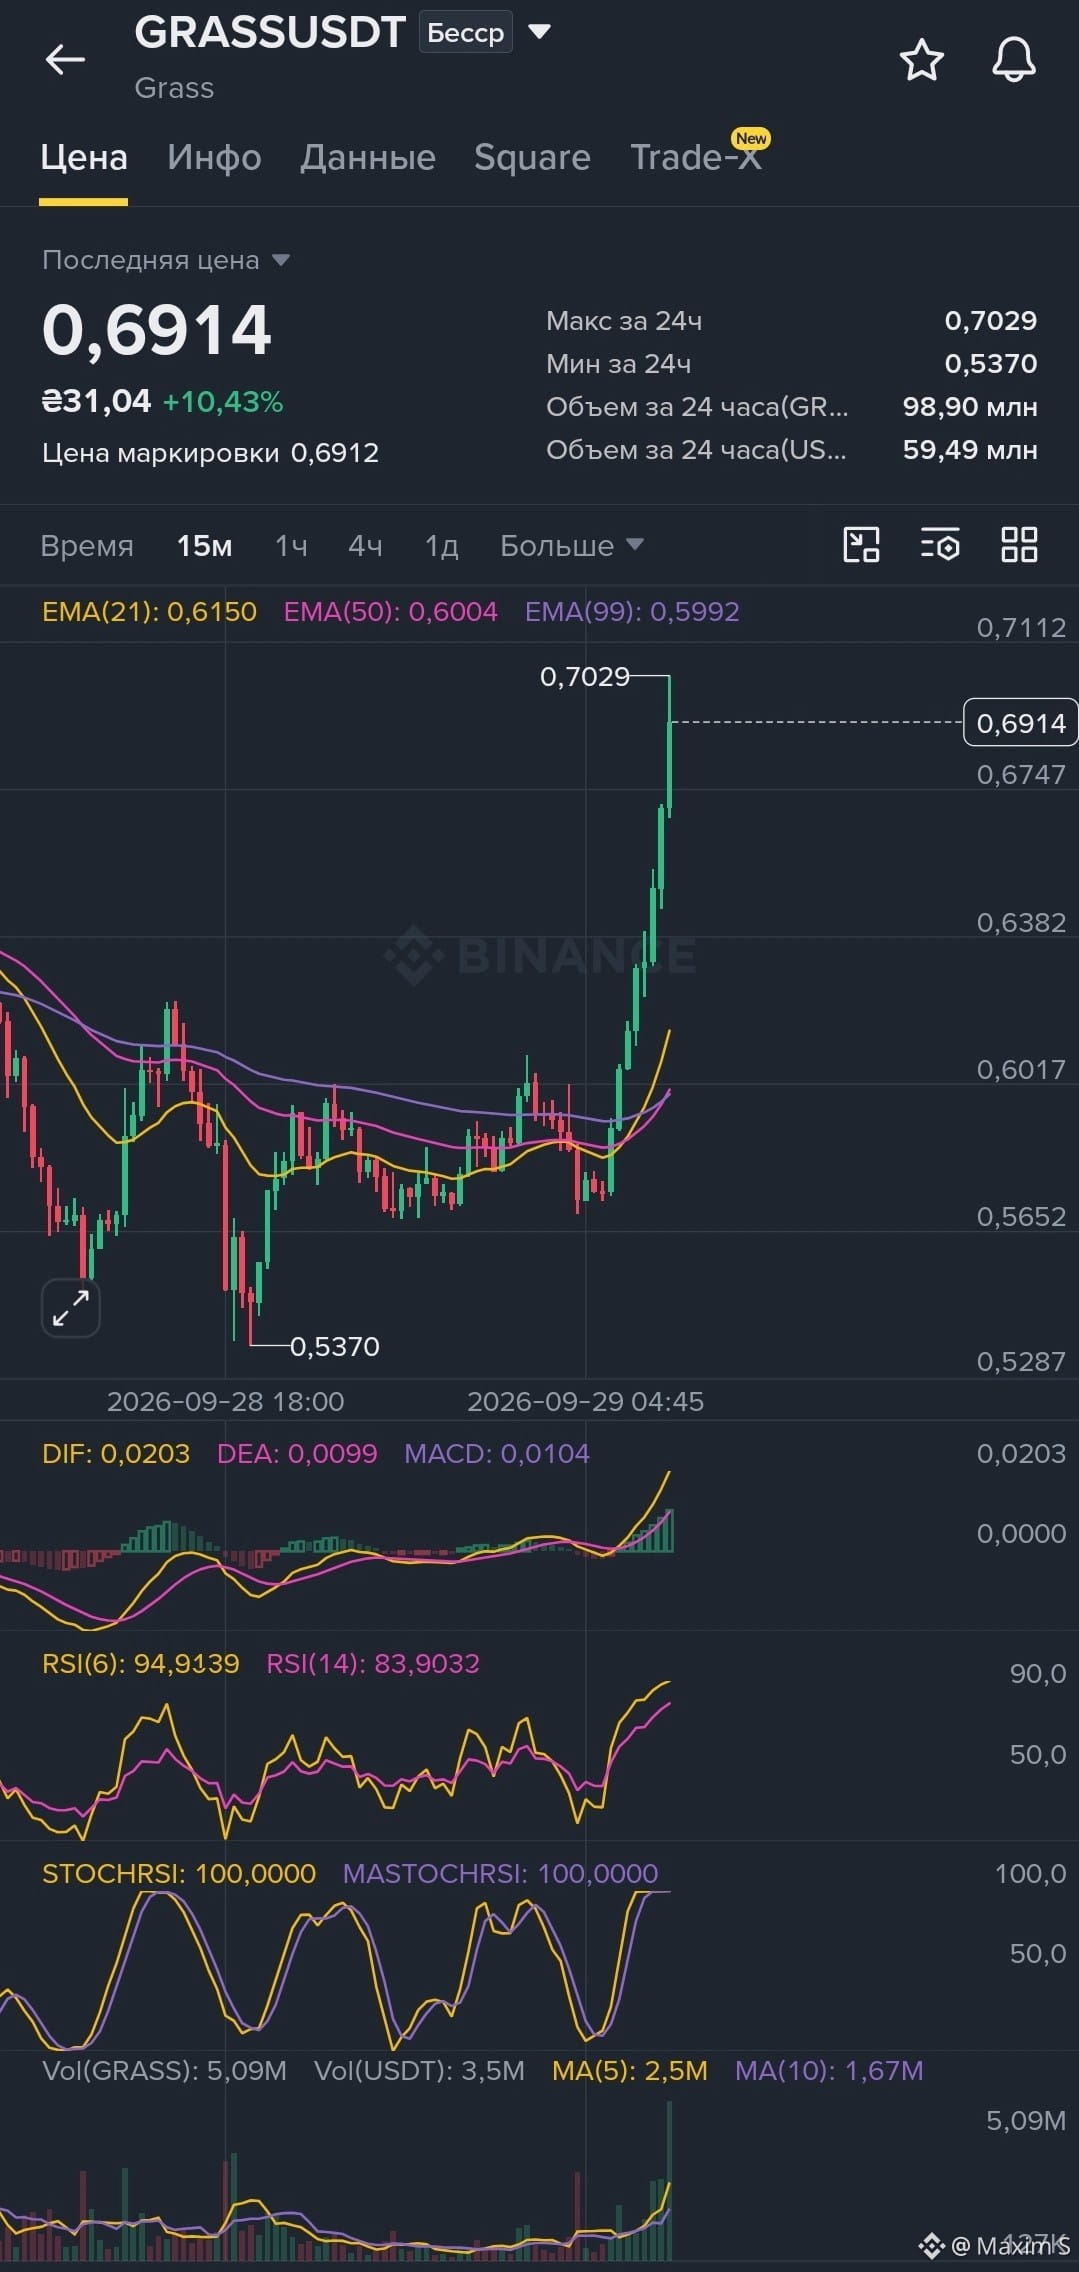
$GRASS Explicit decay of the pulse, preparing for correction before further movement 📉📈
$GRASS Explicit decay of the pulse, preparing for correction before further movement 📉📈
2
266
·
--
Bullish
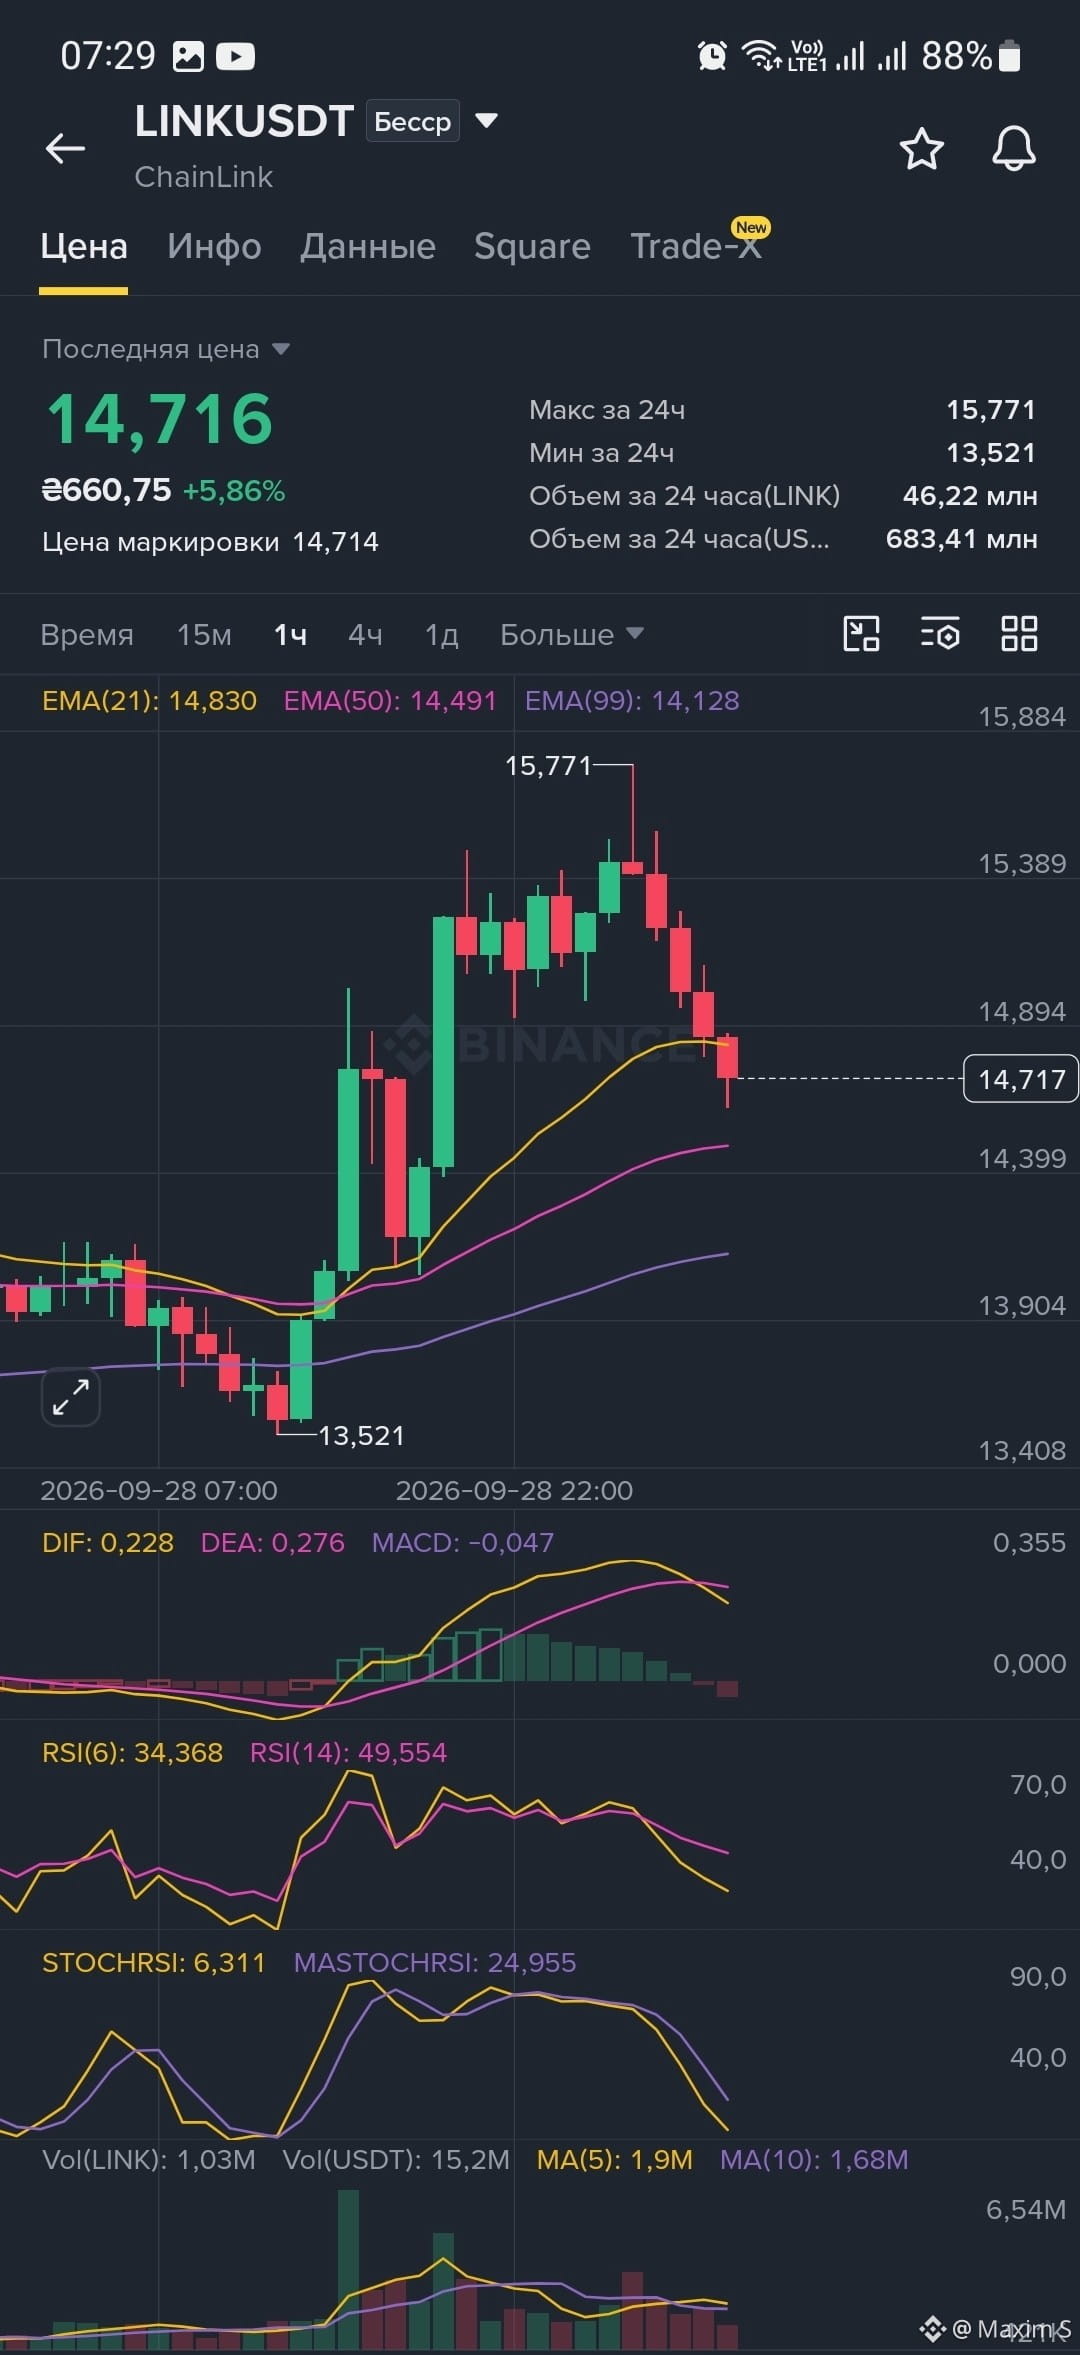
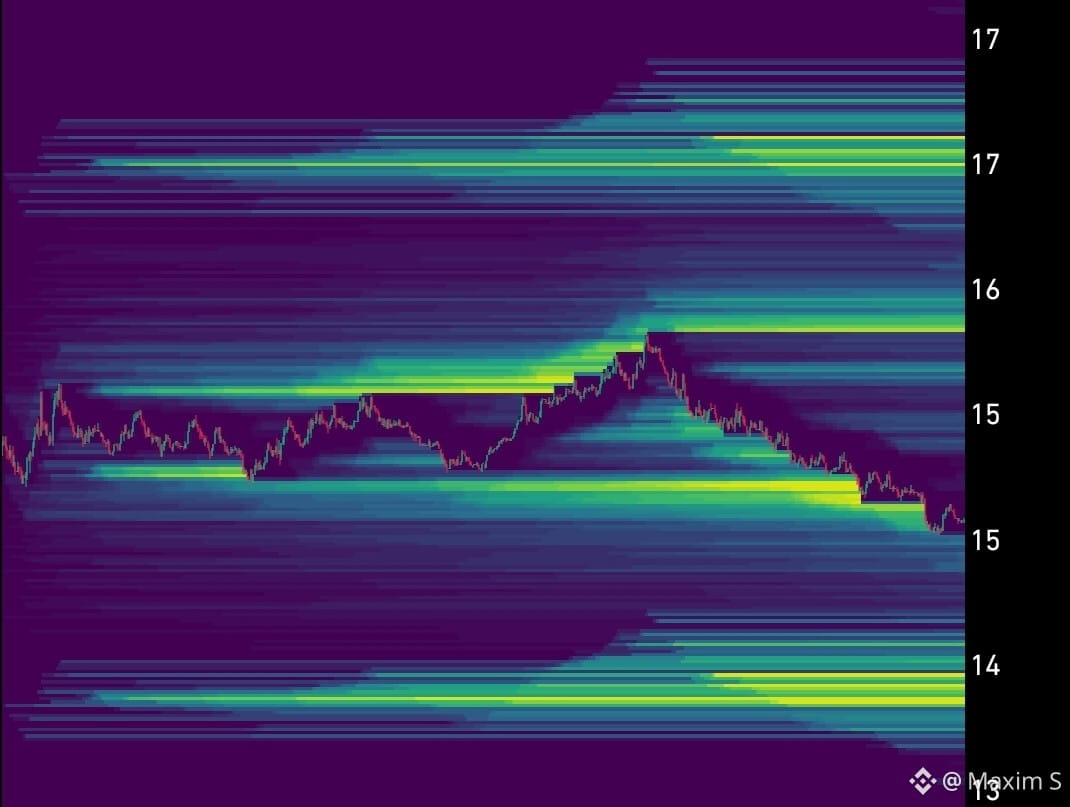
LINK/USDT: Correction over? Looking for a long entry point 📈
After a strong impulse to $15.77, the coin $LINK went through a sell-off reaction and smoothly pulled back to the key dynamic support of the EMA50 ($14.49). Right now, we’re seeing price compression in this zone, while oscillator indicators are signaling local oversold conditions.
Stoch RSI is in an extremely low area (6.3), which historically provides an excellent opportunity for a bounce and continuation of the uptrend.
📊 Trading plan (Priority: LONG)
🔹 Entry points:
Aggressive: $14.65 – $14.75 (based on current prices, aiming to hold above the EMA50)
Conservative: $14.40 – $14.50 (on a retest of the EMA50 or a false breakout)
🎯 Targets:
Target 1: $15.15 (+3.0%) — local resistance and confirmation level
Target 2: $15.55 (+5.7%) — test before the local high
Target 3: $15.80 (+7.4%) — new high of $15.77
🛑 Stop-loss: $14.10 (-4.1%) — below the EMA99 level ($14.128)
Trading 👉$LINK
{future}(LINKUSDT)
LINK/USDT: Correction over? Looking for a long entry point 📈
After a strong impulse to $15.77, the coin $LINK went through a sell-off reaction and smoothly pulled back to the key dynamic support of the EMA50 ($14.49). Right now, we’re seeing price compression in this zone, while oscillator indicators are signaling local oversold conditions.
Stoch RSI is in an extremely low area (6.3), which historically provides an excellent opportunity for a bounce and continuation of the uptrend.
📊 Trading plan (Priority: LONG)
🔹 Entry points:
Aggressive: $14.65 – $14.75 (based on current prices, aiming to hold above the EMA50)
Conservative: $14.40 – $14.50 (on a retest of the EMA50 or a false breakout)
🎯 Targets:
Target 1: $15.15 (+3.0%) — local resistance and confirmation level
Target 2: $15.55 (+5.7%) — test before the local high
Target 3: $15.80 (+7.4%) — new high of $15.77
🛑 Stop-loss: $14.10 (-4.1%) — below the EMA99 level ($14.128)
Trading 👉$LINK
After a strong impulse to $15.77, the coin $LINK went through a sell-off reaction and smoothly pulled back to the key dynamic support of the EMA50 ($14.49). Right now, we’re seeing price compression in this zone, while oscillator indicators are signaling local oversold conditions.
Stoch RSI is in an extremely low area (6.3), which historically provides an excellent opportunity for a bounce and continuation of the uptrend.
📊 Trading plan (Priority: LONG)
🔹 Entry points:
Aggressive: $14.65 – $14.75 (based on current prices, aiming to hold above the EMA50)
Conservative: $14.40 – $14.50 (on a retest of the EMA50 or a false breakout)
🎯 Targets:
Target 1: $15.15 (+3.0%) — local resistance and confirmation level
Target 2: $15.55 (+5.7%) — test before the local high
Target 3: $15.80 (+7.4%) — new high of $15.77
🛑 Stop-loss: $14.10 (-4.1%) — below the EMA99 level ($14.128)
Trading 👉$LINK
2
270
·
--
Bullish
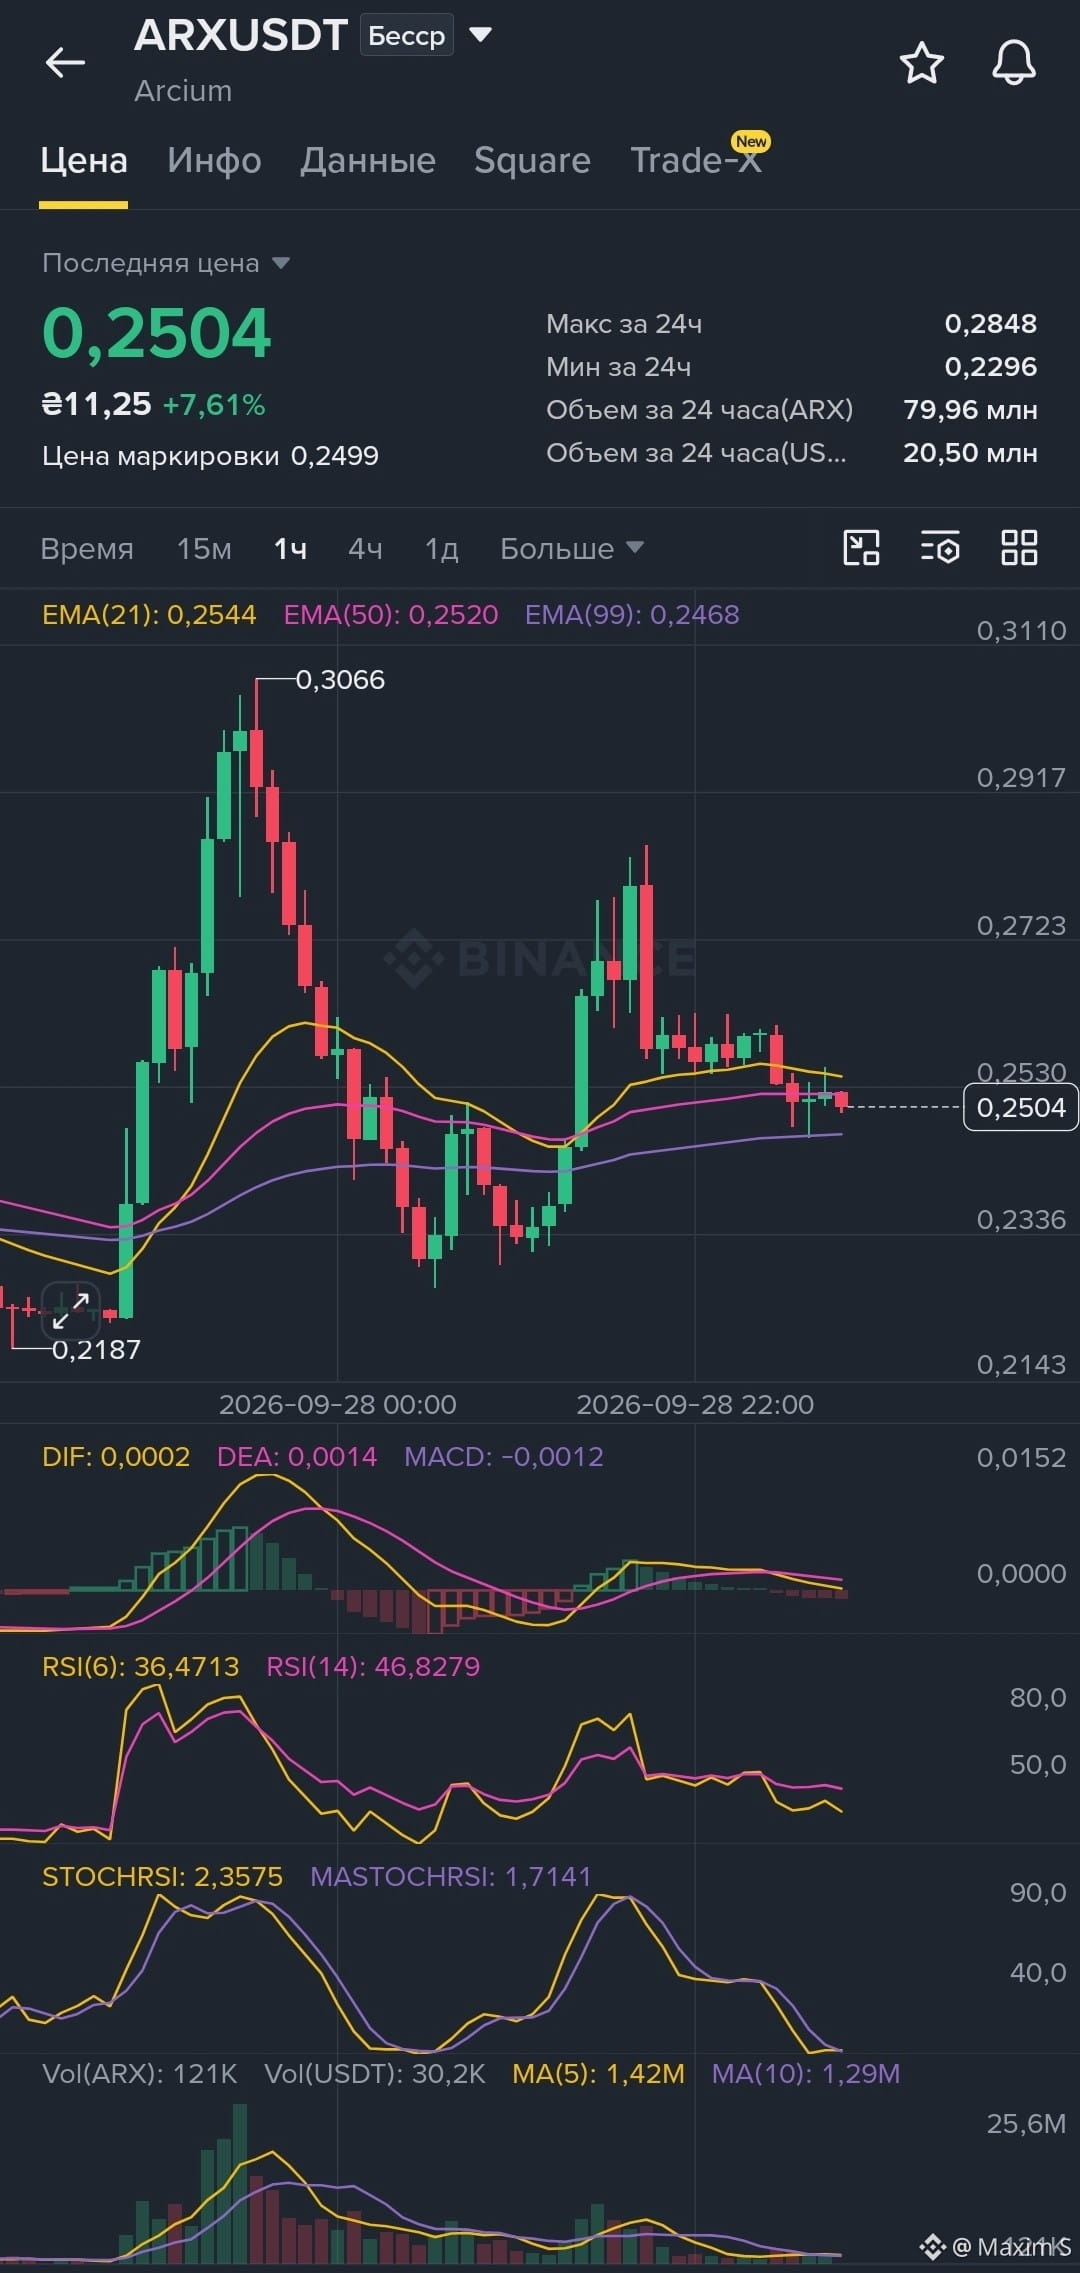
📈 ARX/USDT: Preparing for a bounce from key support?
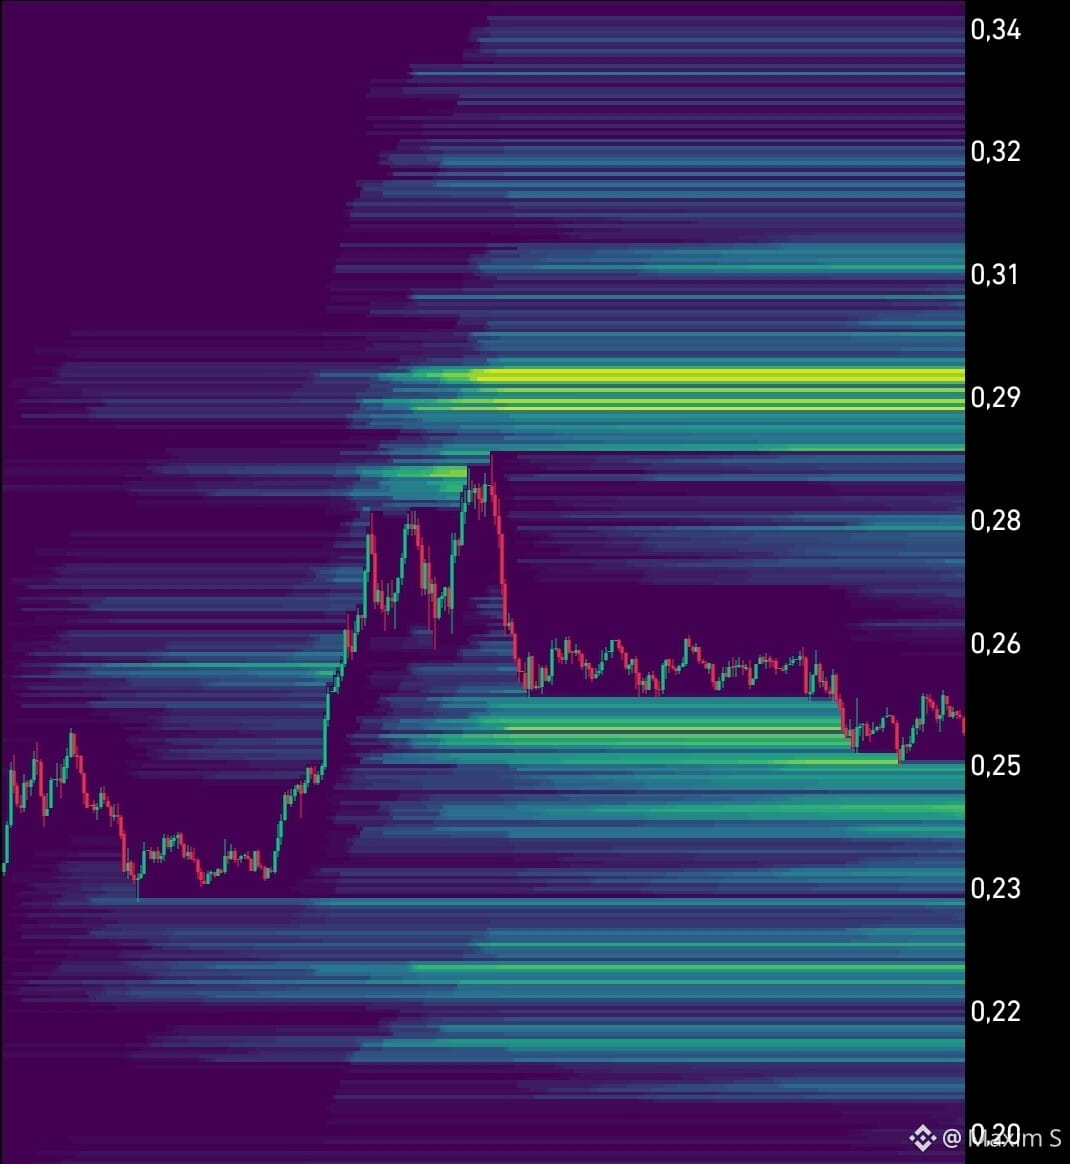
After a strong impulse, the price $ARX broke through a correction and became tightly consolidated in a narrow range just above the 99 EMA moving average (0.2468). Sellers are losing strength: volumes on the decline have dropped, and the Stoch RSI indicator is in deep oversold territory (2.35). The RSI(6) indicator is also turning near the oversold boundary.
Holding the EMA99 level creates an excellent opportunity for a local long scenario targeting a breakout above the nearest EMA21 and EMA50.
🎯 Trading plan (Long):
🟢 Conservative entry point: 0.2545 – 0.2550 (after a breakout and holding above EMA21 on the 1-hour candle)
⚡ Aggressive entry point: 0.2480 – 0.2505 (enter from current levels near EMA99 support)
🔴 Stop-loss: 0.2435 (below the local low and under EMA99, ~2.7% from the current price)
🚀 Targets:
0.2630 (+5.0% — local mirrored level)
0.2720 (+8.6% — previous impulse peak level)
0.2840 (+13.4% — testing the 24-hour high)
Trading 👉$ARX
{future}(ARXUSDT)
📈 ARX/USDT: Preparing for a bounce from key support?
After a strong impulse, the price $ARX broke through a correction and became tightly consolidated in a narrow range just above the 99 EMA moving average (0.2468). Sellers are losing strength: volumes on the decline have dropped, and the Stoch RSI indicator is in deep oversold territory (2.35). The RSI(6) indicator is also turning near the oversold boundary.
Holding the EMA99 level creates an excellent opportunity for a local long scenario targeting a breakout above the nearest EMA21 and EMA50.
🎯 Trading plan (Long):
🟢 Conservative entry point: 0.2545 – 0.2550 (after a breakout and holding above EMA21 on the 1-hour candle)
⚡ Aggressive entry point: 0.2480 – 0.2505 (enter from current levels near EMA99 support)
🔴 Stop-loss: 0.2435 (below the local low and under EMA99, ~2.7% from the current price)
🚀 Targets:
0.2630 (+5.0% — local mirrored level)
0.2720 (+8.6% — previous impulse peak level)
0.2840 (+13.4% — testing the 24-hour high)
Trading 👉$ARX
After a strong impulse, the price $ARX broke through a correction and became tightly consolidated in a narrow range just above the 99 EMA moving average (0.2468). Sellers are losing strength: volumes on the decline have dropped, and the Stoch RSI indicator is in deep oversold territory (2.35). The RSI(6) indicator is also turning near the oversold boundary.
Holding the EMA99 level creates an excellent opportunity for a local long scenario targeting a breakout above the nearest EMA21 and EMA50.
🎯 Trading plan (Long):
🟢 Conservative entry point: 0.2545 – 0.2550 (after a breakout and holding above EMA21 on the 1-hour candle)
⚡ Aggressive entry point: 0.2480 – 0.2505 (enter from current levels near EMA99 support)
🔴 Stop-loss: 0.2435 (below the local low and under EMA99, ~2.7% from the current price)
🚀 Targets:
0.2630 (+5.0% — local mirrored level)
0.2720 (+8.6% — previous impulse peak level)
0.2840 (+13.4% — testing the 24-hour high)
Trading 👉$ARX
1
192
Log in to explore more content
Join global crypto users on Binance Square
⚡️ Get latest and useful information about crypto.
💬 Trusted by the world’s largest crypto exchange.
👍 Discover real insights from verified creators.
Email / Phone number
Trending Topics
BitcoinClears$85200
1,066 views
76 Discussing
We got the move, and $BTC is standing exactly where we were before the data. That’s what actual patience for a trade looks like.
The data came in mixed but with some important numbers. ADP Non-Farm Employment Change came at 90K vs 73K forecast, while Core PCE came in at 0.2% vs 0.3% expected. Final GDP was also stronger at 2.2% vs 1.5% forecast, while Personal Spending came in at 0.9% vs 0.8% expected. At the same time, Personal Income missed at 0.2% vs 0.5% forecast.
BTC initially surged to $85,600 and is now back where it needs to be. I’m still looking toward the lower ranges at $82,759 and the $80,000 liquidity, because the overhead liquidity is done and dusted.
We had a live session during the data, and during that session we saw the market at $83,800, then $85,600, and then back toward $83,000 and we still didn’t enter a trade.
That’s what patience is.
We can’t force an entry when the market has no clear direction. The same range is still in focus, and we’ll wait for the market to give us the setup.
Let me know, guys, how was the session? And should we have more regular sessions with our respected members so we can have proper discussions regarding the market?
#BitcoinClears$85200 #AltcoinSeasonIndexHoldsAbove60For5Days #USADPAdds90000JobsInSeptember #BitcoinSlipsBelow$84000 #SECToClarifyOnChainFundraisingRules
Crypto_LUX
·16 Likes
·4k views
AltcoinSeasonIndexHoldsAbove60For5Days
9,616 views
487 Discussing
USADPAdds90000JobsInSeptember
2,717 views
227 Discussing