
MangoMan4
32 Posts

MangoMan4
Join me for expert chart analysis! 📊 Spot trends, get real-time insights & profitable strategies. Stay ahead—follow now & don’t miss out! 🔥 #Trading
1 Following
158 Followers
111 Liked
Posts
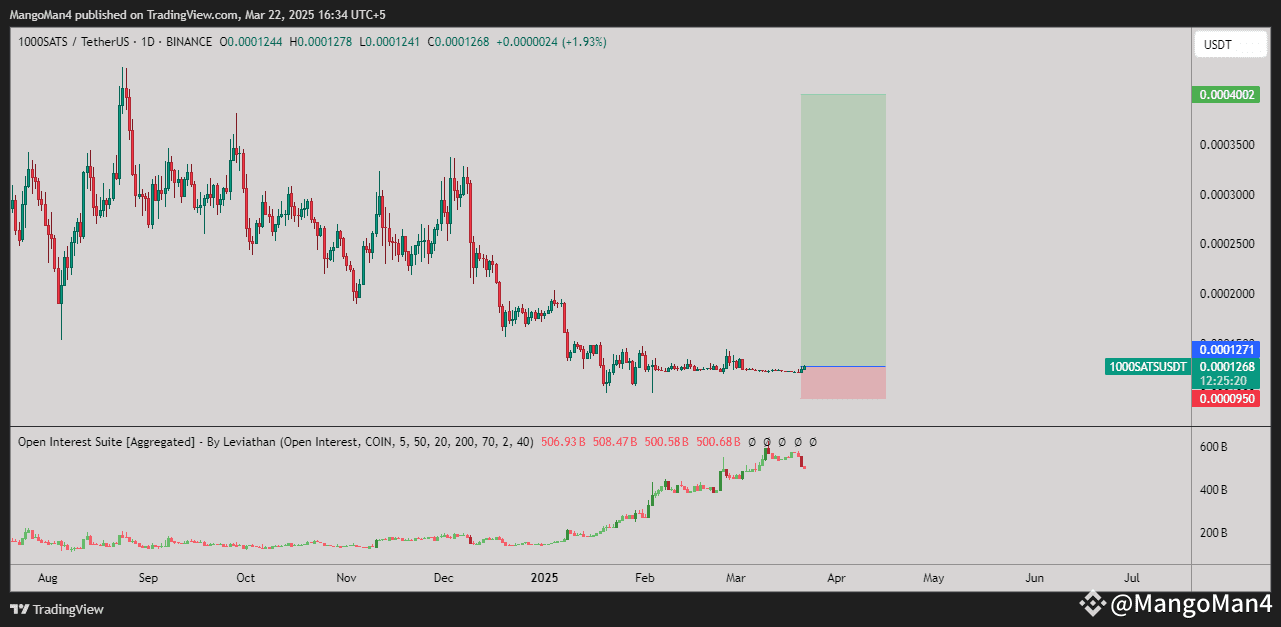
🚀 1000SATS Ready for a Big Move! 🚀
📊 Current Price: 0.0001268 (+1.93%)
📈 1000SATS is showing signs of a massive breakout!
✅ Bullish Signals:
🔥 Consolidation Phase Ending – breakout setup forming!
🔥 Price nearing key resistance (0.0001271) – breakout = 🚀
🔥 Risk-to-Reward Setup suggests a 3.5x potential gain!
🔹 Key Levels to Watch:
📌 Support: 0.0000950 (Strong base)
📌 Breakout Level: 0.0001271 (Watch for confirmation)
📌 Upside Target: 0.0004000 (3x move!)
💰 Traders, keep an eye on this low-cap gem! A breakout could send it flying! 🚀📢
📊 Current Price: 0.0001268 (+1.93%)
📈 1000SATS is showing signs of a massive breakout!
✅ Bullish Signals:
🔥 Consolidation Phase Ending – breakout setup forming!
🔥 Price nearing key resistance (0.0001271) – breakout = 🚀
🔥 Risk-to-Reward Setup suggests a 3.5x potential gain!
🔹 Key Levels to Watch:
📌 Support: 0.0000950 (Strong base)
📌 Breakout Level: 0.0001271 (Watch for confirmation)
📌 Upside Target: 0.0004000 (3x move!)
💰 Traders, keep an eye on this low-cap gem! A breakout could send it flying! 🚀📢
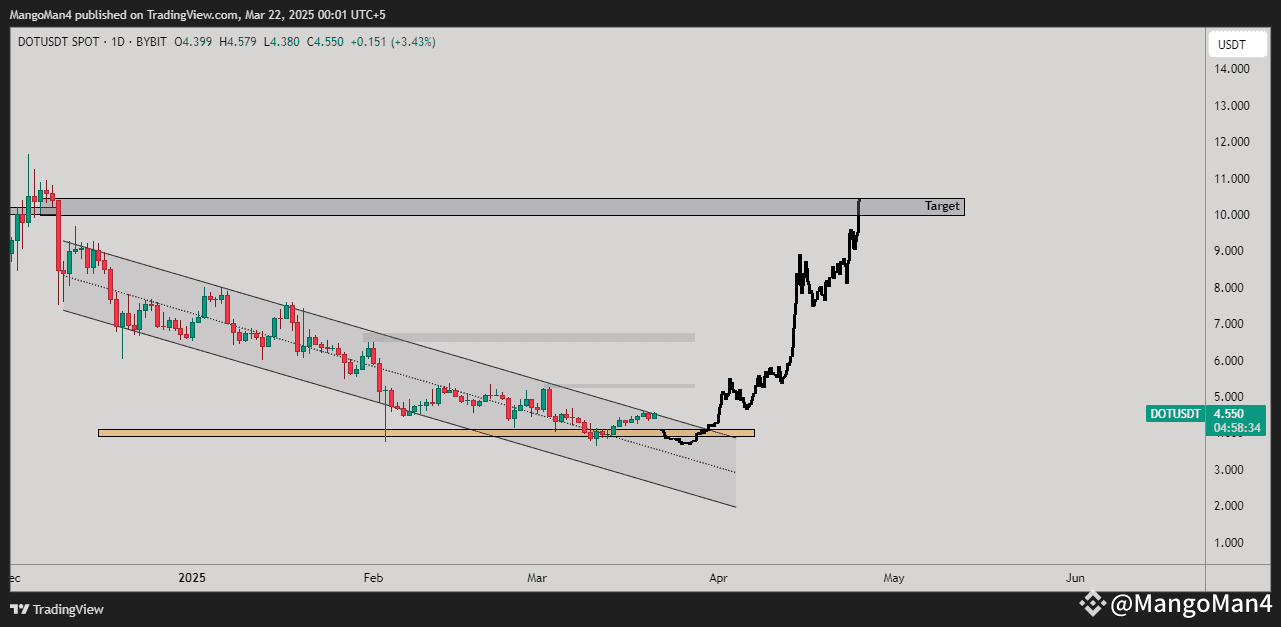
🚀 DOTUSDT: Major Breakout in Progress! 🚀
📊 Current Price: $4.550 (+3.43%)
📈 DOT has broken out of a long-term downtrend channel!
✅ Bullish Signals:
🔥 Strong support bounce at $4.00 – accumulation phase!
🔥 Breakout from a descending channel = potential trend reversal!
🔥 Price could rally to $10.00+ in the coming weeks!
🔹 Key Levels to Watch:
📌 Support: $4.20–$4.30 🔄 (Good re-entry zone)
📌 Resistance: $7.00 ➡️ $10.00 (Target)
💰 Traders, stay alert! DOT could see strong upside if momentum holds! 🚀📢
📊 Current Price: $4.550 (+3.43%)
📈 DOT has broken out of a long-term downtrend channel!
✅ Bullish Signals:
🔥 Strong support bounce at $4.00 – accumulation phase!
🔥 Breakout from a descending channel = potential trend reversal!
🔥 Price could rally to $10.00+ in the coming weeks!
🔹 Key Levels to Watch:
📌 Support: $4.20–$4.30 🔄 (Good re-entry zone)
📌 Resistance: $7.00 ➡️ $10.00 (Target)
💰 Traders, stay alert! DOT could see strong upside if momentum holds! 🚀📢
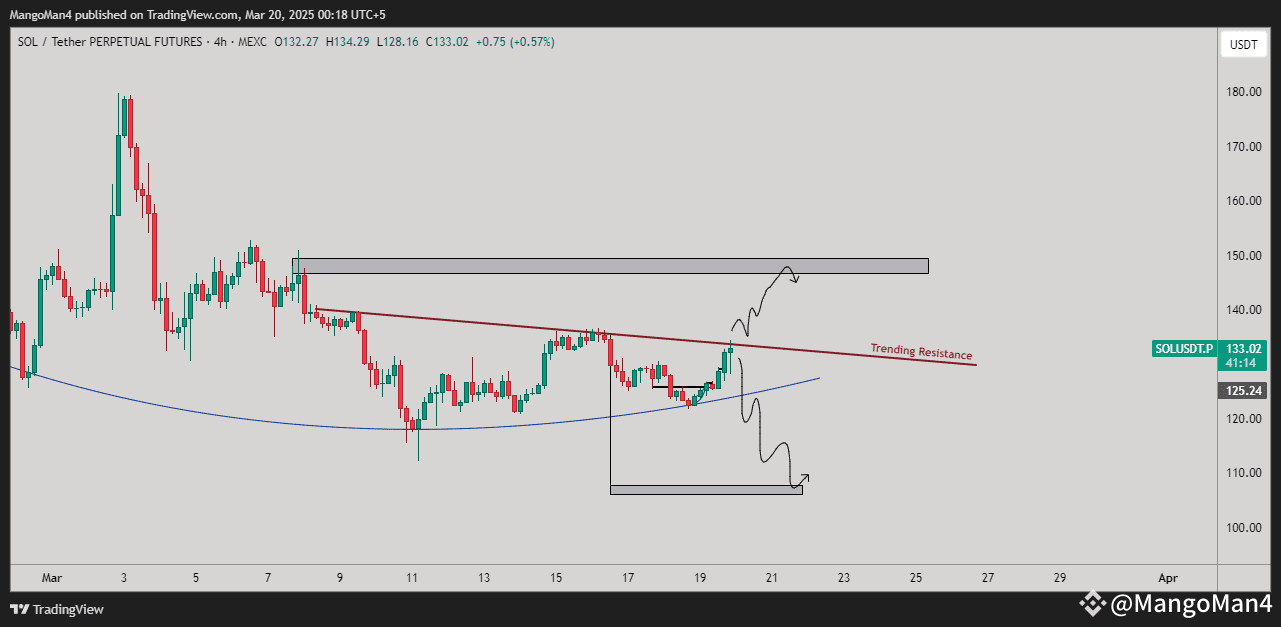
🔥 SOL Breakout or Rejection? Key Levels to Watch! 🔥
📊 Current Price: $133.02 (+0.57%)
📉 Trending Resistance Test Underway!
🚀 Key Insights:
✅ SOL is testing a major downtrend resistance level!
✅ A breakout above $136 could push prices toward the $148–$150 resistance zone!
✅ If rejected, SOL could drop to $125 or even $110!
🔹 Two Possible Moves! 🔹
📈 Breakout Above $136? Expect a rally toward $148+ 🚀
📉 Rejection at Resistance? Look for a drop to $110–$115 ⚠️
📢 Traders, stay alert! A breakout or rejection will determine the next big move! 💰🔥
#solana
📊 Current Price: $133.02 (+0.57%)
📉 Trending Resistance Test Underway!
🚀 Key Insights:
✅ SOL is testing a major downtrend resistance level!
✅ A breakout above $136 could push prices toward the $148–$150 resistance zone!
✅ If rejected, SOL could drop to $125 or even $110!
🔹 Two Possible Moves! 🔹
📈 Breakout Above $136? Expect a rally toward $148+ 🚀
📉 Rejection at Resistance? Look for a drop to $110–$115 ⚠️
📢 Traders, stay alert! A breakout or rejection will determine the next big move! 💰🔥
#solana
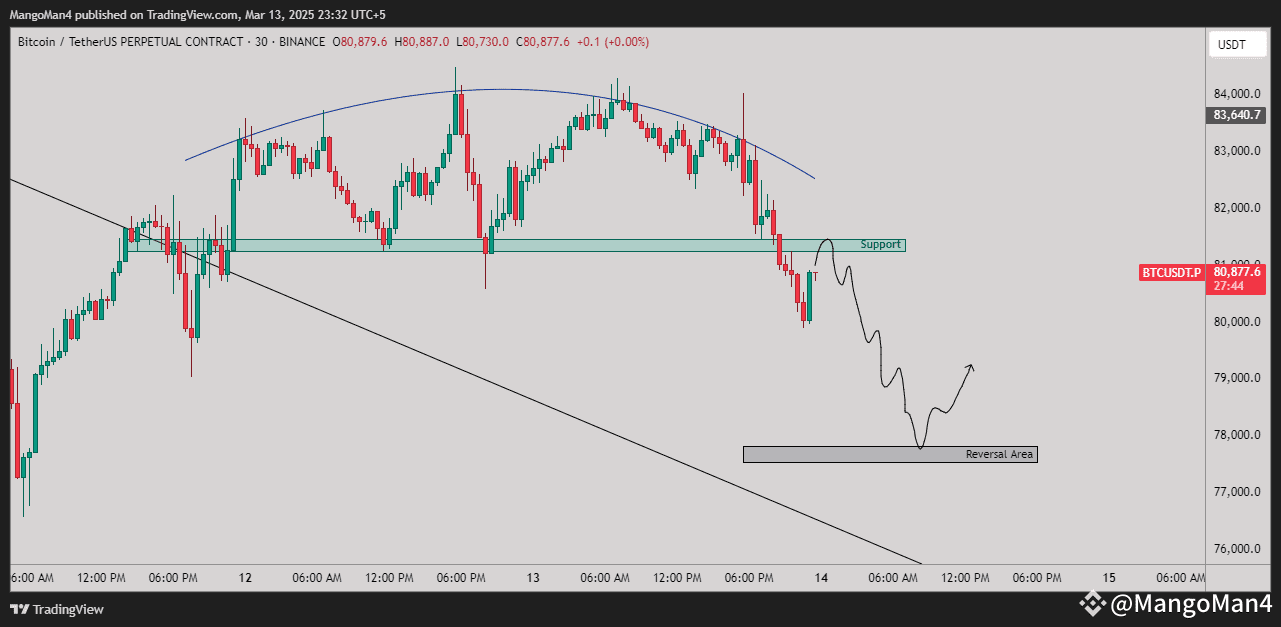
🚨 Bitcoin Breakdown – Next Stop: $78K? 🚨
📉 BTCUSDT is showing clear signs of a breakdown from an inverse parabolic structure, confirming bearish momentum. The price has broken key support near $81,000, and sellers are taking control.
💡 Key Observations:
🔹 Support Flip: The previous support zone is now acting as resistance. A retest around $81,000 could confirm further downside.
🔹 Reversal Zone: If selling pressure continues, we expect BTC to find a reversal around $78,000 - $77,500.
🔹 Bearish Structure: A lower high formation aligns with continued weakness, but we anticipate potential bullish recovery from the marked reversal area.
⚡ Potential Trade Idea:
🟥 Short below $81,000, targeting $78,000.
🟩 Look for long opportunities near $77,500 - $78,000.
📊 Will BTC bounce from the reversal area, or are we heading to lower levels? Let us know in the comments!
🔔 Follow for daily BTC updates!
#BTC
📉 BTCUSDT is showing clear signs of a breakdown from an inverse parabolic structure, confirming bearish momentum. The price has broken key support near $81,000, and sellers are taking control.
💡 Key Observations:
🔹 Support Flip: The previous support zone is now acting as resistance. A retest around $81,000 could confirm further downside.
🔹 Reversal Zone: If selling pressure continues, we expect BTC to find a reversal around $78,000 - $77,500.
🔹 Bearish Structure: A lower high formation aligns with continued weakness, but we anticipate potential bullish recovery from the marked reversal area.
⚡ Potential Trade Idea:
🟥 Short below $81,000, targeting $78,000.
🟩 Look for long opportunities near $77,500 - $78,000.
📊 Will BTC bounce from the reversal area, or are we heading to lower levels? Let us know in the comments!
🔔 Follow for daily BTC updates!
#BTC
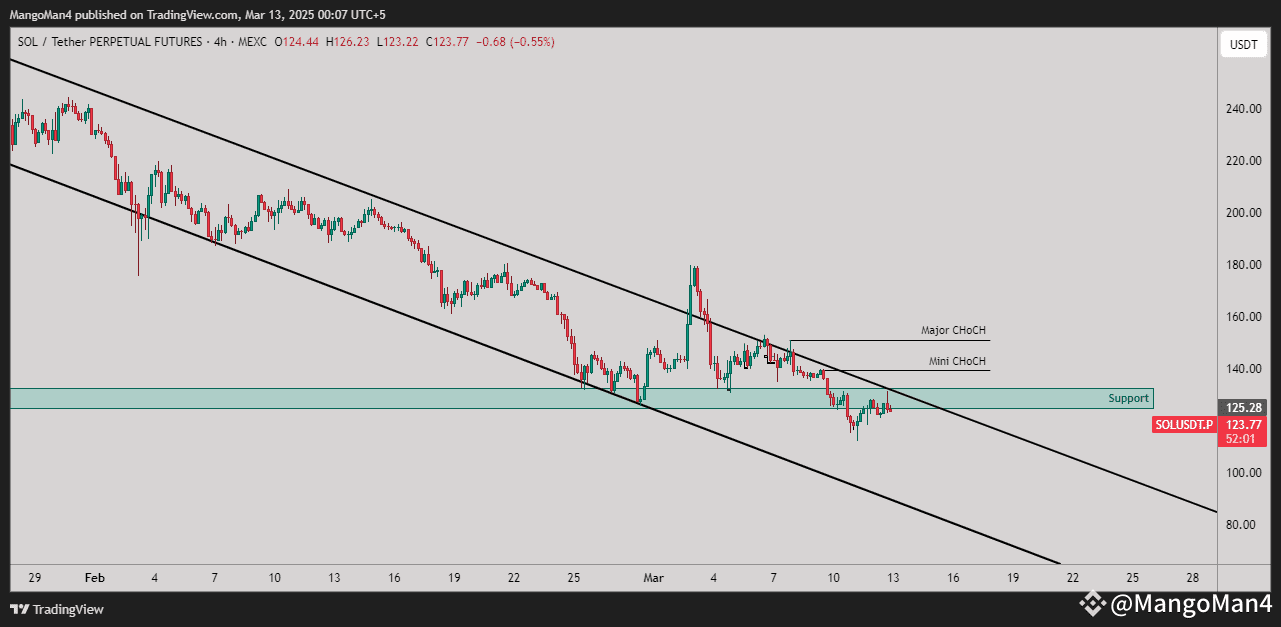
SOLUSDT Technical Analysis – March 13, 2025
🔹 Current Price: $123.77
🔹 Timeframe: 4-Hour Chart
🔹 Market Structure: Descending Channel with Change of Character (ChoCH) Signals
📊 Analysis:
Solana (SOL) has been trading within a well-defined descending channel for over a month, indicating a persistent downtrend. However, two Change of Character (ChoCH) points suggest potential shifts in momentum.
📉 Bearish Scenario:
🔻 SOL is still trading below key resistance within the bearish channel.
🔻 If the support zone ($125 - $130) fails to hold, the price could retest the lower boundary of the channel near $100 - $110.
🔻 A continuation of the downtrend could push the price toward the next demand zone near $80 - $90.
📈 Bullish Scenario:
✅ A breakout above the Mini ChoCH level (~$135 - $140) would indicate early bullish strength.
✅ If SOL breaks the Major ChoCH level (~$150 - $160) and retests successfully, it could confirm a trend reversal.
✅ A breakout from the descending channel could trigger a rally towards $180 - $200.
🚨 Key Levels to Watch:
🔹 Resistance: $135 (Mini ChoCH), $150-$160 (Major ChoCH)
🔹 Support: $125 - $130 (current demand zone), $100 - $110 (lower channel support)
📢 Final Thoughts:
SOL is at a crucial decision point! If bulls manage to break key resistance levels, we could see a trend reversal. Otherwise, the downtrend may continue. Stay alert!
🔔 Follow for more real-time crypto insights and market updates! 🚀
#solana
🔹 Current Price: $123.77
🔹 Timeframe: 4-Hour Chart
🔹 Market Structure: Descending Channel with Change of Character (ChoCH) Signals
📊 Analysis:
Solana (SOL) has been trading within a well-defined descending channel for over a month, indicating a persistent downtrend. However, two Change of Character (ChoCH) points suggest potential shifts in momentum.
📉 Bearish Scenario:
🔻 SOL is still trading below key resistance within the bearish channel.
🔻 If the support zone ($125 - $130) fails to hold, the price could retest the lower boundary of the channel near $100 - $110.
🔻 A continuation of the downtrend could push the price toward the next demand zone near $80 - $90.
📈 Bullish Scenario:
✅ A breakout above the Mini ChoCH level (~$135 - $140) would indicate early bullish strength.
✅ If SOL breaks the Major ChoCH level (~$150 - $160) and retests successfully, it could confirm a trend reversal.
✅ A breakout from the descending channel could trigger a rally towards $180 - $200.
🚨 Key Levels to Watch:
🔹 Resistance: $135 (Mini ChoCH), $150-$160 (Major ChoCH)
🔹 Support: $125 - $130 (current demand zone), $100 - $110 (lower channel support)
📢 Final Thoughts:
SOL is at a crucial decision point! If bulls manage to break key resistance levels, we could see a trend reversal. Otherwise, the downtrend may continue. Stay alert!
🔔 Follow for more real-time crypto insights and market updates! 🚀
#solana
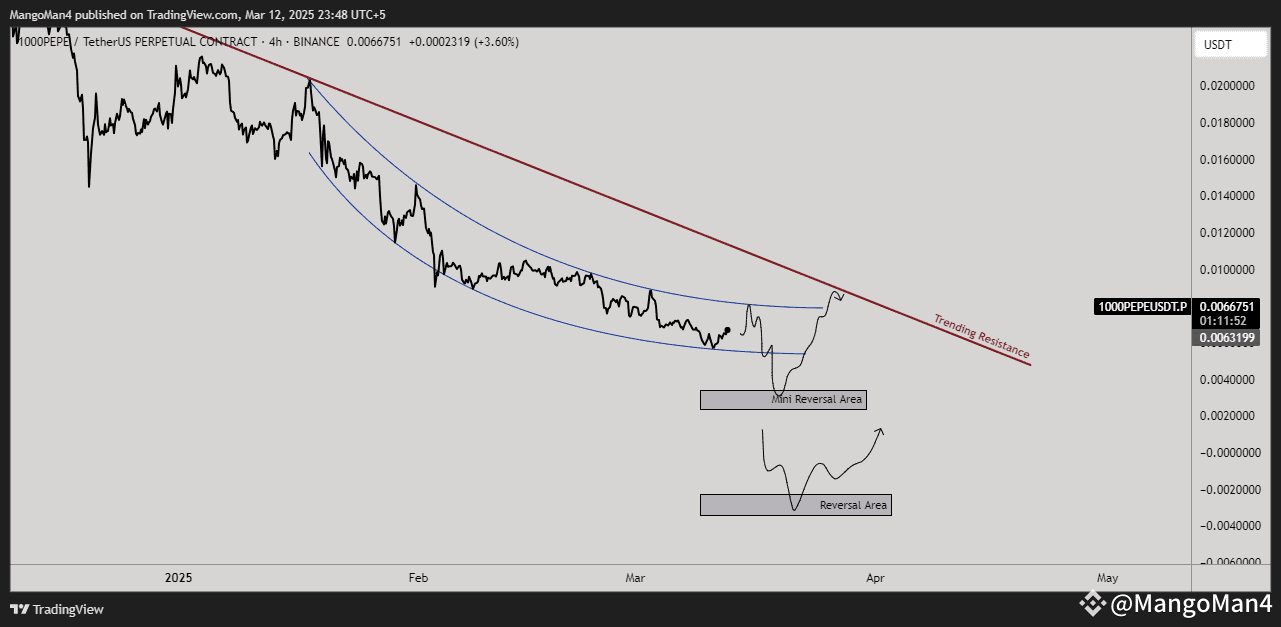
PEPEUSDT Technical Analysis – March 12, 2025
🔹 Current Price: $0.0066751
🔹 Timeframe: 4-Hour Chart
🔹 Market Structure: Falling wedge breakout with resistance ahead
📊 Analysis:
1000PEPE has been in a prolonged downtrend, forming a falling wedge pattern. This is generally a bullish reversal structure, and recent price action suggests that momentum is shifting. However, there is a major trendline resistance (red) ahead that could act as a barrier for further upside.
📉 Bearish Scenario:
🔻 If the price gets rejected at the trendline resistance, a pullback towards the Mini Reversal Area ($0.0045 - $0.0050) is likely.
🔻 A deeper correction could push the price down to the Reversal Area ($0.0025 - $0.0035) before a potential bounce.
🔻 Failing to hold the Reversal Area could lead to further downside.
📈 Bullish Scenario:
✅ If 1000PEPE breaks above the red trendline resistance, it could trigger a strong breakout toward $0.010 - $0.012.
✅ A successful retest of the breakout level would confirm bullish strength.
✅ Watch for higher lows and increased volume for confirmation.
🚨 Key Levels to Watch:
🔹 Resistance: $0.0075 (trendline), $0.010
🔹 Support: $0.0045 (mini reversal area), $0.0025 (major support)
📢 Final Thoughts:
1000PEPE is at a critical decision point! If bulls manage to break the trendline resistance, expect a strong rally. Otherwise, a pullback to lower support levels is likely. Patience is key—watch how price reacts!
🔔 Follow for more crypto insights and trading setups! 🚀
🔹 Current Price: $0.0066751
🔹 Timeframe: 4-Hour Chart
🔹 Market Structure: Falling wedge breakout with resistance ahead
📊 Analysis:
1000PEPE has been in a prolonged downtrend, forming a falling wedge pattern. This is generally a bullish reversal structure, and recent price action suggests that momentum is shifting. However, there is a major trendline resistance (red) ahead that could act as a barrier for further upside.
📉 Bearish Scenario:
🔻 If the price gets rejected at the trendline resistance, a pullback towards the Mini Reversal Area ($0.0045 - $0.0050) is likely.
🔻 A deeper correction could push the price down to the Reversal Area ($0.0025 - $0.0035) before a potential bounce.
🔻 Failing to hold the Reversal Area could lead to further downside.
📈 Bullish Scenario:
✅ If 1000PEPE breaks above the red trendline resistance, it could trigger a strong breakout toward $0.010 - $0.012.
✅ A successful retest of the breakout level would confirm bullish strength.
✅ Watch for higher lows and increased volume for confirmation.
🚨 Key Levels to Watch:
🔹 Resistance: $0.0075 (trendline), $0.010
🔹 Support: $0.0045 (mini reversal area), $0.0025 (major support)
📢 Final Thoughts:
1000PEPE is at a critical decision point! If bulls manage to break the trendline resistance, expect a strong rally. Otherwise, a pullback to lower support levels is likely. Patience is key—watch how price reacts!
🔔 Follow for more crypto insights and trading setups! 🚀
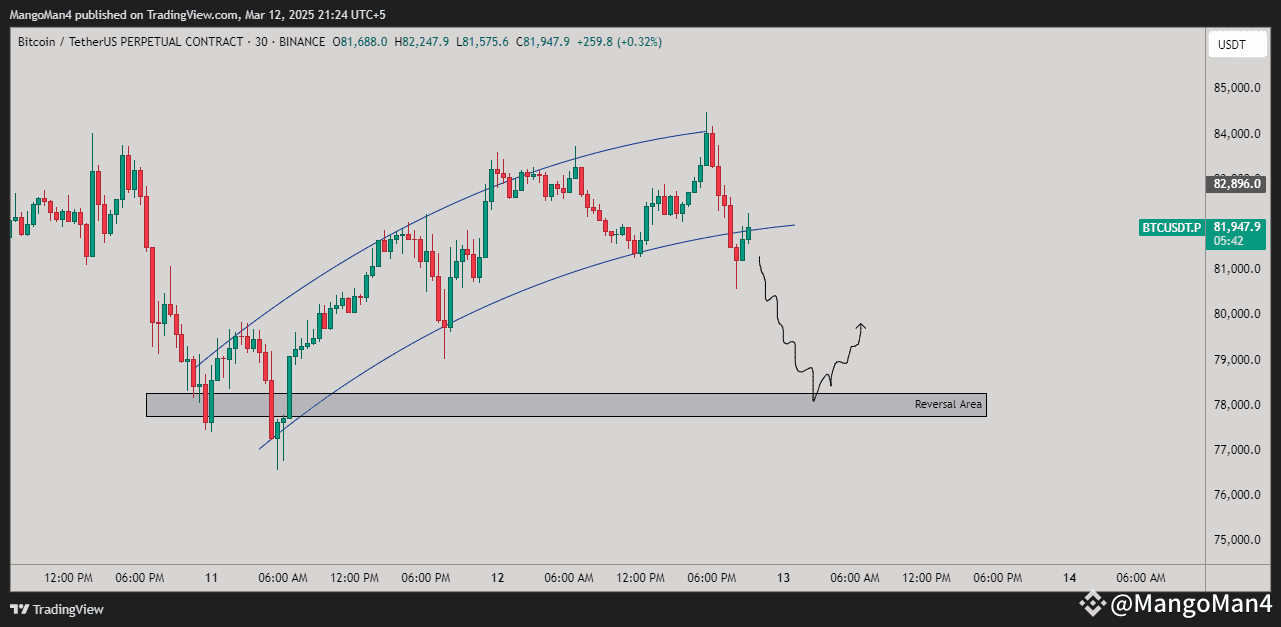
Bitcoin (BTC) Technical Analysis – March 12, 2025
🔹 Current Price: $81,947.9
🔹 Timeframe: 30-Minute Chart
🔹 Market Structure: Parabolic curve breakdown, potential support zone
📊 Analysis:
Bitcoin recently formed a parabolic ascending structure, but has now broken below the curve, signaling a potential trend shift. The price is currently testing a key support zone, and if it fails to hold, a drop towards the $78,000 - $79,000 Reversal Area could be expected.
📉 Bearish Scenario:
🔻 BTC has broken below the curved support, confirming weakness.
🔻 If rejection happens near $82,000, price may continue to drop toward $78,000.
🔻 Watch for a reaction at the Reversal Area (gray zone).
📈 Bullish Scenario:
✅ A bounce from the $78,000 - $79,000 level could provide a long opportunity.
✅ Confirmation of higher lows and bullish volume could indicate a strong recovery.
✅ Breaking back above $82,500 may invalidate the bearish outlook.
🚨 Key Levels to Watch:
🔹 Support: $78,000 - $79,000
🔹 Resistance: $82,500 - $83,000
📢 Final Thoughts:
Traders should watch price action at the Reversal Area to determine the next big move. If BTC finds strong demand at support, a reversal is likely, otherwise, further downside could continue.
🔔 Follow for more live updates and trade setups! 🚀
🔹 Current Price: $81,947.9
🔹 Timeframe: 30-Minute Chart
🔹 Market Structure: Parabolic curve breakdown, potential support zone
📊 Analysis:
Bitcoin recently formed a parabolic ascending structure, but has now broken below the curve, signaling a potential trend shift. The price is currently testing a key support zone, and if it fails to hold, a drop towards the $78,000 - $79,000 Reversal Area could be expected.
📉 Bearish Scenario:
🔻 BTC has broken below the curved support, confirming weakness.
🔻 If rejection happens near $82,000, price may continue to drop toward $78,000.
🔻 Watch for a reaction at the Reversal Area (gray zone).
📈 Bullish Scenario:
✅ A bounce from the $78,000 - $79,000 level could provide a long opportunity.
✅ Confirmation of higher lows and bullish volume could indicate a strong recovery.
✅ Breaking back above $82,500 may invalidate the bearish outlook.
🚨 Key Levels to Watch:
🔹 Support: $78,000 - $79,000
🔹 Resistance: $82,500 - $83,000
📢 Final Thoughts:
Traders should watch price action at the Reversal Area to determine the next big move. If BTC finds strong demand at support, a reversal is likely, otherwise, further downside could continue.
🔔 Follow for more live updates and trade setups! 🚀
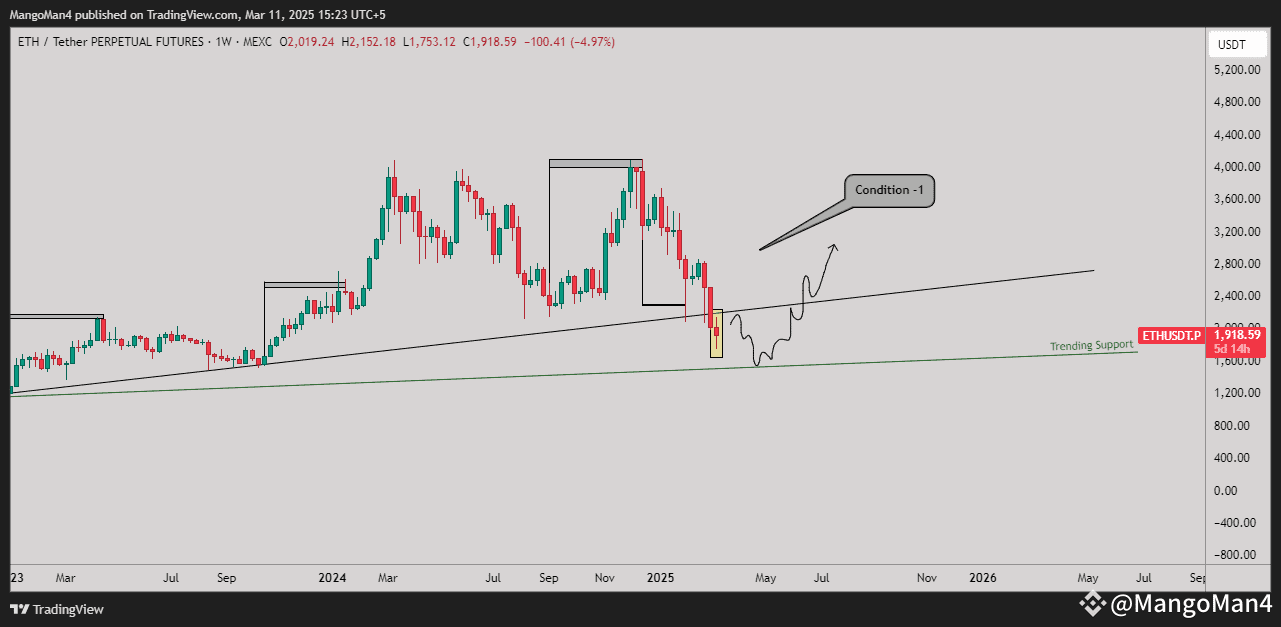
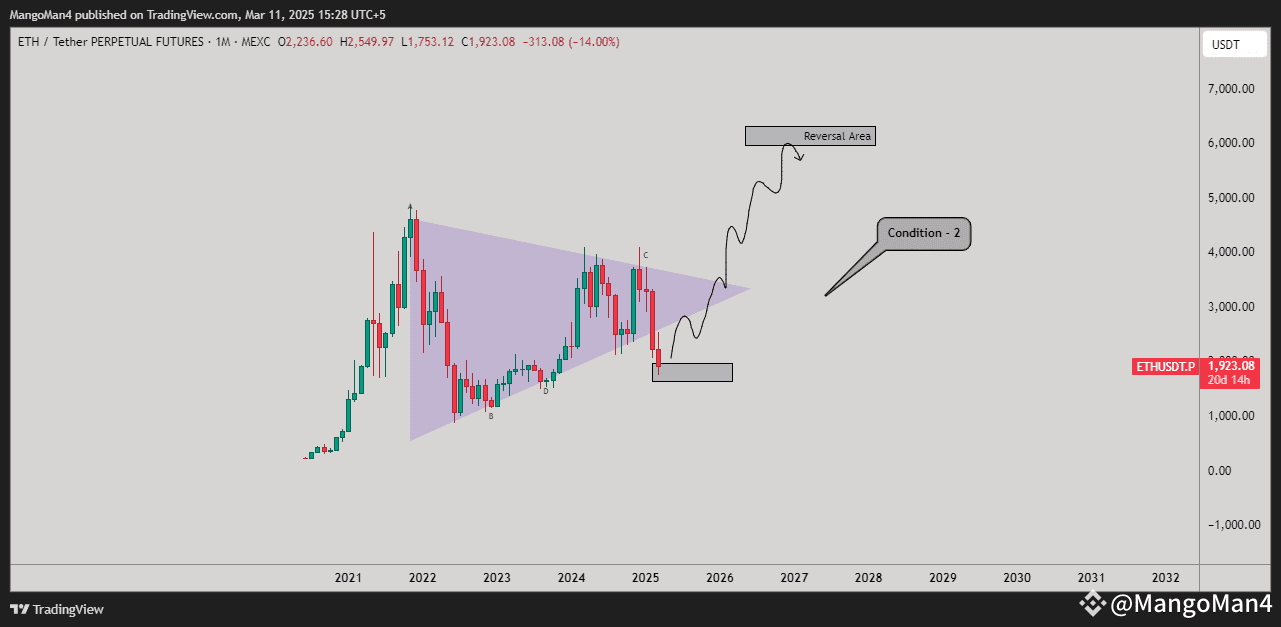
ETH/USDT Perpetual Futures Analysis – March 11, 2025
Condition 1: Weekly Support and Potential Rebound
ETH/USDT is currently trading at $1,918.59, with a recent low of $1,753.12.
The price has reached a critical trendline support that has been respected since early 2023.
A bullish rejection is forming near this trendline, with a wick indicating buying pressure from the demand zone.
If ETH maintains this level and confirms a reversal, the next potential resistance targets are:
$2,400 (previous support turned resistance)
$3,000 (major psychological level and structural resistance)
Bullish Confirmation:
A daily close above $2,000 would strengthen the bullish outlook.
Breaking above the trendline retest area around $2,400 would indicate strong momentum.
Bearish Risk:
Losing support at $1,750 could invalidate this scenario and send ETH toward $1,500, aligning with the next major support.
Condition 2: Monthly Triangle Breakout & Long-Term Target
On the monthly timeframe, ETH/USDT has broken out of a symmetrical triangle pattern.
The breakdown has led to a retest of the $1,750-$1,800 demand zone.
If this zone holds, a strong rebound could push ETH toward the reversal area near $6,000 over the next market cycle.
Bullish Pathway:
A confirmed rebound and close above $2,500 could trigger a long-term recovery.
Breaking $3,500 would signal the start of a bullish rally toward $5,000-$6,000.
Bearish Risk:
A failure to hold the $1,750 level could trigger further declines toward $1,500-$1,200 before any potential recovery.
Conclusion
Both conditions suggest ETH/USDT is at a pivotal support level. The next few weeks will determine whether a strong recovery begins or further downside is expected. Traders should watch for confirmations near $2,000-$2,500 for a bullish continuation or prepare for further dips if support fails.
#ETH
Condition 1: Weekly Support and Potential Rebound
ETH/USDT is currently trading at $1,918.59, with a recent low of $1,753.12.
The price has reached a critical trendline support that has been respected since early 2023.
A bullish rejection is forming near this trendline, with a wick indicating buying pressure from the demand zone.
If ETH maintains this level and confirms a reversal, the next potential resistance targets are:
$2,400 (previous support turned resistance)
$3,000 (major psychological level and structural resistance)
Bullish Confirmation:
A daily close above $2,000 would strengthen the bullish outlook.
Breaking above the trendline retest area around $2,400 would indicate strong momentum.
Bearish Risk:
Losing support at $1,750 could invalidate this scenario and send ETH toward $1,500, aligning with the next major support.
Condition 2: Monthly Triangle Breakout & Long-Term Target
On the monthly timeframe, ETH/USDT has broken out of a symmetrical triangle pattern.
The breakdown has led to a retest of the $1,750-$1,800 demand zone.
If this zone holds, a strong rebound could push ETH toward the reversal area near $6,000 over the next market cycle.
Bullish Pathway:
A confirmed rebound and close above $2,500 could trigger a long-term recovery.
Breaking $3,500 would signal the start of a bullish rally toward $5,000-$6,000.
Bearish Risk:
A failure to hold the $1,750 level could trigger further declines toward $1,500-$1,200 before any potential recovery.
Conclusion
Both conditions suggest ETH/USDT is at a pivotal support level. The next few weeks will determine whether a strong recovery begins or further downside is expected. Traders should watch for confirmations near $2,000-$2,500 for a bullish continuation or prepare for further dips if support fails.
#ETH
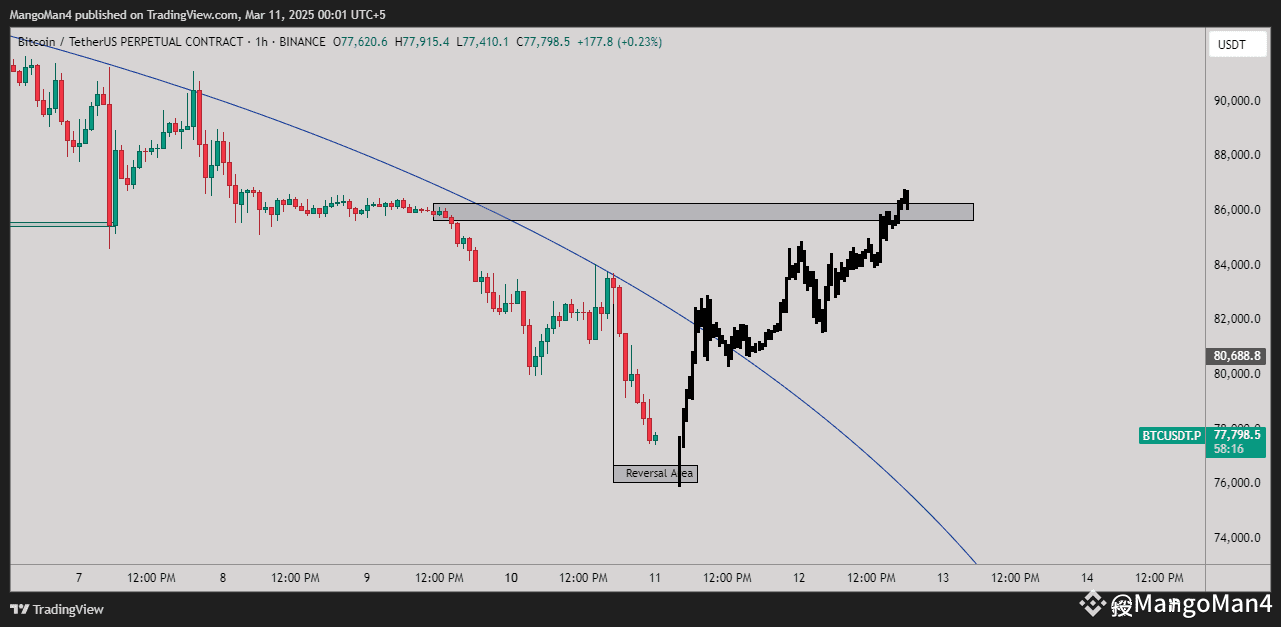
🚀 Bitcoin Recovery in Play – Key Resistance Ahead! 🔥
BTC has reacted strongly from the Reversal Area, indicating a potential shift in momentum. The projected path suggests a steady climb towards the $85K-$86K resistance zone before encountering a decision point.
📌 Key Takeaways:
✅ Reversal Confirmation: Buyers stepped in at the identified support zone, triggering bullish momentum.
✅ Trendline Break Incoming? The downward curve could be invalidated soon if bullish strength continues.
✅ Resistance at $86K: A crucial level where BTC might face temporary rejection before deciding its next move.
🔮 Potential Scenarios:
1️⃣ Break & Hold Above: BTC may see a continuation toward $90K+ if it breaks and establishes support above $86K.
2️⃣ Rejection & Pullback: A rejection could lead to another retest of lower supports before another push up.
🔥 Are you bullish or bearish? Drop your thoughts in the comments! Follow for real-time updates. 🚀
#BTC #Bitcoin #Crypto #Trading #CryptoNews
BTC has reacted strongly from the Reversal Area, indicating a potential shift in momentum. The projected path suggests a steady climb towards the $85K-$86K resistance zone before encountering a decision point.
📌 Key Takeaways:
✅ Reversal Confirmation: Buyers stepped in at the identified support zone, triggering bullish momentum.
✅ Trendline Break Incoming? The downward curve could be invalidated soon if bullish strength continues.
✅ Resistance at $86K: A crucial level where BTC might face temporary rejection before deciding its next move.
🔮 Potential Scenarios:
1️⃣ Break & Hold Above: BTC may see a continuation toward $90K+ if it breaks and establishes support above $86K.
2️⃣ Rejection & Pullback: A rejection could lead to another retest of lower supports before another push up.
🔥 Are you bullish or bearish? Drop your thoughts in the comments! Follow for real-time updates. 🚀
#BTC #Bitcoin #Crypto #Trading #CryptoNews
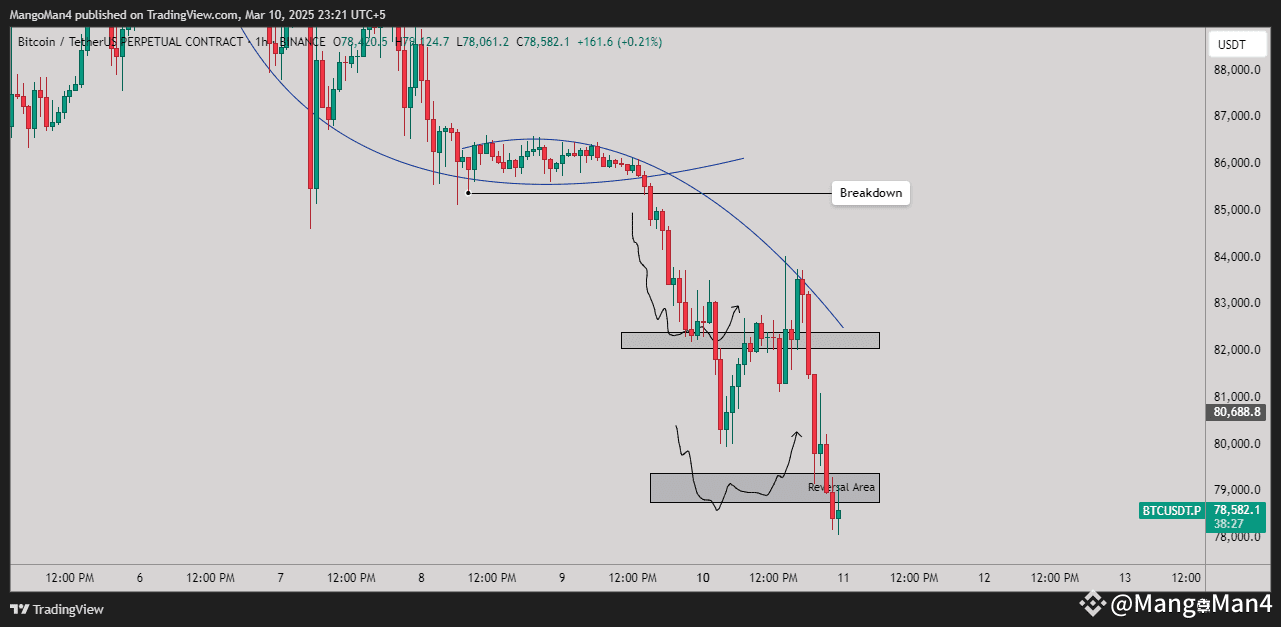
BTC 60 Minute - March 9 Analysis Played Out Exactly as Predicted! ✅
The market followed the expected breakdown perfectly, confirming the setup from my March 9 analysis. Yesterday, I secured partial profits, and today, the trade has fully closed successfully. 📉🎯
Precision and patience are key in trading! Stay tuned for more market insights and real-time updates. Follow my profile to stay ahead of the next big moves! 🚀🔥
#Bitcoin #BTC #Crypto #Trading #MarketAnalysis
The market followed the expected breakdown perfectly, confirming the setup from my March 9 analysis. Yesterday, I secured partial profits, and today, the trade has fully closed successfully. 📉🎯
Precision and patience are key in trading! Stay tuned for more market insights and real-time updates. Follow my profile to stay ahead of the next big moves! 🚀🔥
#Bitcoin #BTC #Crypto #Trading #MarketAnalysis
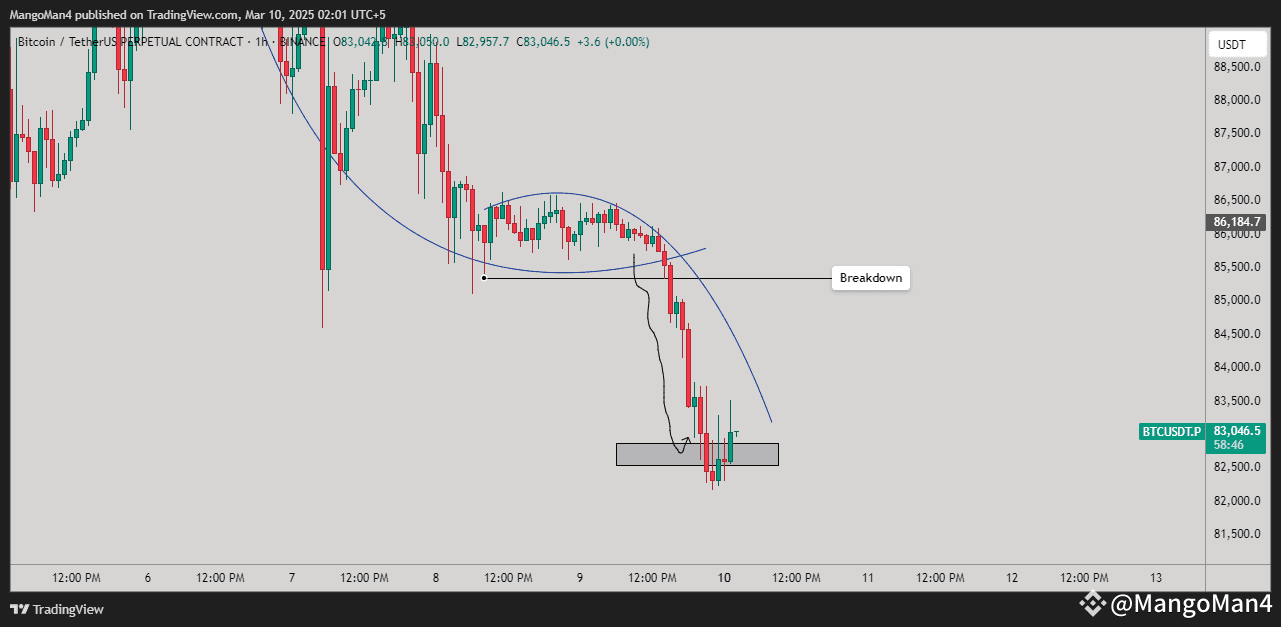
🔥 Nailed It! BTC Breakdown Played Out Exactly As Predicted! 🔥
📉 Bitcoin's breakdown move was caught perfectly! The expected price action unfolded exactly as analyzed, with BTC breaking down, hitting the target demand zone, and now reacting.
🔹 Breakdown Confirmed ✅
🔹 Reversal Area Hit 🎯
🔹 Now Watching for the Next Move 👀
📌 Key Levels:
✅ Short Target Reached: $82,000 – $81,000 📉
✅ Reversal Signs Showing – Possible bullish momentum ahead? 🚀
⚡ What’s Next? If BTC holds above this reversal zone, we could see an upside move. Otherwise, a deeper retest may follow before a full recovery.
💬 Did you catch this move too? Drop your thoughts below! 👇
#BTC #Bitcoin #Crypto #Trading #TechnicalAnalysis
📉 Bitcoin's breakdown move was caught perfectly! The expected price action unfolded exactly as analyzed, with BTC breaking down, hitting the target demand zone, and now reacting.
🔹 Breakdown Confirmed ✅
🔹 Reversal Area Hit 🎯
🔹 Now Watching for the Next Move 👀
📌 Key Levels:
✅ Short Target Reached: $82,000 – $81,000 📉
✅ Reversal Signs Showing – Possible bullish momentum ahead? 🚀
⚡ What’s Next? If BTC holds above this reversal zone, we could see an upside move. Otherwise, a deeper retest may follow before a full recovery.
💬 Did you catch this move too? Drop your thoughts below! 👇
#BTC #Bitcoin #Crypto #Trading #TechnicalAnalysis
#CryptoMarketWatch
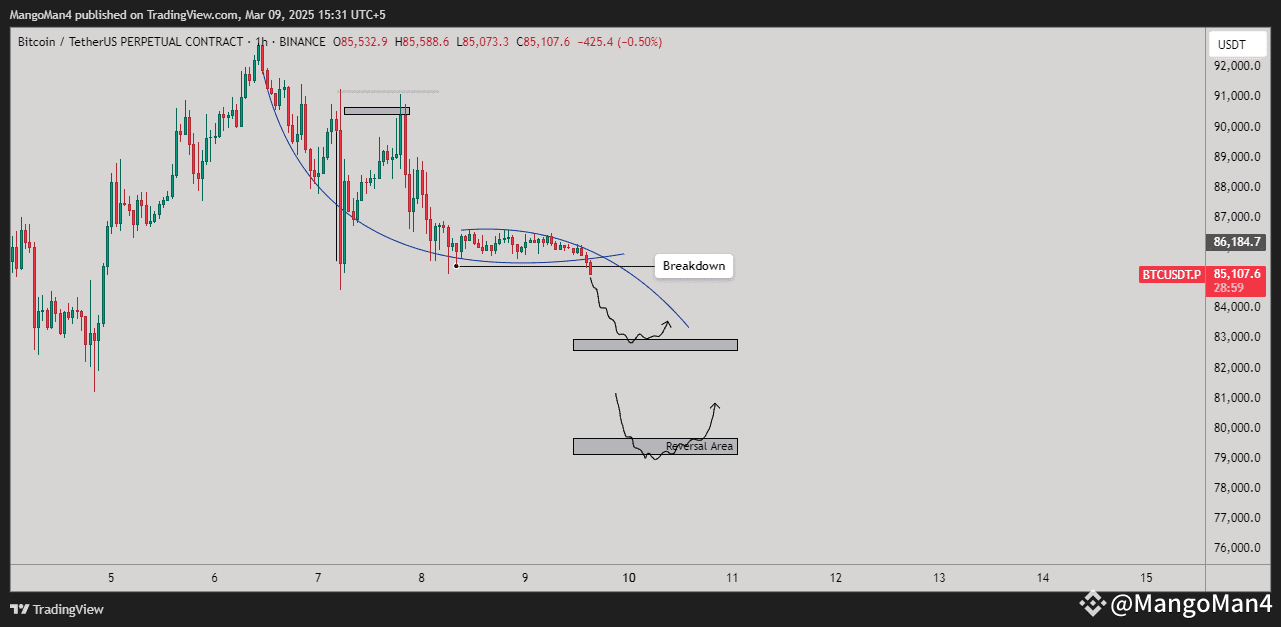
BTC 60 Minute Market Update - 09 March, 2025
🚨 Bitcoin Breakdown Alert! 🚨
Bitcoin has dropped below a key support level and is now heading towards lower demand zones. The price action suggests a potential bearish continuation, but there are important reversal areas to watch.
📉 Current Price: $85,107.6 (-0.50%)
📊 Trend: Bearish
📌 Next Support Levels:
✅ Short-term support: $82,000 – $81,000
✅ Major reversal area: $79,000 – $78,000
🔍 What’s Happening?
🔸 BTC formed a rounding top pattern, leading to a strong breakdown.
🔸 Price is now heading towards a demand zone, where buyers might step in.
🔸 If BTC fails to hold support, we could see a further drop towards $78,000.
🔸 A successful bounce could bring BTC back to retest previous resistance levels.
🔥 Trading Strategy:
🔻 Short-term Bearish Bias: Look for shorting opportunities on weak retests.
📉 Breakdown Confirmation: Bearish momentum remains strong—watch for further dips.
📈 Reversal Areas: Look for bullish price action around $78,000 – $79,000 before entering long trades.
📢 Will Bitcoin find support or continue its decline? Let’s discuss in the comments! ⬇️
#Bitcoin #Crypto #Trading #BTC #Binance
BTC 60 Minute Market Update - 09 March, 2025
🚨 Bitcoin Breakdown Alert! 🚨
Bitcoin has dropped below a key support level and is now heading towards lower demand zones. The price action suggests a potential bearish continuation, but there are important reversal areas to watch.
📉 Current Price: $85,107.6 (-0.50%)
📊 Trend: Bearish
📌 Next Support Levels:
✅ Short-term support: $82,000 – $81,000
✅ Major reversal area: $79,000 – $78,000
🔍 What’s Happening?
🔸 BTC formed a rounding top pattern, leading to a strong breakdown.
🔸 Price is now heading towards a demand zone, where buyers might step in.
🔸 If BTC fails to hold support, we could see a further drop towards $78,000.
🔸 A successful bounce could bring BTC back to retest previous resistance levels.
🔥 Trading Strategy:
🔻 Short-term Bearish Bias: Look for shorting opportunities on weak retests.
📉 Breakdown Confirmation: Bearish momentum remains strong—watch for further dips.
📈 Reversal Areas: Look for bullish price action around $78,000 – $79,000 before entering long trades.
📢 Will Bitcoin find support or continue its decline? Let’s discuss in the comments! ⬇️
#Bitcoin #Crypto #Trading #BTC #Binance
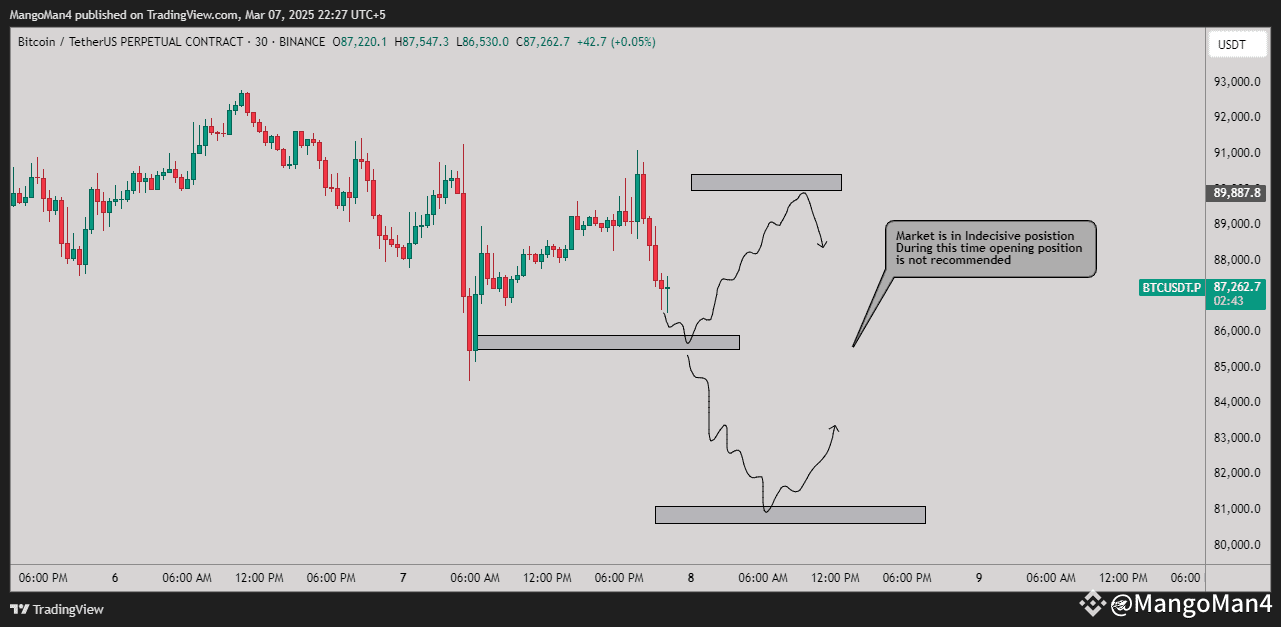
Bitcoin (BTC/USDT) 30 Mint Market Analysis – March 7, 2025
Overview
Bitcoin is currently in an indecisive phase, showing signs of both potential upward and downward movement. Traders should exercise caution as the price hovers around critical support and resistance zones.
Key Levels to Watch
📌 Support Levels:
$86,500 - $86,000 (Short-term support)
$82,500 - $81,500 (Major support zone)
📌 Resistance Levels:
$89,500 - $90,000 (Key resistance area)
Market Outlook
🔸 Bullish Scenario: If BTC maintains support around $86,500 and shows strong buying momentum, we could see a retest of $89,500 - $90,000. A breakout above this level may trigger further upside.
🔸 Bearish Scenario: A breakdown below $86,000 could push BTC towards the $82,500 - $81,500 support range. This would indicate increased selling pressure.
Trading Recommendation
⚠️ The market is currently indecisive, making it risky to open new positions. It's best to wait for a confirmed breakout or rejection before entering trades.
Conclusion
Stay patient and let the market provide clearer direction before taking action. Keep an eye on volume and price action at critical levels for confirmation.
#BTC
Overview
Bitcoin is currently in an indecisive phase, showing signs of both potential upward and downward movement. Traders should exercise caution as the price hovers around critical support and resistance zones.
Key Levels to Watch
📌 Support Levels:
$86,500 - $86,000 (Short-term support)
$82,500 - $81,500 (Major support zone)
📌 Resistance Levels:
$89,500 - $90,000 (Key resistance area)
Market Outlook
🔸 Bullish Scenario: If BTC maintains support around $86,500 and shows strong buying momentum, we could see a retest of $89,500 - $90,000. A breakout above this level may trigger further upside.
🔸 Bearish Scenario: A breakdown below $86,000 could push BTC towards the $82,500 - $81,500 support range. This would indicate increased selling pressure.
Trading Recommendation
⚠️ The market is currently indecisive, making it risky to open new positions. It's best to wait for a confirmed breakout or rejection before entering trades.
Conclusion
Stay patient and let the market provide clearer direction before taking action. Keep an eye on volume and price action at critical levels for confirmation.
#BTC
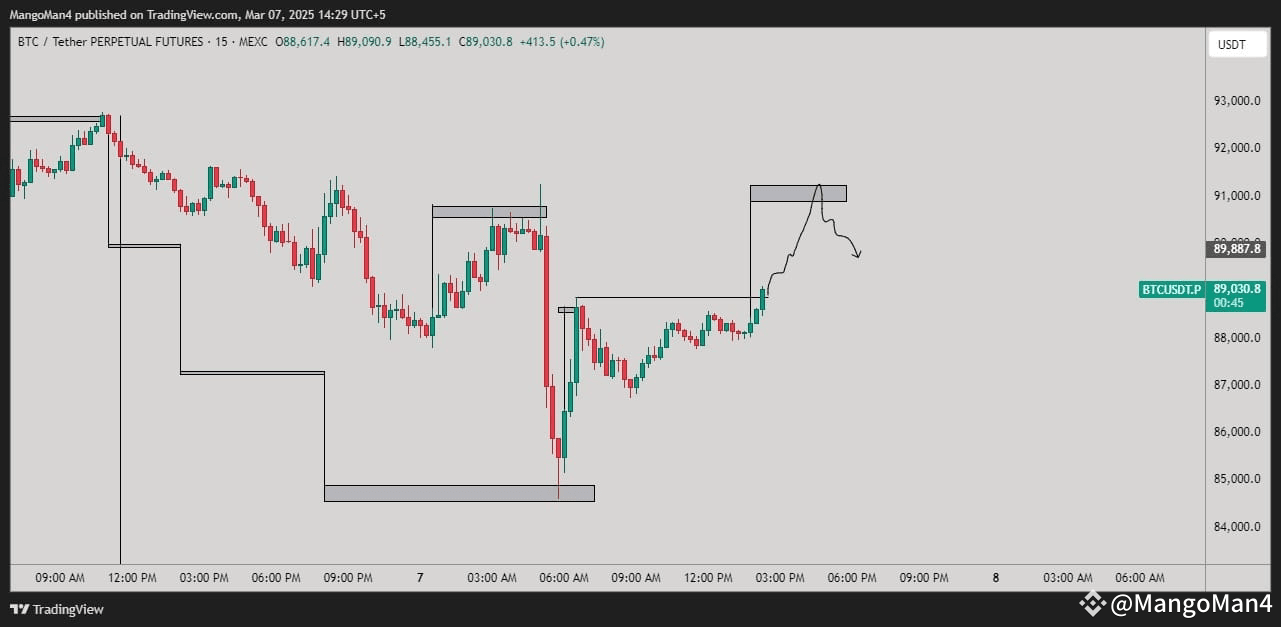
$BTC 📊 Bitcoin Price Action Update – Potential Rejection Ahead?
🔥 BTCUSDT.P Analysis | 15-Minute Chart 🔥
🔹 Bitcoin is currently trading at $89,030, recovering from a recent dip. The price structure suggests a liquidity sweep and a potential reaction at key resistance levels.
🔹 Key Observations:
✅ Previous Liquidity Grab: BTC filled a liquidity zone before reversing upwards.
✅ Resistance Zone: Price is approaching a high-value area, where previous rejections occurred.
✅ Possible Fakeout: If Bitcoin hits resistance near $90,000-$91,000, a short-term pullback may follow.
📉 Bearish Scenario:
🔻 A rejection at resistance could lead to a pullback toward $88,000 or lower.
📈 Bullish Scenario:
🚀 If BTC breaks and holds above $91,000, we may see another leg up.
💡 Trading Tip: Watch price action at resistance before entering trades. Set alerts and manage risk accordingly!
👀 What’s your BTC target for today? Comment below! 👇
🔥 BTCUSDT.P Analysis | 15-Minute Chart 🔥
🔹 Bitcoin is currently trading at $89,030, recovering from a recent dip. The price structure suggests a liquidity sweep and a potential reaction at key resistance levels.
🔹 Key Observations:
✅ Previous Liquidity Grab: BTC filled a liquidity zone before reversing upwards.
✅ Resistance Zone: Price is approaching a high-value area, where previous rejections occurred.
✅ Possible Fakeout: If Bitcoin hits resistance near $90,000-$91,000, a short-term pullback may follow.
📉 Bearish Scenario:
🔻 A rejection at resistance could lead to a pullback toward $88,000 or lower.
📈 Bullish Scenario:
🚀 If BTC breaks and holds above $91,000, we may see another leg up.
💡 Trading Tip: Watch price action at resistance before entering trades. Set alerts and manage risk accordingly!
👀 What’s your BTC target for today? Comment below! 👇
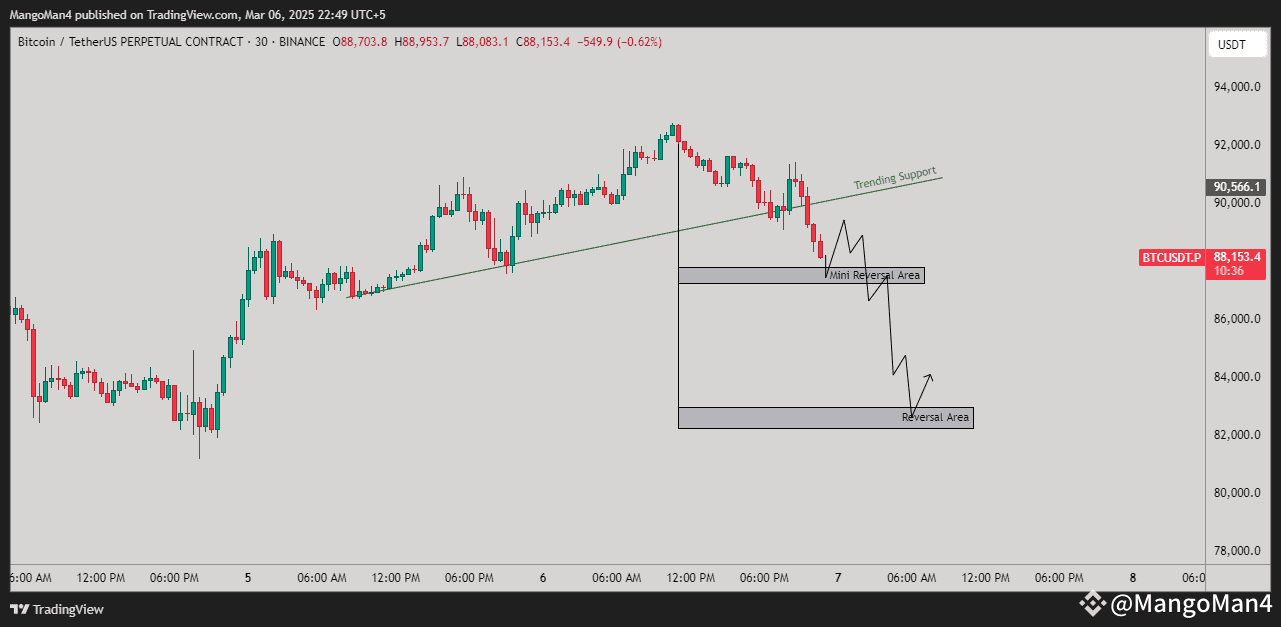
Bearish Breakdown – BTC Eyes Lower Support Zones
🔻 Key Breakdown:
Bitcoin has broken below its trendline support, confirming a bearish trend continuation. The market structure suggests that BTC could first test the Mini Reversal Area ($86,000 - $85,000) before potentially extending lower to the Major Reversal Area around $83,000 - $82,000.
📊 Key Levels to Watch:
🔹 Mini Reversal Area: $86,000 - $85,000 (Short-term bounce possible)
🔹 Major Reversal Area: $83,000 - $82,000 (Potential strong support zone)
🔥 Possible Scenarios:
1️⃣ Bearish Continuation – If BTC fails to hold at the Mini Reversal Area, a deeper correction to $83,000 - $82,000 is likely.
2️⃣ Short-Term Bounce – BTC could see a relief rally from the Mini Reversal Area, but strong resistance is expected near $90,500.
3️⃣ Breakout Reversal – If BTC reclaims the trendline support above $90,500, bullish momentum may return.
📢 Strategy:
Traders should watch for price action in the $86,000 - $85,000 zone for potential short-term bounces.A breakdown below $85,000 could signal a stronger move toward $82,000.Caution is advised for leveraged positions due to potential volatility.
👉 Do you think BTC will recover from the Mini Reversal Area or drop lower? Comment below!
#BTC
🔻 Key Breakdown:
Bitcoin has broken below its trendline support, confirming a bearish trend continuation. The market structure suggests that BTC could first test the Mini Reversal Area ($86,000 - $85,000) before potentially extending lower to the Major Reversal Area around $83,000 - $82,000.
📊 Key Levels to Watch:
🔹 Mini Reversal Area: $86,000 - $85,000 (Short-term bounce possible)
🔹 Major Reversal Area: $83,000 - $82,000 (Potential strong support zone)
🔥 Possible Scenarios:
1️⃣ Bearish Continuation – If BTC fails to hold at the Mini Reversal Area, a deeper correction to $83,000 - $82,000 is likely.
2️⃣ Short-Term Bounce – BTC could see a relief rally from the Mini Reversal Area, but strong resistance is expected near $90,500.
3️⃣ Breakout Reversal – If BTC reclaims the trendline support above $90,500, bullish momentum may return.
📢 Strategy:
Traders should watch for price action in the $86,000 - $85,000 zone for potential short-term bounces.A breakdown below $85,000 could signal a stronger move toward $82,000.Caution is advised for leveraged positions due to potential volatility.
👉 Do you think BTC will recover from the Mini Reversal Area or drop lower? Comment below!
#BTC
$XRP
XRP/USDT Price Analysis 4-Hour
Market Structure & Breakout Confirmation
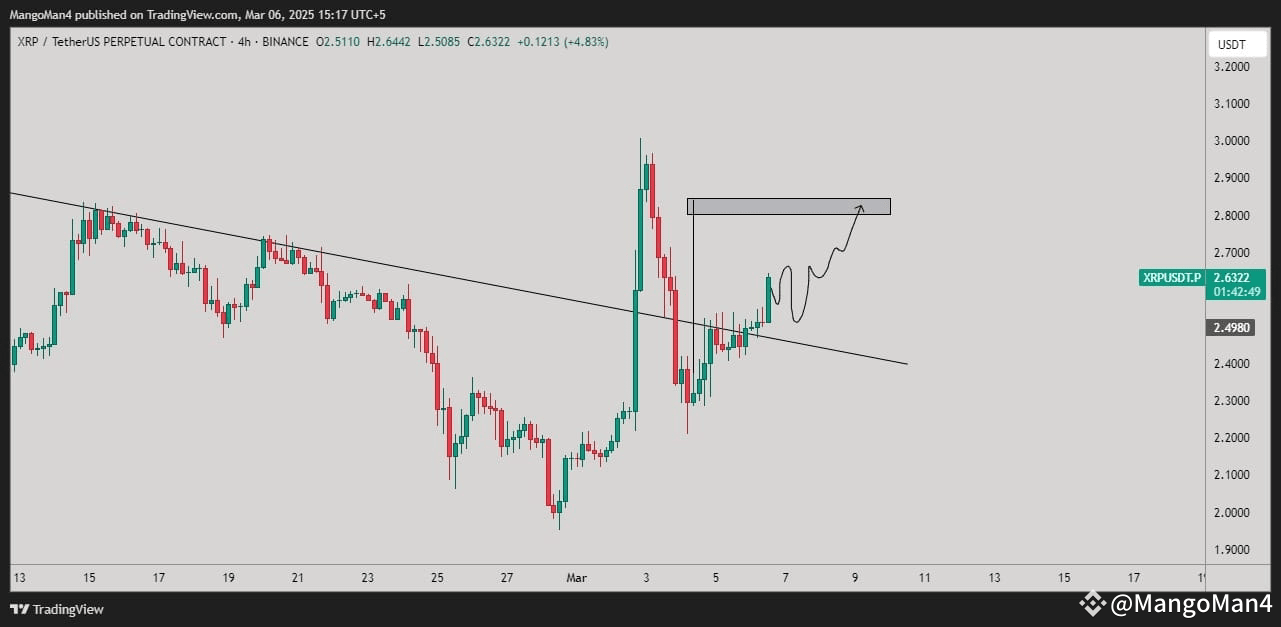
XRP/USDT has successfully broken out of a descending trendline on the 4-hour chart, signaling a shift from bearish to bullish momentum. The breakout is accompanied by increased buying pressure, pushing the price to the $2.63 level at the time of analysis.
Key Levels to Watch
Support: The previous trendline resistance around $2.50 could now be a support level. Immediate Resistance: The $2.80 - $2.85 range (highlighted on the chart) is the next key resistance zone. Psychological Resistance: $3.00, which could attract profit-taking if reached.
Short-Term Outlook
The projected price action suggests a potential consolidation phase with minor pullbacks before XRP makes another leg up toward the $2.80-$2.85 resistance. If this resistance is broken with strong volume, XRP could quickly target $3.00+ in the coming sessions.
Trading Strategy
Bullish Scenario: A successful retest of the previous breakout zone ($2.50 - $2.55) with a strong bounce could offer a buying opportunity. Confirmation of bullish momentum above $2.70 may lead to a retest of the $2.80-$2.85 resistance. Bearish Scenario: A failure to hold above $2.50 could result in a retest of lower supports near $2.40 or lower.
Conclusion
XRP is showing signs of strength after breaking a key trendline resistance, with a well-defined path toward $2.80-$2.85. Traders should watch for confirmations on retests and volume expansion before making entries. Stay cautious of potential rejection at resistance levels.
📊 Do you agree with this analysis? Drop your thoughts below! 🚀
#xrp
XRP/USDT Price Analysis 4-Hour
Market Structure & Breakout Confirmation
XRP/USDT has successfully broken out of a descending trendline on the 4-hour chart, signaling a shift from bearish to bullish momentum. The breakout is accompanied by increased buying pressure, pushing the price to the $2.63 level at the time of analysis.
Key Levels to Watch
Support: The previous trendline resistance around $2.50 could now be a support level. Immediate Resistance: The $2.80 - $2.85 range (highlighted on the chart) is the next key resistance zone. Psychological Resistance: $3.00, which could attract profit-taking if reached.
Short-Term Outlook
The projected price action suggests a potential consolidation phase with minor pullbacks before XRP makes another leg up toward the $2.80-$2.85 resistance. If this resistance is broken with strong volume, XRP could quickly target $3.00+ in the coming sessions.
Trading Strategy
Bullish Scenario: A successful retest of the previous breakout zone ($2.50 - $2.55) with a strong bounce could offer a buying opportunity. Confirmation of bullish momentum above $2.70 may lead to a retest of the $2.80-$2.85 resistance. Bearish Scenario: A failure to hold above $2.50 could result in a retest of lower supports near $2.40 or lower.
Conclusion
XRP is showing signs of strength after breaking a key trendline resistance, with a well-defined path toward $2.80-$2.85. Traders should watch for confirmations on retests and volume expansion before making entries. Stay cautious of potential rejection at resistance levels.
📊 Do you agree with this analysis? Drop your thoughts below! 🚀
#xrp
#USCryptoReserve
The United States is actively engaging with cryptocurrency, both through existing holdings and proposed initiatives. Here's an overview of the current state and future plans:
Current U.S. Government Bitcoin Holdings
As of December 13, 2024, the U.S. government possesses approximately 207,189 bitcoins, valued at around $17.3 billion. These assets primarily originate from law enforcement seizures, including:
94,643 BTC from the Bitfinex hack.
69,370 BTC from the Silk Road marketplace seizure.
12,267 BTC from additional Bitfinex hack seizures.
9,800 BTC seized from James Zhong related to Silk Road.
2,818 BTC from further Bitfinex-related seizures.
These holdings underscore the government's significant involvement in the cryptocurrency space.
Proposed Strategic Bitcoin Reserve
On July 31, 2024, Senator Cynthia Lummis introduced the Boosting Innovation, Technology, and Competitiveness through Optimized Investment Nationwide (BITCOIN) Act. This legislation proposes the establishment of a strategic Bitcoin reserve, aiming to:
Acquire 1 million bitcoins over a set period, representing approximately 5% of the total Bitcoin supply.
Store these assets in a decentralized network of secure vaults managed by the U.S. Department of the Treasury.
Utilize the reserve to bolster the nation's balance sheet and address national debt.
Senator Lummis emphasized that this initiative could position the U.S. as a global leader in financial innovation.
Market Reactions and Industry Perspectives
The announcement of the strategic crypto reserve has elicited varied reactions:
Cryptocurrency markets experienced significant surges following the news. For instance, XRP's value rose from $2.23 to $2.99, Solana (SOL) increased from $140 to $168, and Cardano (ADA) neared $1. Bitcoin's price also saw a 9% uptick, reaching $93,000.
Industry leaders have expressed mixed feelings. While some view the inclusion of various altcoins in the reserve as a positive diversification strategy, others caution against potential market distortions and emphasize the need for consideratio
The United States is actively engaging with cryptocurrency, both through existing holdings and proposed initiatives. Here's an overview of the current state and future plans:
Current U.S. Government Bitcoin Holdings
As of December 13, 2024, the U.S. government possesses approximately 207,189 bitcoins, valued at around $17.3 billion. These assets primarily originate from law enforcement seizures, including:
94,643 BTC from the Bitfinex hack.
69,370 BTC from the Silk Road marketplace seizure.
12,267 BTC from additional Bitfinex hack seizures.
9,800 BTC seized from James Zhong related to Silk Road.
2,818 BTC from further Bitfinex-related seizures.
These holdings underscore the government's significant involvement in the cryptocurrency space.
Proposed Strategic Bitcoin Reserve
On July 31, 2024, Senator Cynthia Lummis introduced the Boosting Innovation, Technology, and Competitiveness through Optimized Investment Nationwide (BITCOIN) Act. This legislation proposes the establishment of a strategic Bitcoin reserve, aiming to:
Acquire 1 million bitcoins over a set period, representing approximately 5% of the total Bitcoin supply.
Store these assets in a decentralized network of secure vaults managed by the U.S. Department of the Treasury.
Utilize the reserve to bolster the nation's balance sheet and address national debt.
Senator Lummis emphasized that this initiative could position the U.S. as a global leader in financial innovation.
Market Reactions and Industry Perspectives
The announcement of the strategic crypto reserve has elicited varied reactions:
Cryptocurrency markets experienced significant surges following the news. For instance, XRP's value rose from $2.23 to $2.99, Solana (SOL) increased from $140 to $168, and Cardano (ADA) neared $1. Bitcoin's price also saw a 9% uptick, reaching $93,000.
Industry leaders have expressed mixed feelings. While some view the inclusion of various altcoins in the reserve as a positive diversification strategy, others caution against potential market distortions and emphasize the need for consideratio
XRP/USDT 15 Mint Price Outlook
🚨 XRP Breakdown Incoming? Bearish Pattern Emerging! 🚨
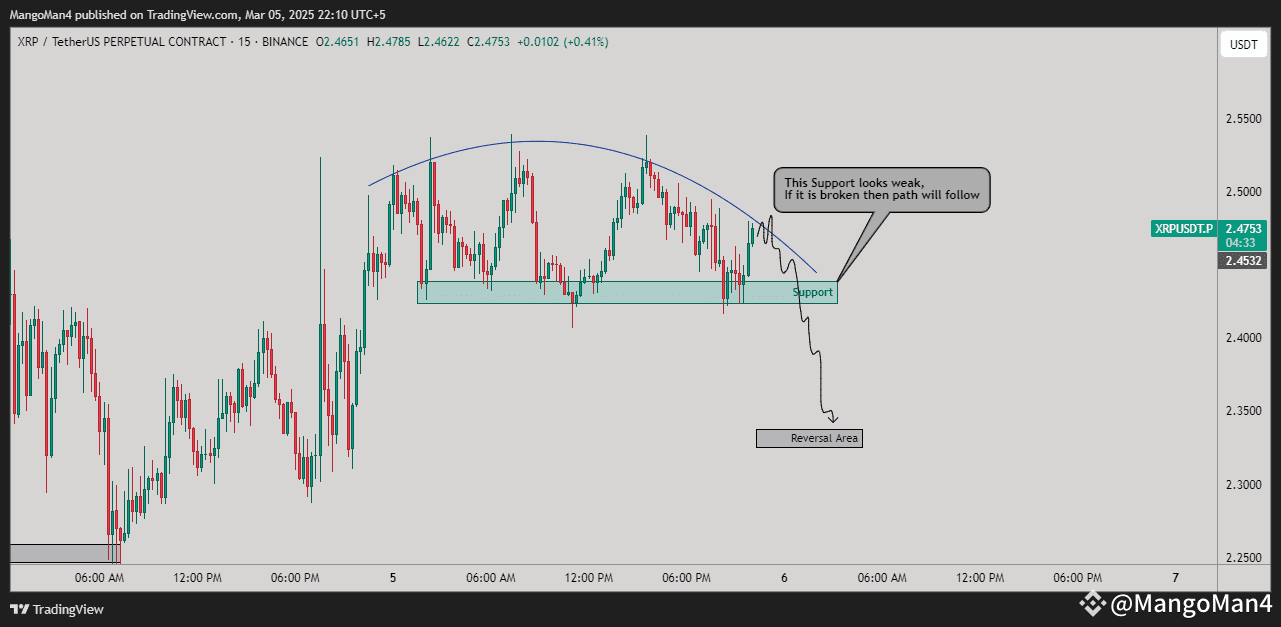
XRP/USDT is showing signs of weakness as the price forms a rounded top, a pattern that often signals a trend reversal.
📌 Key Levels to Watch:
🔹 Support at $2.45 – If broken, we could see further downside.
🔹 Reversal area at $2.35 – Possible next stop if the breakdown plays out.
💡 What’s Next?
A confirmed break below $2.45 could send XRP lower.Bulls need to reclaim $2.50+ to regain control.
⚡ Traders, are you shorting this breakdown? Or do you see a bounce coming? Let us know in the comments! ⬇️
#Xrp🔥🔥
🚨 XRP Breakdown Incoming? Bearish Pattern Emerging! 🚨
XRP/USDT is showing signs of weakness as the price forms a rounded top, a pattern that often signals a trend reversal.
📌 Key Levels to Watch:
🔹 Support at $2.45 – If broken, we could see further downside.
🔹 Reversal area at $2.35 – Possible next stop if the breakdown plays out.
💡 What’s Next?
A confirmed break below $2.45 could send XRP lower.Bulls need to reclaim $2.50+ to regain control.
⚡ Traders, are you shorting this breakdown? Or do you see a bounce coming? Let us know in the comments! ⬇️
#Xrp🔥🔥
🚨 Bitcoin (BTC) Faces Reversal Risk After Fakeout! 🚨
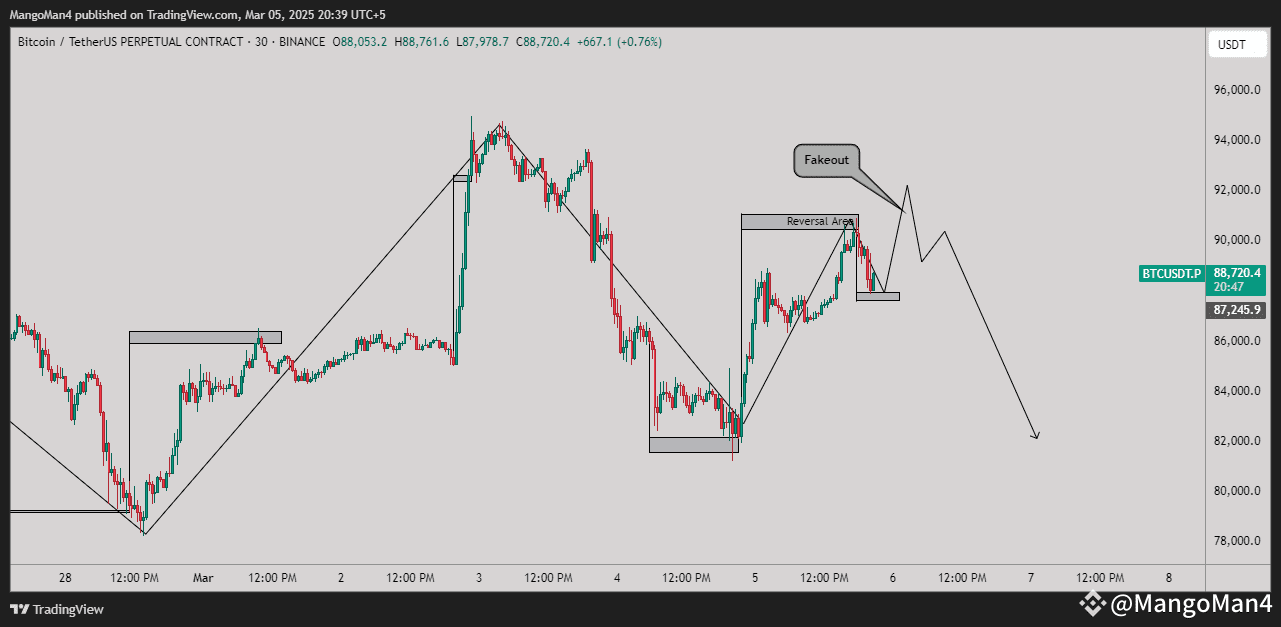
BTC/USDT is currently trading at $88,720, showing signs of exhaustion after a breakout attempt. The price action suggests a fakeout, which could lead to a pullback.
📌 Key Levels to Watch:
🔹 Resistance: $90,000 - $92,000
🔹 Support: $87,000 (short-term), $82,000 - $80,000 (potential downside target)
📉 If BTC fails to hold above $87,000, we could see further downside toward $80,000. However, a reclaim of $90,000 could trigger another leg up!
🔥 What’s your take? Are you bullish or bearish? Drop your thoughts below! 🚀
#BTC
BTC/USDT is currently trading at $88,720, showing signs of exhaustion after a breakout attempt. The price action suggests a fakeout, which could lead to a pullback.
📌 Key Levels to Watch:
🔹 Resistance: $90,000 - $92,000
🔹 Support: $87,000 (short-term), $82,000 - $80,000 (potential downside target)
📉 If BTC fails to hold above $87,000, we could see further downside toward $80,000. However, a reclaim of $90,000 could trigger another leg up!
🔥 What’s your take? Are you bullish or bearish? Drop your thoughts below! 🚀
#BTC
$ADA
ADA/USDT Technical Analysis – Bullish Breakout in Play?
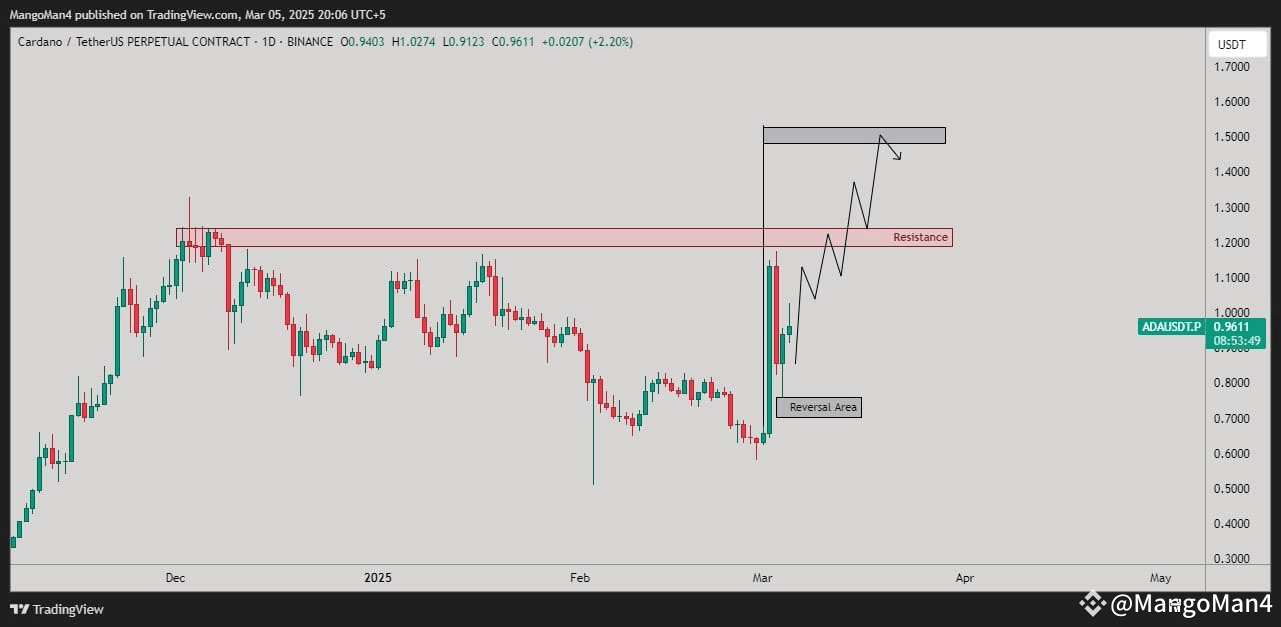
Cardano (ADA) has shown a strong bullish impulse, breaking out from a recent reversal area and targeting key resistance zones. Currently trading at $0.9611 (+2.20%), ADA is displaying bullish momentum as it approaches a major resistance level.
Key Levels to Watch:
Reversal Area: The price rebounded sharply from the $0.75-$0.80 region, indicating strong demand and a potential shift in trend.
Resistance Zone ($1.20-$1.30): A crucial level where ADA previously faced rejection. A breakout above this zone could confirm further upside potential.
Target Area ($1.50-$1.60): If ADA successfully breaks through resistance, we could see a push toward this upper range before potential profit-taking or correction.
Potential Scenarios:
✔ Bullish Scenario: If ADA maintains its momentum and breaks above the resistance, the next target is $1.50+, supported by strong buyer interest.
❌ Bearish Scenario: A rejection at the resistance zone could lead to a pullback, with support likely at the $0.85-$0.90 range.
Conclusion:
ADA/USDT remains in a bullish trend, with price action indicating further upside potential. Traders should watch for confirmation of a breakout above $1.30 to validate the next move toward $1.50+.
What are your thoughts? Are you bullish or bearish on ADA? Let us know in the comments! 🚀🔥
ADA/USDT Technical Analysis – Bullish Breakout in Play?
Cardano (ADA) has shown a strong bullish impulse, breaking out from a recent reversal area and targeting key resistance zones. Currently trading at $0.9611 (+2.20%), ADA is displaying bullish momentum as it approaches a major resistance level.
Key Levels to Watch:
Reversal Area: The price rebounded sharply from the $0.75-$0.80 region, indicating strong demand and a potential shift in trend.
Resistance Zone ($1.20-$1.30): A crucial level where ADA previously faced rejection. A breakout above this zone could confirm further upside potential.
Target Area ($1.50-$1.60): If ADA successfully breaks through resistance, we could see a push toward this upper range before potential profit-taking or correction.
Potential Scenarios:
✔ Bullish Scenario: If ADA maintains its momentum and breaks above the resistance, the next target is $1.50+, supported by strong buyer interest.
❌ Bearish Scenario: A rejection at the resistance zone could lead to a pullback, with support likely at the $0.85-$0.90 range.
Conclusion:
ADA/USDT remains in a bullish trend, with price action indicating further upside potential. Traders should watch for confirmation of a breakout above $1.30 to validate the next move toward $1.50+.
What are your thoughts? Are you bullish or bearish on ADA? Let us know in the comments! 🚀🔥
Log in to explore more content