
Lumen Crypto
6 Posts

Lumen Crypto
Report
Block User
Зажигаю свечи не ради хайпа, а ради света на рынке.
0 Following
2 Followers
1 Liked
Posts
·
--
$INIT
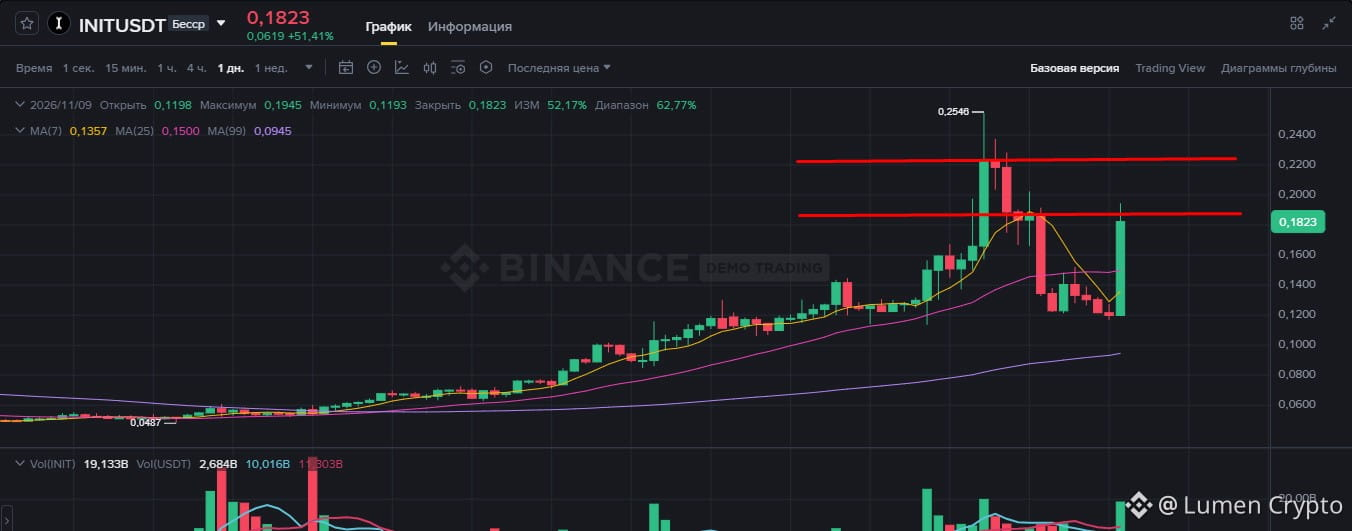
Marked 2 levels where you can look for short positions. The fuel for growth is running out; a crash is coming.
Place your stop-losses beyond the level!
#demotraiding #INIT #LumenCrypto
$INIT
Marked 2 levels where you can look for short positions. The fuel for growth is running out; a crash is coming.
Place your stop-losses beyond the level!
#demotraiding #INIT #LumenCrypto
Marked 2 levels where you can look for short positions. The fuel for growth is running out; a crash is coming.
Place your stop-losses beyond the level!
#demotraiding #INIT #LumenCrypto
168
·
--
$INIT
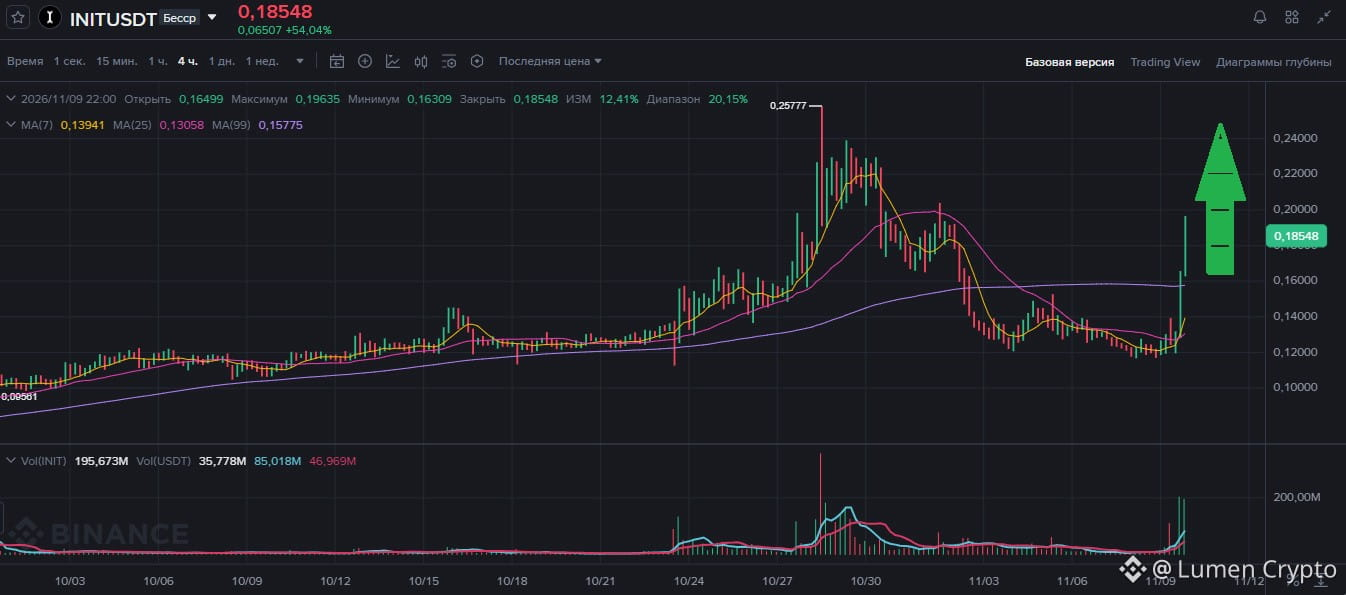
I don’t recommend shorting at current levels!
It could shoot much higher, potentially even setting new highs.
Not financial advice. These are scenarios based on levels, not a forecast.
#INIT #Altcoins #Crypto #Binance #LumenCrypto
{future}(INITUSDT)
$INIT
I don’t recommend shorting at current levels!
It could shoot much higher, potentially even setting new highs.
Not financial advice. These are scenarios based on levels, not a forecast.
#INIT #Altcoins #Crypto #Binance #LumenCrypto
I don’t recommend shorting at current levels!
It could shoot much higher, potentially even setting new highs.
Not financial advice. These are scenarios based on levels, not a forecast.
#INIT #Altcoins #Crypto #Binance #LumenCrypto
645
·
--
🔥 $PIEVERSE Under the microscope: rocket or cliff?
{future}(PIEVERSEUSDT)
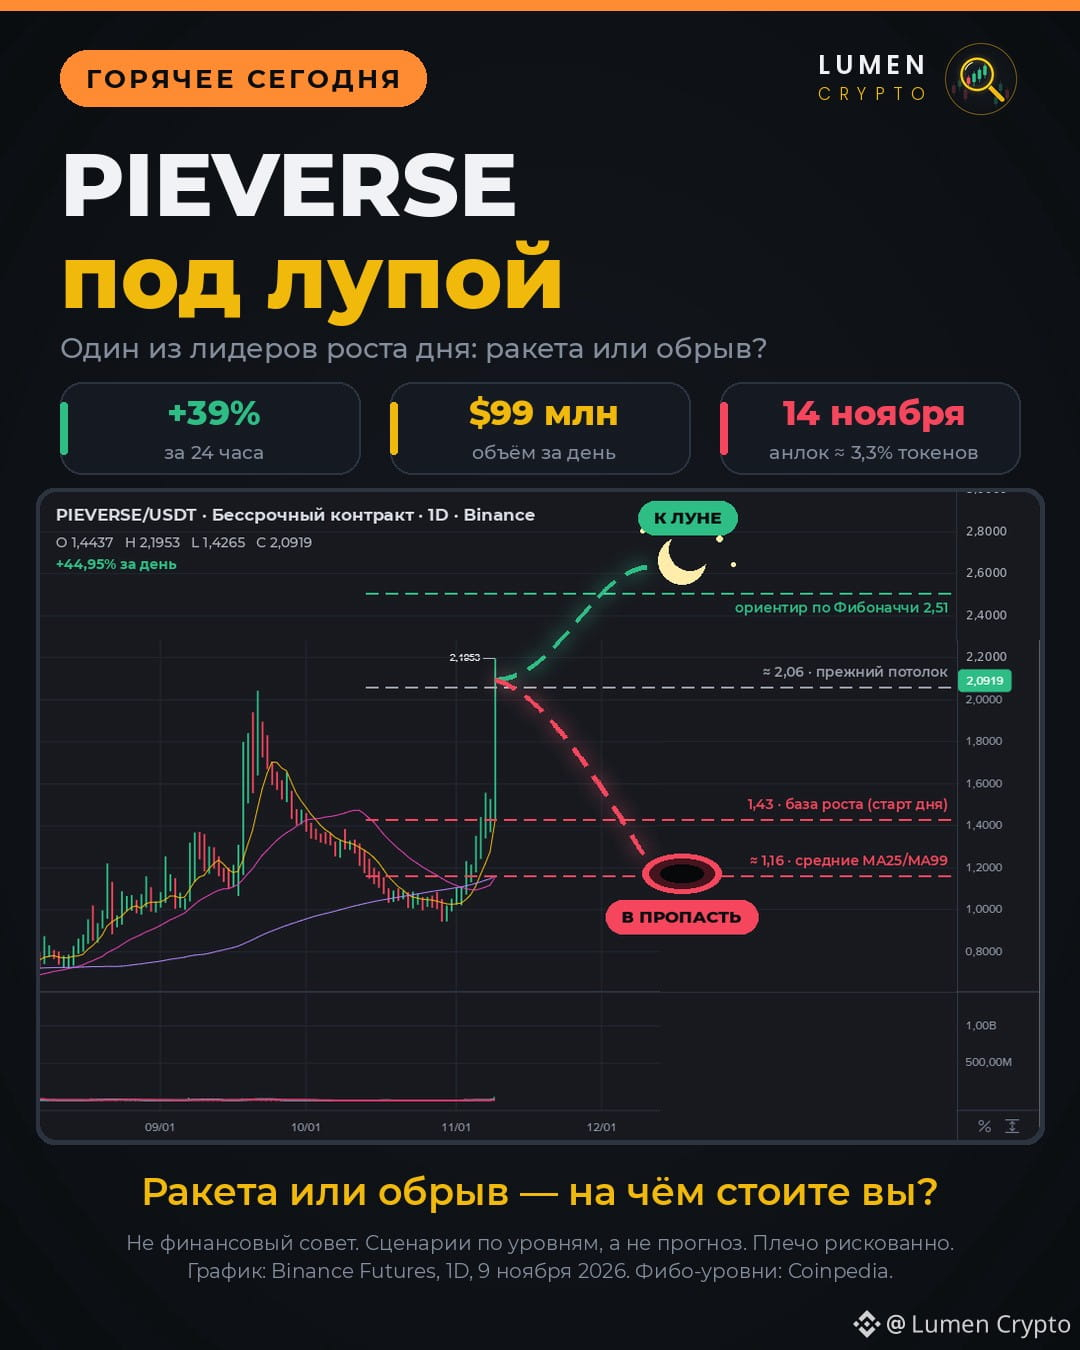
The coin rose by about 39% in 24 hours, and the daily chart’s candle is almost vertical.
Let’s take a closer look:
🌙 To the moon: if the price holds above ≈ $2.20, the next Fibonacci level to watch is around $2.51.
🕳 Into the abyss: if it loses ≈ $2.06 (the previous ceiling), a return to the growth base around $1.43 is likely, followed by the MA25/MA99 averages around $1.16.
⚠️ What adds to the risk:
On November 14, ≈ 3.3% of the tokens (≈ 33 million) will be unlocked. After such a rally, overheating is possible; RSI is high according to market analyses. The chart shows a perpetual contract, and leverage magnifies both gains and losses.
The magnifying glass shows both the peak and the drop, but it doesn’t tell you which side you’re standing on. So where are you standing: on the rocket’s launchpad or at the edge of the abyss? 👇
Not financial advice. These are scenarios based on price levels, not a forecast.
#PIEVERSE #Altcoins #Crypto #Binance #LumenCrypto
🔥 $PIEVERSE Under the microscope: rocket or cliff?
The coin rose by about 39% in 24 hours, and the daily chart’s candle is almost vertical.
Let’s take a closer look:
🌙 To the moon: if the price holds above ≈ $2.20, the next Fibonacci level to watch is around $2.51.
🕳 Into the abyss: if it loses ≈ $2.06 (the previous ceiling), a return to the growth base around $1.43 is likely, followed by the MA25/MA99 averages around $1.16.
⚠️ What adds to the risk:
On November 14, ≈ 3.3% of the tokens (≈ 33 million) will be unlocked. After such a rally, overheating is possible; RSI is high according to market analyses. The chart shows a perpetual contract, and leverage magnifies both gains and losses.
The magnifying glass shows both the peak and the drop, but it doesn’t tell you which side you’re standing on. So where are you standing: on the rocket’s launchpad or at the edge of the abyss? 👇
Not financial advice. These are scenarios based on price levels, not a forecast.
#PIEVERSE #Altcoins #Crypto #Binance #LumenCrypto
The coin rose by about 39% in 24 hours, and the daily chart’s candle is almost vertical.
Let’s take a closer look:
🌙 To the moon: if the price holds above ≈ $2.20, the next Fibonacci level to watch is around $2.51.
🕳 Into the abyss: if it loses ≈ $2.06 (the previous ceiling), a return to the growth base around $1.43 is likely, followed by the MA25/MA99 averages around $1.16.
⚠️ What adds to the risk:
On November 14, ≈ 3.3% of the tokens (≈ 33 million) will be unlocked. After such a rally, overheating is possible; RSI is high according to market analyses. The chart shows a perpetual contract, and leverage magnifies both gains and losses.
The magnifying glass shows both the peak and the drop, but it doesn’t tell you which side you’re standing on. So where are you standing: on the rocket’s launchpad or at the edge of the abyss? 👇
Not financial advice. These are scenarios based on price levels, not a forecast.
#PIEVERSE #Altcoins #Crypto #Binance #LumenCrypto
2
1
904
·
--
The week under the microscope: $BTC is testing support, around $74,000 🔍
Figures as of the morning of November 9:
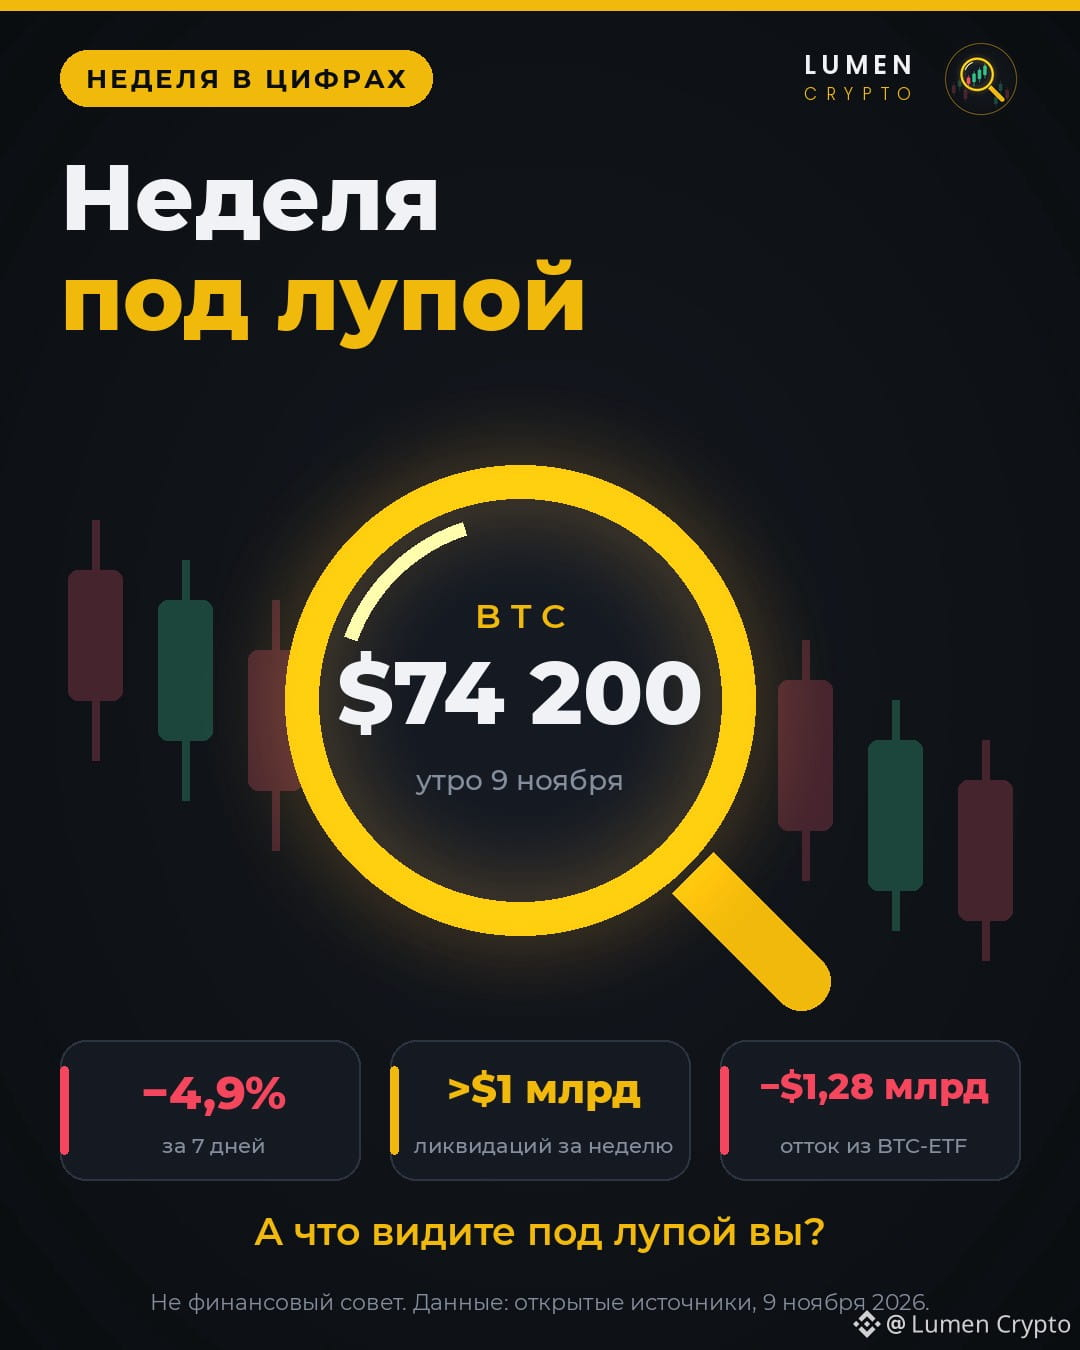
≈ $74,200 — Bitcoin price −4.9% — over 7 days more than $1 billion in liquidations this week, mostly longs −$1.28 billion — outflows from US spot BTC ETFs this week. Fear and Greed Index: 29.
What’s being cited as the cause: a sell-off in tech stocks (AI and chips), ETF outflows, uncertainty over crypto regulation after the US elections, and forced leveraged selling.
What’s next: tomorrow, November 10, US inflation data (CPI) is expected. The market will be on edge.
Under the microscope, the main thing is clear: it’s not just the price that’s falling. So are the positions of those who used leverage. More on that in the next post.
I’ve got the focus just right. Now I want to know your “prescription”: is your drawdown in focus right now, or has it become a blurry spot? 👀
Not financial advice.
#Bitcoin #BTC #Crypto #LumenCrypto
The week under the microscope: $BTC is testing support, around $74,000 🔍
Figures as of the morning of November 9:
≈ $74,200 — Bitcoin price −4.9% — over 7 days more than $1 billion in liquidations this week, mostly longs −$1 .28 billion — outflows from US spot BTC ETFs this week. Fear and Greed Index: 29.
What’s being cited as the cause: a sell-off in tech stocks (AI and chips), ETF outflows, uncertainty over crypto regulation after the US elections, and forced leveraged selling.
What’s next: tomorrow, November 10, US inflation data (CPI) is expected. The market will be on edge.
Under the microscope, the main thing is clear: it’s not just the price that’s falling. So are the positions of those who used leverage. More on that in the next post.
I’ve got the focus just right. Now I want to know your “prescription”: is your drawdown in focus right now, or has it become a blurry spot? 👀
Not financial advice.
#Bitcoin #BTC #Crypto #LumenCrypto
Figures as of the morning of November 9:
≈ $74,200 — Bitcoin price −4.9% — over 7 days more than $1 billion in liquidations this week, mostly longs −$1 .28 billion — outflows from US spot BTC ETFs this week. Fear and Greed Index: 29.
What’s being cited as the cause: a sell-off in tech stocks (AI and chips), ETF outflows, uncertainty over crypto regulation after the US elections, and forced leveraged selling.
What’s next: tomorrow, November 10, US inflation data (CPI) is expected. The market will be on edge.
Under the microscope, the main thing is clear: it’s not just the price that’s falling. So are the positions of those who used leverage. More on that in the next post.
I’ve got the focus just right. Now I want to know your “prescription”: is your drawdown in focus right now, or has it become a blurry spot? 👀
Not financial advice.
#Bitcoin #BTC #Crypto #LumenCrypto
277
Log in to explore more content
Join global crypto users on Binance Square
⚡️ Get latest and useful information about crypto.
💬 Trusted by the world’s largest crypto exchange.
👍 Discover real insights from verified creators.
Email / Phone number
Trending Topics
CPITestsDecemberRateOutlook
687,782 views
3,035 Discussing
October CPI Seen Up 0.3%, Keeping Fed on Course for December Rate Increase
Binance News
·0 Likes
·250 views
NvidiaInvestigatesAfterHuang’sAffairApology
242,241 views
1,954 Discussing
AnthropicRejectsIPODelayValuationinQuestion
56,394 views
543 Discussing