
加密招财猫_YTB
486 Posts

加密招财猫_YTB
野生加密研究员,如果对我的内容感兴趣。每天10分钟,深度有趣的加密新闻和知识。欢迎观看我的YouTube频道,搜索加密招财猫,头像和我这个一样
5 Following
2.1K+ Followers
3.4K+ Liked
1 Badges
Posts
All
Quotes
Videos
PINNED
$CAKE I have also been studying the tokenomics of cake recently and found some interesting things. Let me share my basic understanding of what I discovered, and if there are any experts, please feel free to correct me.
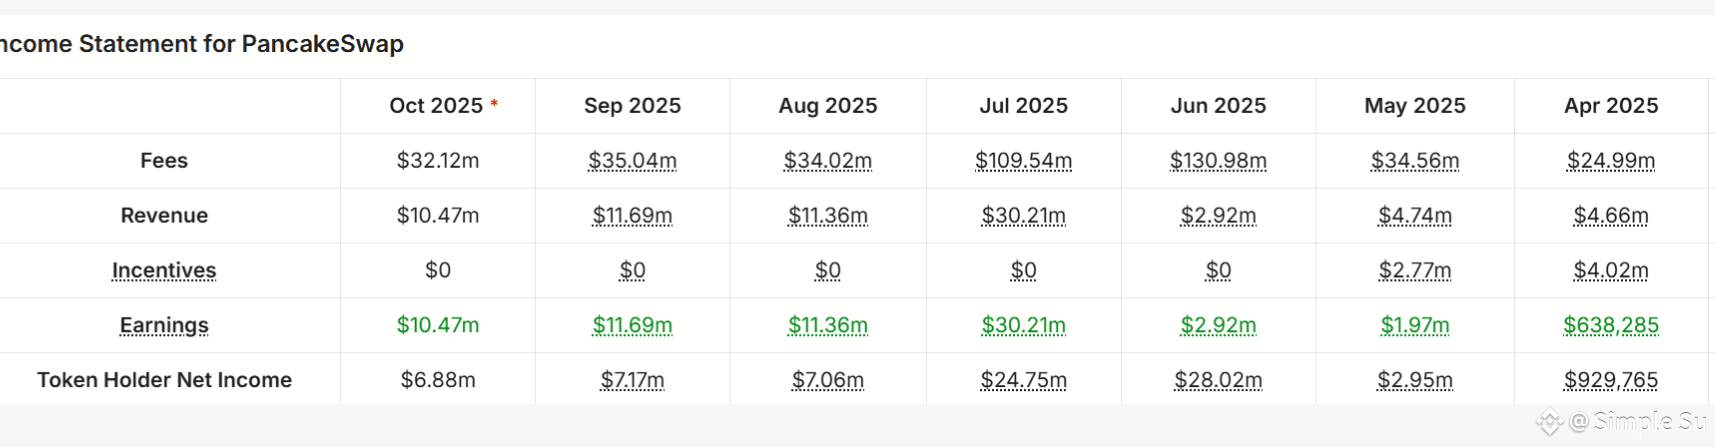
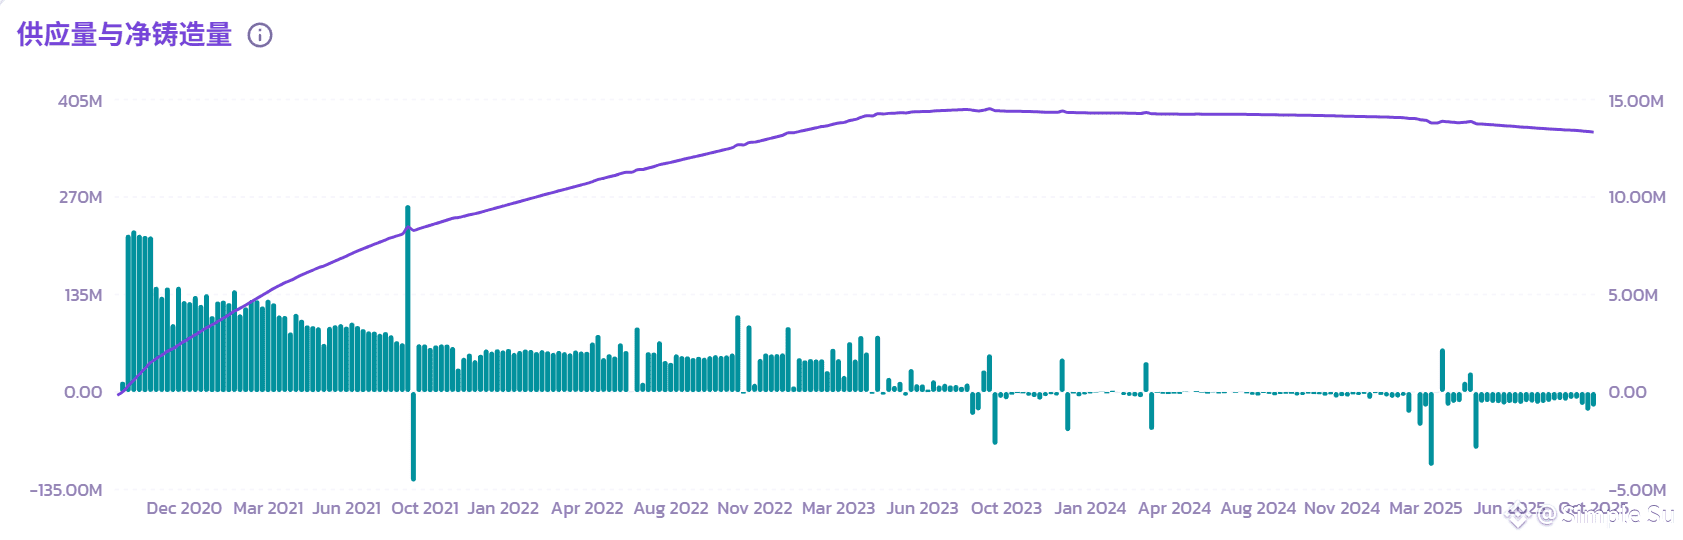
The core of cake's tokenomics is to take a portion of the total fees as protocol revenue to buy back and burn cake. According to the official documentation, for every 25 units of total fees, 8 units are taken as protocol revenue, which means the theoretical maximum proportion is 8/25=0.32. This protocol fee rate should have been introduced with PancakeSwap V3, which went live in April this year. Referring to the data from defillama in Figure 1, before v3, the proportion of protocol revenue used for burning was not high. For example, in February it was 0.056, in March it was 0.11, and it started to rise and stabilize around July, with proportions in July, August, September, and October being 0.275, 0.323, 0.324, and 0.325 respectively. Referring to Figure 2, the official burn chart shows that the number of burns has significantly increased and stabilized in recent weeks. I suspect that the protocol launched in April, but the chaotic proportions in May and June might be due to adjustments in the protocol pool leading to inaccurate statistics. At least in recent months, cake has a quite excellent economic model in the web3 world. The recent annual deflation rate should be around 7% or even higher, while the official target is 4%. I looked at several other tokens, and personally, I believe that pancake's model is better because, first, it is indeed making money, and second, it is truly a buyback and burn model. SushiSwap and Aave's models are buybacks for stakers. If we refer to stocks, pancake is a buyback, while suchiswap is dividends, which is clearly better.
Of course, this is my personal opinion and does not constitute investment advice. I hope experts can provide corrections.
The core of cake's tokenomics is to take a portion of the total fees as protocol revenue to buy back and burn cake. According to the official documentation, for every 25 units of total fees, 8 units are taken as protocol revenue, which means the theoretical maximum proportion is 8/25=0.32. This protocol fee rate should have been introduced with PancakeSwap V3, which went live in April this year. Referring to the data from defillama in Figure 1, before v3, the proportion of protocol revenue used for burning was not high. For example, in February it was 0.056, in March it was 0.11, and it started to rise and stabilize around July, with proportions in July, August, September, and October being 0.275, 0.323, 0.324, and 0.325 respectively. Referring to Figure 2, the official burn chart shows that the number of burns has significantly increased and stabilized in recent weeks. I suspect that the protocol launched in April, but the chaotic proportions in May and June might be due to adjustments in the protocol pool leading to inaccurate statistics. At least in recent months, cake has a quite excellent economic model in the web3 world. The recent annual deflation rate should be around 7% or even higher, while the official target is 4%. I looked at several other tokens, and personally, I believe that pancake's model is better because, first, it is indeed making money, and second, it is truly a buyback and burn model. SushiSwap and Aave's models are buybacks for stakers. If we refer to stocks, pancake is a buyback, while suchiswap is dividends, which is clearly better.
Of course, this is my personal opinion and does not constitute investment advice. I hope experts can provide corrections.
Bitcoin second-half analysis: In July, the win rate for Bitcoin reaches 71%! The brutal drop is over—time to enter the market! Has Bitcoin’s third wave of decline ended? A survey of Catfan followers’ positions! $BTC
Can the next bull market rise 24x? STRIVE's bull market return forecast—BTC 'treasury' newcomer STRIVE with more explosive potential than MicroStrategy. Don't focus on altcoins! The cat Asst buy-in plan is revealed! ASST vs MSTR continues to compare! $MSTRB $BTC
Bitcoin's nosedive hits 63k! Is MicroStrategy the culprit? The third wave of the downturn is here! I closed my position, and next I'm planning to.... $BTC
Downward spiral! When Bitcoin's June curse meets MicroStrategy dumping coins! Record outflows from Bitcoin ETF! MicroStrategy has neither the will nor the capacity to scoop up Bitcoin anymore! Binance is gearing up to launch US stock RWA products $BTC
Layer 2 is all trash, I absolutely will not bottom fish ARB and OP during the bear market! Let data and facts speak, here are three irrefutable reasons why L2 is garbage. arb has 5 times inflation in 3 years, op has 10 times inflation in 4 years! $OP $ARB
Bitcoin bear market is halfway through!
Preparation for bottom fishing in the bear market (updated)
Bitcoin micro strategy $BTC
Preparation for bottom fishing in the bear market (updated)
Bitcoin micro strategy $BTC
The Secret of the Bottom of the Special Currency: Capture the Big Bottom 3 Times with 2 Lines of the Pi Cycle Bottom! $BTC

【What will happen to Bitcoin next?】
The规律 of Bitcoin bull and bear markets
During a bull market
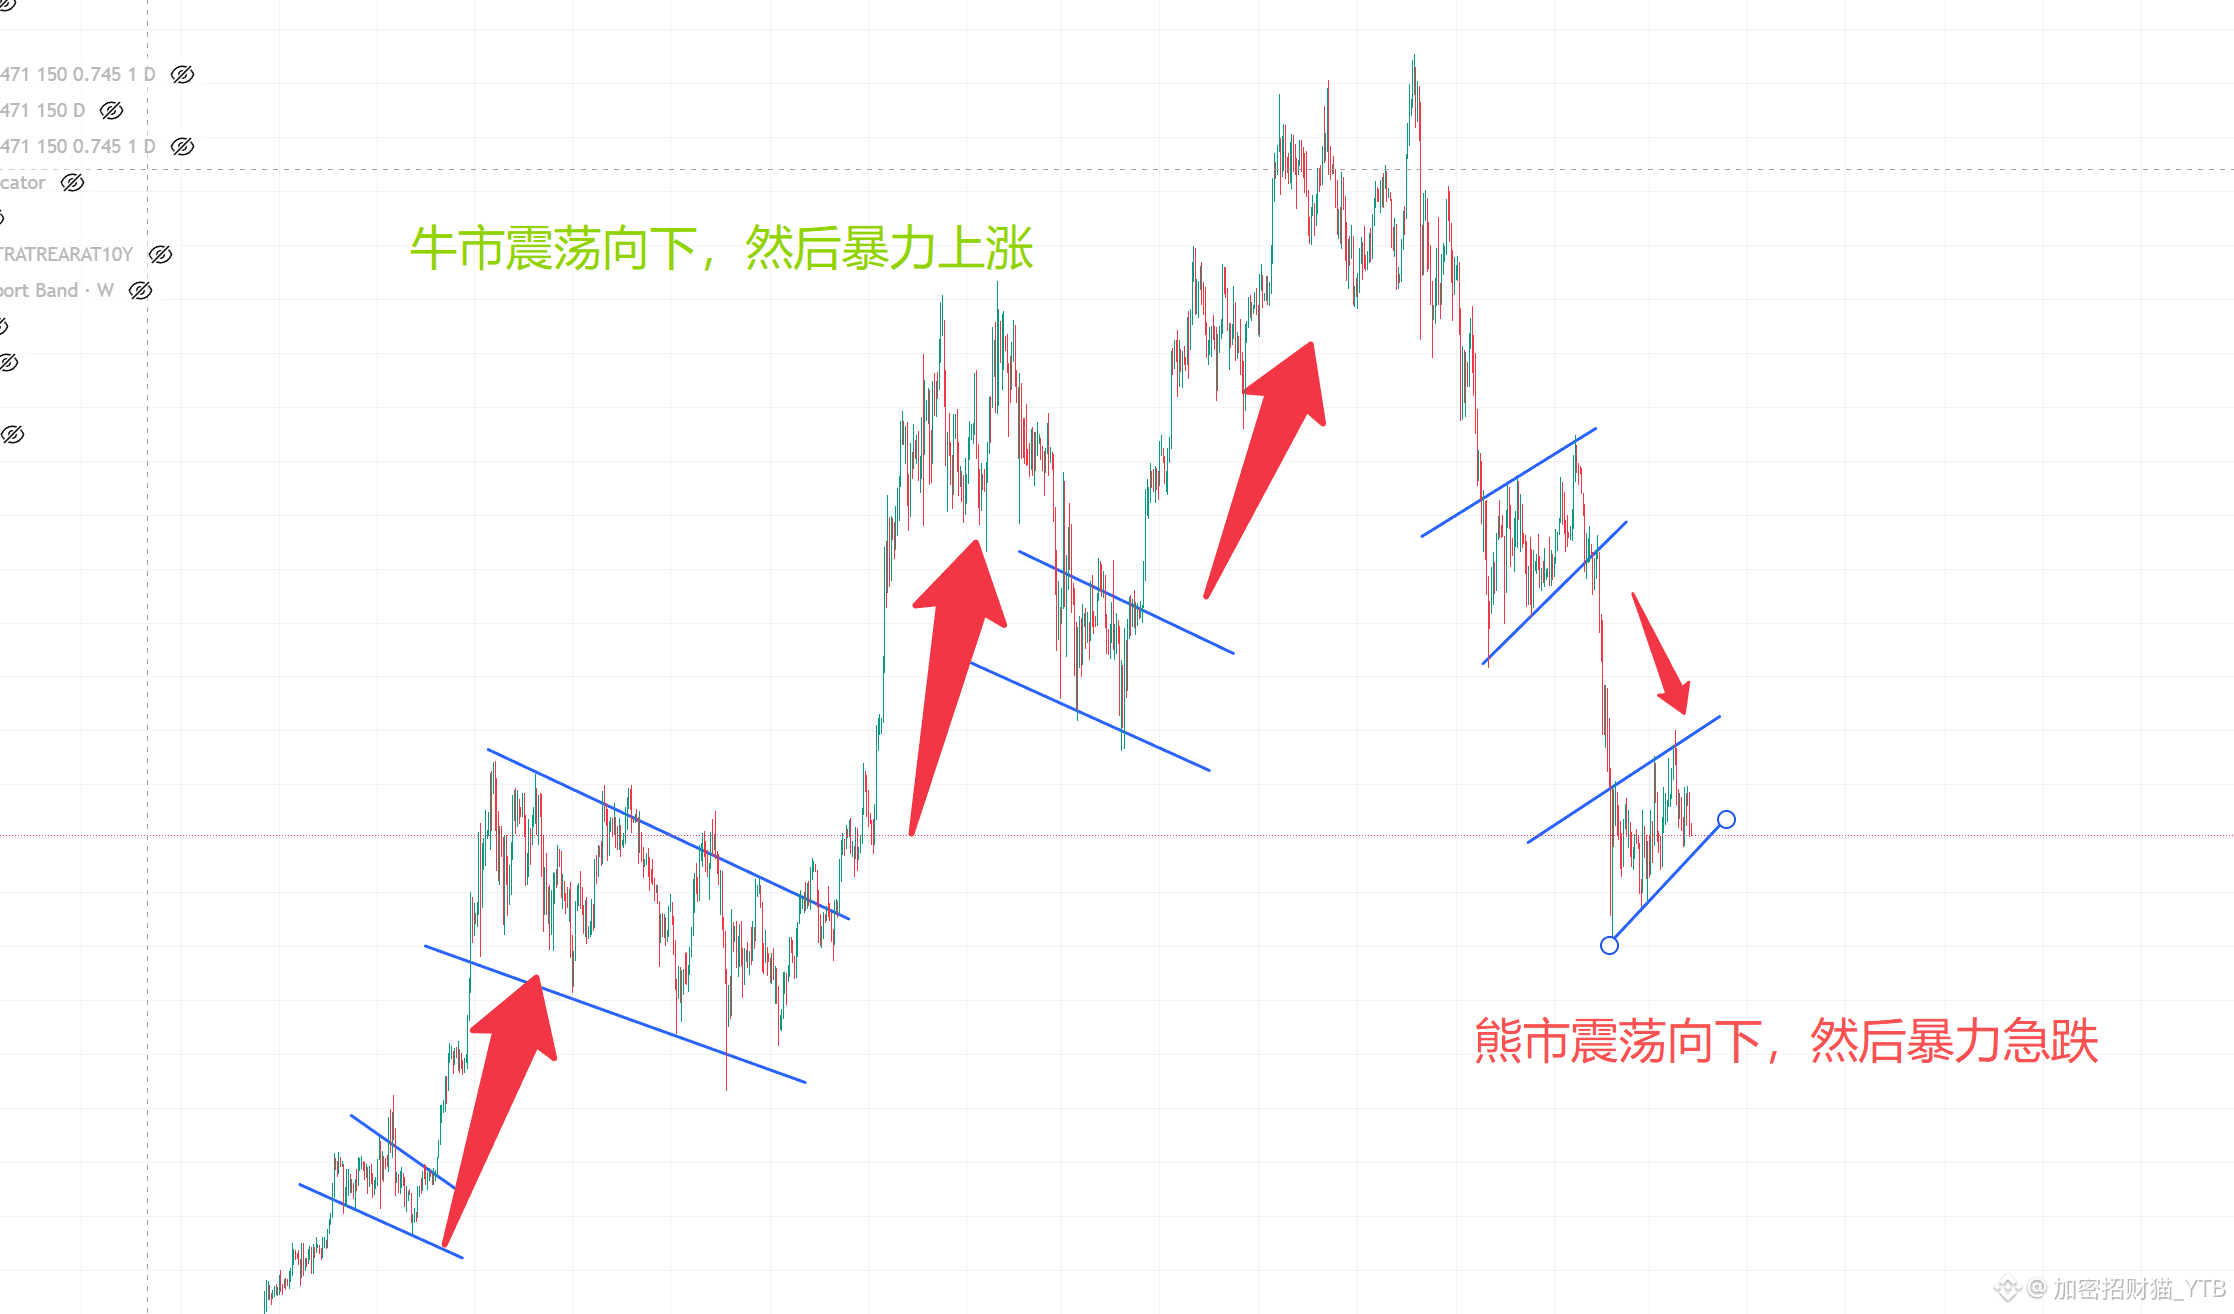
Bitcoin often moves sideways with slow downward fluctuations, then violently rises and breaks through a platform, then experiences another sideways slow downward fluctuation, followed by another sudden violent rise to a new platform.
The approach in a bear market is exactly the opposite
Plummeting rapidly, then finding a short-term bottom, then moving sideways with slow upward fluctuations, followed by another sharp drop, finding another short-term bottom, and continuing with sideways slow upward fluctuations.
$BTC
What will happen next? If we look at the charts, there is a high probability of a sharp drop.
The规律 of Bitcoin bull and bear markets
During a bull market
Bitcoin often moves sideways with slow downward fluctuations, then violently rises and breaks through a platform, then experiences another sideways slow downward fluctuation, followed by another sudden violent rise to a new platform.
The approach in a bear market is exactly the opposite
Plummeting rapidly, then finding a short-term bottom, then moving sideways with slow upward fluctuations, followed by another sharp drop, finding another short-term bottom, and continuing with sideways slow upward fluctuations.
$BTC
What will happen next? If we look at the charts, there is a high probability of a sharp drop.
Do you really understand MicroStrategy? Comprehensive Q&A about MSTR, how to invest in MicroStrategy safely? 2$MSTR $MSTRon
Do you really understand MicroStrategy? MSTR comprehensive Q&A, how to invest in MicroStrategy safely? 1$MSTR $MSTRon
Bitcoin surged to $74,000! Is it a bull comeback or a trap?
Starting from noon on March 4th, Bitcoin began a continuous rise, increasing from $67,000 to a peak of $74,000, with a maximum increase of about 10% in less than 24 hours.
At the same time, the 200-hour moving average of Bitcoin has been declining since early February and is currently at $69,300.
What does A-Mao think about Bitcoin's future?
First, the conclusion: A-Mao believes that the 200-hour moving average is still valid. A-Mao mentioned in the video on the 27th that when the 200-hour moving average meets Bitcoin's price again, Bitcoin's price may oscillate and struggle near the 200-hour moving average for a while, but eventually, it will open the final drop of phase two. I will analyze this in today's video.
During Bitcoin's bear market, the 200-hour moving average has always been a resistance level, but it does not mean it cannot be broken. Once Bitcoin breaks the 200-hour moving average, it will be pulled down by the moving average. The farther it gets from the breakthrough of the 200-hour moving average, the easier it is to cause a sharp decline.
History does not repeat exactly, but it does rhyme. At this time in 2022, Bitcoin's price also broke through the 200-hour moving average and oscillated around the moving average for a while, but eventually started the third wave of decline.
I believe we are currently in the process of oscillating around the 200-hour moving average.
Another reason the bear market is not over is that a dangerous signal has appeared on the board - Bitcoin's market share has increased. In the video on February 28th, A-Mao's video discussed where Ethereum would bottom in March. A-Mao analyzed a market bottom signal, which is Bitcoin's market share. Those interested can revisit that video; the conclusion is that during the 2022 cycle, most coins, including Ethereum, will touch the bottom earlier compared to Bitcoin. After the last wave of decline in 2022, during Bitcoin's oscillation in the bottom area, Bitcoin's market share was declining.
Currently, Bitcoin's market share has been rising from 58.5% to 59.8%. This is similar to the situation before the last major drop in 2022 (see video analysis for details).
In summary, although this breakout rally seems very strong, A-Mao still advises everyone to remain calm. Whether it is the historical pattern of the 200-hour moving average or the abnormal one-sided strengthening of Bitcoin's market share, the bear market is not finished.
Starting from noon on March 4th, Bitcoin began a continuous rise, increasing from $67,000 to a peak of $74,000, with a maximum increase of about 10% in less than 24 hours.
At the same time, the 200-hour moving average of Bitcoin has been declining since early February and is currently at $69,300.
What does A-Mao think about Bitcoin's future?
First, the conclusion: A-Mao believes that the 200-hour moving average is still valid. A-Mao mentioned in the video on the 27th that when the 200-hour moving average meets Bitcoin's price again, Bitcoin's price may oscillate and struggle near the 200-hour moving average for a while, but eventually, it will open the final drop of phase two. I will analyze this in today's video.
During Bitcoin's bear market, the 200-hour moving average has always been a resistance level, but it does not mean it cannot be broken. Once Bitcoin breaks the 200-hour moving average, it will be pulled down by the moving average. The farther it gets from the breakthrough of the 200-hour moving average, the easier it is to cause a sharp decline.
History does not repeat exactly, but it does rhyme. At this time in 2022, Bitcoin's price also broke through the 200-hour moving average and oscillated around the moving average for a while, but eventually started the third wave of decline.
I believe we are currently in the process of oscillating around the 200-hour moving average.
Another reason the bear market is not over is that a dangerous signal has appeared on the board - Bitcoin's market share has increased. In the video on February 28th, A-Mao's video discussed where Ethereum would bottom in March. A-Mao analyzed a market bottom signal, which is Bitcoin's market share. Those interested can revisit that video; the conclusion is that during the 2022 cycle, most coins, including Ethereum, will touch the bottom earlier compared to Bitcoin. After the last wave of decline in 2022, during Bitcoin's oscillation in the bottom area, Bitcoin's market share was declining.
Currently, Bitcoin's market share has been rising from 58.5% to 59.8%. This is similar to the situation before the last major drop in 2022 (see video analysis for details).
In summary, although this breakout rally seems very strong, A-Mao still advises everyone to remain calm. Whether it is the historical pattern of the 200-hour moving average or the abnormal one-sided strengthening of Bitcoin's market share, the bear market is not finished.
Do you really understand MicroStrategy?
BTC VS MSTR
Buy at a discount in a bear market, sell at a premium in a bull market, the villa by the sea 2$BTC $MSTR
BTC VS MSTR
Buy at a discount in a bear market, sell at a premium in a bull market, the villa by the sea 2$BTC $MSTR
Do you really understand MicroStrategy? BTC VS MSTR
Buy at a discount during a bear market, sell at a premium during a bull market, the villa is by the sea 1$MSTR $BTC
Buy at a discount during a bear market, sell at a premium during a bull market, the villa is by the sea 1$MSTR $BTC
Where is the bottom of Bitcoin? 44,000 or 55,000? This is my ultimate bottom-fishing plan! 100% accurate MVRV-Z entering the green zone? 2$BTC
Log in to explore more content