
Love Crypto BNB
1.2k Posts

Love Crypto BNB
Love_Ctypto loves investing and is passionate about technology. Loves BTC and BNB the most
83 Following
359 Followers
864 Liked
Posts
All
Quotes
Videos
ON THE H4 CHART, BTC IS ON AN UPWARD TREND
- If the price line continues to maintain or slightly increase, it will indicate an upward trend on the daily chart, at which point the price of BTC will rise significantly.
- If the price line continues to maintain or slightly increase, it will indicate an upward trend on the daily chart, at which point the price of BTC will rise significantly.
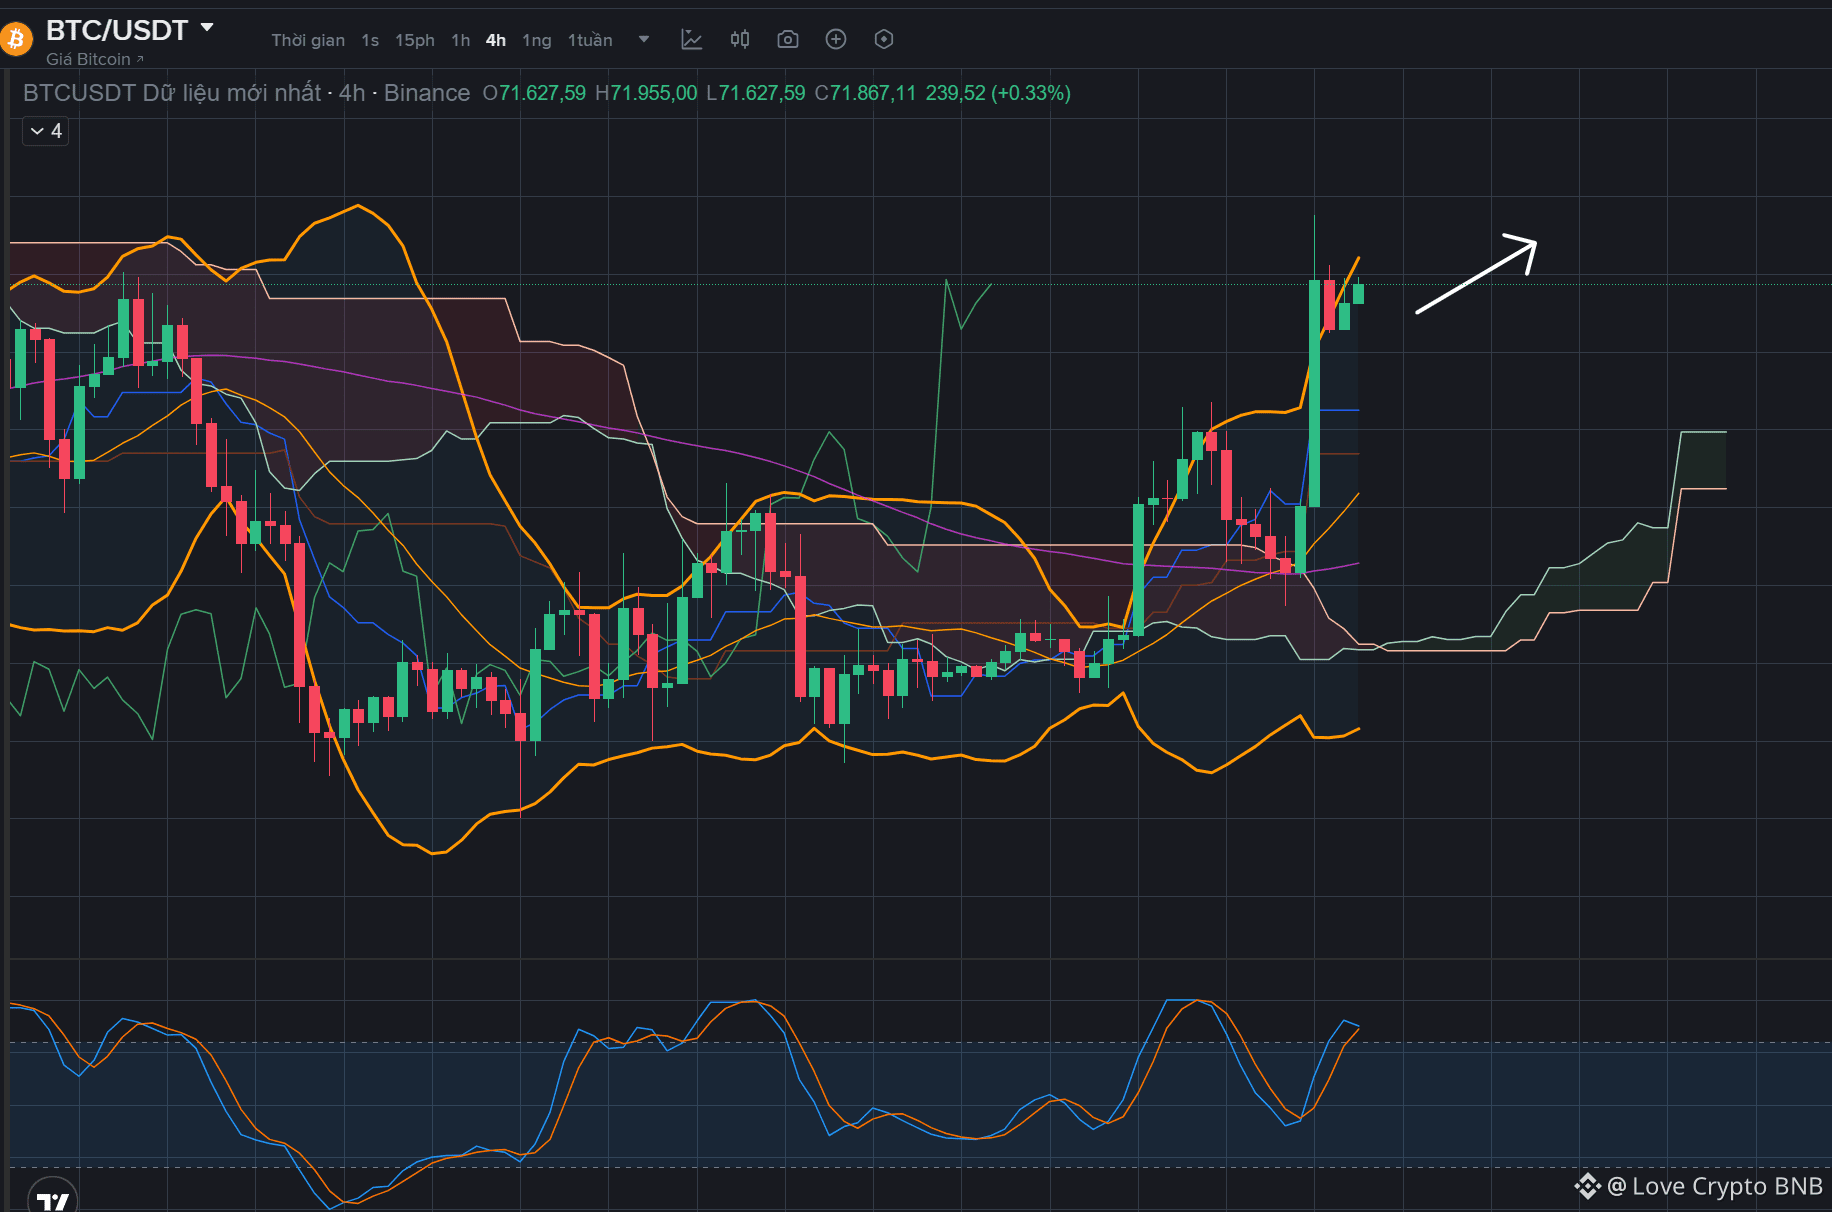
BTC CONTINUES TO MOVE LATERALLY FOR A PERIOD, THE PRICE BREAKING OUT OF THE CLOUD WILL INDICATE AN UPWARD TREND ON THE D FRAME
- On H4, the price line is currently in an upward trend
- On H4, the price line is currently in an upward trend
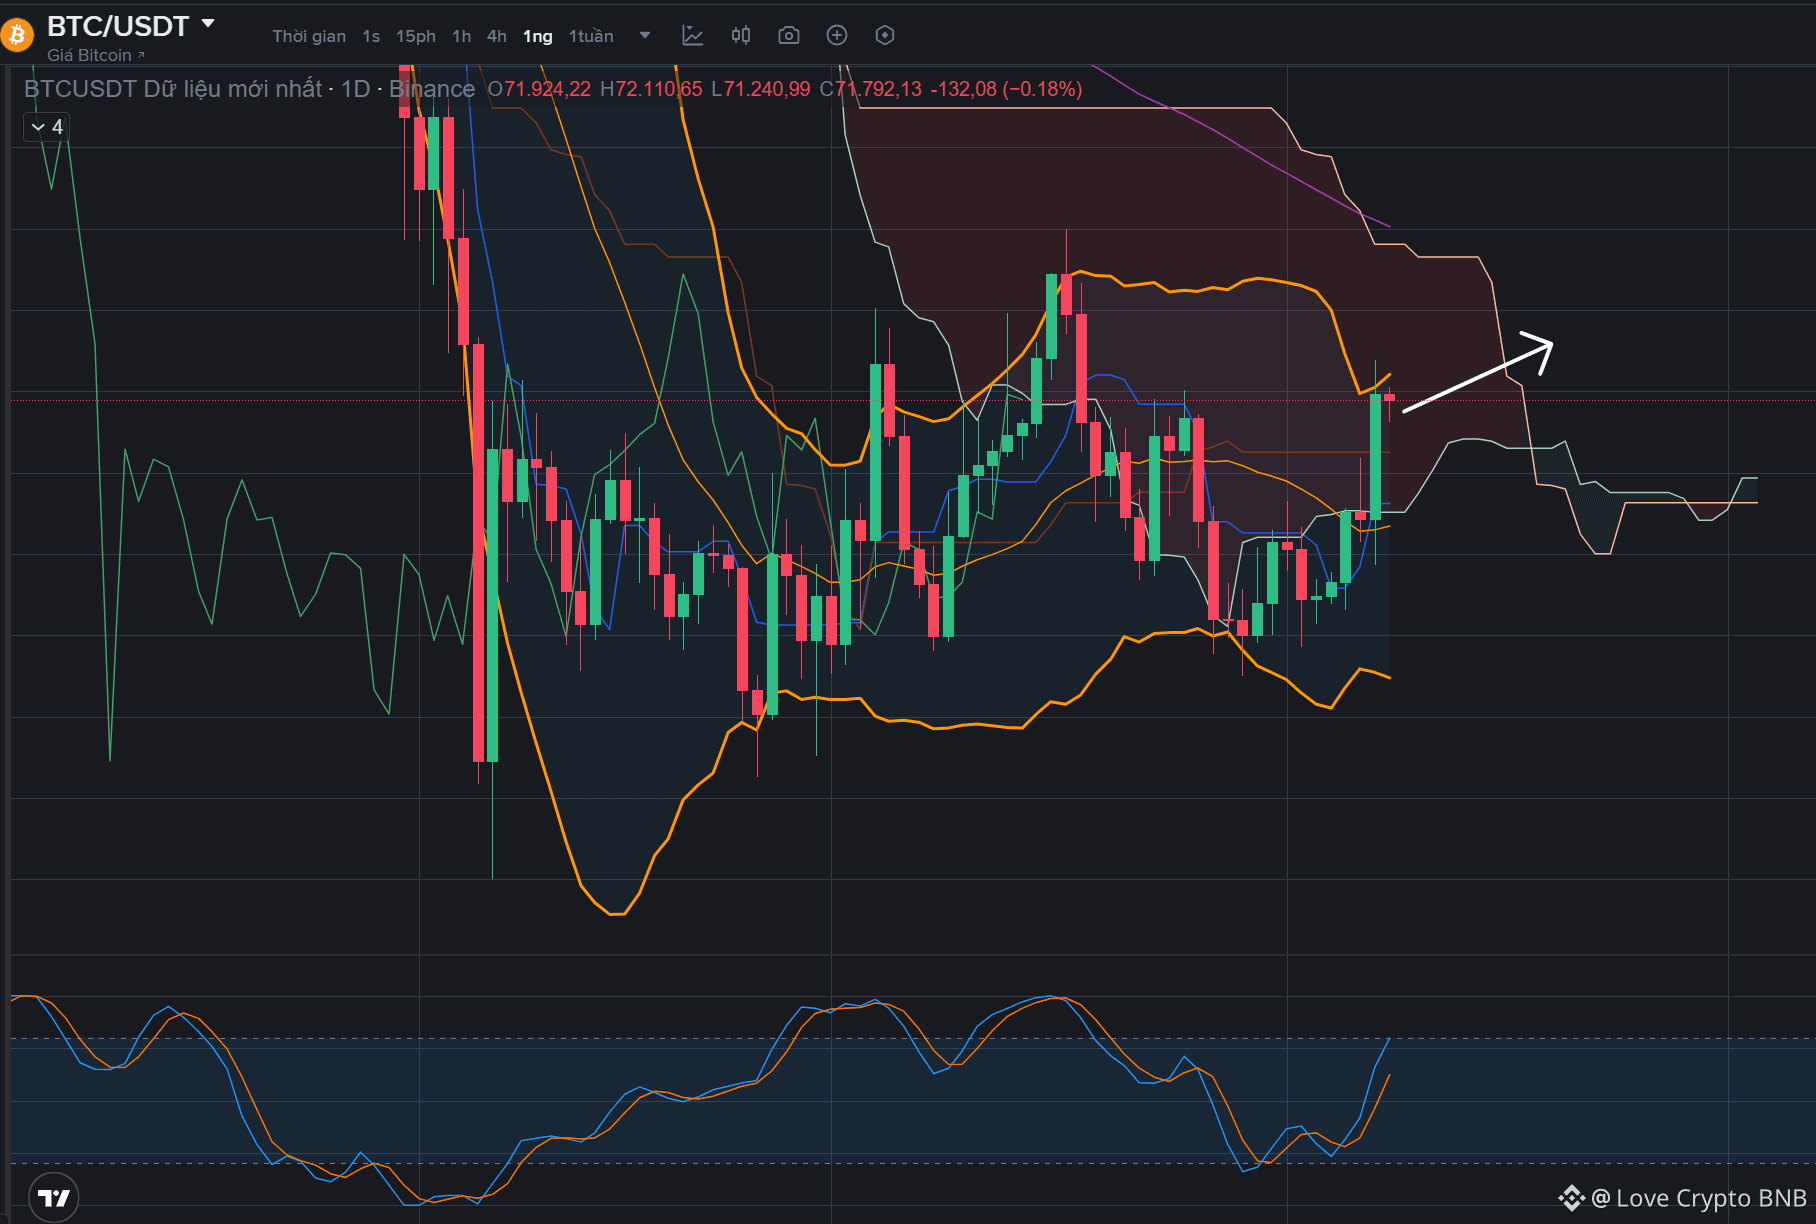
BNB ON H4 HAS BROKEN ABOVE THE CLOUD AND ABOVE MA100 FOR A BULLISH TREND ON H4
- The chikou line is still within the cloud and below ma100, so the price has not increased significantly; when the chikou line breaks above the cloud and above ma100, it will indicate a clear bullish trend and bnb will rise sharply.
- The chikou line is still within the cloud and below ma100, so the price has not increased significantly; when the chikou line breaks above the cloud and above ma100, it will indicate a clear bullish trend and bnb will rise sharply.
🔥 4. Important areas to pay attention to
🔴 Resistance (good short area):
~640 – 650
👉 This is:
Kijun + MA
Cloud edge
Strong supply area
📌 Always coincides with market analysis:
→ The 640 area is the main resistance
🟢 Support:
~600
deeper: 580
👉 If it breaks:
→ easily down to 570 – 550
⚠️ 5. The arrow you drew (expecting an increase)
👉 I’ll be straightforward:
This bullish scenario is NOT wrong, but just a pullback
🟢 If it increases:
Target: 640
But:
👉 that is the area to short, not to hold long
🧠 6. Reading according to SMC (Smart Money)
👉 Currently, the market is:
Strongly dumping (distribution finished)
Lightly rebounding
Preparing to create liquidity
📌 => Standard scenario:
Price rebounds to the 630–650 area
Sweeps liquidity (stop short)
After that:
👉 Dump continues
🎯 7. Main scenario
🔴 Priority scenario (70%):
Rebound to 630–650
Rejected
Continuing to decrease to:
600 → 580
🟢 Reversal scenario (30%):
Strong break above 650
Close D1 candle above that
👉 At that point:
→ A new trend may form
🧠 8. The most important insight
👉 Currently BNB:
Short-term: rebound
Medium-term: decrease
Structure: bearish
📌 => This is:
❗ “Pullback in a downtrend”
💬 Conclusion
👉 BNB at this moment:
Not an uptrend
Not a strong accumulation
👉 But is:
🔻 Downtrend + technical rebound
📌 The phrase you need to remember:
👉 “Don’t confuse pullback with reversal.”
🔴 Resistance (good short area):
~640 – 650
👉 This is:
Kijun + MA
Cloud edge
Strong supply area
📌 Always coincides with market analysis:
→ The 640 area is the main resistance
🟢 Support:
~600
deeper: 580
👉 If it breaks:
→ easily down to 570 – 550
⚠️ 5. The arrow you drew (expecting an increase)
👉 I’ll be straightforward:
This bullish scenario is NOT wrong, but just a pullback
🟢 If it increases:
Target: 640
But:
👉 that is the area to short, not to hold long
🧠 6. Reading according to SMC (Smart Money)
👉 Currently, the market is:
Strongly dumping (distribution finished)
Lightly rebounding
Preparing to create liquidity
📌 => Standard scenario:
Price rebounds to the 630–650 area
Sweeps liquidity (stop short)
After that:
👉 Dump continues
🎯 7. Main scenario
🔴 Priority scenario (70%):
Rebound to 630–650
Rejected
Continuing to decrease to:
600 → 580
🟢 Reversal scenario (30%):
Strong break above 650
Close D1 candle above that
👉 At that point:
→ A new trend may form
🧠 8. The most important insight
👉 Currently BNB:
Short-term: rebound
Medium-term: decrease
Structure: bearish
📌 => This is:
❗ “Pullback in a downtrend”
💬 Conclusion
👉 BNB at this moment:
Not an uptrend
Not a strong accumulation
👉 But is:
🔻 Downtrend + technical rebound
📌 The phrase you need to remember:
👉 “Don’t confuse pullback with reversal.”
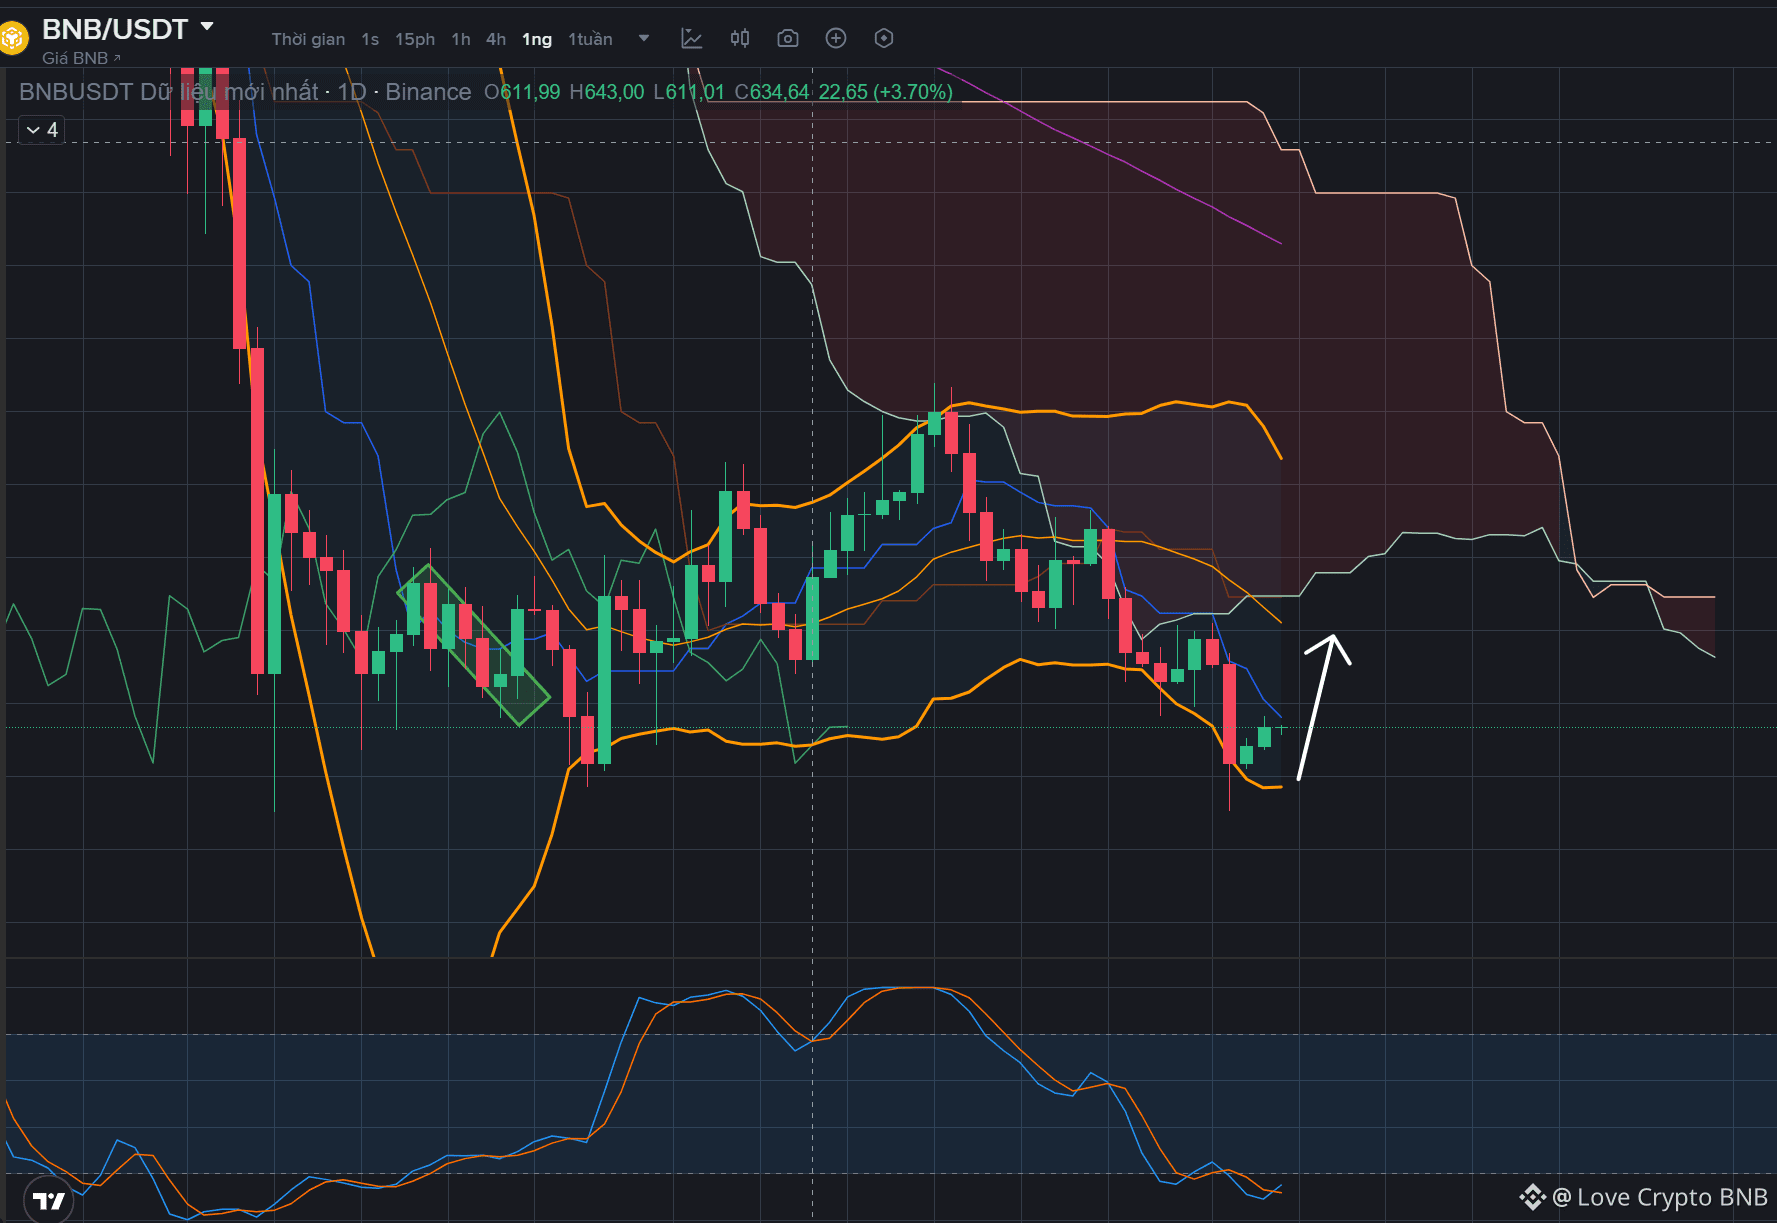
🧠 1. Overall trend (daily frame)
👉 BNB is in a downtrend
Clear signs:
Creating continuous lower highs
Creating lower lows
Price is below MA + below Ichimoku cloud
📌 This aligns with market data:
👉 BNB is in a bearish trend + weak sideways
📉 2. Current structure on the chart you sent
🔻 Previous phase:
Strong dump → breaking structure
Confirming BOS (Break of Structure) down
📊 Currently:
👉 Price is:
Slightly sideways after dropping
Weak pullback
📌 This is the pattern:
❗ Bearish Continuation (pullback to reduce further)
☁️ 3. Ichimoku – a very important factor
You are using Ichimoku → read as follows:
Price is below the cloud → bearish
The cloud ahead is thick → strong resistance
Tenkan + Kijun are pointing downwards
👉 Conclusion:
❗ The main trend is still DECREASING
👉 BNB is in a downtrend
Clear signs:
Creating continuous lower highs
Creating lower lows
Price is below MA + below Ichimoku cloud
📌 This aligns with market data:
👉 BNB is in a bearish trend + weak sideways
📉 2. Current structure on the chart you sent
🔻 Previous phase:
Strong dump → breaking structure
Confirming BOS (Break of Structure) down
📊 Currently:
👉 Price is:
Slightly sideways after dropping
Weak pullback
📌 This is the pattern:
❗ Bearish Continuation (pullback to reduce further)
☁️ 3. Ichimoku – a very important factor
You are using Ichimoku → read as follows:
Price is below the cloud → bearish
The cloud ahead is thick → strong resistance
Tenkan + Kijun are pointing downwards
👉 Conclusion:
❗ The main trend is still DECREASING
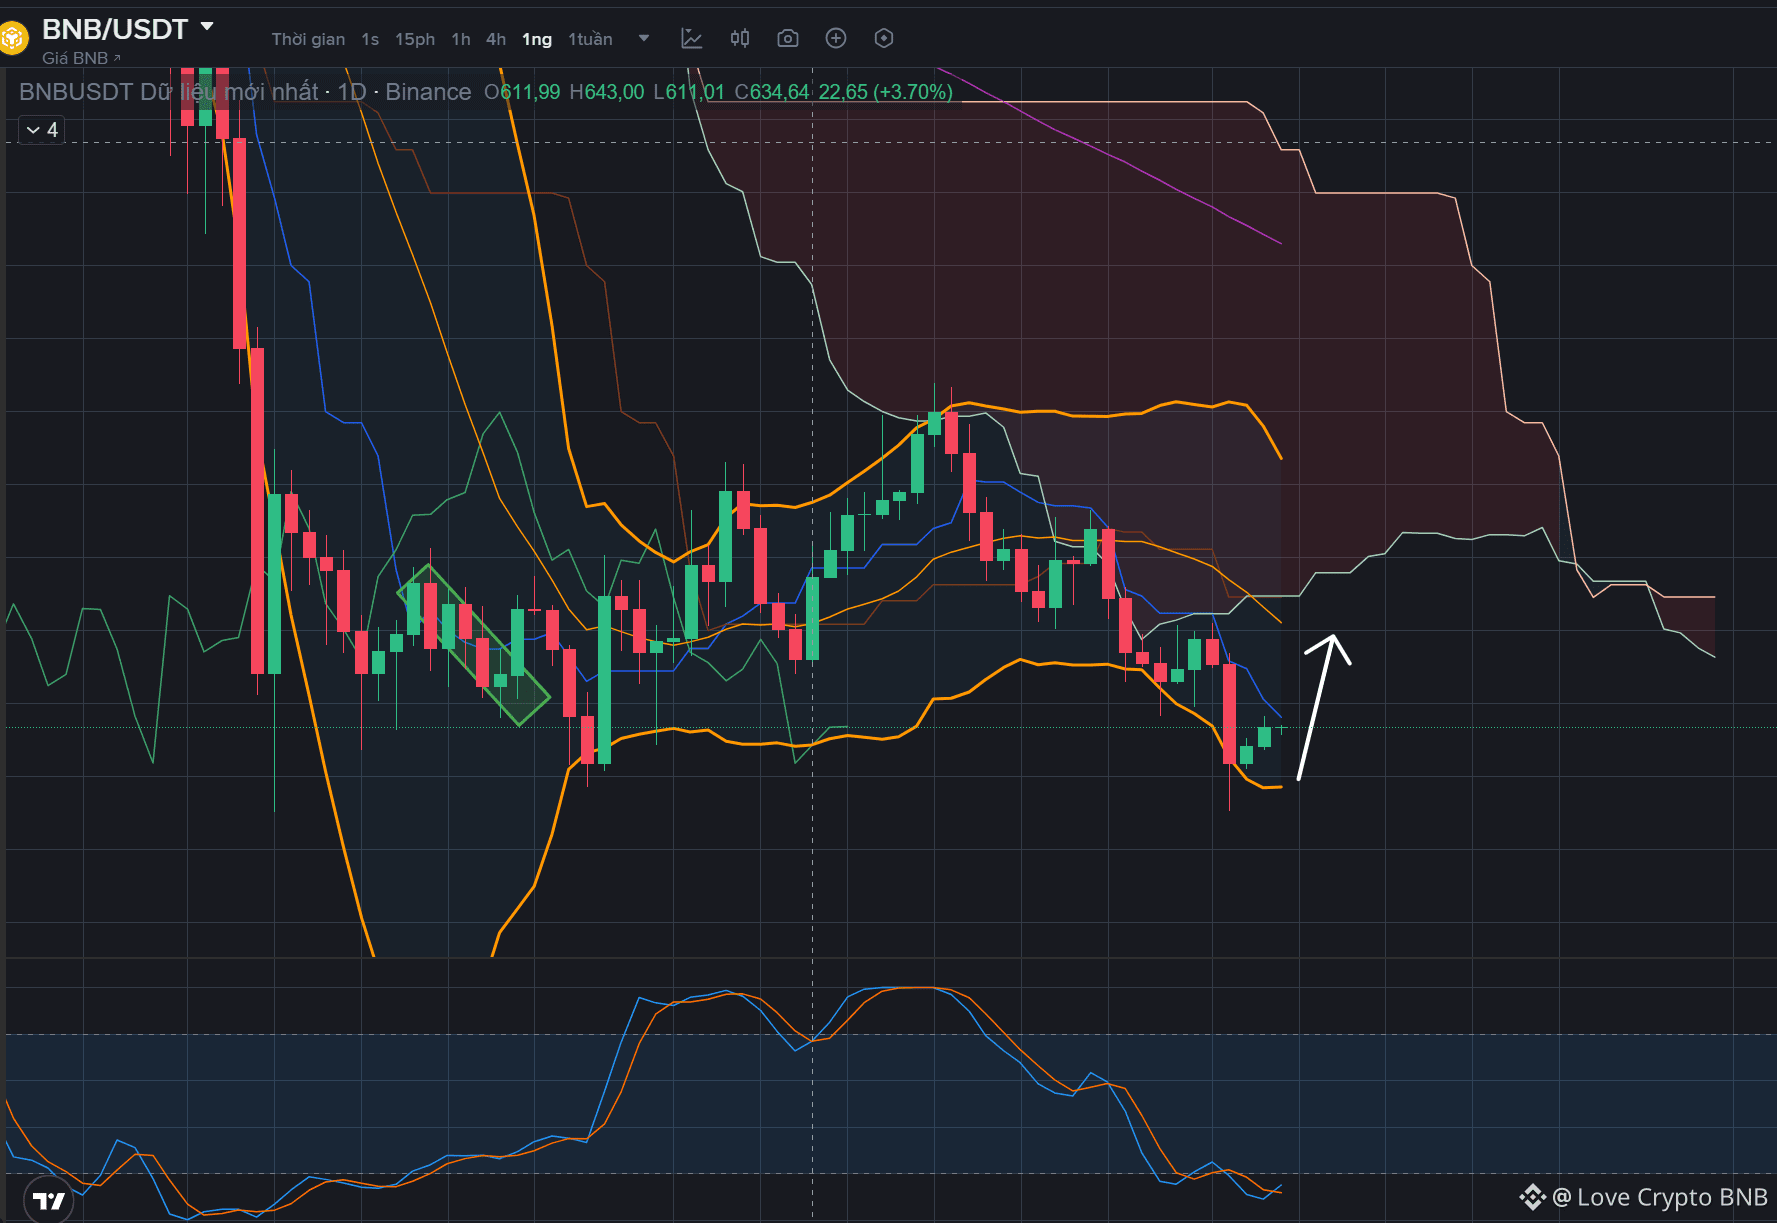
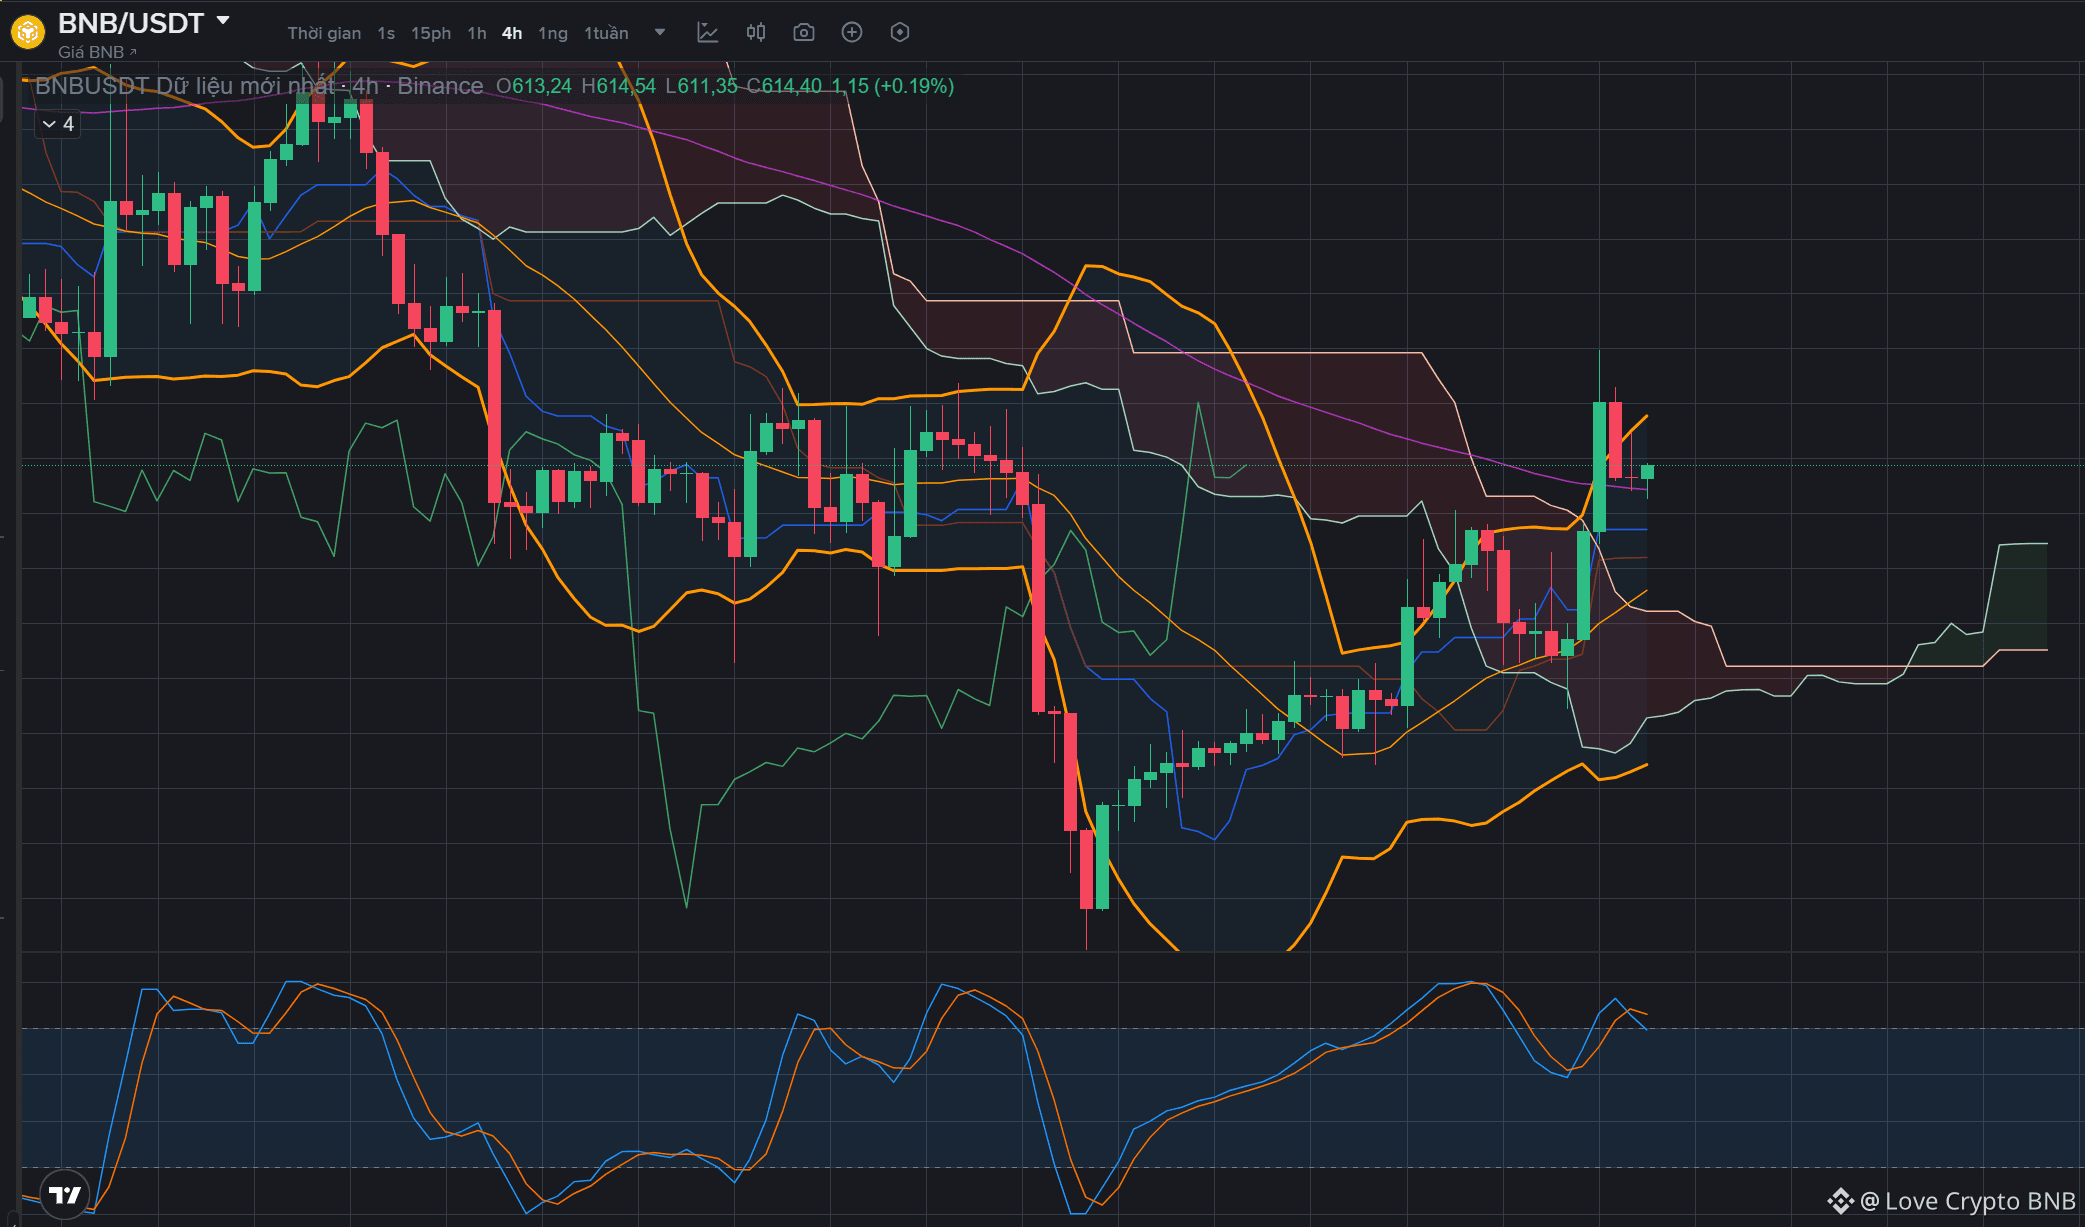
🔥 UPDATE ON BNB PRICE TREND
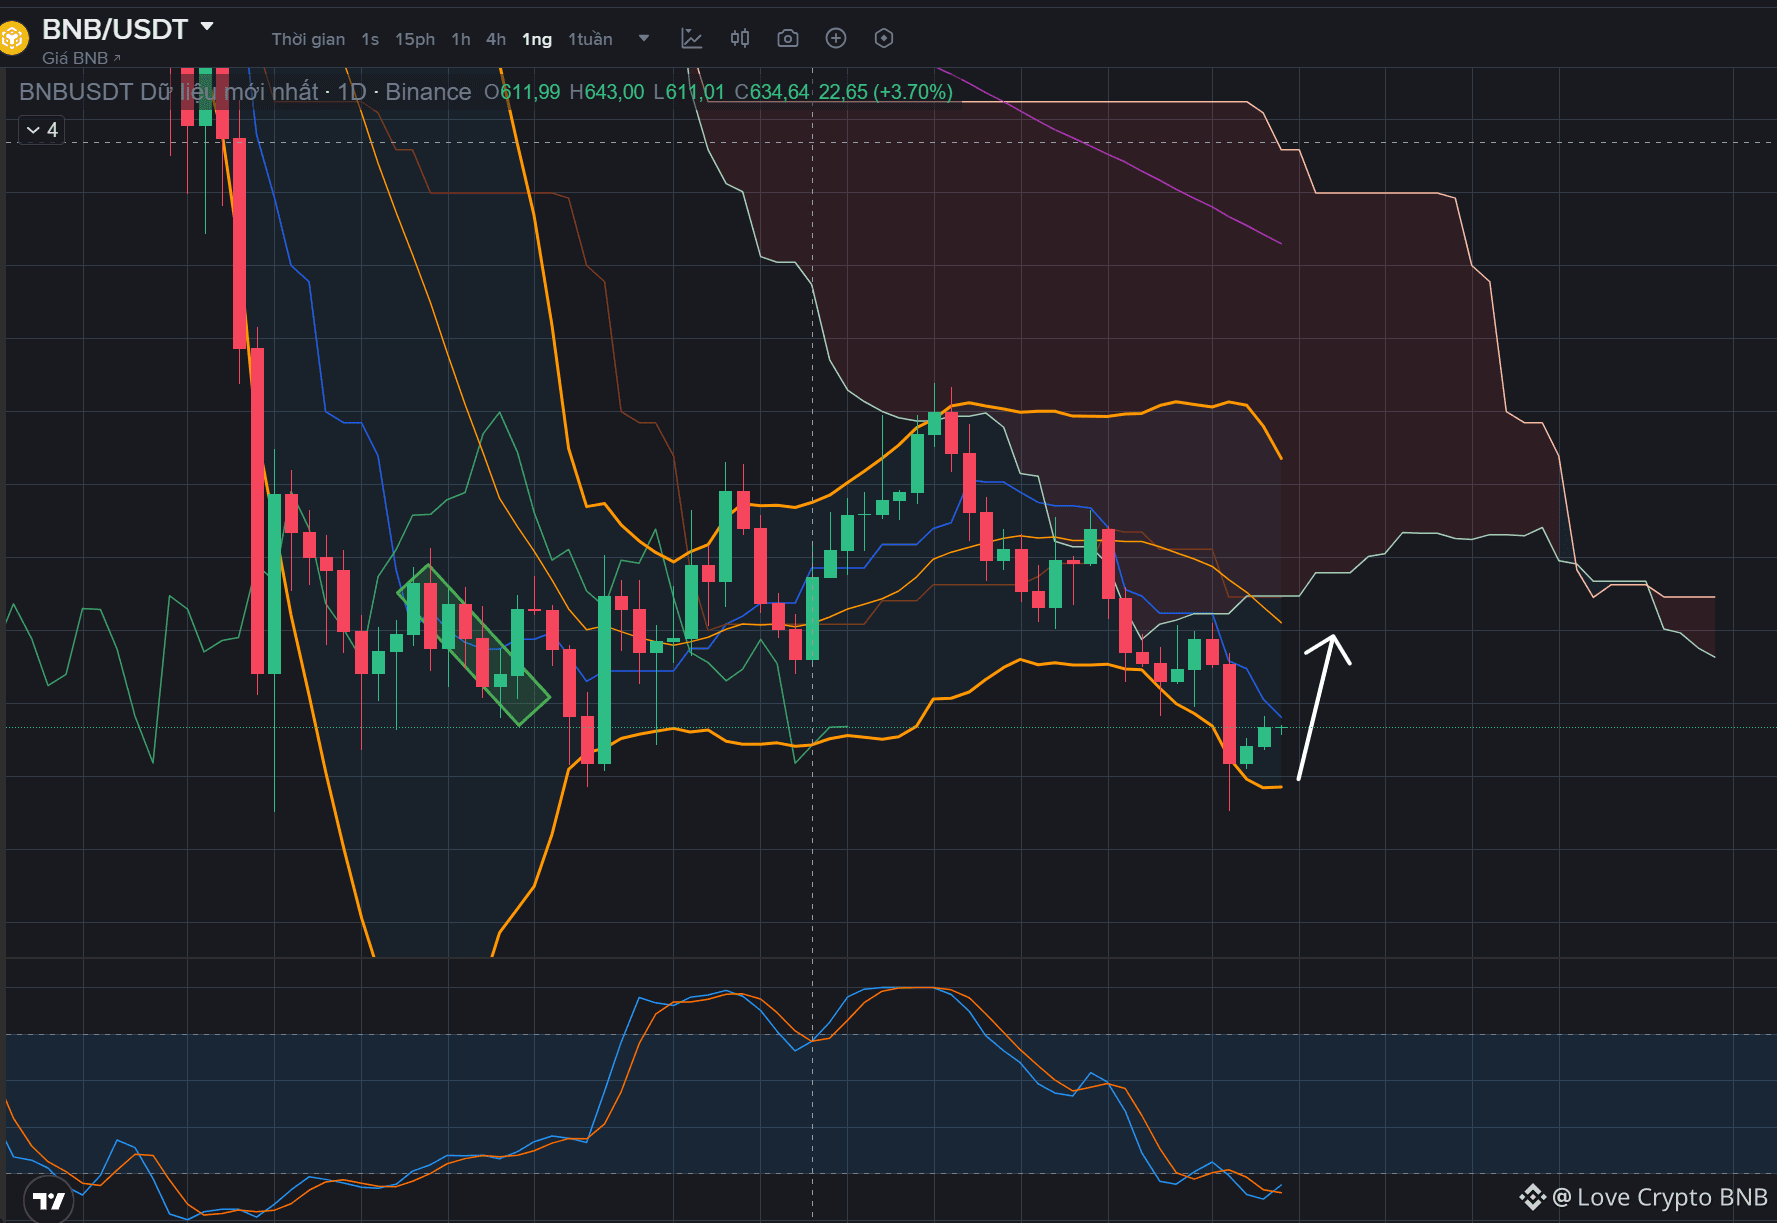
👉 In the short term, BNB is also heading towards the price range of 619 - 630, the middle line of the Bolinger and the cloud (price attracted to the cloud)
👉 In the short term, BNB is also heading towards the price range of 619 - 630, the middle line of the Bolinger and the cloud (price attracted to the cloud)
🧠 Quick meaning for traders
❗ 14 = Extremely fearful
🔥 What does this say about BTC?
📉 1. Current sentiment:
Retail is "slightly panicking"
Weak short-term confidence
Money is on the sidelines
🧠 2. But for Smart Money:
👉 This is actually a very notable area
As the classic saying goes:
"Be fearful when others are greedy, and greedy when others are fearful"
📌 Meaning:
Extreme Fear often appears near the bottom (not always the bottom right away)
But usually it's a good value area for the long term
⚠️ 3. Important warning
👉 Extreme Fear ≠ price will rise immediately
The reality:
The market can sideway or continue to drop
Fear can last for several weeks
🎯 Combined with the chart you sent
👉 When combined with:
Wyckoff: currently in markdown
SMC: bearish structure
Heatmap: preparing to sweep liquidity
📌 => Extremely strong insight:
❗ The market is:
Short-term: bearish / trap
Medium-term: approaching the "value" area
💬 Conclusion
👉 Currently:
Sentiment: Extremely negative (14)
Behavior: The crowd is scared
Opportunity: Starting to appear for the patient
📌 The most important saying:
👉 "When the market is fearful – opportunity begins to form, but it may not come immediately."
❗ 14 = Extremely fearful
🔥 What does this say about BTC?
📉 1. Current sentiment:
Retail is "slightly panicking"
Weak short-term confidence
Money is on the sidelines
🧠 2. But for Smart Money:
👉 This is actually a very notable area
As the classic saying goes:
"Be fearful when others are greedy, and greedy when others are fearful"
📌 Meaning:
Extreme Fear often appears near the bottom (not always the bottom right away)
But usually it's a good value area for the long term
⚠️ 3. Important warning
👉 Extreme Fear ≠ price will rise immediately
The reality:
The market can sideway or continue to drop
Fear can last for several weeks
🎯 Combined with the chart you sent
👉 When combined with:
Wyckoff: currently in markdown
SMC: bearish structure
Heatmap: preparing to sweep liquidity
📌 => Extremely strong insight:
❗ The market is:
Short-term: bearish / trap
Medium-term: approaching the "value" area
💬 Conclusion
👉 Currently:
Sentiment: Extremely negative (14)
Behavior: The crowd is scared
Opportunity: Starting to appear for the patient
📌 The most important saying:
👉 "When the market is fearful – opportunity begins to form, but it may not come immediately."
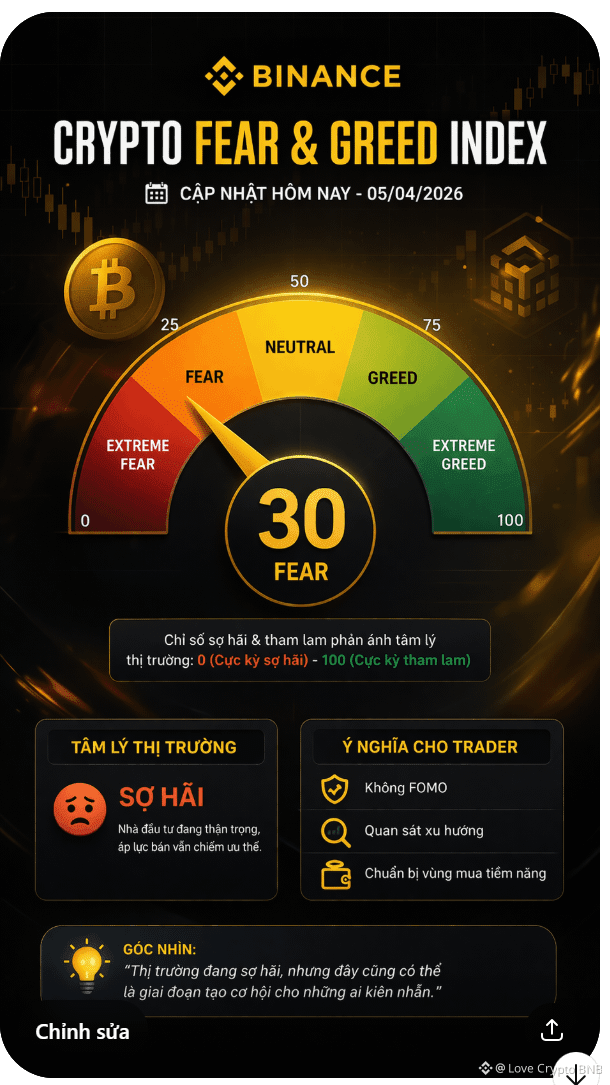
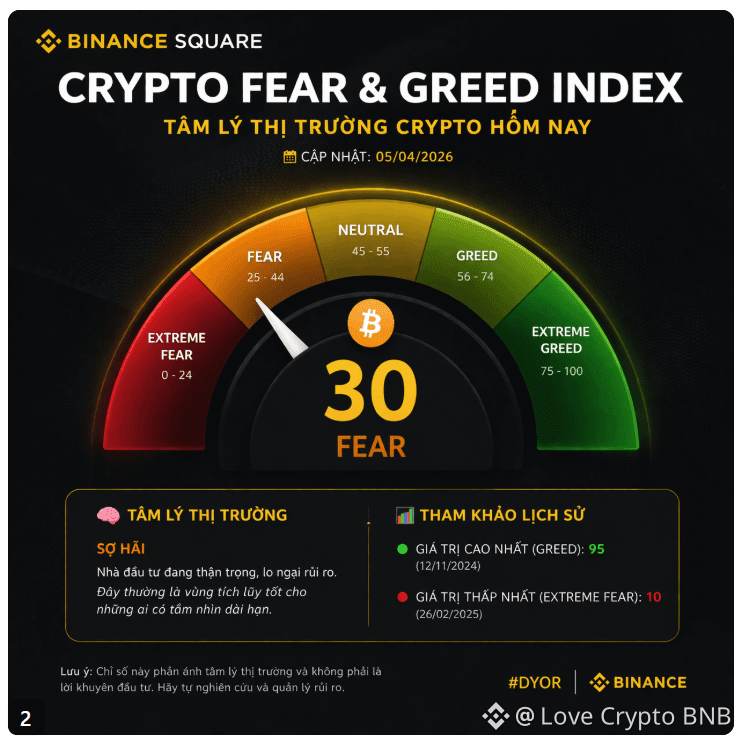
📊 Latest update today (05/04/2026):
👉 Bitcoin's current Fear & Greed index: ~14
👉 Status: 😱 Extreme Fear
🧠 Quick meaning for traders
❗ 14 = Extremely fearful
According to the scale:
0–24 → Extreme Fear
25–44 → Fear
45–55 → Neutral
56–74 → Greed
75–100 → Extreme Greed
👉 With a level of 14, the market is in a state:
Investors are fearful
Selling off a lot
Very negative sentiment
🔥 What does this say about BTC?
📉 1. Current sentiment:
Retail is "slightly panicking"
Weak short-term confidence
Money is on the sidelines
🧠 2. But with Smart Money:
👉 This is a very notable area
As the classic saying goes:
"Be fearful when others are greedy, and greedy when others are fearful"
📌 Meaning:
Extreme Fear often appears near the bottom (not always the bottom)
But usually is a good value area for the long term
👉 Bitcoin's current Fear & Greed index: ~14
👉 Status: 😱 Extreme Fear
🧠 Quick meaning for traders
❗ 14 = Extremely fearful
According to the scale:
0–24 → Extreme Fear
25–44 → Fear
45–55 → Neutral
56–74 → Greed
75–100 → Extreme Greed
👉 With a level of 14, the market is in a state:
Investors are fearful
Selling off a lot
Very negative sentiment
🔥 What does this say about BTC?
📉 1. Current sentiment:
Retail is "slightly panicking"
Weak short-term confidence
Money is on the sidelines
🧠 2. But with Smart Money:
👉 This is a very notable area
As the classic saying goes:
"Be fearful when others are greedy, and greedy when others are fearful"
📌 Meaning:
Extreme Fear often appears near the bottom (not always the bottom)
But usually is a good value area for the long term
🔥 3. What is the Market Maker doing?
Observing behavior:
Price has been stagnant for a long time (sideway tight range)
No strong breakout
Liquidity builds thick at both ends
👉 This is a sign:
🧠 The stage of “build liquidity trap”
Market maker is:
Keeping the price within range
Waiting for retail to enter orders
Then sweeping liquidity on one side
🎯 4. High probability scenario
🟢 Scenario 1 (priority): Sweep up first
👉 Because:
Liquidity above is thicker
Closer
Easier to “farm stop loss”
Development:
Price pumps up to ~67.8K – 68K
Sweeps liquidity (stops shorts)
Then:
May dump strongly back down
📌 This is called:
👉 Liquidity grab → reversal
🔴 Scenario 2: Sweep down first
Price drops down to ~66K
Sweeps stop longs
Bounces back up
👉 But lower probability because of weaker liquidity above
⚠️ 5. The most important thing
👉 Don’t trade in the middle of this range
Because:
Very easy to get “chopped”
Bad RR (risk/reward)
No edge
🧠 6. Advanced insight (very important)
👉 The heatmap is showing:
The market has no clear trend
Is in the liquidity accumulation phase
📌 Combined with previous analysis (Wyckoff + SMC):
👉 This is:
❗ Pullback in downtrend + trap setup
🎯 7. Standard strategy
❌ Avoid:
Long in the middle of the range
Short in the middle of the range
✅ Should do:
Option 1 (safe):
Wait for the price to sweep up to 68K
Observe the reaction
If strongly rejected → short
Option 2:
Wait for sweep down to 66K
If there is a reaction → long scalp
💬 Conclusion
👉 This chart is saying very clearly:
Price is trapped between 2 liquidity zones
Whales are preparing to “hunt stops”
A strong move is coming that will be fake first – real later
Observing behavior:
Price has been stagnant for a long time (sideway tight range)
No strong breakout
Liquidity builds thick at both ends
👉 This is a sign:
🧠 The stage of “build liquidity trap”
Market maker is:
Keeping the price within range
Waiting for retail to enter orders
Then sweeping liquidity on one side
🎯 4. High probability scenario
🟢 Scenario 1 (priority): Sweep up first
👉 Because:
Liquidity above is thicker
Closer
Easier to “farm stop loss”
Development:
Price pumps up to ~67.8K – 68K
Sweeps liquidity (stops shorts)
Then:
May dump strongly back down
📌 This is called:
👉 Liquidity grab → reversal
🔴 Scenario 2: Sweep down first
Price drops down to ~66K
Sweeps stop longs
Bounces back up
👉 But lower probability because of weaker liquidity above
⚠️ 5. The most important thing
👉 Don’t trade in the middle of this range
Because:
Very easy to get “chopped”
Bad RR (risk/reward)
No edge
🧠 6. Advanced insight (very important)
👉 The heatmap is showing:
The market has no clear trend
Is in the liquidity accumulation phase
📌 Combined with previous analysis (Wyckoff + SMC):
👉 This is:
❗ Pullback in downtrend + trap setup
🎯 7. Standard strategy
❌ Avoid:
Long in the middle of the range
Short in the middle of the range
✅ Should do:
Option 1 (safe):
Wait for the price to sweep up to 68K
Observe the reaction
If strongly rejected → short
Option 2:
Wait for sweep down to 66K
If there is a reaction → long scalp
💬 Conclusion
👉 This chart is saying very clearly:
Price is trapped between 2 liquidity zones
Whales are preparing to “hunt stops”
A strong move is coming that will be fake first – real later
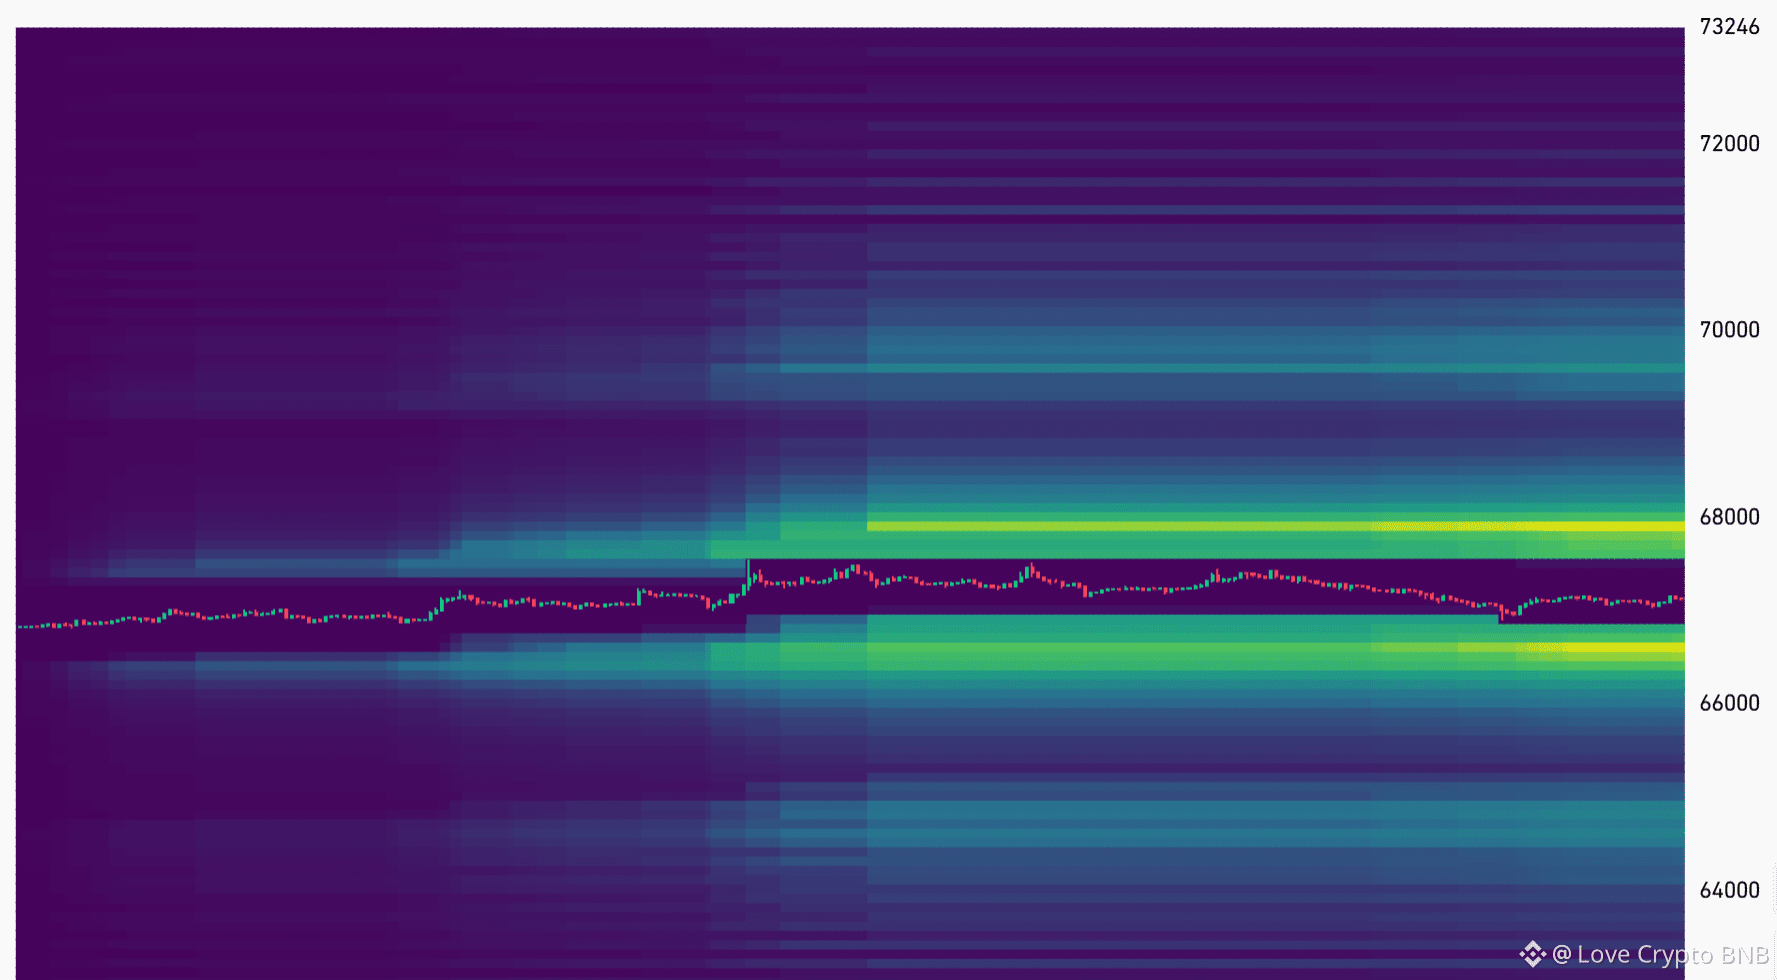
📊 2. Current important areas
🔴 Upper area: ~67.8K – 68K
There is a clear liquidity cluster (yellow)
Located just above the current price
👉 This is:
❗ Liquidity Magnet
🟢 Lower area: ~66K – 66.5K
Also has strong liquidity
But slightly weaker than the upper area
👉 This is:
Lower liquidity (secondary target)
⚖️ Important remarks:
👉 The current price is "stuck between 2 liquidity areas"
Above: more attractive (more liquidity)
Below: can still be swept
🔴 Upper area: ~67.8K – 68K
There is a clear liquidity cluster (yellow)
Located just above the current price
👉 This is:
❗ Liquidity Magnet
🟢 Lower area: ~66K – 66.5K
Also has strong liquidity
But slightly weaker than the upper area
👉 This is:
Lower liquidity (secondary target)
⚖️ Important remarks:
👉 The current price is "stuck between 2 liquidity areas"
Above: more attractive (more liquidity)
Below: can still be swept
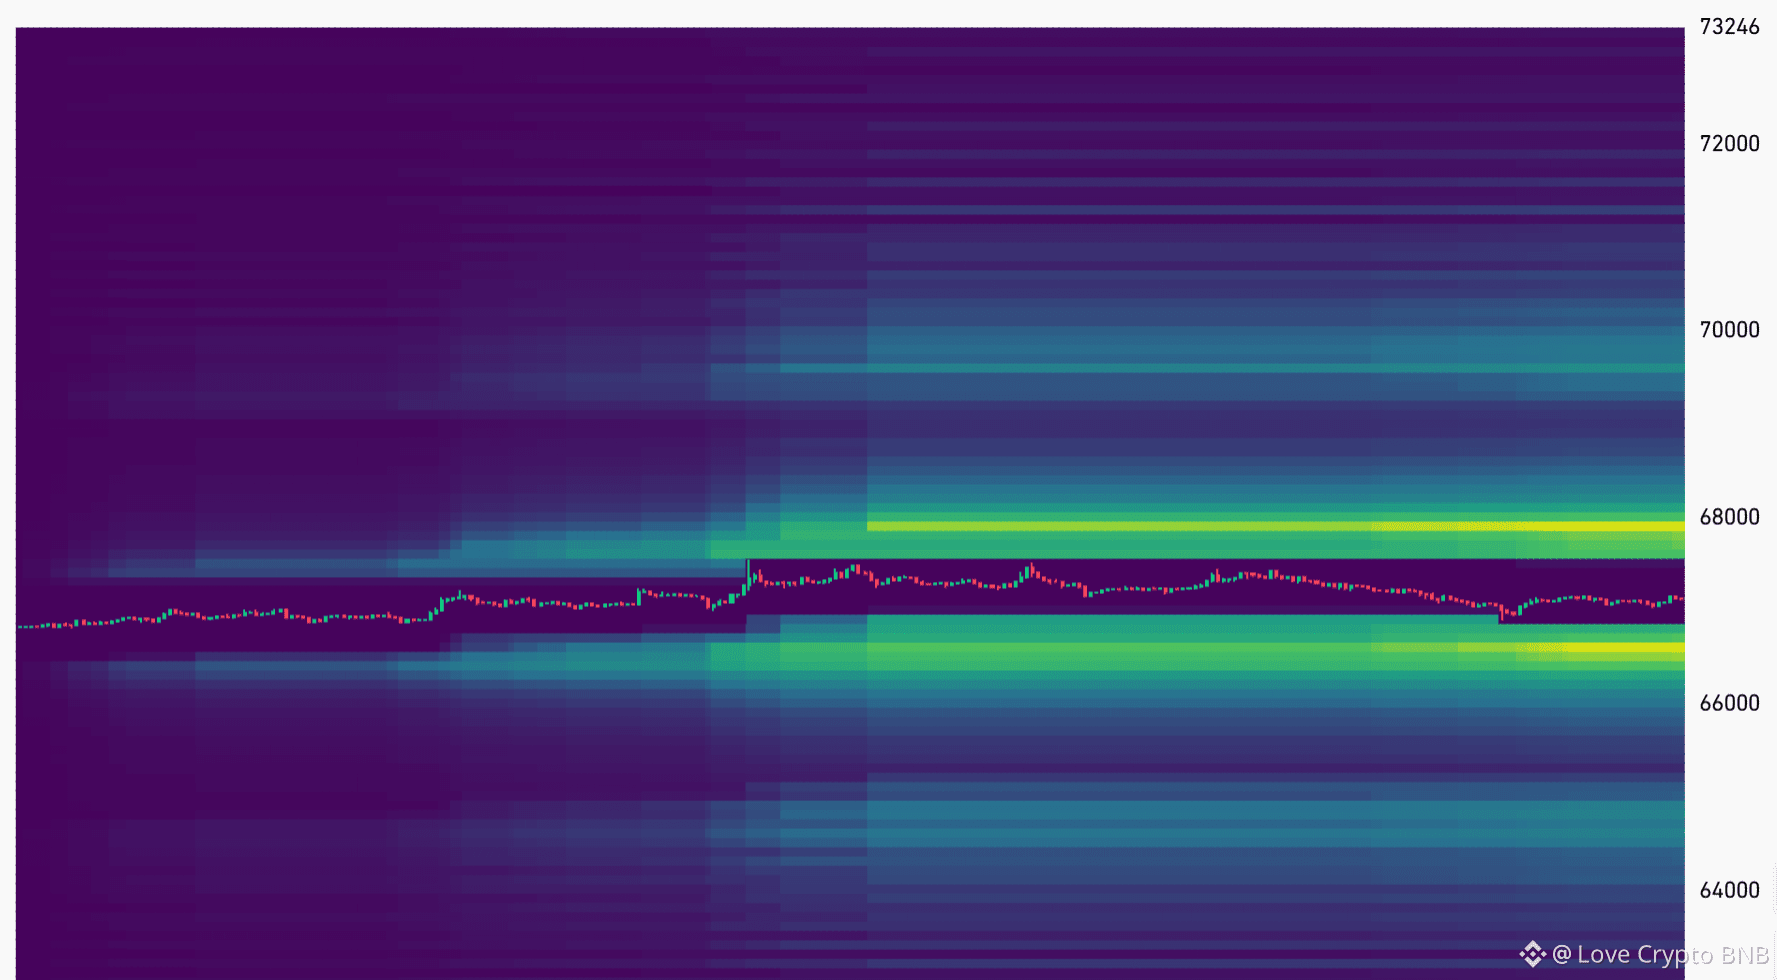
🎯 3. Summary of Wyckoff + SMC
👉 Clear picture:
Wyckoff: Markdown (downtrend)
SMC: Bearish structure + waiting for a rebound to short
📌 => Extremely important conclusion:
❗ The current market is NOT an uptrend
👉 But a downtrend with a rebound
🔮 4. Upcoming scenario
🔴 Main scenario (high probability):
Price rebounds up:
65K → 68K
Touches supply / FVG
Gets rejected
Dumps further down:
60K → 58K (liquidity sweep)
🟢 Reversal scenario (lower probability):
Price reclaims the 70K+ area
Breaks the weekly structure
Creates Higher High
👉 At that point:
The market shifts back to bullish
🧠 5. Most important insight
👉 Currently, the market is:
Not accumulating
But has finished distributing → is decreasing
📌 A saying you should remember:
👉 “Don’t catch a falling knife in markdown.”
🎯 6. Trader's perspective
👉 The best strategy right now:
Prioritize shorting when the price rebounds
No FOMO long
Wait for liquidity to be swept
👉 Clear picture:
Wyckoff: Markdown (downtrend)
SMC: Bearish structure + waiting for a rebound to short
📌 => Extremely important conclusion:
❗ The current market is NOT an uptrend
👉 But a downtrend with a rebound
🔮 4. Upcoming scenario
🔴 Main scenario (high probability):
Price rebounds up:
65K → 68K
Touches supply / FVG
Gets rejected
Dumps further down:
60K → 58K (liquidity sweep)
🟢 Reversal scenario (lower probability):
Price reclaims the 70K+ area
Breaks the weekly structure
Creates Higher High
👉 At that point:
The market shifts back to bullish
🧠 5. Most important insight
👉 Currently, the market is:
Not accumulating
But has finished distributing → is decreasing
📌 A saying you should remember:
👉 “Don’t catch a falling knife in markdown.”
🎯 6. Trader's perspective
👉 The best strategy right now:
Prioritize shorting when the price rebounds
No FOMO long
Wait for liquidity to be swept
🏗️ 2. SMC (Smart Money Concept)
🔥 A. Market Structure
👉 Currently:
Has Broken Structure (BOS) down on the weekly timeframe
No more Higher High / Higher Low
📌 => Main trend:
❗ Bearish Market Structure
🧱 B. Important Order Block
🔴 Bearish Order Block (strong supply zone):
Around the range: 68K – 72K
👉 This is the zone:
Before a strong dump
Where Smart Money may have sold
📌 => If the price retraces up:
👉 This is a nice short zone
🟢 Bullish Order Block (demand zone):
Around the range: 58K – 60K
👉 This is the zone:
Has price reaction
Could be the place to create a bounce
⚡ C. Liquidity
👉 The current market is doing exactly Smart Money's “play”:
Sweeping liquidity above (fake breakout)
Then a strong dump down
Currently:
Liquidity is below the nearest bottom
👉 => High possibility of sweeping down below
🧲 D. Fair Value Gap (FVG)
In the recent dump:
Many FVG appeared in the range of 65K – 70K
👉 This means:
Price may retrace up to fill the gap
Then continue to decrease
🔥 A. Market Structure
👉 Currently:
Has Broken Structure (BOS) down on the weekly timeframe
No more Higher High / Higher Low
📌 => Main trend:
❗ Bearish Market Structure
🧱 B. Important Order Block
🔴 Bearish Order Block (strong supply zone):
Around the range: 68K – 72K
👉 This is the zone:
Before a strong dump
Where Smart Money may have sold
📌 => If the price retraces up:
👉 This is a nice short zone
🟢 Bullish Order Block (demand zone):
Around the range: 58K – 60K
👉 This is the zone:
Has price reaction
Could be the place to create a bounce
⚡ C. Liquidity
👉 The current market is doing exactly Smart Money's “play”:
Sweeping liquidity above (fake breakout)
Then a strong dump down
Currently:
Liquidity is below the nearest bottom
👉 => High possibility of sweeping down below
🧲 D. Fair Value Gap (FVG)
In the recent dump:
Many FVG appeared in the range of 65K – 70K
👉 This means:
Price may retrace up to fill the gap
Then continue to decrease
🧠 1. Wyckoff: What phase is the market in?
📉 Current overall: Distribution → Markdown (downtrend)
Looking at the weekly structure:
Previous phase:
BTC peaked around the ~73K–76K range
Extended sideways → resembling Distribution Range
👉 This is a sign of:
Smart Money unloading to retail
After that:
A strong breakdown occurred
Large red candle + volume (hidden)
Loss of uptrend structure
👉 This is exactly:
🔻 Markdown phase (down phase)
📌 Where are we now?
👉 According to Wyckoff:
= Currently in the middle of Markdown + signs of creating a “pause”
Prices are dropping sharply → currently starting to stabilize
A doji / spinning top candle appears (as you have seen)
📌 This is usually:
👉 Temporary Support
NOT a certain bottom
📉 Current overall: Distribution → Markdown (downtrend)
Looking at the weekly structure:
Previous phase:
BTC peaked around the ~73K–76K range
Extended sideways → resembling Distribution Range
👉 This is a sign of:
Smart Money unloading to retail
After that:
A strong breakdown occurred
Large red candle + volume (hidden)
Loss of uptrend structure
👉 This is exactly:
🔻 Markdown phase (down phase)
📌 Where are we now?
👉 According to Wyckoff:
= Currently in the middle of Markdown + signs of creating a “pause”
Prices are dropping sharply → currently starting to stabilize
A doji / spinning top candle appears (as you have seen)
📌 This is usually:
👉 Temporary Support
NOT a certain bottom
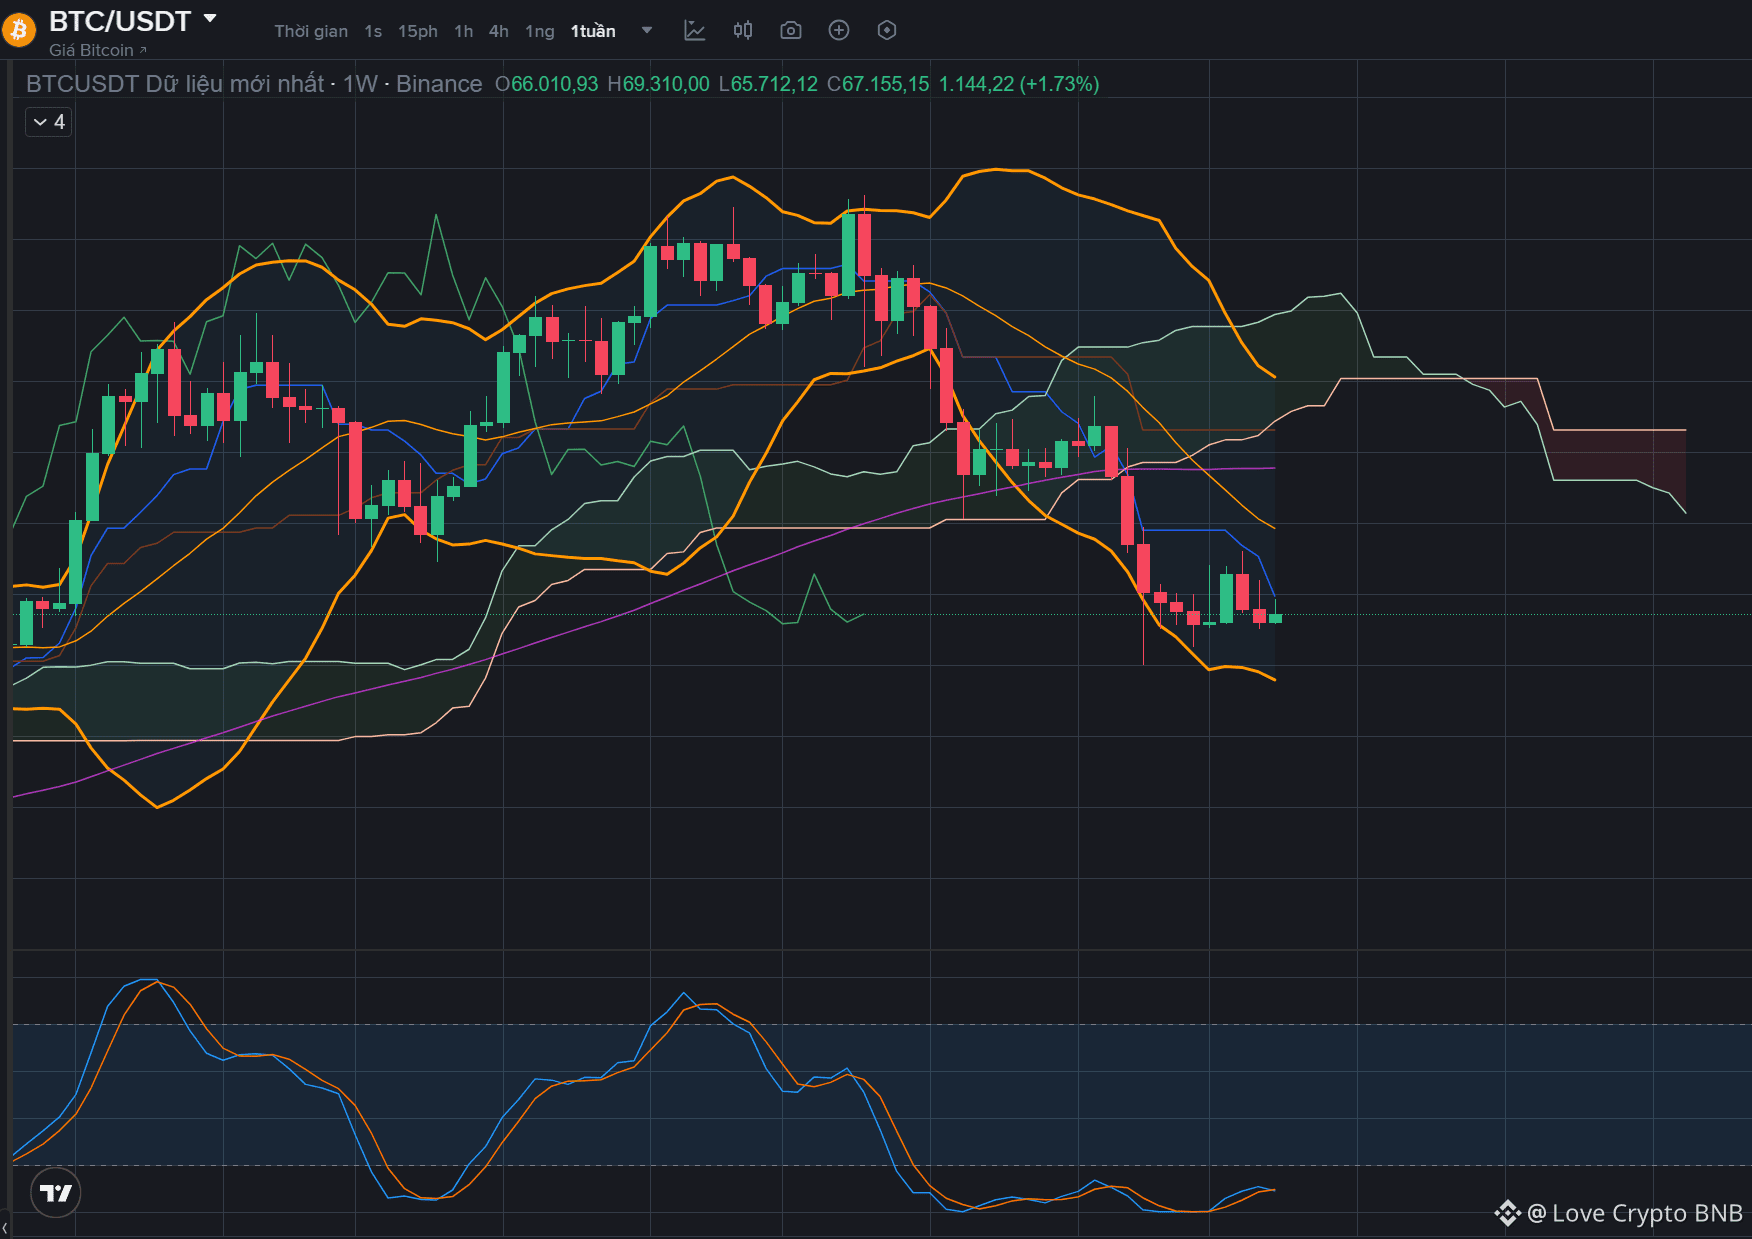
🔮 WHAT CAN THE WEEKLY CANDLE OF BTC REVEAL?
🔥 4. Who is currently in the lead?
👉 The selling side is still slightly in the lead, because:
The previous trend was downward
The price remains below resistance zones (MA / cloud)
There are no strong reversal signals yet
📌 However:
The buying side has started to react → potential for a short-term bottom
🎯 5. Next scenarios to pay attention to
🔴 Continuing Bearish:
Next week closes with a red candle
Break the low of the current candle
👉 → Confirm continued decline
🟢 Short-term Bullish reversal:
Next week is a strong green candle (the more engulfing, the better)
Close above this week's high
👉 → May form a temporary bottom
🧠 Quick conclusion
👉 The current weekly candle is:
Spinning Top / Doji-like
Indicating: indecision – sideways – resting after the decline
📌 Trend:
➡️ Bearish is still slightly ahead, but is weakening
🔥 4. Who is currently in the lead?
👉 The selling side is still slightly in the lead, because:
The previous trend was downward
The price remains below resistance zones (MA / cloud)
There are no strong reversal signals yet
📌 However:
The buying side has started to react → potential for a short-term bottom
🎯 5. Next scenarios to pay attention to
🔴 Continuing Bearish:
Next week closes with a red candle
Break the low of the current candle
👉 → Confirm continued decline
🟢 Short-term Bullish reversal:
Next week is a strong green candle (the more engulfing, the better)
Close above this week's high
👉 → May form a temporary bottom
🧠 Quick conclusion
👉 The current weekly candle is:
Spinning Top / Doji-like
Indicating: indecision – sideways – resting after the decline
📌 Trend:
➡️ Bearish is still slightly ahead, but is weakening
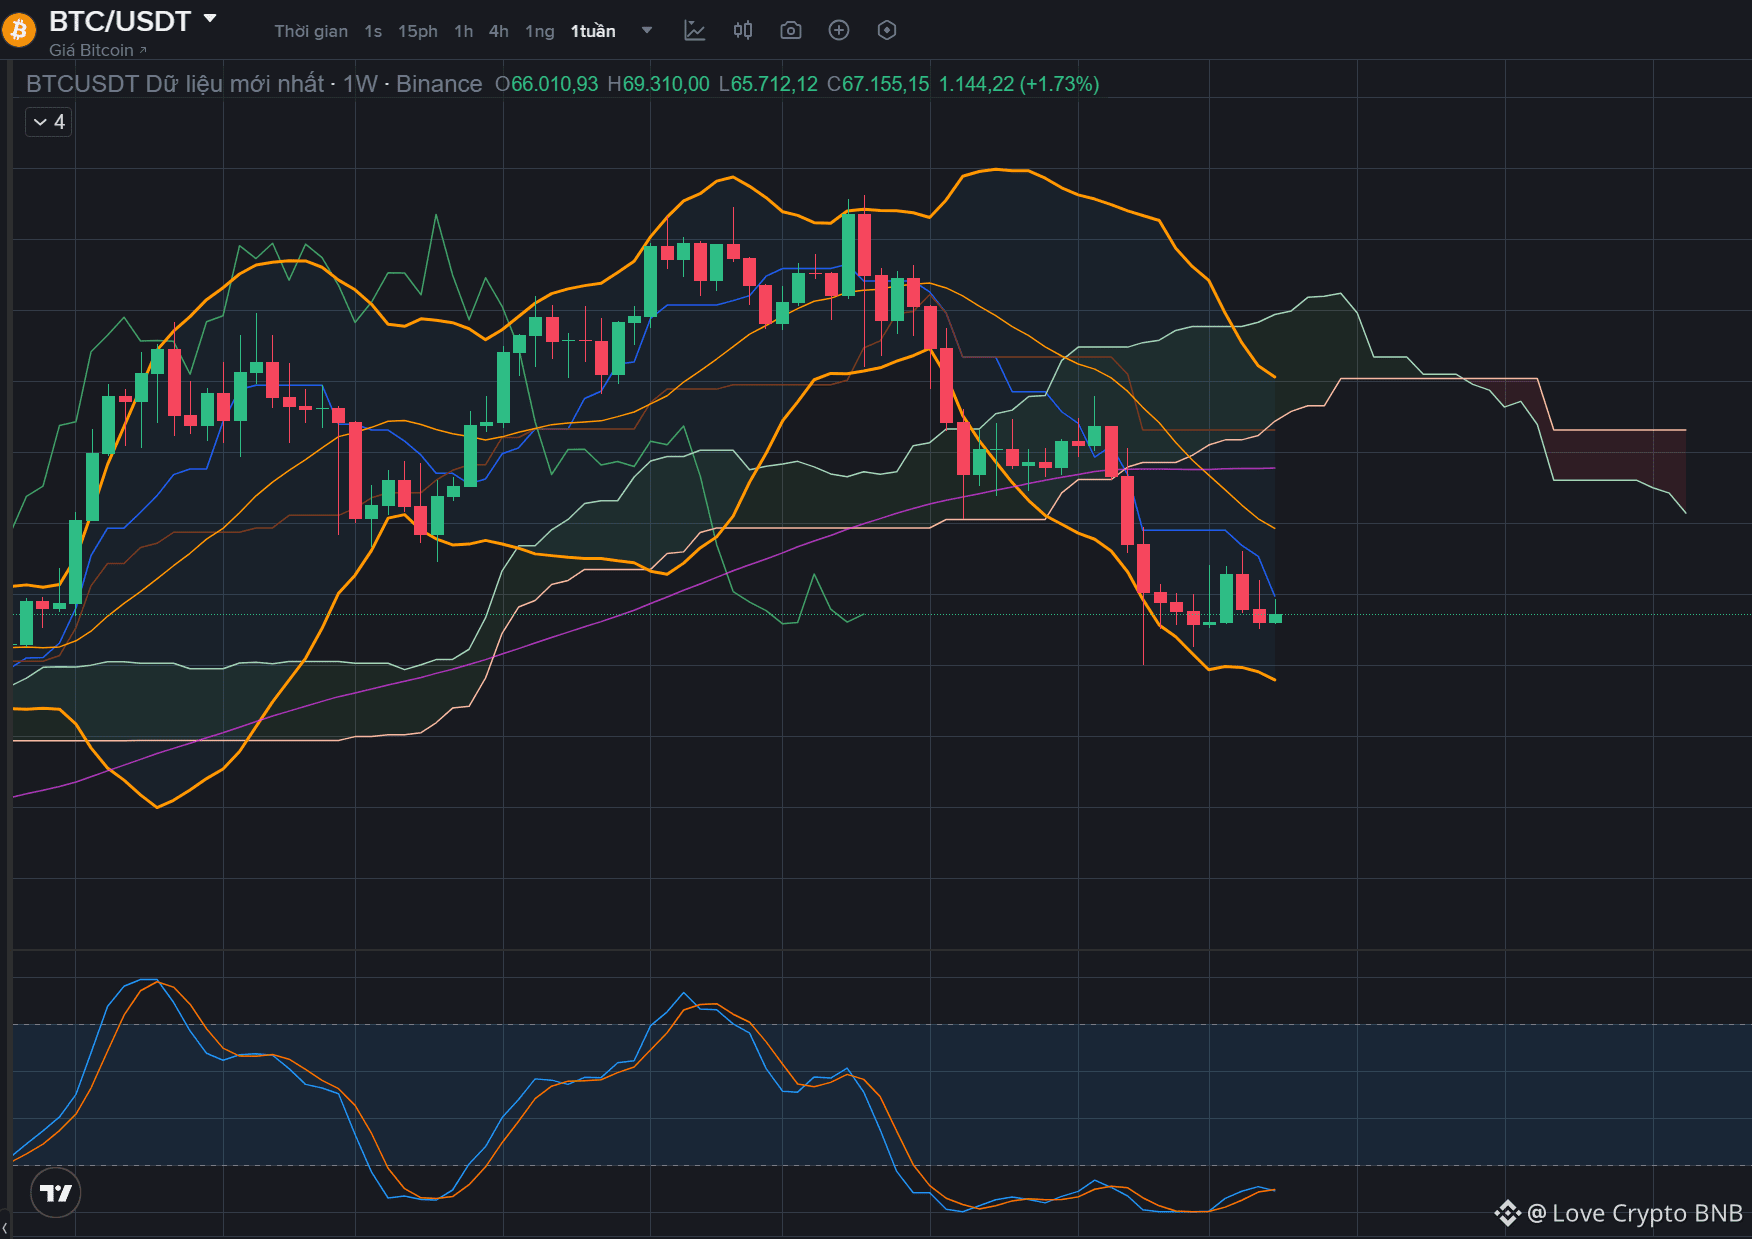
🔮 WHAT CAN THE BTC CANDLESTICK TELL US?
🕯️ 1. Current candlestick type: Small body candle + two wicks (Spinning Top / Doji variant)
Characteristics:
Small candle body
Has an upper wick and a lower wick
Opening and closing prices do not differ too much
👉 This type of candle indicates market indecision
⚖️ 2. Meaning: The buying and selling sides are in conflict
Sellers: have pushed the price down quite strongly before (clear downtrend)
Buyers: starting to react at low levels → pulling the price back up
📌 But:
👉 Neither side has complete control
📉 3. Placed in context: After a strong downtrend
This is an IMPORTANT point 👇
Before this candlestick is a series of strong red candles
Price breaks short-term structure
👉 Therefore, the current candlestick means:
= Pause candle in a downtrend
🕯️ 1. Current candlestick type: Small body candle + two wicks (Spinning Top / Doji variant)
Characteristics:
Small candle body
Has an upper wick and a lower wick
Opening and closing prices do not differ too much
👉 This type of candle indicates market indecision
⚖️ 2. Meaning: The buying and selling sides are in conflict
Sellers: have pushed the price down quite strongly before (clear downtrend)
Buyers: starting to react at low levels → pulling the price back up
📌 But:
👉 Neither side has complete control
📉 3. Placed in context: After a strong downtrend
This is an IMPORTANT point 👇
Before this candlestick is a series of strong red candles
Price breaks short-term structure
👉 Therefore, the current candlestick means:
= Pause candle in a downtrend
🔮 UPDATE ON BTC PRICE TREND IN THE SHORT TERM
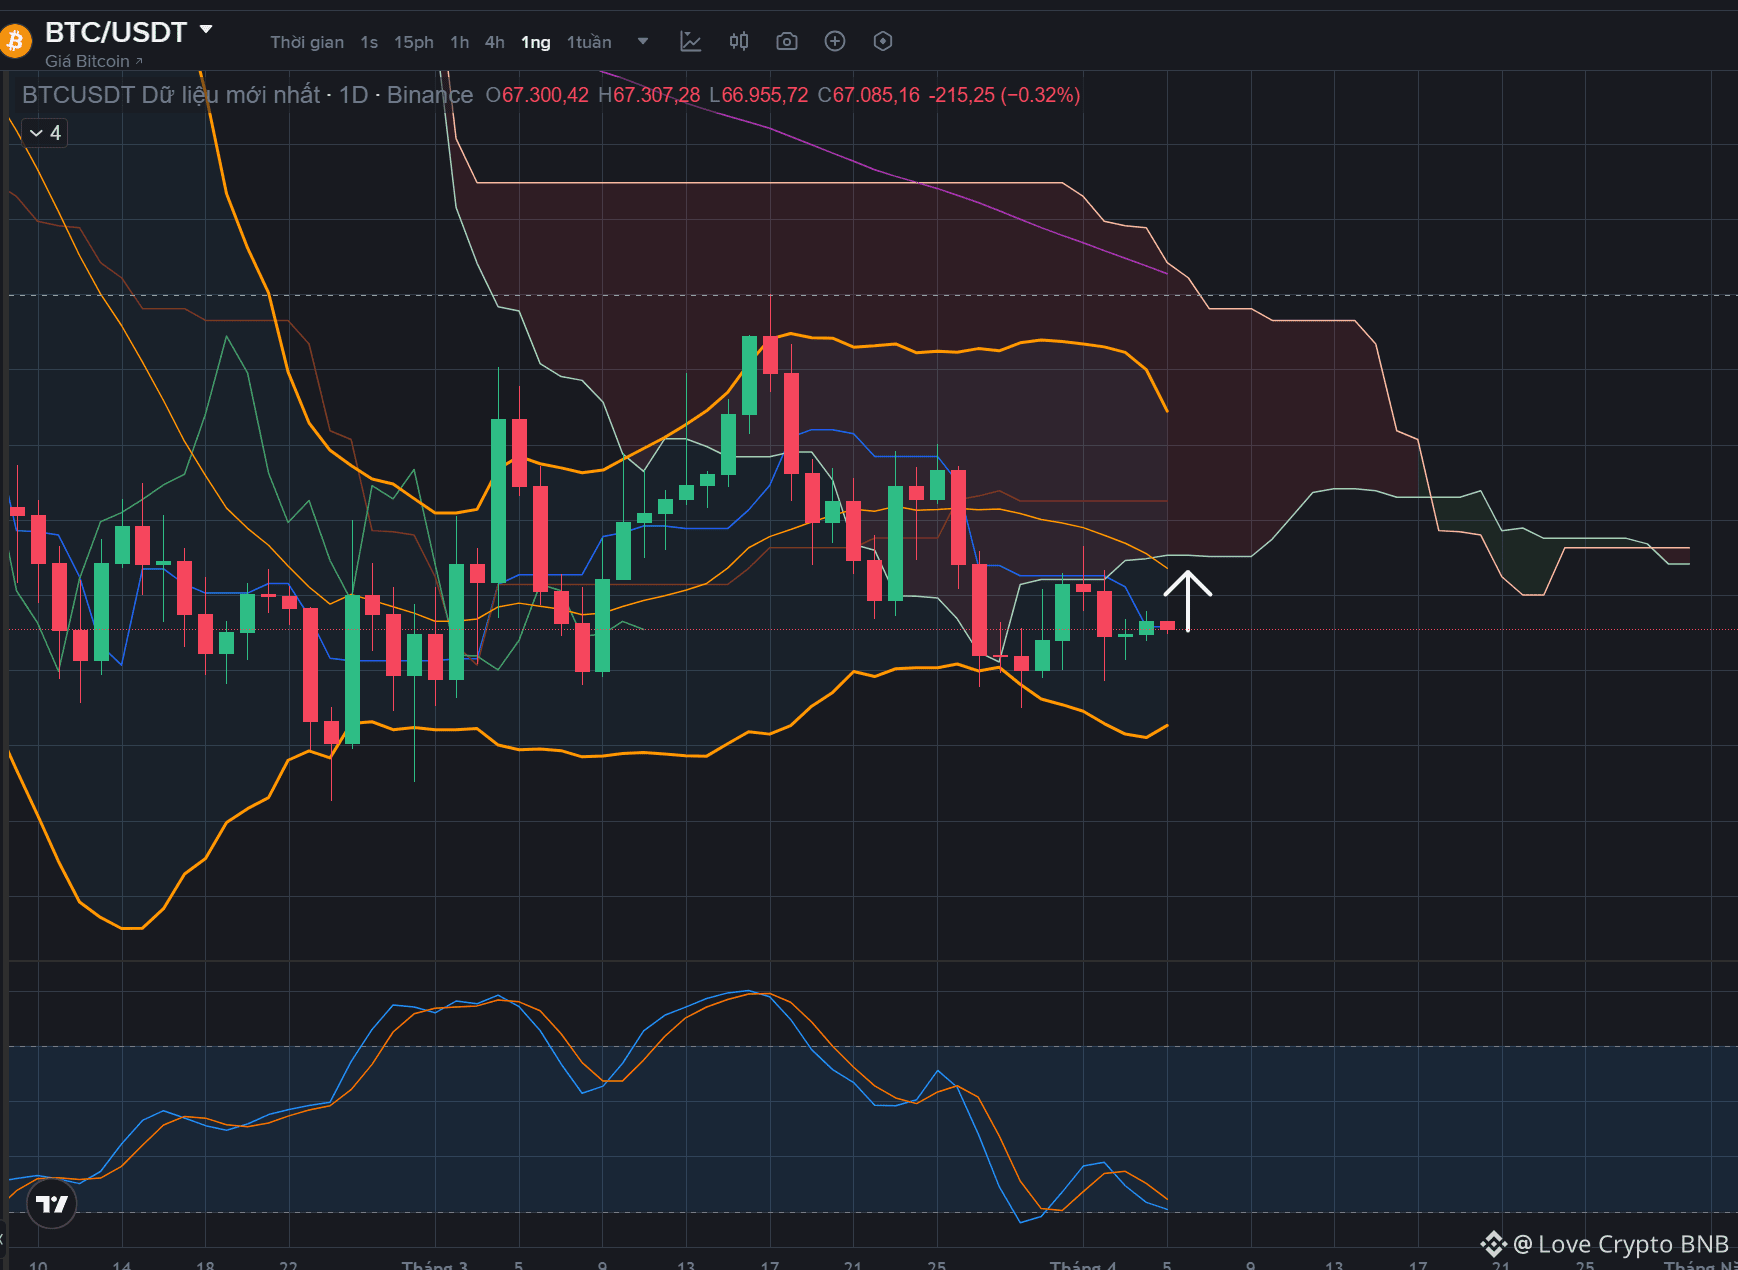
👉 BTC has surpassed the Kijun-Sen line and is trending towards the middle line of the Bollinger Bands and the lower cloud area in the price range of 68-69k
👉 BTC has surpassed the Kijun-Sen line and is trending towards the middle line of the Bollinger Bands and the lower cloud area in the price range of 68-69k
⚠️ 3. Potential Development: Bearish Continuation (continuing decrease)
Because:
The previous trend was down from 76K
The triangle is often a continuation pattern
👉 Probability:
Breakdown > Light breakout
🔥 4. Fake breakout is very likely to occur
This is an extremely easy phase to get "trapped":
Break up → gets pushed down
Break down → gets pulled up
👉 Because:
Low liquidity
Whales are "sweeping liquidity"
🎯 Main scenario to monitor
🟢 Bullish:
Break above the upper edge of the triangle (~68K–69K)
Retest holds
👉 Target: 72K → 75K
🔴 Bearish:
Break below ~65K
Close daily candle below support
👉 Target: 62K → 60K
🧠 Quick summary
👉 Currently, Bitcoin is:
In an accumulation triangle pattern
Within a large range
Preparing for a strong move
📌 But no direction confirmation yet →
This is the "waiting for signal" area, not an all-in area
Because:
The previous trend was down from 76K
The triangle is often a continuation pattern
👉 Probability:
Breakdown > Light breakout
🔥 4. Fake breakout is very likely to occur
This is an extremely easy phase to get "trapped":
Break up → gets pushed down
Break down → gets pulled up
👉 Because:
Low liquidity
Whales are "sweeping liquidity"
🎯 Main scenario to monitor
🟢 Bullish:
Break above the upper edge of the triangle (~68K–69K)
Retest holds
👉 Target: 72K → 75K
🔴 Bearish:
Break below ~65K
Close daily candle below support
👉 Target: 62K → 60K
🧠 Quick summary
👉 Currently, Bitcoin is:
In an accumulation triangle pattern
Within a large range
Preparing for a strong move
📌 But no direction confirmation yet →
This is the "waiting for signal" area, not an all-in area
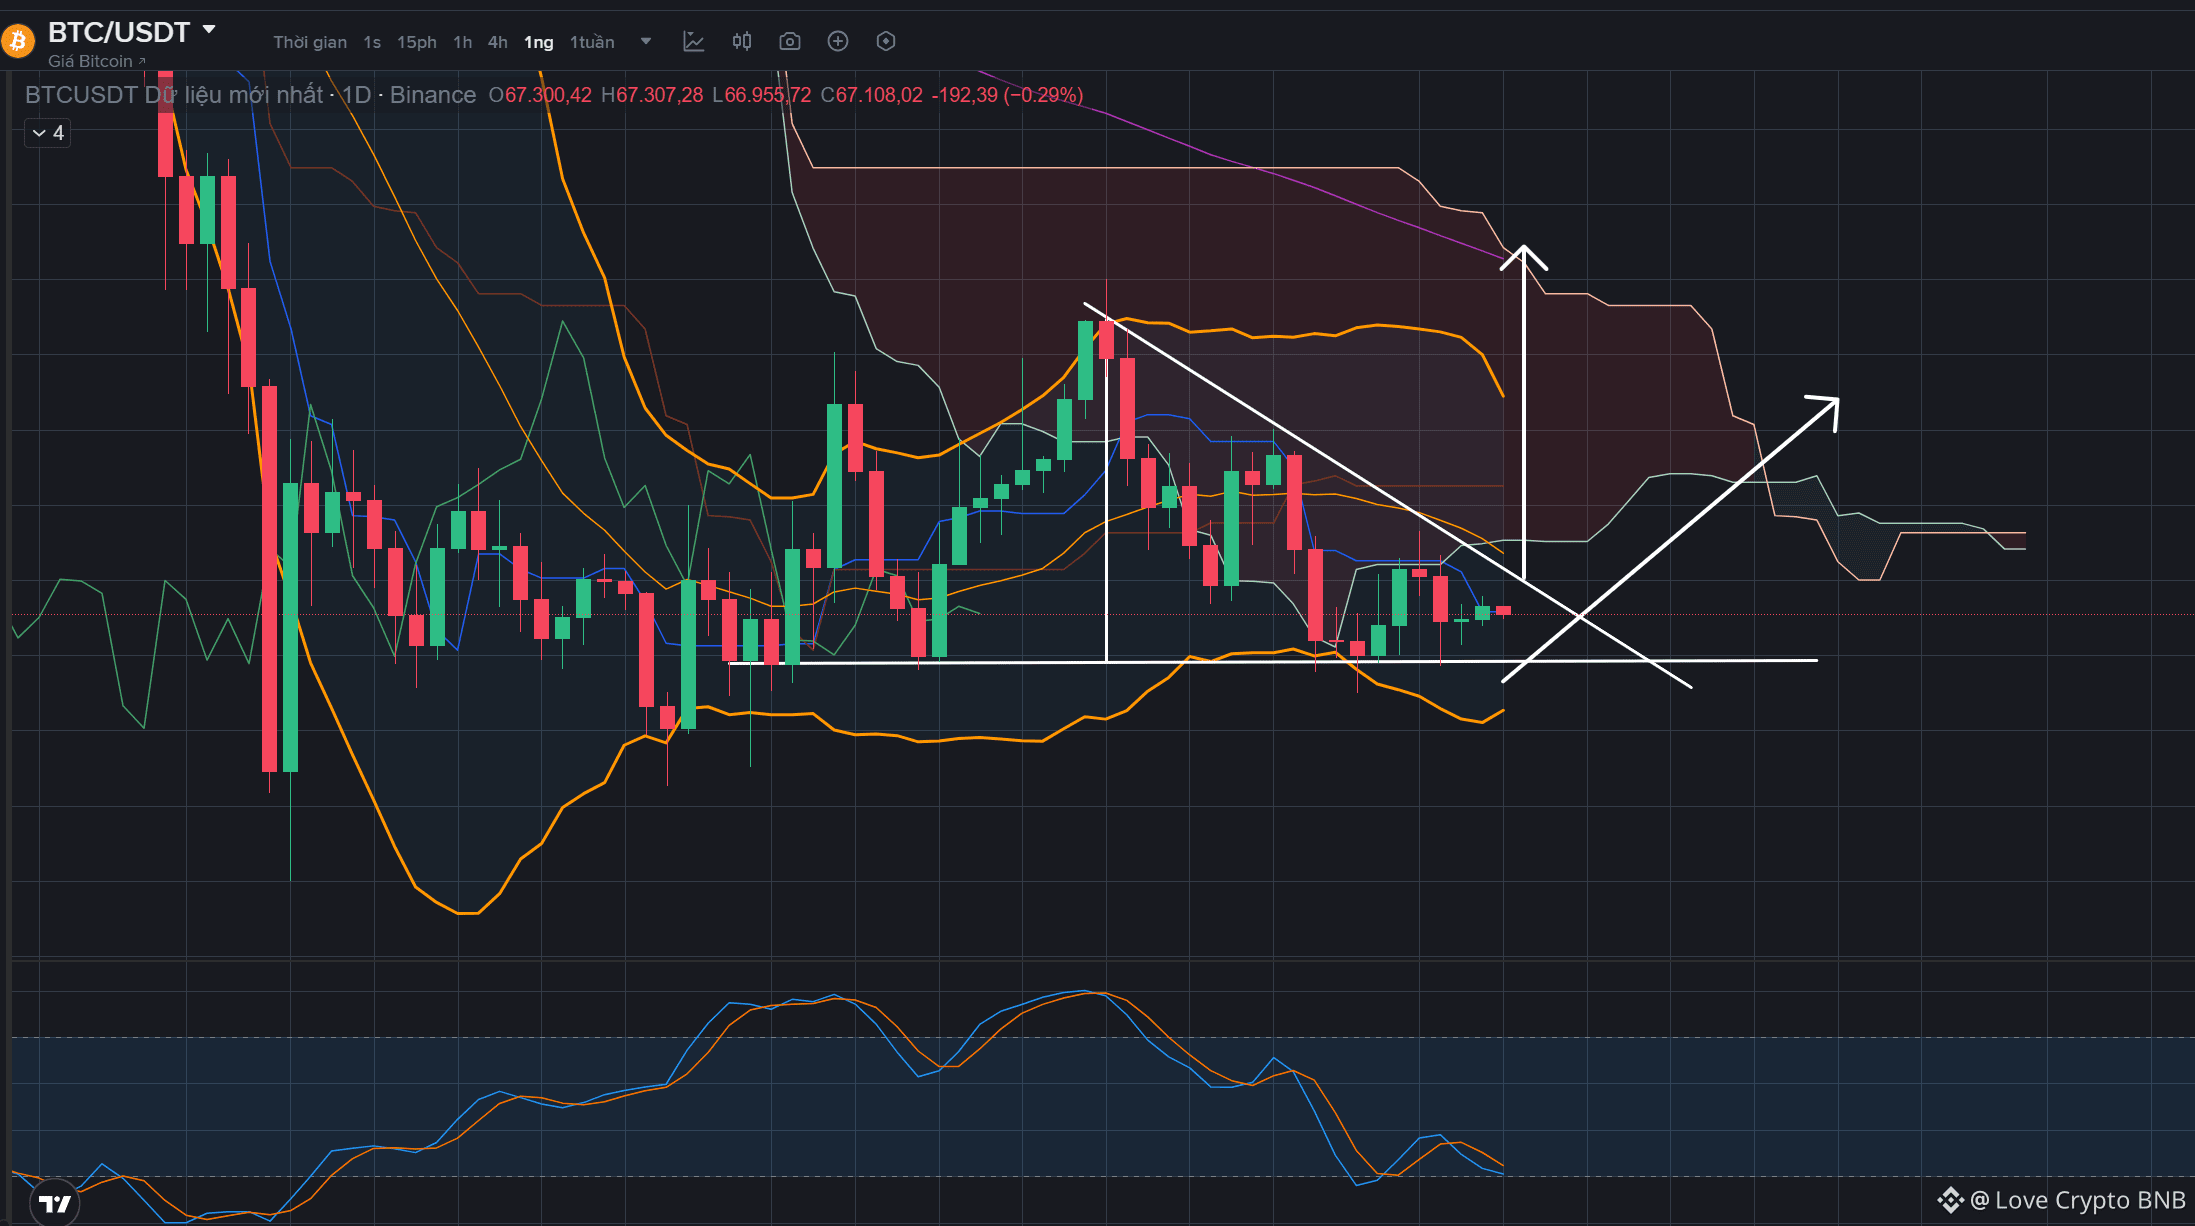
📊 1. Main model: Accumulation triangle (Symmetrical Triangle)
👉 Price is:
Creating lower highs
Creating higher lows
📌 This is a characteristic of the squeeze model → preparing for a strong breakout
🧠 Meaning:
The market is "compressing force"
Neither the long nor short side has won yet
Break in which direction → go strongly in that direction
📉 2. Combination: Large range (Sideway box)
Parallel to the small triangle, BTC is still within a large range:
Resistance: ~70K – 72K
Support: ~60K – 62K
👉 That is:
The small triangle is inside a large range
👉 Price is:
Creating lower highs
Creating higher lows
📌 This is a characteristic of the squeeze model → preparing for a strong breakout
🧠 Meaning:
The market is "compressing force"
Neither the long nor short side has won yet
Break in which direction → go strongly in that direction
📉 2. Combination: Large range (Sideway box)
Parallel to the small triangle, BTC is still within a large range:
Resistance: ~70K – 72K
Support: ~60K – 62K
👉 That is:
The small triangle is inside a large range
🔮 8. Upcoming scenarios for BTC
🟢 Bullish scenario:
Rapid decline in inflation
FED starts to cut interest rates
Liquidity returns
👉 BTC could:
Break $70K
Aim for a new ATH
🔴 Bearish scenario:
Inflation returns
FED keeps interest rates high
Liquidity is tightened
👉 BTC could:
Fall to $60K or lower
Long-term sideways
🟡 Most likely scenario:
👉 Accumulation sideways
FED has not clearly pivoted
Market waits for signals
👉 BTC oscillates in a wide range
→ This is a “trader market” environment, not a “holder market”
🎯 9. Strategy for traders
In the current context, the best approach is not to guess peaks and troughs, but to:
📌 1. Monitor the FED as you monitor the chart
FOMC meeting
CPI data
Interest rates
👉 These are as important (or more) as technical analysis
📌 2. Trade based on liquidity, not emotions
No FOMO when there is no cash flow
No all-in when the market trend is unclear
📌 3. Prioritize capital management
Keep position size reasonable
Always have a stop loss
📌 4. Understand that: the market is “difficult”
👉 This is not an easy phase to make money
💬 10. Conclusion
Bitcoin is no longer an “independent” market as before.
👉 It is becoming part of the global financial system.
And that means:
👉 You cannot trade BTC while ignoring the Federal Reserve
📌 In summary:
FED = the liquidity controller
Liquidity = the fuel of BTC
No liquidity → no bull run
🔥 Memorable quote:
👉 “Don’t fight the FED – and don’t trade Bitcoin while forgetting the FED.”
🟢 Bullish scenario:
Rapid decline in inflation
FED starts to cut interest rates
Liquidity returns
👉 BTC could:
Break $70K
Aim for a new ATH
🔴 Bearish scenario:
Inflation returns
FED keeps interest rates high
Liquidity is tightened
👉 BTC could:
Fall to $60K or lower
Long-term sideways
🟡 Most likely scenario:
👉 Accumulation sideways
FED has not clearly pivoted
Market waits for signals
👉 BTC oscillates in a wide range
→ This is a “trader market” environment, not a “holder market”
🎯 9. Strategy for traders
In the current context, the best approach is not to guess peaks and troughs, but to:
📌 1. Monitor the FED as you monitor the chart
FOMC meeting
CPI data
Interest rates
👉 These are as important (or more) as technical analysis
📌 2. Trade based on liquidity, not emotions
No FOMO when there is no cash flow
No all-in when the market trend is unclear
📌 3. Prioritize capital management
Keep position size reasonable
Always have a stop loss
📌 4. Understand that: the market is “difficult”
👉 This is not an easy phase to make money
💬 10. Conclusion
Bitcoin is no longer an “independent” market as before.
👉 It is becoming part of the global financial system.
And that means:
👉 You cannot trade BTC while ignoring the Federal Reserve
📌 In summary:
FED = the liquidity controller
Liquidity = the fuel of BTC
No liquidity → no bull run
🔥 Memorable quote:
👉 “Don’t fight the FED – and don’t trade Bitcoin while forgetting the FED.”
📊 6. Why hasn't BTC been able to “take off”?
Many people ask:
“ETF is available, adoption is increasing, so why hasn't BTC pumped strongly?”
The answer is very simple:
👉 Lack of liquidity.
No matter how good the narrative is:
If there is no new money coming in
Prices will not be able to increase sustainably
📌 ETF helps:
Create long-term demand
Legalize BTC
But:
👉 The FED is the one who decides short-term cash flow.
⚖️ 7. Bitcoin: Digital gold or tech stock?
A big question being debated:
👉 Is Bitcoin “digital gold” or “tech stock”?
Current reality:
BTC has a high correlation with Nasdaq
Reacts strongly to interest rate news
👉 This shows that:
At this moment, BTC is behaving more like a tech stock than gold.
📌 This is very important for traders:
Don’t just look at the crypto chart
Look at macro data as well.
Many people ask:
“ETF is available, adoption is increasing, so why hasn't BTC pumped strongly?”
The answer is very simple:
👉 Lack of liquidity.
No matter how good the narrative is:
If there is no new money coming in
Prices will not be able to increase sustainably
📌 ETF helps:
Create long-term demand
Legalize BTC
But:
👉 The FED is the one who decides short-term cash flow.
⚖️ 7. Bitcoin: Digital gold or tech stock?
A big question being debated:
👉 Is Bitcoin “digital gold” or “tech stock”?
Current reality:
BTC has a high correlation with Nasdaq
Reacts strongly to interest rate news
👉 This shows that:
At this moment, BTC is behaving more like a tech stock than gold.
📌 This is very important for traders:
Don’t just look at the crypto chart
Look at macro data as well.
Log in to explore more content