
李铁锤
228 Posts

李铁锤
Report
Block User
专注于现货二级市场与Web3,所有推文不做投资建议。"Web3世界,每一次变革都是一次财富的重新分配。"
Open Trade

BNB Holder
Frequent Trader
3 Years
62 Following
3.7K+ Followers
609 Liked
Posts
Portfolio
All
Quotes
PINNED
·
--
Quantitative Trading Live Account: @Square-Creator-24751049c538f
📈 Live stream of real trading—sharing the genuine quantitative trading process, no stock-picking/ultimatums, no empty promises.
Live stream content: ✅ Live quantitative trading demonstrations
✅ Strategy development ideas and risk-control logic
✅ Sharing experience in automated trading
✅ Strategy writing / customized services / leasing—exchange and discussion
✅ Online Q&A—feel free to connect and learn
💬 If you don’t understand quant trading, that’s totally fine—welcome to learn together and grow together.
🎁 If you need Binance fee rebates of 40%, want cooperation on quant strategies, or are looking for strategy development/customization/leasing, feel free to message me privately.
If you have any of the above needs, you can also message me directly, or join the group chat on my profile—let’s discuss, learn, and share experiences together
{future}(BTCUSDT)
Quantitative Trading Live Account: @李铁锤AI量化
📈 Live stream of real trading—sharing the genuine quantitative trading process, no stock-picking/ultimatums, no empty promises.
Live stream content: ✅ Live quantitative trading demonstrations
✅ Strategy development ideas and risk-control logic
✅ Sharing experience in automated trading
✅ Strategy writing / customized services / leasing—exchange and discussion
✅ Online Q&A—feel free to connect and learn
💬 If you don’t understand quant trading, that’s totally fine—welcome to learn together and grow together.
🎁 If you need Binance fee rebates of 40%, want cooperation on quant strategies, or are looking for strategy development/customization/leasing, feel free to message me privately.
If you have any of the above needs, you can also message me directly, or join the group chat on my profile—let’s discuss, learn, and share experiences together
📈 Live stream of real trading—sharing the genuine quantitative trading process, no stock-picking/ultimatums, no empty promises.
Live stream content: ✅ Live quantitative trading demonstrations
✅ Strategy development ideas and risk-control logic
✅ Sharing experience in automated trading
✅ Strategy writing / customized services / leasing—exchange and discussion
✅ Online Q&A—feel free to connect and learn
💬 If you don’t understand quant trading, that’s totally fine—welcome to learn together and grow together.
🎁 If you need Binance fee rebates of 40%, want cooperation on quant strategies, or are looking for strategy development/customization/leasing, feel free to message me privately.
If you have any of the above needs, you can also message me directly, or join the group chat on my profile—let’s discuss, learn, and share experiences together

大吉大利!
From 李铁锤
6
112
·
--
【Top 10 Crypto Traders’ Key Takeaways Today|ETH September 21】
The key for ETH at midday isn’t whether to chase—it’s whether you can hold after a breakout.
In the past 24 hours, I only compiled verifiable views; I’m not forcing ten items:
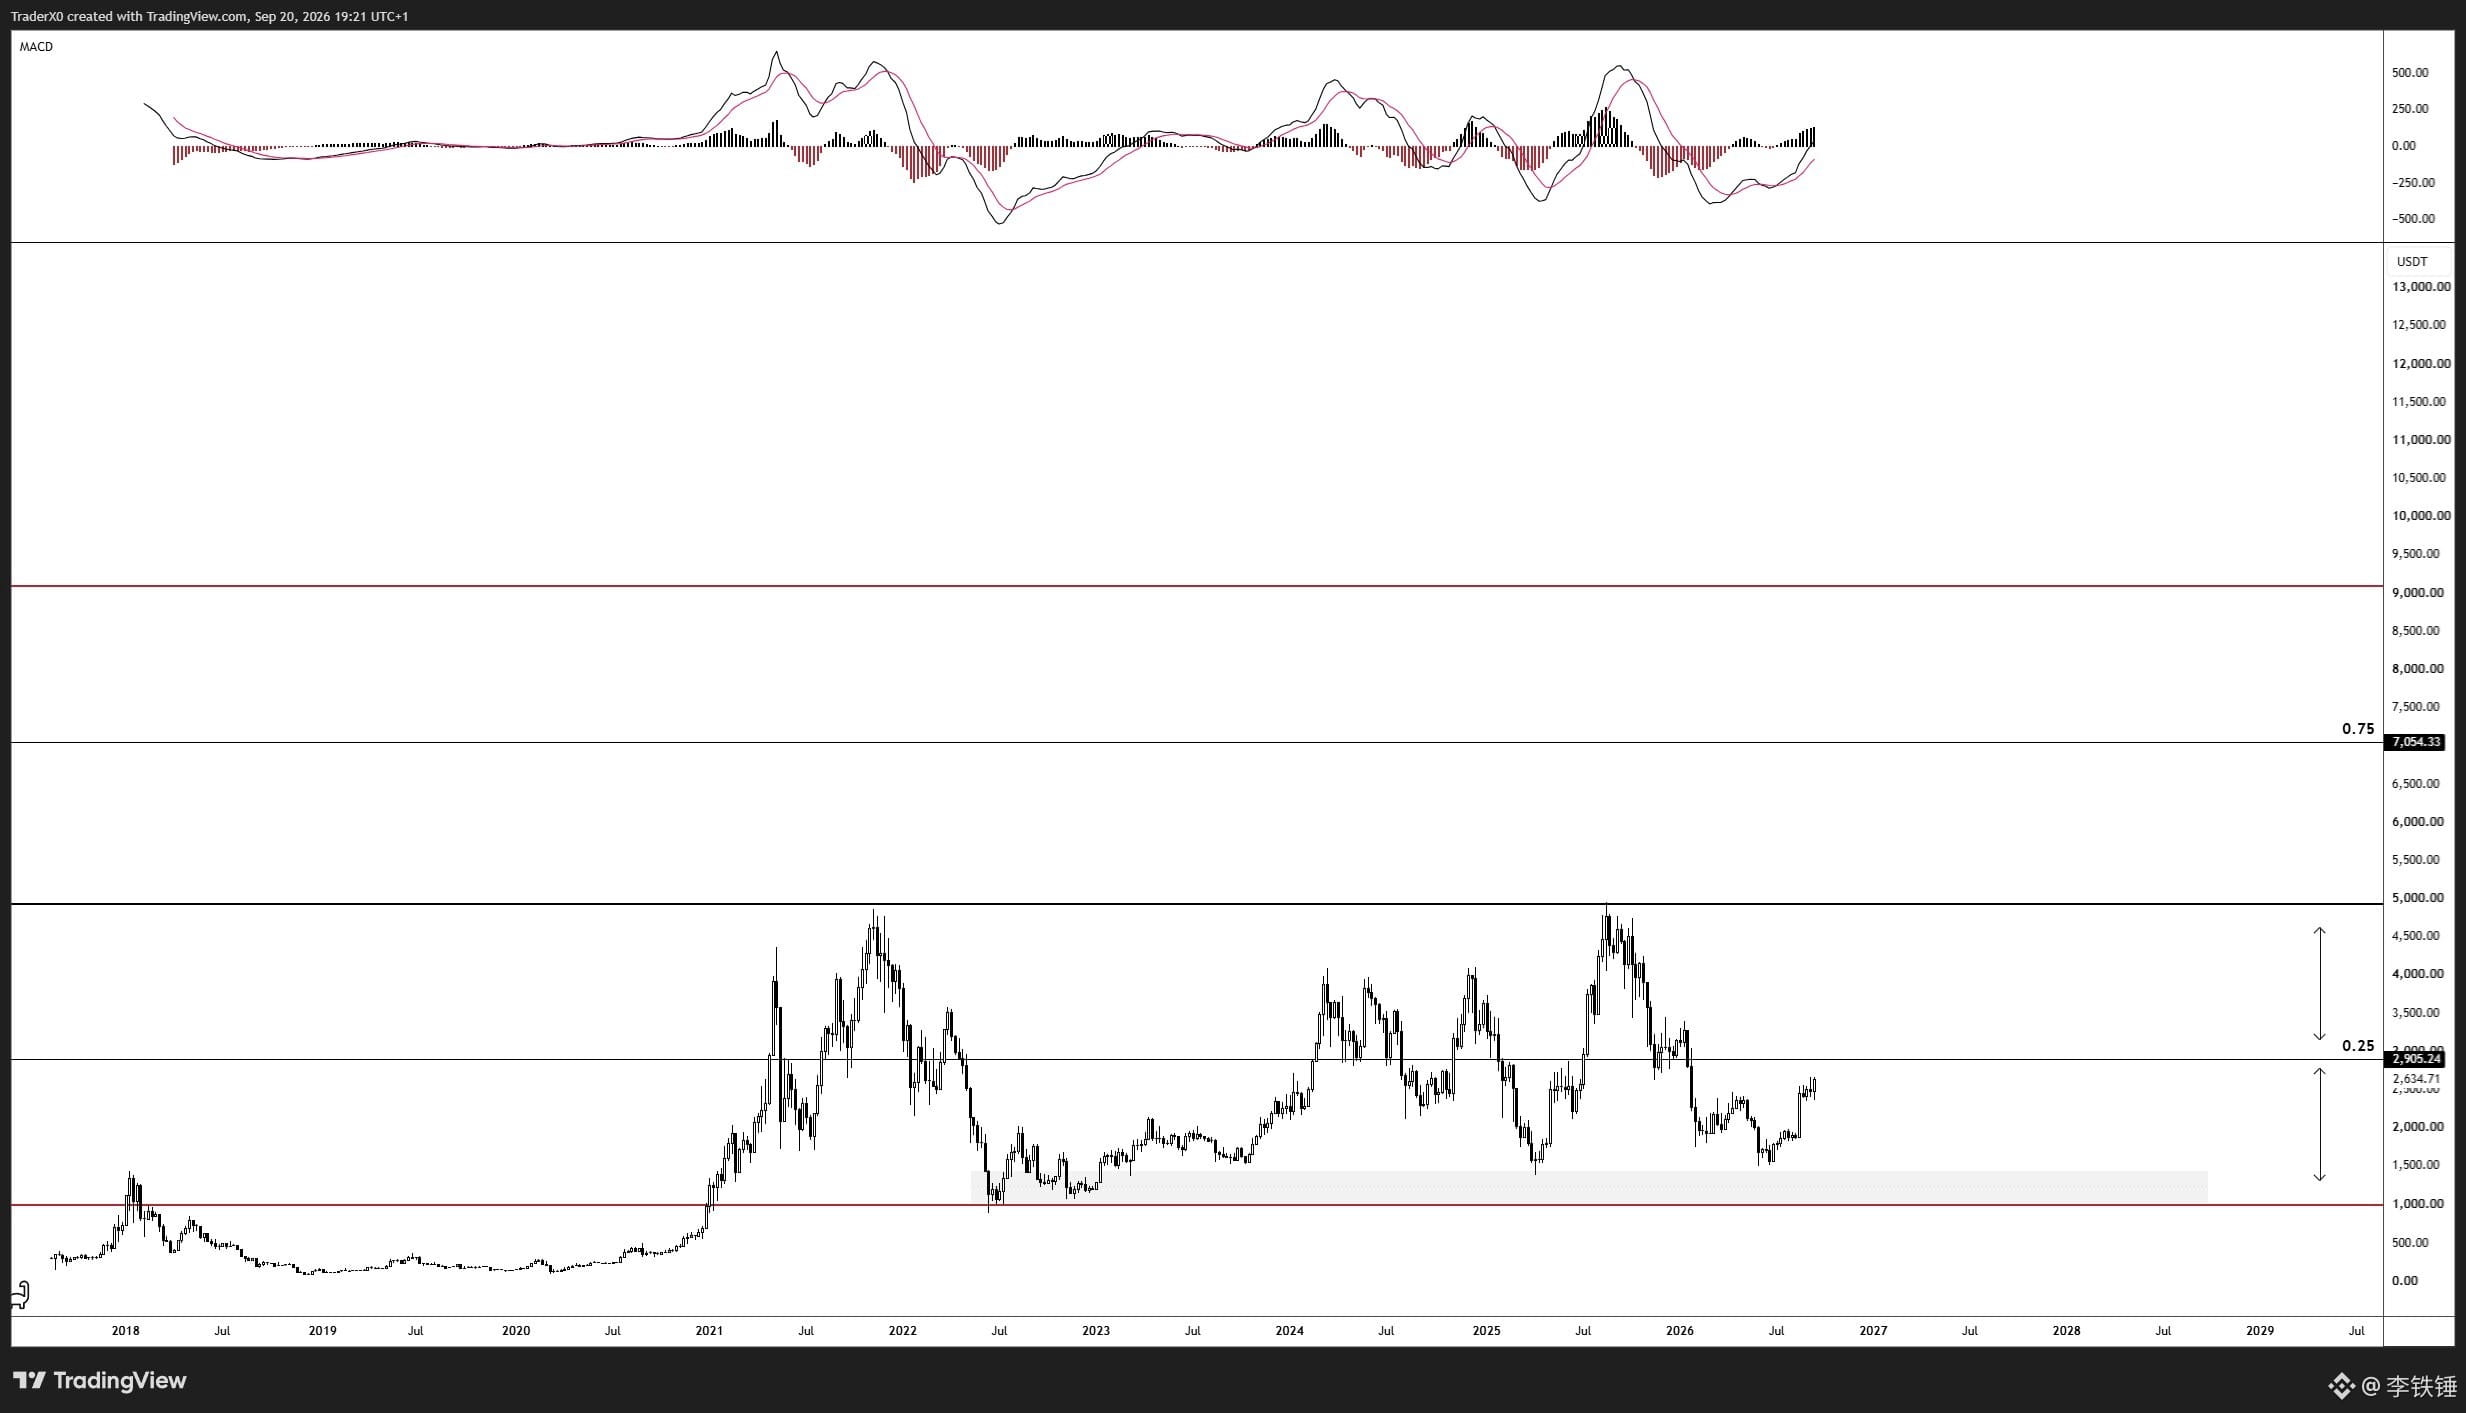
1. Trader XO(@Trader_XO)
Original view: ETH has spent many years in a large range. He tends to treat it as a cycle trade—meaningful pullbacks will continue to increase exposure, while hedging spot around key macro levels.
Editorial projection: This is more like a “buy the pullback / hedge at key levels” approach, not directly chasing a rally. With the current price at 2662, first check whether 2568—2580 can hold.
2. Pentoshi(@Pentosh1)
Original view: ETH made a new high, and the tone is fairly bullish.
Editorial projection: The market is repricing a strong asset, but in execution you still need to wait for confirmation and standing firm—not treat sentiment as a signal.
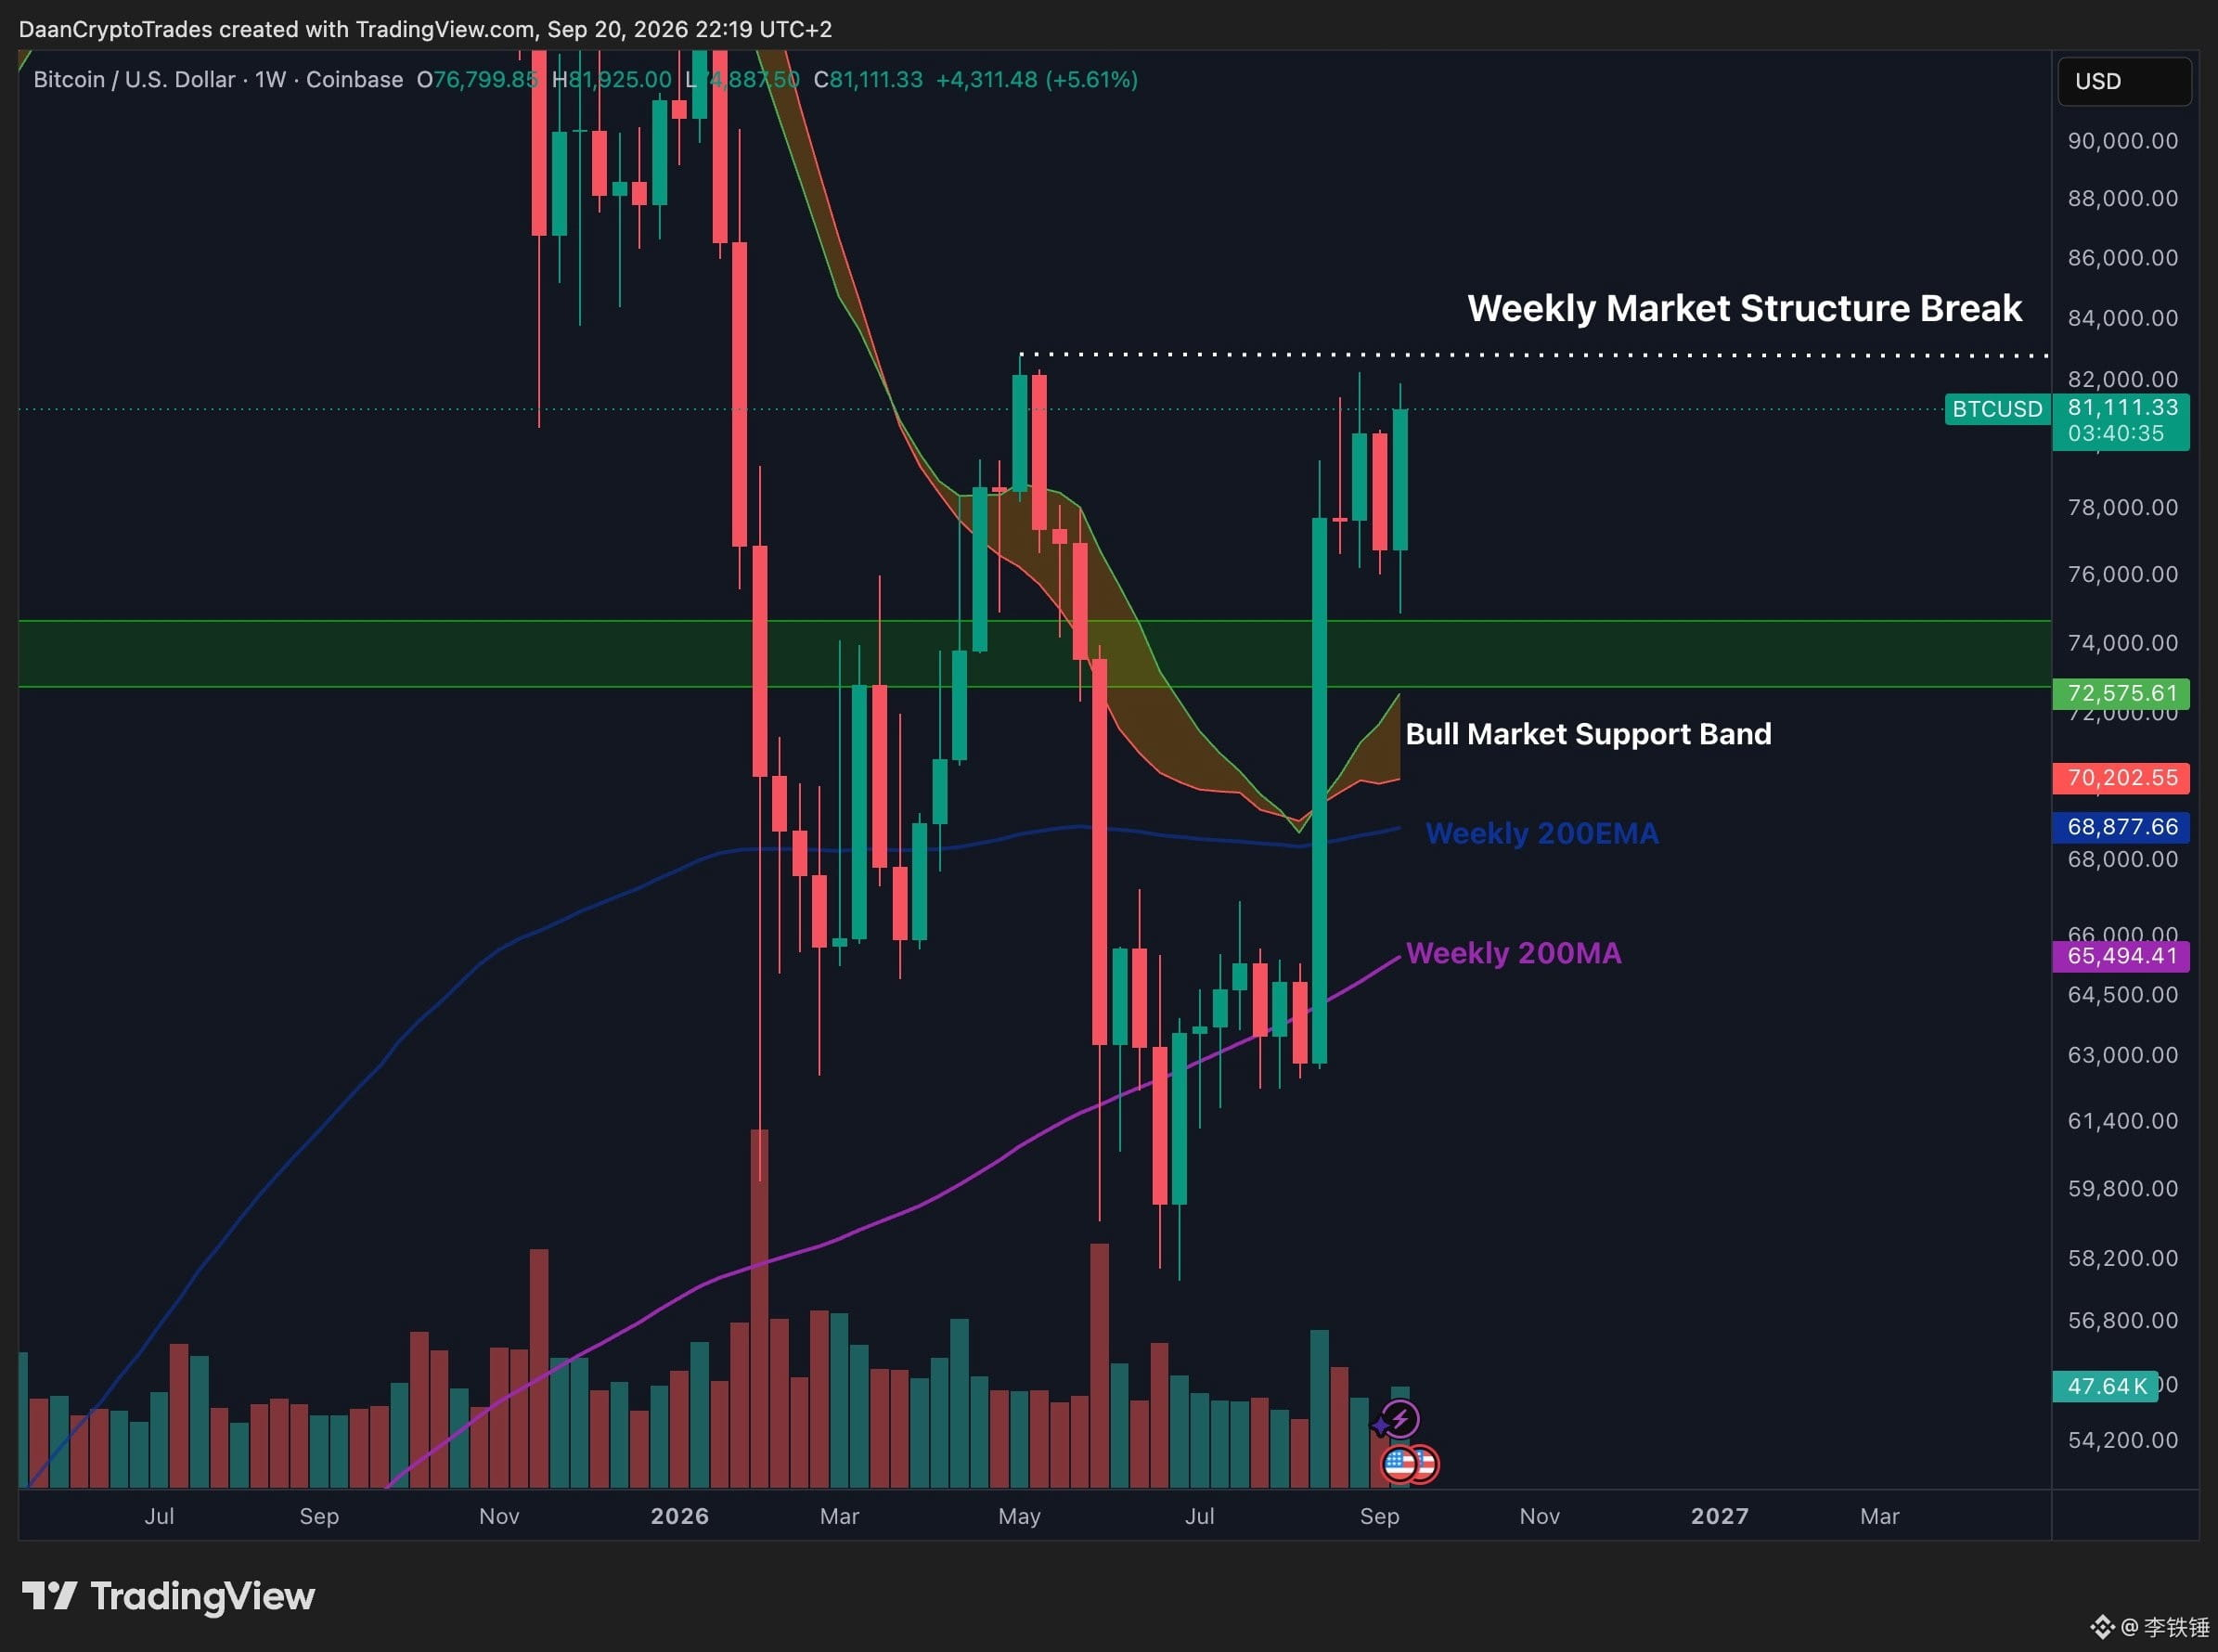
3. Daan Crypto Trades(@DaanCrypto)
Original view: After BTC swept liquidity on the weekly, it engulfed last week’s K-line, but it still needs to break 83,000 to shift the weekly structure more bullish.
Editorial projection: ETH’s upside needs BTC’s risk-on sentiment to cooperate. When BTC is stuck below 83,000, ETH is more likely to trade sideways between 2708—2905.
4. Altcoin Sherpa(@AltcoinSherpa)
Original view: After BTC breaks 83,000, risk appetite should become stronger.
Editorial projection: For ETH, the market’s global risk switch matters more than a single bullish candle.
5. The Flow Horse(@TheFlowHorse)
Original view: Risk management isn’t the sexy part, but without risk management, even the strongest technicals are only a delayed failure.
Editorial projection: This article only gives one route: if ETH holds 2568—2580, then watch again after it reclaims 2708 and consider 2905; if ETH breaks below 2568, the midday long setup is invalid.
Live data: Binance ETHUSDT spot 2662, 24H high 2708 and low 2568. Perpetual funding rate 0.009605%, open interest 2,371,642 ETH.
Risk: This is only a compilation of public views and editorial projections, not a copy-trading signal. Leverage will amplify stop-hunt spikes, slippage, funding fees, and liquidation risk.
Do you think ETH will first consolidate and hold above 2708, or will BTC break through 83000 first?
#BTC #ETH #BNB
【Top 10 Crypto Traders’ Key Takeaways Today|ETH September 21】
The key for ETH at midday isn’t whether to chase—it’s whether you can hold after a breakout.
In the past 24 hours, I only compiled verifiable views; I’m not forcing ten items:
1. Trader XO(@Trader_XO)
Original view: ETH has spent many years in a large range. He tends to treat it as a cycle trade—meaningful pullbacks will continue to increase exposure, while hedging spot around key macro levels.
Editorial projection: This is more like a “buy the pullback / hedge at key levels” approach, not directly chasing a rally. With the current price at 2662, first check whether 2568—2580 can hold.
2. Pentoshi(@Pentosh1)
Original view: ETH made a new high, and the tone is fairly bullish.
Editorial projection: The market is repricing a strong asset, but in execution you still need to wait for confirmation and standing firm—not treat sentiment as a signal.
3. Daan Crypto Trades(@DaanCrypto)
Original view: After BTC swept liquidity on the weekly, it engulfed last week’s K-line, but it still needs to break 83,000 to shift the weekly structure more bullish.
Editorial projection: ETH’s upside needs BTC’s risk-on sentiment to cooperate. When BTC is stuck below 83,000, ETH is more likely to trade sideways between 2708—2905.
4. Altcoin Sherpa(@AltcoinSherpa)
Original view: After BTC breaks 83,000, risk appetite should become stronger.
Editorial projection: For ETH, the market’s global risk switch matters more than a single bullish candle.
5. The Flow Horse(@TheFlowHorse)
Original view: Risk management isn’t the sexy part, but without risk management, even the strongest technicals are only a delayed failure.
Editorial projection: This article only gives one route: if ETH holds 2568—2580, then watch again after it reclaims 2708 and consider 2905; if ETH breaks below 2568, the midday long setup is invalid.
Live data: Binance ETHUSDT spot 2662, 24H high 2708 and low 2568. Perpetual funding rate 0.009605%, open interest 2,371,642 ETH.
Risk: This is only a compilation of public views and editorial projections, not a copy-trading signal. Leverage will amplify stop-hunt spikes, slippage, funding fees, and liquidation risk.
Do you think ETH will first consolidate and hold above 2708, or will BTC break through 83000 first?
#BTC #ETH #BNB
The key for ETH at midday isn’t whether to chase—it’s whether you can hold after a breakout.
In the past 24 hours, I only compiled verifiable views; I’m not forcing ten items:
1. Trader XO(@Trader_XO)
Original view: ETH has spent many years in a large range. He tends to treat it as a cycle trade—meaningful pullbacks will continue to increase exposure, while hedging spot around key macro levels.
Editorial projection: This is more like a “buy the pullback / hedge at key levels” approach, not directly chasing a rally. With the current price at 2662, first check whether 2568—2580 can hold.
2. Pentoshi(@Pentosh1)
Original view: ETH made a new high, and the tone is fairly bullish.
Editorial projection: The market is repricing a strong asset, but in execution you still need to wait for confirmation and standing firm—not treat sentiment as a signal.
3. Daan Crypto Trades(@DaanCrypto)
Original view: After BTC swept liquidity on the weekly, it engulfed last week’s K-line, but it still needs to break 83,000 to shift the weekly structure more bullish.
Editorial projection: ETH’s upside needs BTC’s risk-on sentiment to cooperate. When BTC is stuck below 83,000, ETH is more likely to trade sideways between 2708—2905.
4. Altcoin Sherpa(@AltcoinSherpa)
Original view: After BTC breaks 83,000, risk appetite should become stronger.
Editorial projection: For ETH, the market’s global risk switch matters more than a single bullish candle.
5. The Flow Horse(@TheFlowHorse)
Original view: Risk management isn’t the sexy part, but without risk management, even the strongest technicals are only a delayed failure.
Editorial projection: This article only gives one route: if ETH holds 2568—2580, then watch again after it reclaims 2708 and consider 2905; if ETH breaks below 2568, the midday long setup is invalid.
Live data: Binance ETHUSDT spot 2662, 24H high 2708 and low 2568. Perpetual funding rate 0.009605%, open interest 2,371,642 ETH.
Risk: This is only a compilation of public views and editorial projections, not a copy-trading signal. Leverage will amplify stop-hunt spikes, slippage, funding fees, and liquidation risk.
Do you think ETH will first consolidate and hold above 2708, or will BTC break through 83000 first?
#BTC #ETH #BNB
246
·
--
【Top 10 Crypto Traders’ Highlights Today|BTC September 21】
In the early session, BTC isn’t a mindless chase for longs—the key is still 83,000.
This is a backstop reconstruction: if the past 24 hours weren’t enough to make the “Top 10,” then after expanding by authorization to the past 7 days, there are at least 3 verifiable viewpoints:
1)Daan Crypto Trades(@DaanCrypto,September 21)
Original view: BTC’s weekly chart probes support, sweeps some local liquidity, and then engulfs last week—but it needs to continue pushing up and break through 83,000 for the weekly structure to count as a bullish setup.
Edited analysis: Spot price is about 81,182. It hasn’t entered the confirmation zone yet, so you can’t write the rebound as a certain breakout in advance.
2)Cheds(@BigCheds,September 21)
Original view: BTC is a right-angle broadening wedge; the figure itself emphasizes boundary confirmation.
Edited analysis: This supports “wait for breakout/pullback confirmation,” not chasing orders in the middle of the range.
3)XO(@Trader_XO,September 19)
Original view: BTC’s 82,000—83,000 is the key supply zone. Only after holding above and accepting it will there be a chance to accelerate toward the 90,000 area; if rejected, first watch support at 78,500—79,000.
Edited analysis: The current price is still below 83,000—the main line is waiting for confirmation.
Single main route: 80,000—83,000 first looks like consolidation and building energy; once it effectively holds above 83,000, watch 85,000 next, and then the profit-taking and short-covering near 90,000.
Invalidation conditions: after breaking below 80,000, it can’t quickly reclaim; or after breaking above 83,000, it immediately falls back into the range.
Risk warning: This is the smallest evidence set for the 7-day backstop, not a complete consensus of ten people; the funding rate is still positive—chasing a breakout with high leverage may get caught in a false breakout, suffer slippage, and get swept on pullbacks.
Will you wait for acceptance above 83,000 to confirm, or treat 80,000 as the line dividing long vs. short?
#BTC #ETH #BNB
【Top 10 Crypto Traders’ Highlights Today|BTC September 21】
In the early session, BTC isn’t a mindless chase for longs—the key is still 83,000.
This is a backstop reconstruction: if the past 24 hours weren’t enough to make the “Top 10,” then after expanding by authorization to the past 7 days, there are at least 3 verifiable viewpoints:
1)Daan Crypto Trades(@DaanCrypto,September 21)
Original view: BTC’s weekly chart probes support, sweeps some local liquidity, and then engulfs last week—but it needs to continue pushing up and break through 83,000 for the weekly structure to count as a bullish setup.
Edited analysis: Spot price is about 81,182. It hasn’t entered the confirmation zone yet, so you can’t write the rebound as a certain breakout in advance.
2)Cheds(@BigCheds,September 21)
Original view: BTC is a right-angle broadening wedge; the figure itself emphasizes boundary confirmation.
Edited analysis: This supports “wait for breakout/pullback confirmation,” not chasing orders in the middle of the range.
3)XO(@Trader_XO,September 19)
Original view: BTC’s 82,000—83,000 is the key supply zone. Only after holding above and accepting it will there be a chance to accelerate toward the 90,000 area; if rejected, first watch support at 78,500—79,000.
Edited analysis: The current price is still below 83,000—the main line is waiting for confirmation.
Single main route: 80,000—83,000 first looks like consolidation and building energy; once it effectively holds above 83,000, watch 85,000 next, and then the profit-taking and short-covering near 90,000.
Invalidation conditions: after breaking below 80,000, it can’t quickly reclaim; or after breaking above 83,000, it immediately falls back into the range.
Risk warning: This is the smallest evidence set for the 7-day backstop, not a complete consensus of ten people; the funding rate is still positive—chasing a breakout with high leverage may get caught in a false breakout, suffer slippage, and get swept on pullbacks.
Will you wait for acceptance above 83,000 to confirm, or treat 80,000 as the line dividing long vs. short?
#BTC #ETH #BNB
In the early session, BTC isn’t a mindless chase for longs—the key is still 83,000.
This is a backstop reconstruction: if the past 24 hours weren’t enough to make the “Top 10,” then after expanding by authorization to the past 7 days, there are at least 3 verifiable viewpoints:
1)Daan Crypto Trades(@DaanCrypto,September 21)
Original view: BTC’s weekly chart probes support, sweeps some local liquidity, and then engulfs last week—but it needs to continue pushing up and break through 83,000 for the weekly structure to count as a bullish setup.
Edited analysis: Spot price is about 81,182. It hasn’t entered the confirmation zone yet, so you can’t write the rebound as a certain breakout in advance.
2)Cheds(@BigCheds,September 21)
Original view: BTC is a right-angle broadening wedge; the figure itself emphasizes boundary confirmation.
Edited analysis: This supports “wait for breakout/pullback confirmation,” not chasing orders in the middle of the range.
3)XO(@Trader_XO,September 19)
Original view: BTC’s 82,000—83,000 is the key supply zone. Only after holding above and accepting it will there be a chance to accelerate toward the 90,000 area; if rejected, first watch support at 78,500—79,000.
Edited analysis: The current price is still below 83,000—the main line is waiting for confirmation.
Single main route: 80,000—83,000 first looks like consolidation and building energy; once it effectively holds above 83,000, watch 85,000 next, and then the profit-taking and short-covering near 90,000.
Invalidation conditions: after breaking below 80,000, it can’t quickly reclaim; or after breaking above 83,000, it immediately falls back into the range.
Risk warning: This is the smallest evidence set for the 7-day backstop, not a complete consensus of ten people; the funding rate is still positive—chasing a breakout with high leverage may get caught in a false breakout, suffer slippage, and get swept on pullbacks.
Will you wait for acceptance above 83,000 to confirm, or treat 80,000 as the line dividing long vs. short?
#BTC #ETH #BNB
306
·
--
【Top 10 Crypto Traders’ Highlights Today|BTC Sept 20】
Fallback reconstruction explanation: Over the past 24 hours, within the strict testing window, validation was only stable for 1 direct BTC viewpoint. After expanding to the past 7 days under the permitted rules, we use 3 recent publicly available viewpoints—without pretending to reach ten traders.
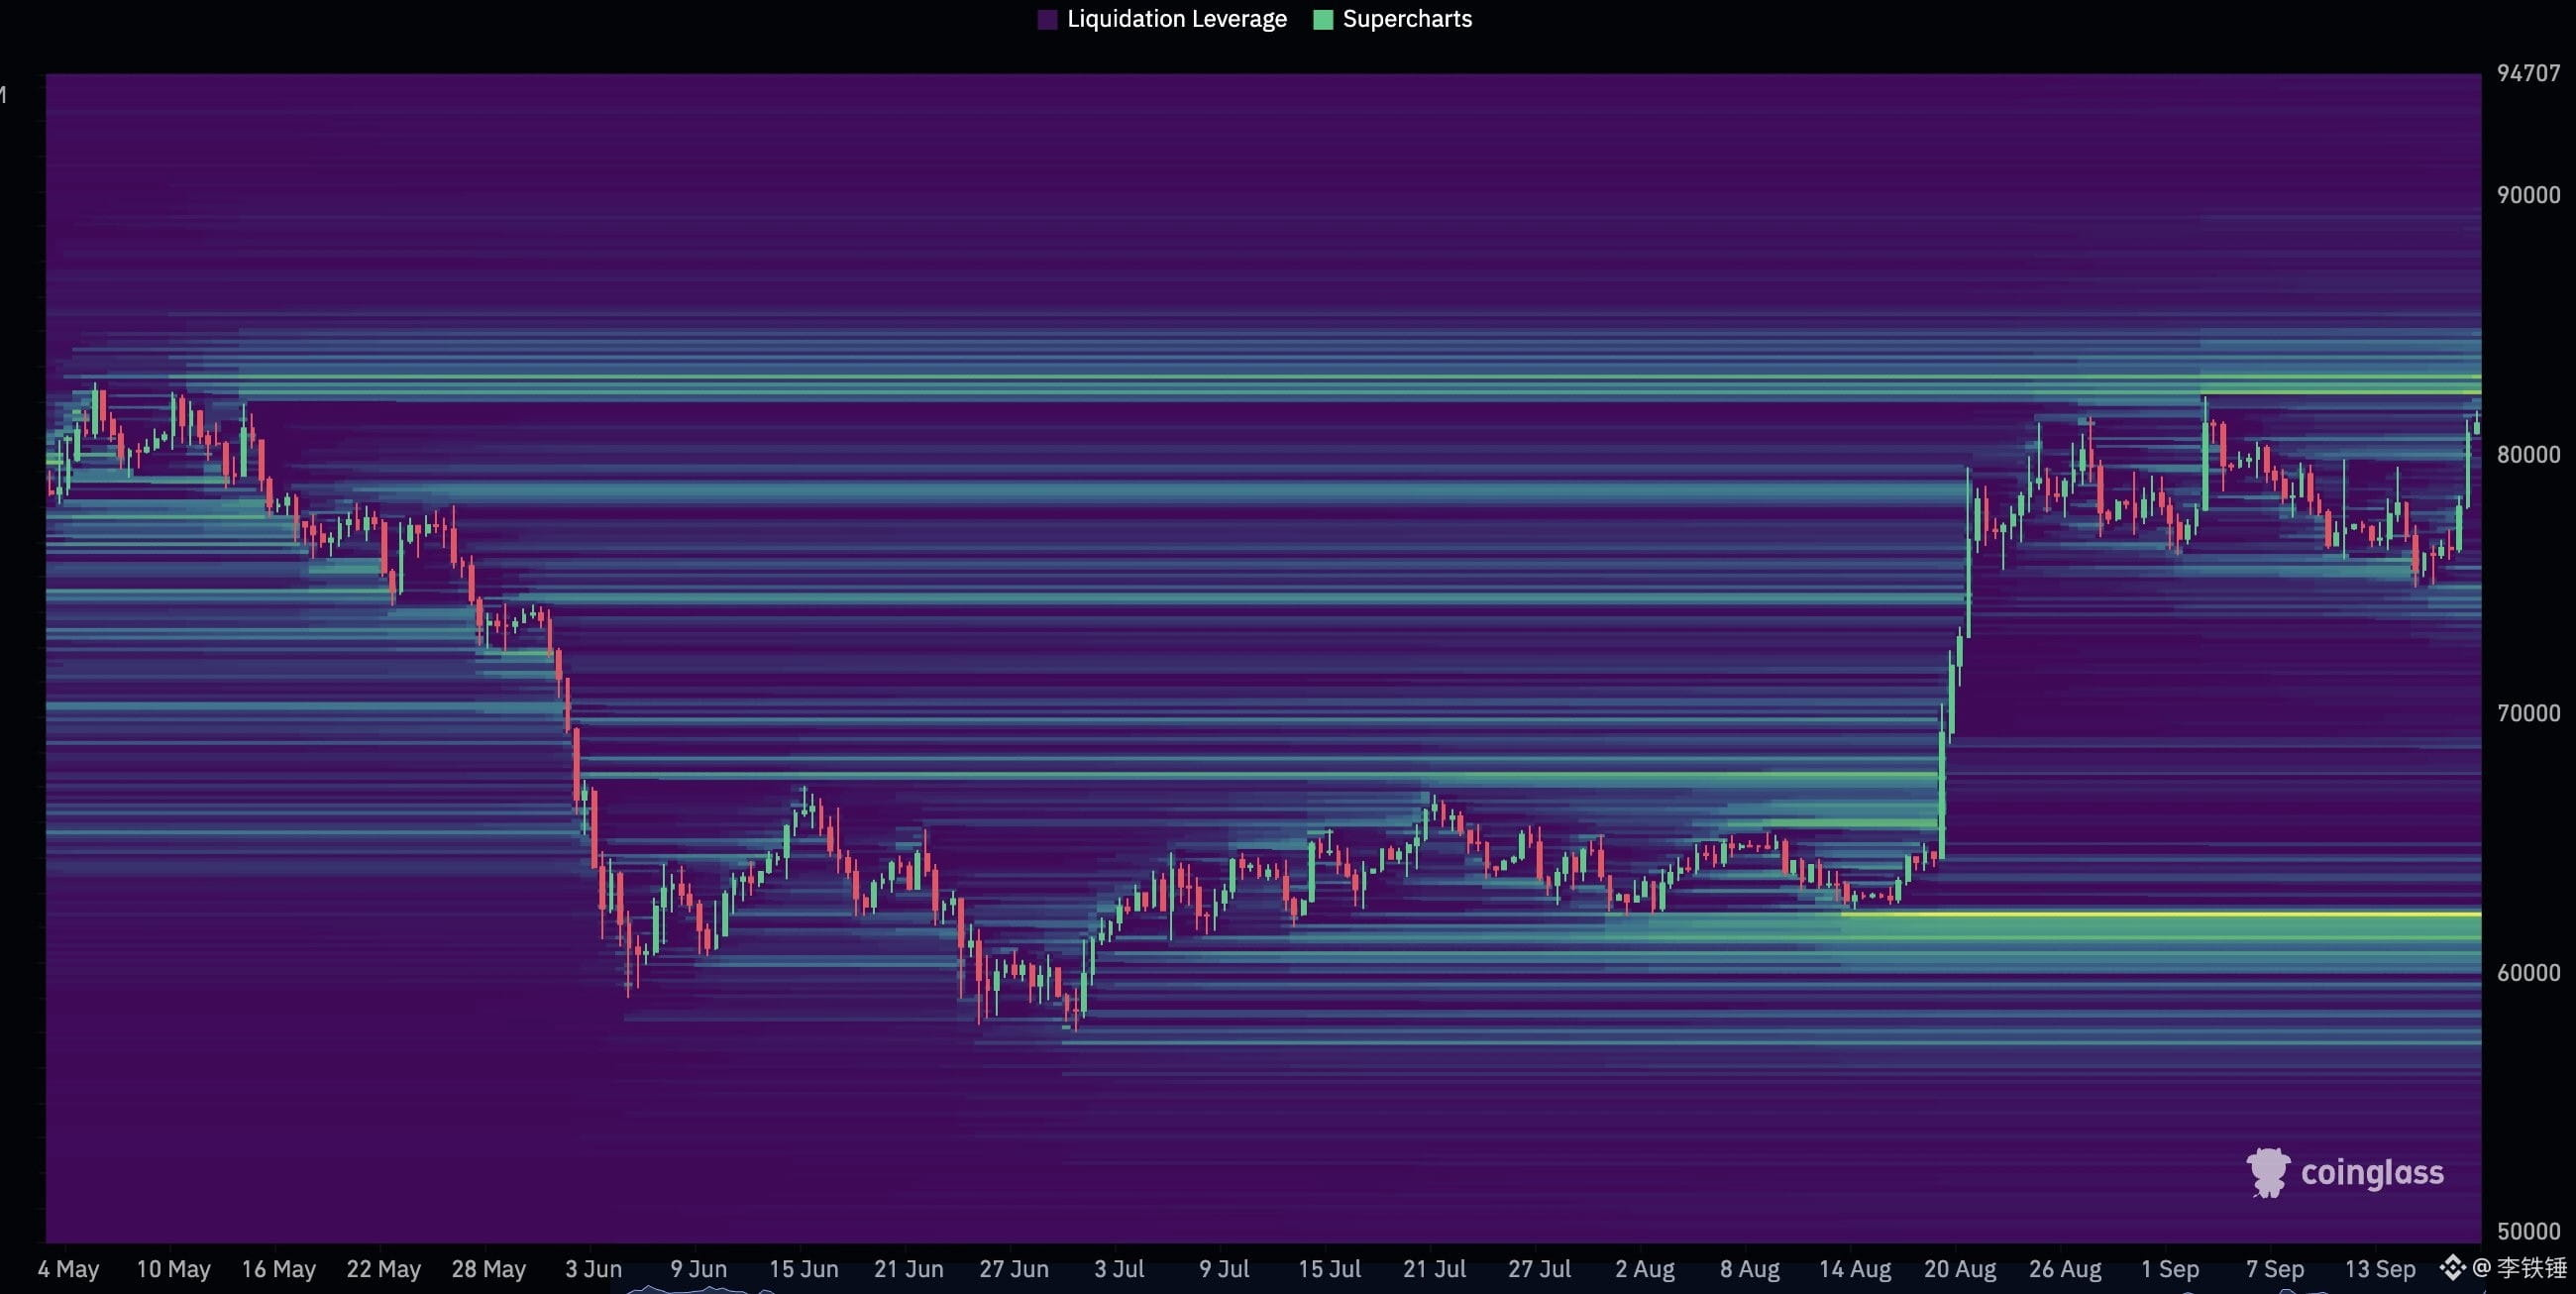
1)Daan Crypto Trades(X:@DaanCrypto)
Original post date: 2026-09-20 04:02 CST.
Original view: After taking out the liquidity above 80000, BTC is nearing the last major liquidity cluster before breaking through the May high. Focus on the potential market-structure breakout above 83000.
Original post: https://x.com/DaanCrypto/status/2101401440686366779
Edited projection: BTC is currently back around 80300. Don’t treat 83000 as the default target. First, see whether 80000—80100 can hold; then see whether BTC can reclaim 81000.
2)TraderSZ(X:@trader1sz)
Original post date: 2026-09-19 06:52 CST.
Original view: “straight to ath next.” The tone is bullish, but it doesn’t provide specific levels, invalidation conditions, or a chart.
Original post: https://x.com/trader1sz/status/2101081885677908328
Edited projection: This can only be used as a sentiment reference. If BTC breaks below 80000, down-weight the bullish sentiment; if it returns to 81000, then combine it with the upper liquidity zone for observation.
3)Pentoshi(X:@Pentosh1)
Original post date: 2026-09-19 06:27 CST.
Original view: After several major coins break out of a month-long consolidation, the base assumption should be continuation.
Original post: https://x.com/Pentosh1/status/2101075678955466982
Edited projection: This is a backdrop of risk appetite, not a BTC-specific level. Only when BTC holds above 81000 can you confirm that the continuation for the majors and the 82000—83000 validation zone reinforce each other.
Live market snapshot: Binance at 18:28 CST shows BTC spot around 80345, 24h high 81951 and low 80126; BTC perpetual around 80319, funding rate 0.0100%, open interest about 109078 BTC.
Single route for tonight: Only if BTC holds 80000—80100 and then reclaims 81000 should you look for rebound validation toward 82000—83000. Reaching that zone does not imply a default breakout—first look for confirmation via increased volume and a pullback.
Invalidation conditions: If it breaks below 80000 and within 30—60 minutes can’t reclaim 80100, the rebound route for this round fails. Priority is to handle it as a pullback after sweeping liquidity.
Risk warning: A compilation of public viewpoints is not investment advice. Contracts and leverage can amplify risks such as funding rate changes, slippage, false breakouts, and liquidation.
#BTC #ETH #BNB
【Top 10 Crypto Traders’ Highlights Today|BTC Sept 20】
Fallback reconstruction explanation: Over the past 24 hours, within the strict testing window, validation was only stable for 1 direct BTC viewpoint. After expanding to the past 7 days under the permitted rules, we use 3 recent publicly available viewpoints—without pretending to reach ten traders.
1)Daan Crypto Trades(X:@DaanCrypto)
Original post date: 2026-09-20 04:02 CST.
Original view: After taking out the liquidity above 80000, BTC is nearing the last major liquidity cluster before breaking through the May high. Focus on the potential market-structure breakout above 83000.
Original post: https://x.com/DaanCrypto/status/2101401440686366779
Edited projection: BTC is currently back around 80300. Don’t treat 83000 as the default target. First, see whether 80000—80100 can hold; then see whether BTC can reclaim 81000.
2)TraderSZ(X:@trader1sz)
Original post date: 2026-09-19 06:52 CST.
Original view: “straight to ath next.” The tone is bullish, but it doesn’t provide specific levels, invalidation conditions, or a chart.
Original post: https://x.com/trader1sz/status/2101081885677908328
Edited projection: This can only be used as a sentiment reference. If BTC breaks below 80000, down-weight the bullish sentiment; if it returns to 81000, then combine it with the upper liquidity zone for observation.
3)Pentoshi(X:@Pentosh1)
Original post date: 2026-09-19 06:27 CST.
Original view: After several major coins break out of a month-long consolidation, the base assumption should be continuation.
Original post: https://x.com/Pentosh1/status/2101075678955466982
Edited projection: This is a backdrop of risk appetite, not a BTC-specific level. Only when BTC holds above 81000 can you confirm that the continuation for the majors and the 82000—83000 validation zone reinforce each other.
Live market snapshot: Binance at 18:28 CST shows BTC spot around 80345, 24h high 81951 and low 80126; BTC perpetual around 80319, funding rate 0.0100%, open interest about 109078 BTC.
Single route for tonight: Only if BTC holds 80000—80100 and then reclaims 81000 should you look for rebound validation toward 82000—83000. Reaching that zone does not imply a default breakout—first look for confirmation via increased volume and a pullback.
Invalidation conditions: If it breaks below 80000 and within 30—60 minutes can’t reclaim 80100, the rebound route for this round fails. Priority is to handle it as a pullback after sweeping liquidity.
Risk warning: A compilation of public viewpoints is not investment advice. Contracts and leverage can amplify risks such as funding rate changes, slippage, false breakouts, and liquidation.
#BTC #ETH #BNB
Fallback reconstruction explanation: Over the past 24 hours, within the strict testing window, validation was only stable for 1 direct BTC viewpoint. After expanding to the past 7 days under the permitted rules, we use 3 recent publicly available viewpoints—without pretending to reach ten traders.
1)Daan Crypto Trades(X:@DaanCrypto)
Original post date: 2026-09-20 04:02 CST.
Original view: After taking out the liquidity above 80000, BTC is nearing the last major liquidity cluster before breaking through the May high. Focus on the potential market-structure breakout above 83000.
Original post: https://x.com/DaanCrypto/status/2101401440686366779
Edited projection: BTC is currently back around 80300. Don’t treat 83000 as the default target. First, see whether 80000—80100 can hold; then see whether BTC can reclaim 81000.
2)TraderSZ(X:@trader1sz)
Original post date: 2026-09-19 06:52 CST.
Original view: “straight to ath next.” The tone is bullish, but it doesn’t provide specific levels, invalidation conditions, or a chart.
Original post: https://x.com/trader1sz/status/2101081885677908328
Edited projection: This can only be used as a sentiment reference. If BTC breaks below 80000, down-weight the bullish sentiment; if it returns to 81000, then combine it with the upper liquidity zone for observation.
3)Pentoshi(X:@Pentosh1)
Original post date: 2026-09-19 06:27 CST.
Original view: After several major coins break out of a month-long consolidation, the base assumption should be continuation.
Original post: https://x.com/Pentosh1/status/2101075678955466982
Edited projection: This is a backdrop of risk appetite, not a BTC-specific level. Only when BTC holds above 81000 can you confirm that the continuation for the majors and the 82000—83000 validation zone reinforce each other.
Live market snapshot: Binance at 18:28 CST shows BTC spot around 80345, 24h high 81951 and low 80126; BTC perpetual around 80319, funding rate 0.0100%, open interest about 109078 BTC.
Single route for tonight: Only if BTC holds 80000—80100 and then reclaims 81000 should you look for rebound validation toward 82000—83000. Reaching that zone does not imply a default breakout—first look for confirmation via increased volume and a pullback.
Invalidation conditions: If it breaks below 80000 and within 30—60 minutes can’t reclaim 80100, the rebound route for this round fails. Priority is to handle it as a pullback after sweeping liquidity.
Risk warning: A compilation of public viewpoints is not investment advice. Contracts and leverage can amplify risks such as funding rate changes, slippage, false breakouts, and liquidation.
#BTC #ETH #BNB
178
·
--
[Top 10 Crypto Traders’ Highlights Today | ETH September 20th]
[Midday ETH: First, see whether 2550 can turn from resistance into support]
In just 7 days, the “backstop” only produced 2 verifiable, recent ETH viewpoints—without packaging it as “Top 10.”
1)Daan Crypto Trades (X: @DaanCrypto, original post 2026-09-17): The original view was that ETH is still in the 2350—2550 range, and the direction depends on whether the daily chart achieves a valid breakout or breakdown. Edited with the 2026-09-20 11:36 CST market snapshot: ETH is around 2584. The main path is to hold 2550 and then look for 2668; if it falls back below 2550, treat it first as a false breakout.
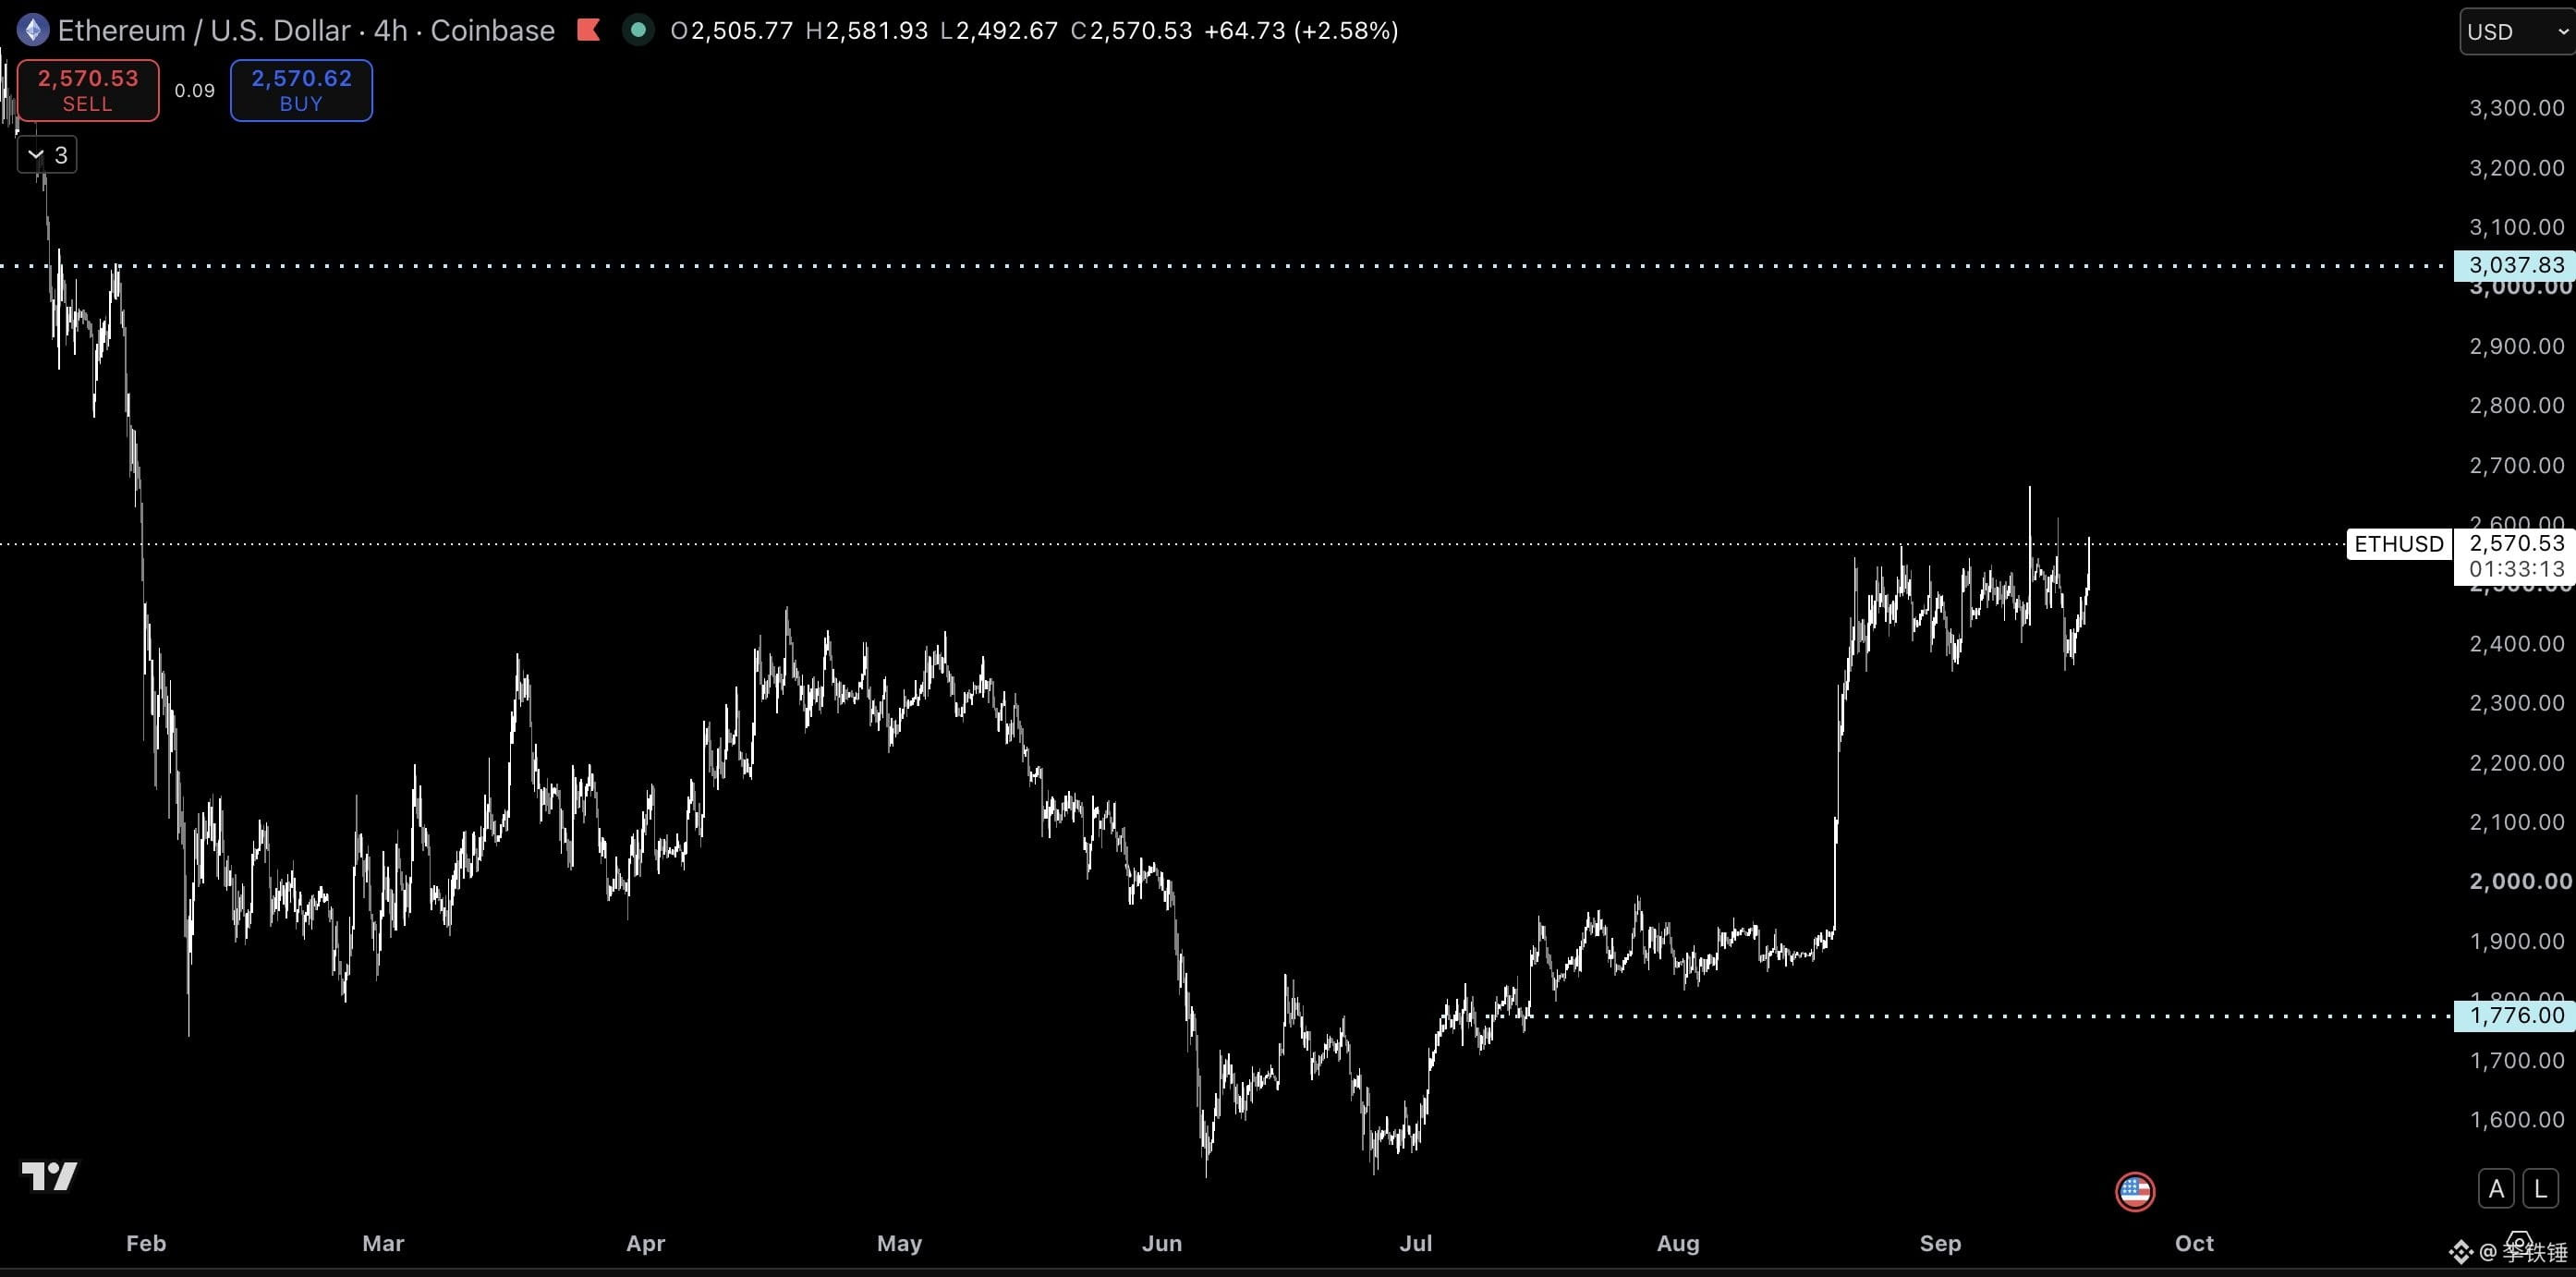
2)Pentoshi (X: @Pentosh1, original post 2026-09-18): The original view said that after consolidation, ETH still has a chance of 3000—3200, and it came with an ETH/USD 4-hour candlestick chart. Editor’s projection: only if it holds above 2668 should we talk about 3000—3200; if it breaks down below 2500, the bullish path is invalid.
This is not trade-calling. With leverage, watch funding rates, wicks/blowouts, slippage, and liquidation risk. #BTC #ETH #BNB
[Top 10 Crypto Traders’ Highlights Today | ETH September 20th]
[Midday ETH: First, see whether 2550 can turn from resistance into support]
In just 7 days, the “backstop” only produced 2 verifiable, recent ETH viewpoints—without packaging it as “Top 10.”
1)Daan Crypto Trades (X: @DaanCrypto, original post 2026-09-17): The original view was that ETH is still in the 2350—2550 range, and the direction depends on whether the daily chart achieves a valid breakout or breakdown. Edited with the 2026-09-20 11:36 CST market snapshot: ETH is around 2584. The main path is to hold 2550 and then look for 2668; if it falls back below 2550, treat it first as a false breakout.
2)Pentoshi (X: @Pentosh1, original post 2026-09-18): The original view said that after consolidation, ETH still has a chance of 3000—3200, and it came with an ETH/USD 4-hour candlestick chart. Editor’s projection: only if it holds above 2668 should we talk about 3000—3200; if it breaks down below 2500, the bullish path is invalid.
This is not trade-calling. With leverage, watch funding rates, wicks/blowouts, slippage, and liquidation risk. #BTC #ETH #BNB
[Midday ETH: First, see whether 2550 can turn from resistance into support]
In just 7 days, the “backstop” only produced 2 verifiable, recent ETH viewpoints—without packaging it as “Top 10.”
1)Daan Crypto Trades (X: @DaanCrypto, original post 2026-09-17): The original view was that ETH is still in the 2350—2550 range, and the direction depends on whether the daily chart achieves a valid breakout or breakdown. Edited with the 2026-09-20 11:36 CST market snapshot: ETH is around 2584. The main path is to hold 2550 and then look for 2668; if it falls back below 2550, treat it first as a false breakout.
2)Pentoshi (X: @Pentosh1, original post 2026-09-18): The original view said that after consolidation, ETH still has a chance of 3000—3200, and it came with an ETH/USD 4-hour candlestick chart. Editor’s projection: only if it holds above 2668 should we talk about 3000—3200; if it breaks down below 2500, the bullish path is invalid.
This is not trade-calling. With leverage, watch funding rates, wicks/blowouts, slippage, and liquidation risk. #BTC #ETH #BNB
149
·
--
【Top 10 Crypto Traders to Watch Today|BTC September 20】
Today, the key for BTC is not “whether it has already broken out,” but whether the market can accept price above 83,000.
In this 24-hour cycle, only 3 verifiable BTC takes were included—no need to force it to ten:
1. Daan Crypto Trades(@DaanCrypto)
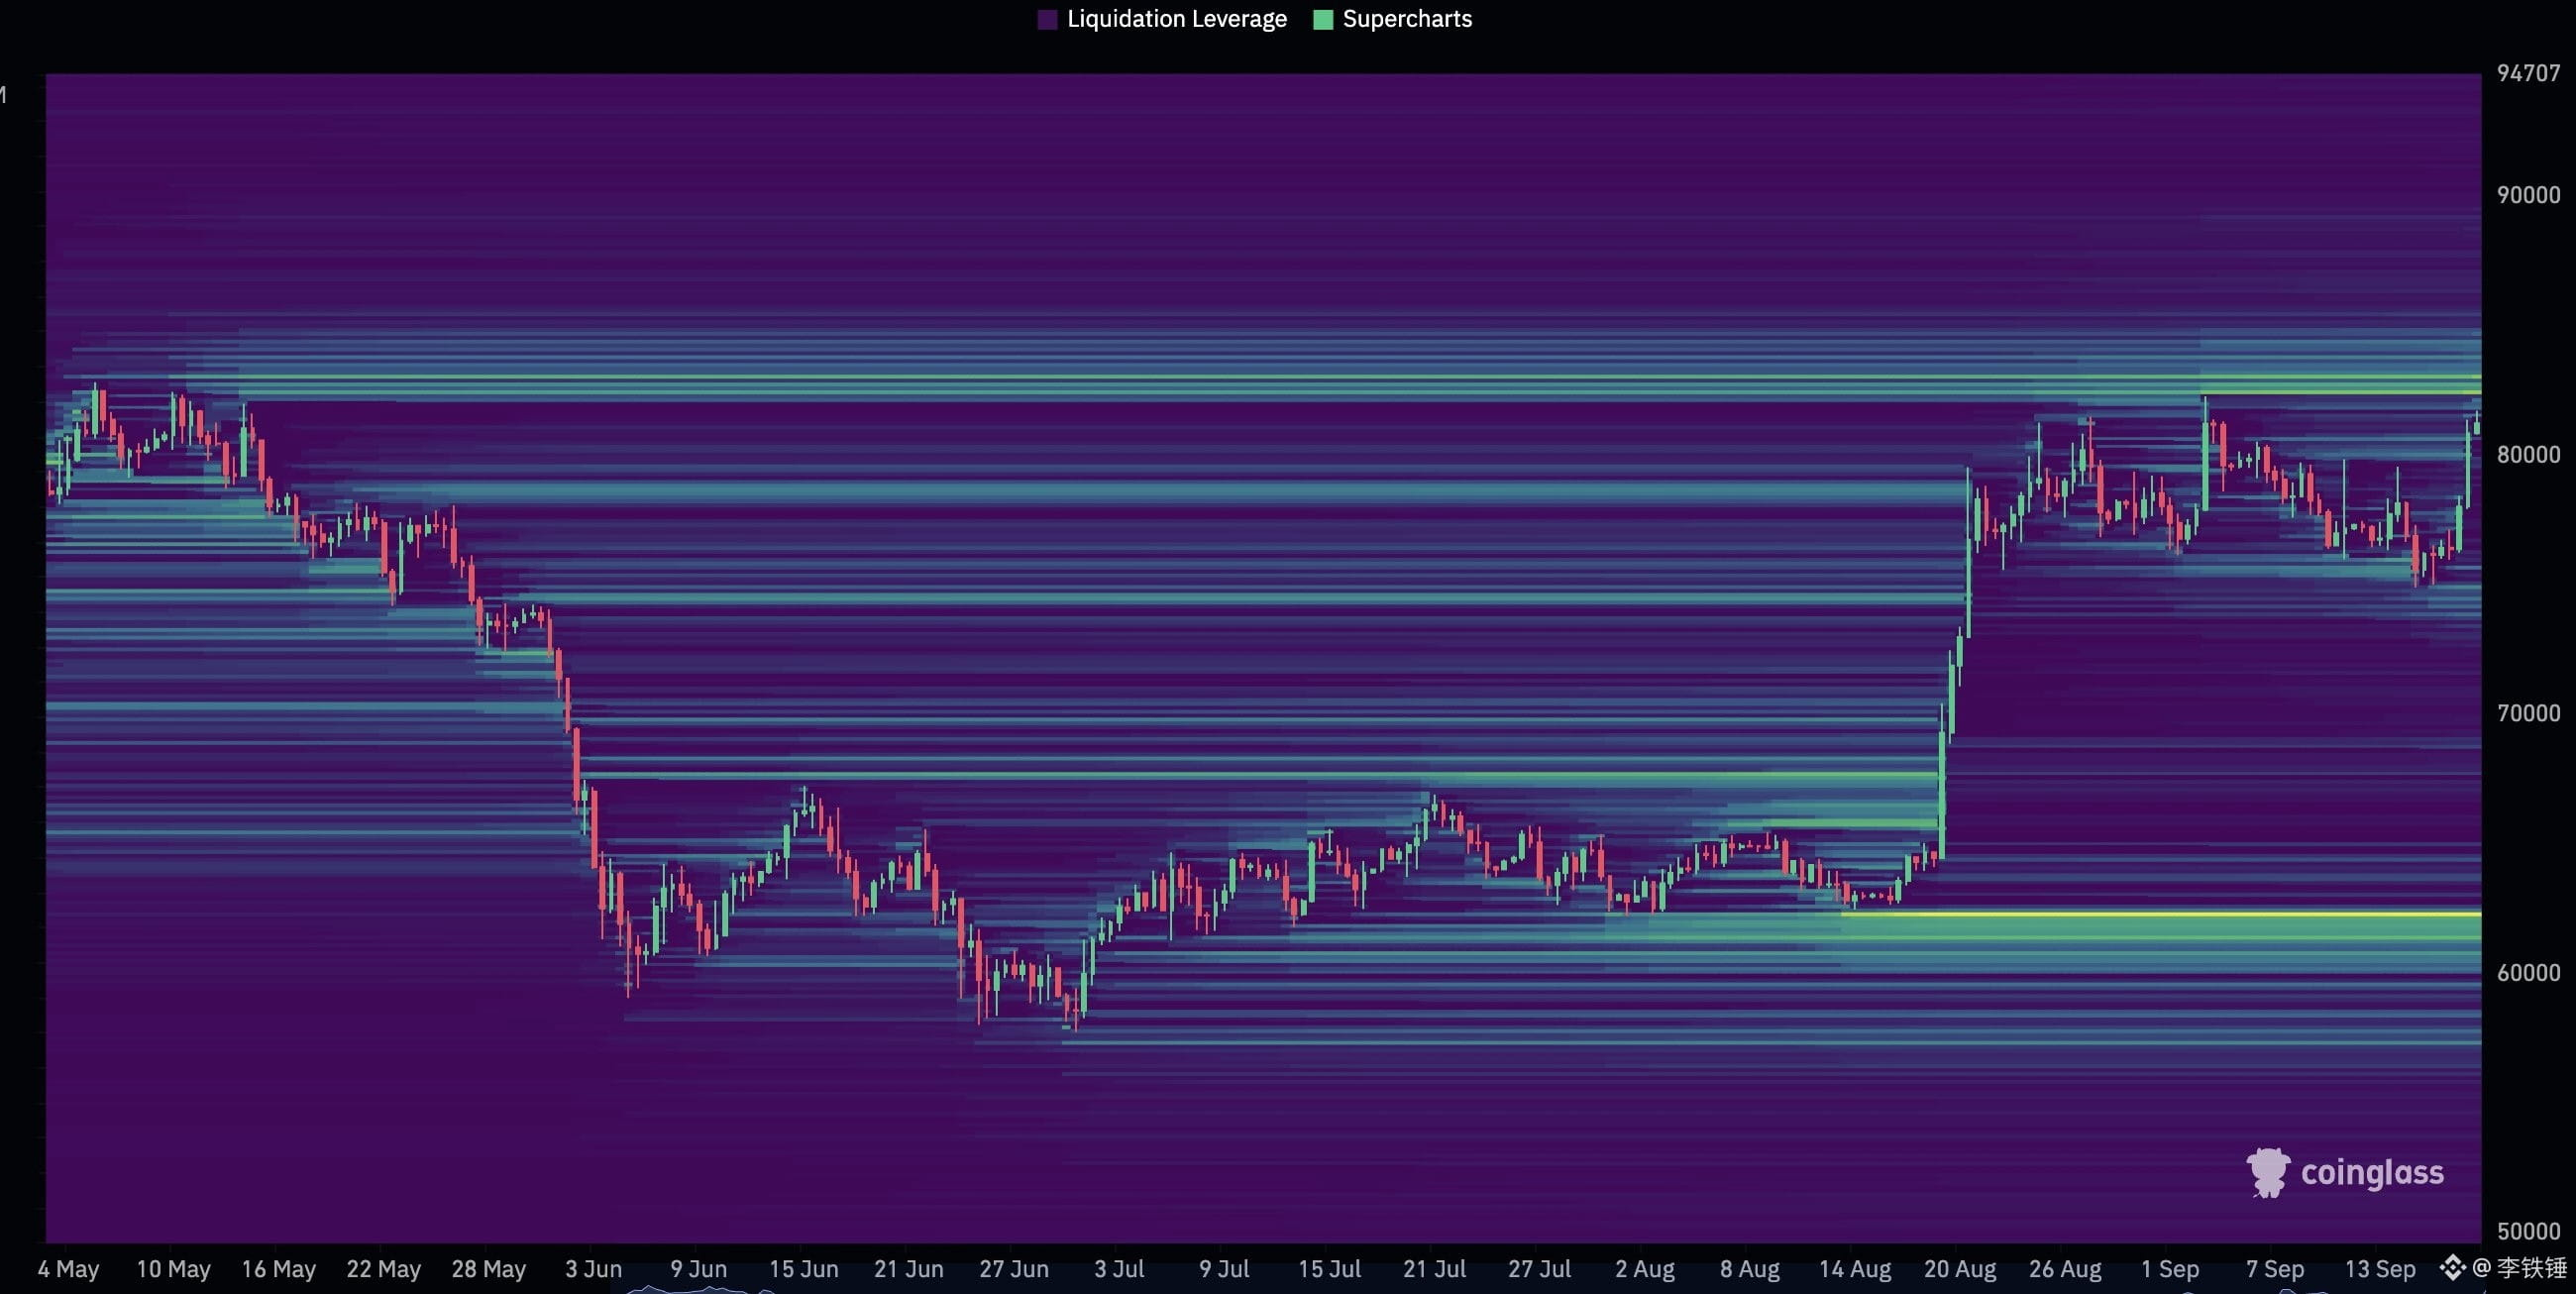
Original view: After BTC takes out 80,000, it’s approaching the final large block of liquidity just before a breakout above the May high; watch for a market-structure breakout above 83,000.
Editor’s rundown: Spot is around 81,261 and hasn’t yet closed above 83,000. The focus is to wait for trades above that level and a confirmation pullback—this is not an announcement that the breakout is already complete.
2. Cheds(@BigCheds)
Original view: BTC is trying to locally break above the 81,500 area, while the larger range breakout level is above 83,000.
Editor’s rundown: This aligns with Daan’s observation, suggesting that 83,000 is the level both bulls and bears are watching today.
3. Trader XO(@Trader_XO)
Original view: 82,000—83,000 is the key zone. If it breaks through supply and is accepted above the 365-day rolling VWAP, it could target around 90,000; if rejected, 78,500—79,000 must be defended first.
Editor’s rundown: Today only gives one route—after holding above 83,000, then look toward 90,000. If it breaks below 78,500—79,000, the bullish intraday scenario fails.
Risks: Around 83,000, fake breakouts are easy. Before anything else, consider stop-loss, slippage, funding rate, and liquidation price with contract leverage. This is a compilation of views—not trading follow recommendations.
Now, do you want to wait for confirmation above 83,000, or wait for a pullback to 78,500—79,000?
#BTC #ETH #BNB
【Top 10 Crypto Traders to Watch Today|BTC September 20】
Today, the key for BTC is not “whether it has already broken out,” but whether the market can accept price above 83,000.
In this 24-hour cycle, only 3 verifiable BTC takes were included—no need to force it to ten:
1. Daan Crypto Trades(@DaanCrypto)
Original view: After BTC takes out 80,000, it’s approaching the final large block of liquidity just before a breakout above the May high; watch for a market-structure breakout above 83,000.
Editor’s rundown: Spot is around 81,261 and hasn’t yet closed above 83,000. The focus is to wait for trades above that level and a confirmation pullback—this is not an announcement that the breakout is already complete.
2. Cheds(@BigCheds)
Original view: BTC is trying to locally break above the 81,500 area, while the larger range breakout level is above 83,000.
Editor’s rundown: This aligns with Daan’s observation, suggesting that 83,000 is the level both bulls and bears are watching today.
3. Trader XO(@Trader_XO)
Original view: 82,000—83,000 is the key zone. If it breaks through supply and is accepted above the 365-day rolling VWAP, it could target around 90,000; if rejected, 78,500—79,000 must be defended first.
Editor’s rundown: Today only gives one route—after holding above 83,000, then look toward 90,000. If it breaks below 78,500—79,000, the bullish intraday scenario fails.
Risks: Around 83,000, fake breakouts are easy. Before anything else, consider stop-loss, slippage, funding rate, and liquidation price with contract leverage. This is a compilation of views—not trading follow recommendations.
Now, do you want to wait for confirmation above 83,000, or wait for a pullback to 78,500—79,000?
#BTC #ETH #BNB
Today, the key for BTC is not “whether it has already broken out,” but whether the market can accept price above 83,000.
In this 24-hour cycle, only 3 verifiable BTC takes were included—no need to force it to ten:
1. Daan Crypto Trades(@DaanCrypto)
Original view: After BTC takes out 80,000, it’s approaching the final large block of liquidity just before a breakout above the May high; watch for a market-structure breakout above 83,000.
Editor’s rundown: Spot is around 81,261 and hasn’t yet closed above 83,000. The focus is to wait for trades above that level and a confirmation pullback—this is not an announcement that the breakout is already complete.
2. Cheds(@BigCheds)
Original view: BTC is trying to locally break above the 81,500 area, while the larger range breakout level is above 83,000.
Editor’s rundown: This aligns with Daan’s observation, suggesting that 83,000 is the level both bulls and bears are watching today.
3. Trader XO(@Trader_XO)
Original view: 82,000—83,000 is the key zone. If it breaks through supply and is accepted above the 365-day rolling VWAP, it could target around 90,000; if rejected, 78,500—79,000 must be defended first.
Editor’s rundown: Today only gives one route—after holding above 83,000, then look toward 90,000. If it breaks below 78,500—79,000, the bullish intraday scenario fails.
Risks: Around 83,000, fake breakouts are easy. Before anything else, consider stop-loss, slippage, funding rate, and liquidation price with contract leverage. This is a compilation of views—not trading follow recommendations.
Now, do you want to wait for confirmation above 83,000, or wait for a pullback to 78,500—79,000?
#BTC #ETH #BNB
114
·
--
【Top 10 Crypto Traders’ Highlights Tonight|BTC September 19】
Tonight, the key point for BTC is not “it has already safely taken off,” but whether liquidity above 80,000 can be replenished—after it has been removed—so price can be pushed further to 82,000—83,000.
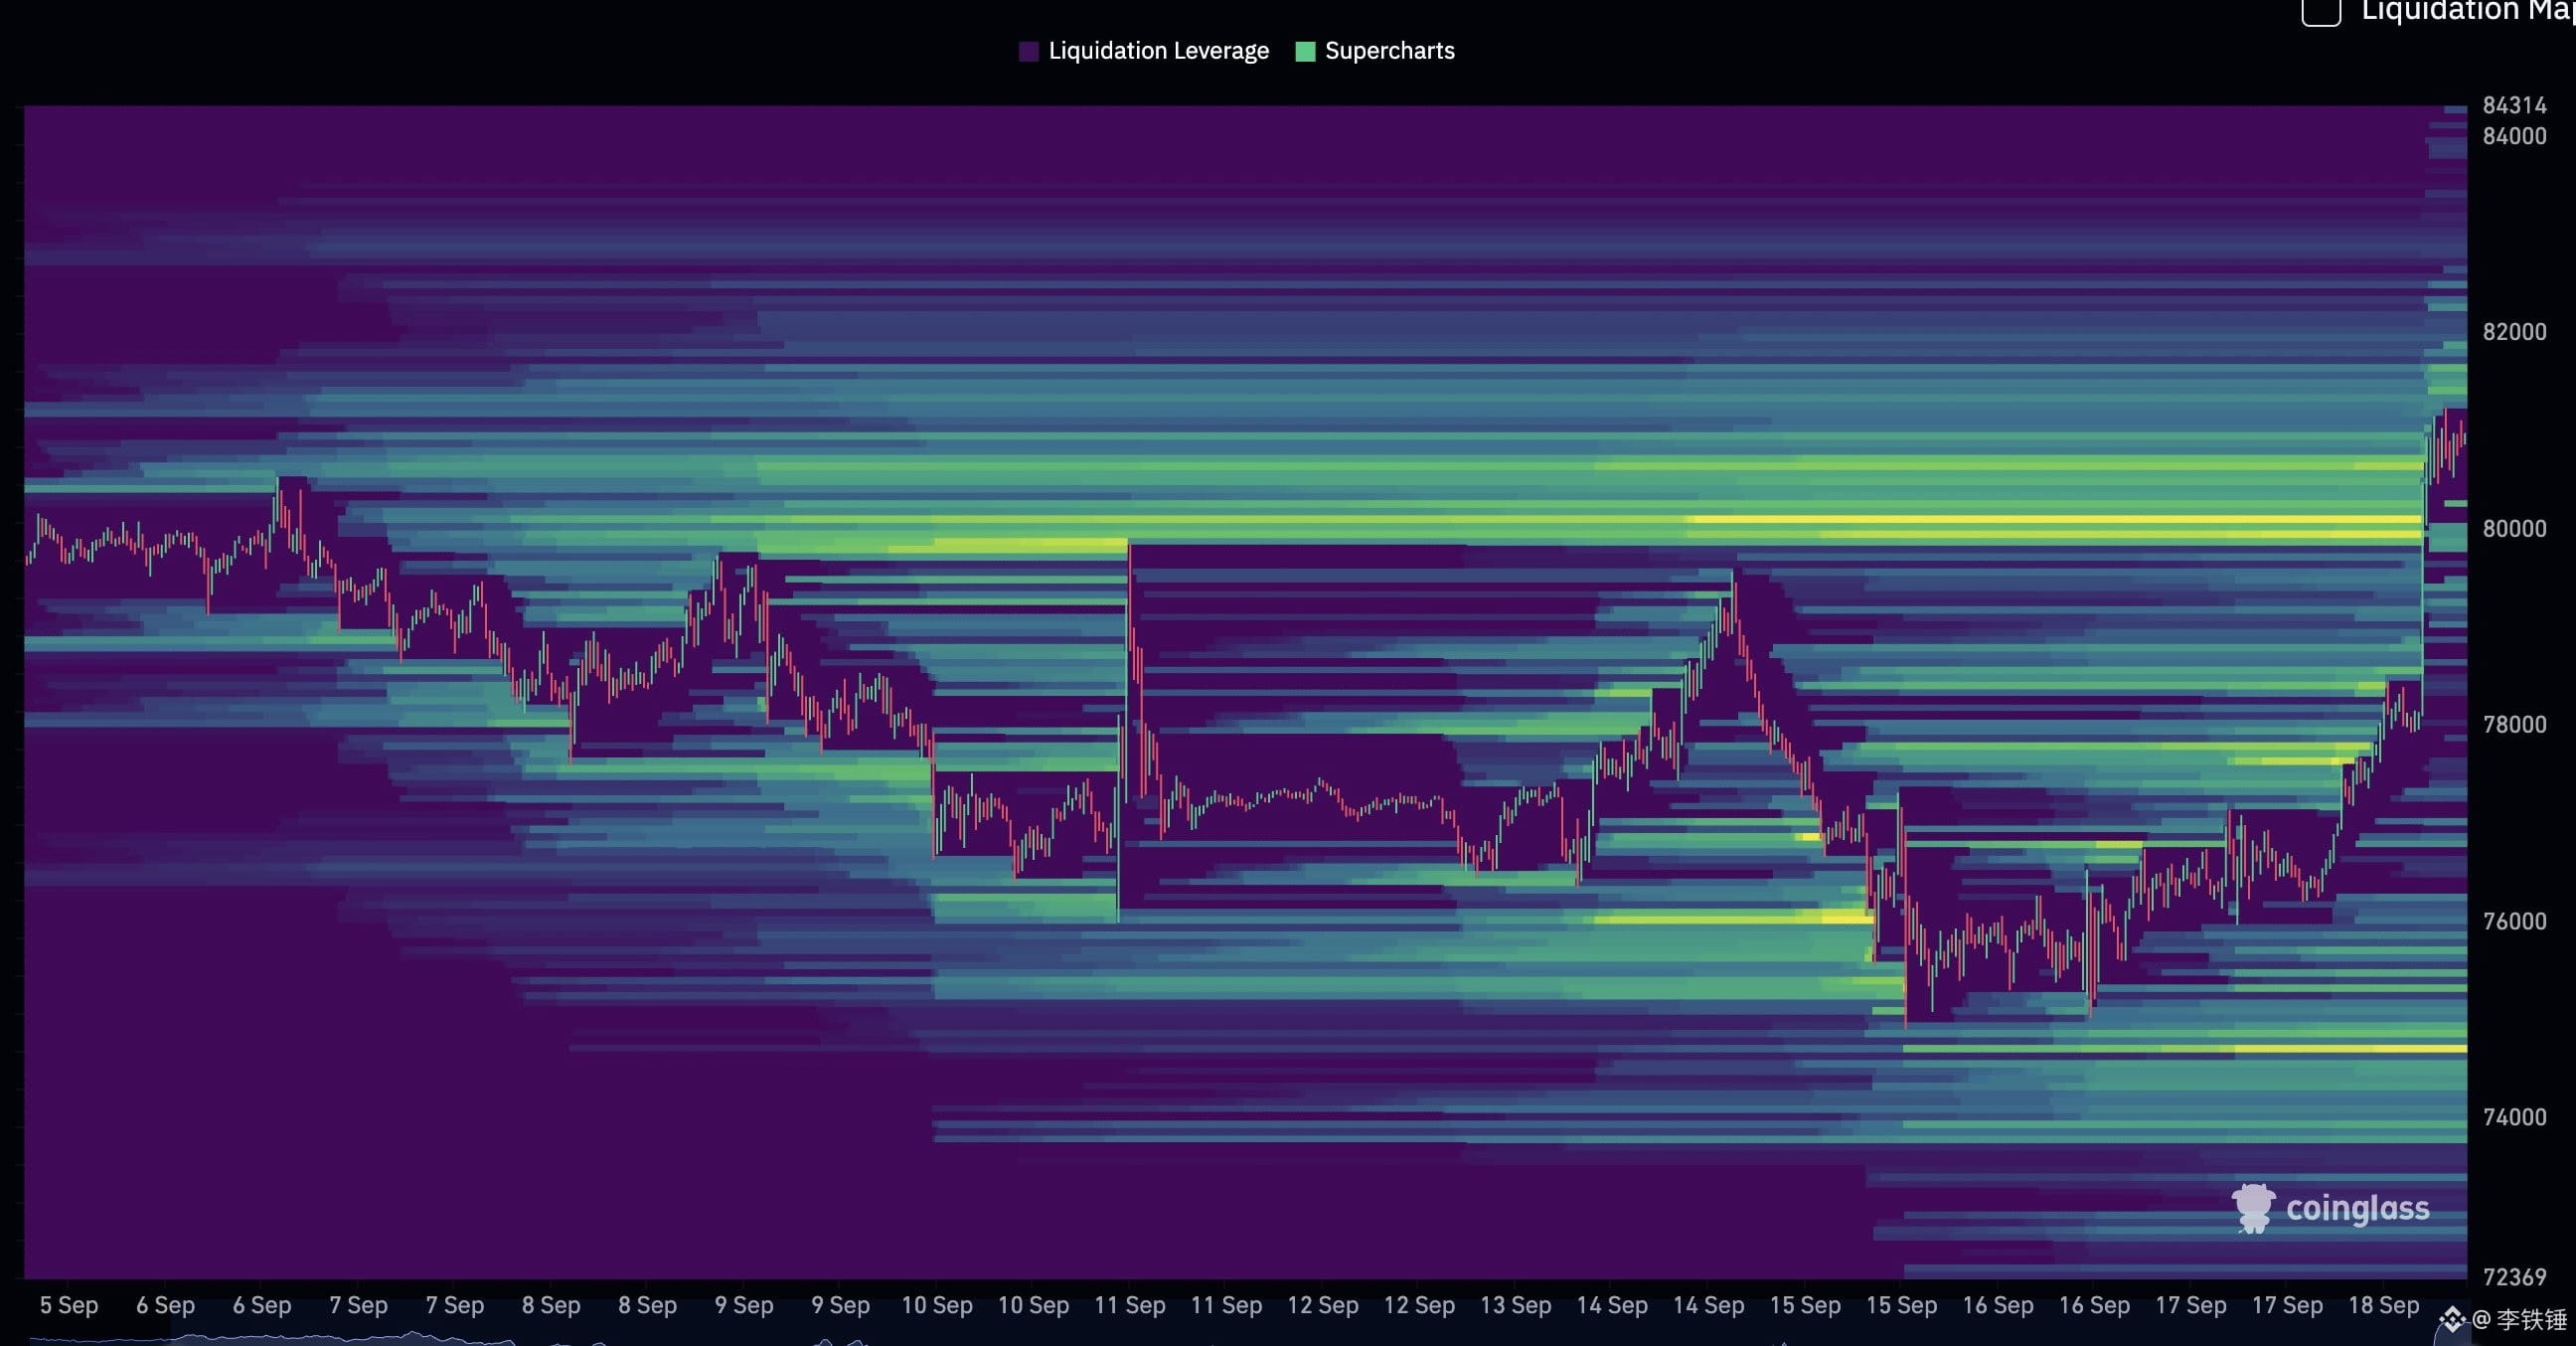
1)Daan Crypto Trades ( @DaanCrypto ) original view: BTC has already absorbed the big liquidity above 80,000; what remains is to watch resistance at the top of the range and the liquidity at 82,000—83,000.
Editor’s scenario: Spot is about 81,300. If it pulls back to 80,500—81,000 and is not broken through quickly, the main path is still to continue testing 82,000—83,000.
2)Pentoshi ( @Pentosh1 ) original view: If several major coins break out from a month-long consolidation, the base assumption should be continuation.
Editor’s scenario: This supports a rebound in risk appetite, but the prerequisite is that BTC cannot first lose 80,500; otherwise, altcoin breakouts are likely to turn into false breakouts as well.
3)Trader XO ( @Trader_XO ) original view: They didn’t get the ideal pullback, but the shorts placed at the lower end of the range have already been punished; trading should be carried out around the boundary areas.
Editor’s scenario: Tonight isn’t suitable to chase randomly in the middle. It’s better to wait for a pullback confirmation at 80,500—81,000, or to watch around 82,000—83,000 to see whether there’s a breakout with increased volume.
4)Josh Olszewicz ( @CarpeNoctom ) original view: BTC is outperforming multiple traditional assets, but COT commercial positions net short in BTC and ETH are increasing.
Editor’s scenario: Short-term strength is still there, but the closer price gets to 82,000—83,000, the higher the risk of chasing longs.
5)TraderSZ ( @trader1sz ) original view: Bias is bullish. They said the next step could go straight to new highs, but they didn’t provide conditions or an invalidation level.
Editor’s scenario: It can only be taken as a sentiment reference; it can’t be used alone as a trading basis.
Tonight, only one route: If BTC pulls back to 80,500—81,000 and holds, then look for 82,000—83,000. If it falls back below 79,800 and it doesn’t stand back above 80,500 within 30—60 minutes, this upswing attempt fails. Then watch for the rebound area returning to around 78,000.
Risk warning: This is a compilation of public opinions and a scenario-based projection of real-time price action—not a copy-trading signal. Funding rate is positive; when chasing longs in resistance zones, pay special attention to false breakouts, slippage, and leveraged liquidation.
Which are you more focused on tonight: first hitting 82,000—83,000, or first pulling back to 80,500?
#BTC #ETH #BNB
【Top 10 Crypto Traders’ Highlights Tonight|BTC September 19】
Tonight, the key point for BTC is not “it has already safely taken off,” but whether liquidity above 80,000 can be replenished—after it has been removed—so price can be pushed further to 82,000—83,000.
1)Daan Crypto Trades ( @DaanCrypto ) original view: BTC has already absorbed the big liquidity above 80,000; what remains is to watch resistance at the top of the range and the liquidity at 82,000—83,000.
Editor’s scenario: Spot is about 81,300. If it pulls back to 80,500—81,000 and is not broken through quickly, the main path is still to continue testing 82,000—83,000.
2)Pentoshi ( @Pentosh1 ) original view: If several major coins break out from a month-long consolidation, the base assumption should be continuation.
Editor’s scenario: This supports a rebound in risk appetite, but the prerequisite is that BTC cannot first lose 80,500; otherwise, altcoin breakouts are likely to turn into false breakouts as well.
3)Trader XO ( @Trader_XO ) original view: They didn’t get the ideal pullback, but the shorts placed at the lower end of the range have already been punished; trading should be carried out around the boundary areas.
Editor’s scenario: Tonight isn’t suitable to chase randomly in the middle. It’s better to wait for a pullback confirmation at 80,500—81,000, or to watch around 82,000—83,000 to see whether there’s a breakout with increased volume.
4)Josh Olszewicz ( @CarpeNoctom ) original view: BTC is outperforming multiple traditional assets, but COT commercial positions net short in BTC and ETH are increasing.
Editor’s scenario: Short-term strength is still there, but the closer price gets to 82,000—83,000, the higher the risk of chasing longs.
5)TraderSZ ( @trader1sz ) original view: Bias is bullish. They said the next step could go straight to new highs, but they didn’t provide conditions or an invalidation level.
Editor’s scenario: It can only be taken as a sentiment reference; it can’t be used alone as a trading basis.
Tonight, only one route: If BTC pulls back to 80,500—81,000 and holds, then look for 82,000—83,000. If it falls back below 79,800 and it doesn’t stand back above 80,500 within 30—60 minutes, this upswing attempt fails. Then watch for the rebound area returning to around 78,000.
Risk warning: This is a compilation of public opinions and a scenario-based projection of real-time price action—not a copy-trading signal. Funding rate is positive; when chasing longs in resistance zones, pay special attention to false breakouts, slippage, and leveraged liquidation.
Which are you more focused on tonight: first hitting 82,000—83,000, or first pulling back to 80,500?
#BTC #ETH #BNB
Tonight, the key point for BTC is not “it has already safely taken off,” but whether liquidity above 80,000 can be replenished—after it has been removed—so price can be pushed further to 82,000—83,000.
1)Daan Crypto Trades ( @DaanCrypto ) original view: BTC has already absorbed the big liquidity above 80,000; what remains is to watch resistance at the top of the range and the liquidity at 82,000—83,000.
Editor’s scenario: Spot is about 81,300. If it pulls back to 80,500—81,000 and is not broken through quickly, the main path is still to continue testing 82,000—83,000.
2)Pentoshi ( @Pentosh1 ) original view: If several major coins break out from a month-long consolidation, the base assumption should be continuation.
Editor’s scenario: This supports a rebound in risk appetite, but the prerequisite is that BTC cannot first lose 80,500; otherwise, altcoin breakouts are likely to turn into false breakouts as well.
3)Trader XO ( @Trader_XO ) original view: They didn’t get the ideal pullback, but the shorts placed at the lower end of the range have already been punished; trading should be carried out around the boundary areas.
Editor’s scenario: Tonight isn’t suitable to chase randomly in the middle. It’s better to wait for a pullback confirmation at 80,500—81,000, or to watch around 82,000—83,000 to see whether there’s a breakout with increased volume.
4)Josh Olszewicz ( @CarpeNoctom ) original view: BTC is outperforming multiple traditional assets, but COT commercial positions net short in BTC and ETH are increasing.
Editor’s scenario: Short-term strength is still there, but the closer price gets to 82,000—83,000, the higher the risk of chasing longs.
5)TraderSZ ( @trader1sz ) original view: Bias is bullish. They said the next step could go straight to new highs, but they didn’t provide conditions or an invalidation level.
Editor’s scenario: It can only be taken as a sentiment reference; it can’t be used alone as a trading basis.
Tonight, only one route: If BTC pulls back to 80,500—81,000 and holds, then look for 82,000—83,000. If it falls back below 79,800 and it doesn’t stand back above 80,500 within 30—60 minutes, this upswing attempt fails. Then watch for the rebound area returning to around 78,000.
Risk warning: This is a compilation of public opinions and a scenario-based projection of real-time price action—not a copy-trading signal. Funding rate is positive; when chasing longs in resistance zones, pay special attention to false breakouts, slippage, and leveraged liquidation.
Which are you more focused on tonight: first hitting 82,000—83,000, or first pulling back to 80,500?
#BTC #ETH #BNB
157
·
--
【Top 10 Crypto Traders’ Highlights Today|ETH September 19】
During the day, ETH isn’t just about chasing pumps—the key is whether 2500—2530 can turn into support.
1. Daan Crypto Trades(@DaanCrypto)original view: BTC.D has returned below the year’s opening price; if altcoins are going to outperform overall, ETH should lead. Editor’s take: ETH’s relative strength is becoming the main storyline.
2. BigCheds(@BigCheds)original view: ETH is attempting another breakout. Editor’s take: spot is around 2632, with a 24h high at 2646; after breaking out, it’s more suitable to wait for a pullback to confirm.
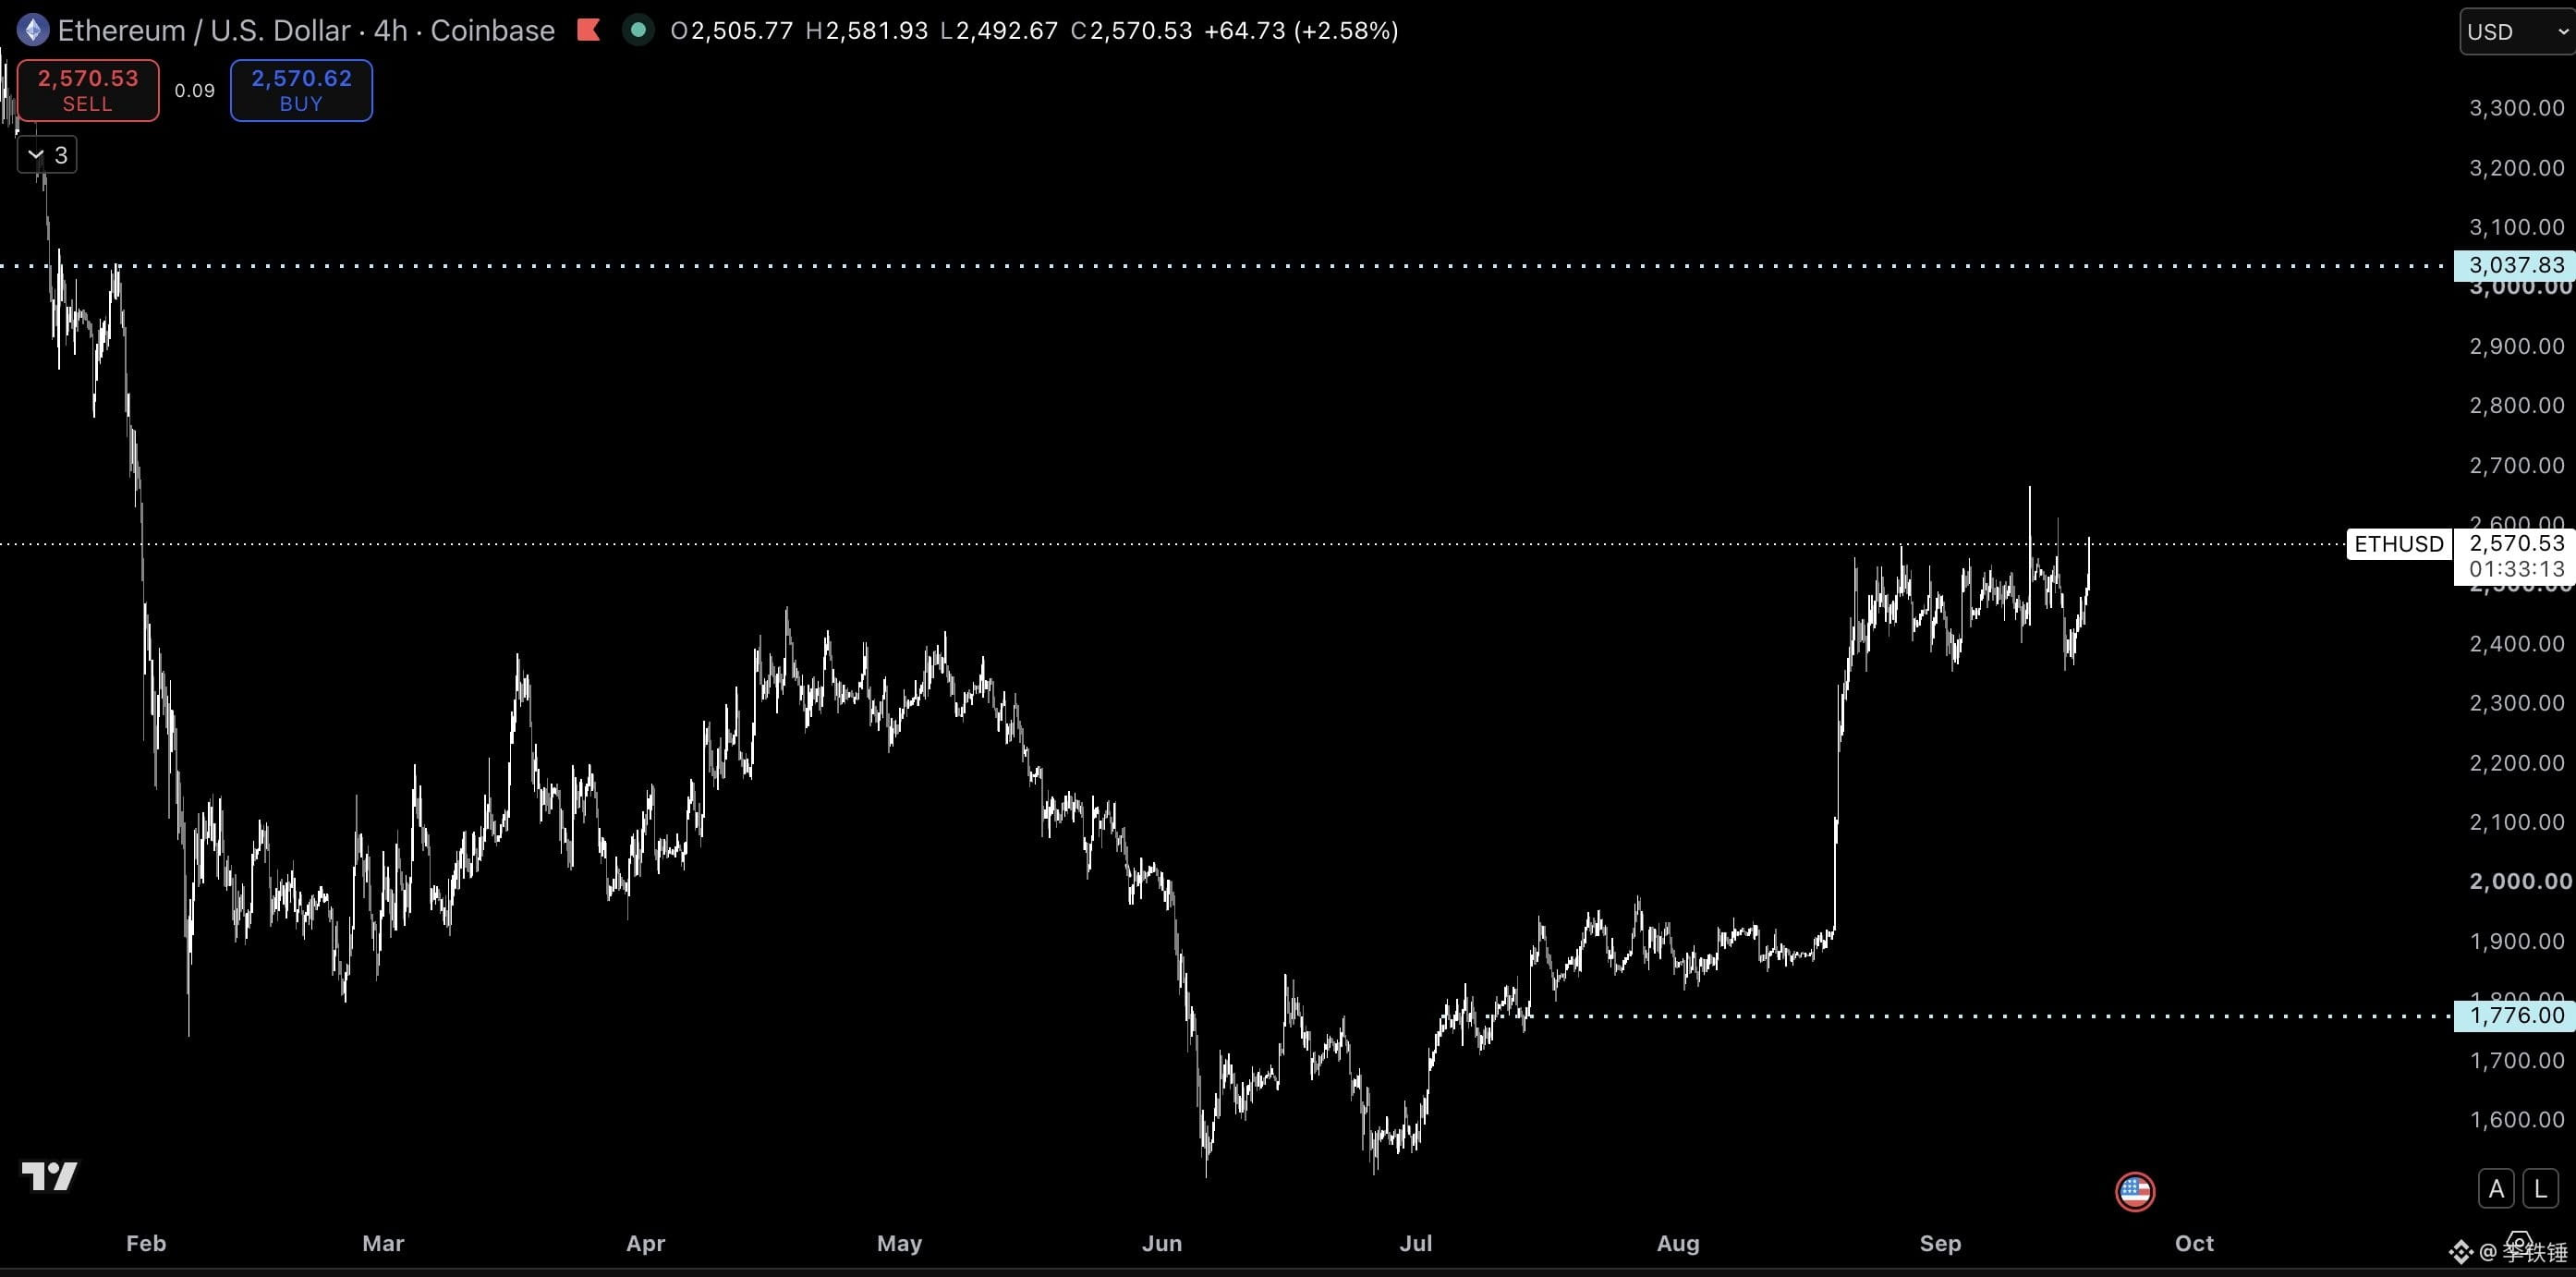
3. Pentoshi(@Pentosh1)original view: Still bullish on ETH at 3000—3200; it may be ending a month-long consolidation. Editor’s take: the target can be watched, but only if 2500—2530 doesn’t break down, and there’s a breakout above 2646—2700.
4. Josh Olszewicz(@CarpeNoctom)original view: In the BTC/ETH COT, commercial net shorts are increasing. Editor’s take: this is a reminder for longs not to ignore the risk of overcrowding.
5. Altcoin Sherpa(@AltcoinSherpa)original view: There could be a small pullback; no new positions in the current area for now, but still holding spot and hoping for a BTC/ETH breakout. Editor’s take: the bias is still bullish—execution should wait for confirmation.
6. TXMC(@TXMCtrades)and Peter Brandt(@PeterLBrandt) both point to risk-on repair in their BTC outlook, but they also warn about the risk of false breakouts driven by liquidations.
Single path: If ETH holds 2500—2530, first look for a confirmed breakout at 2646—2700, then 2800; only if momentum extends strongly should you look for 3000—3200. If price falls back to 2500 and breaks below 2460, the setup fails.
Risk: This is a summary of public viewpoints, not trading instructions; perpetual contracts carry funding-rate risk, slippage risk, and liquidation risk.
What do you think: can ETH hold 2500 this time, or will it be a false breakout near 2646?
#BTC #ETH #BNB
【Top 10 Crypto Traders’ Highlights Today|ETH September 19】
During the day, ETH isn’t just about chasing pumps—the key is whether 2500—2530 can turn into support.
1. Daan Crypto Trades(@DaanCrypto)original view: BTC.D has returned below the year’s opening price; if altcoins are going to outperform overall, ETH should lead. Editor’s take: ETH’s relative strength is becoming the main storyline.
2. BigCheds(@BigCheds)original view: ETH is attempting another breakout. Editor’s take: spot is around 2632, with a 24h high at 2646; after breaking out, it’s more suitable to wait for a pullback to confirm.
3. Pentoshi(@Pentosh1)original view: Still bullish on ETH at 3000—3200; it may be ending a month-long consolidation. Editor’s take: the target can be watched, but only if 2500—2530 doesn’t break down, and there’s a breakout above 2646—2700.
4. Josh Olszewicz(@CarpeNoctom)original view: In the BTC/ETH COT, commercial net shorts are increasing. Editor’s take: this is a reminder for longs not to ignore the risk of overcrowding.
5. Altcoin Sherpa(@AltcoinSherpa)original view: There could be a small pullback; no new positions in the current area for now, but still holding spot and hoping for a BTC/ETH breakout. Editor’s take: the bias is still bullish—execution should wait for confirmation.
6. TXMC(@TXMCtrades)and Peter Brandt(@PeterLBrandt) both point to risk-on repair in their BTC outlook, but they also warn about the risk of false breakouts driven by liquidations.
Single path: If ETH holds 2500—2530, first look for a confirmed breakout at 2646—2700, then 2800; only if momentum extends strongly should you look for 3000—3200. If price falls back to 2500 and breaks below 2460, the setup fails.
Risk: This is a summary of public viewpoints, not trading instructions; perpetual contracts carry funding-rate risk, slippage risk, and liquidation risk.
What do you think: can ETH hold 2500 this time, or will it be a false breakout near 2646?
#BTC #ETH #BNB
During the day, ETH isn’t just about chasing pumps—the key is whether 2500—2530 can turn into support.
1. Daan Crypto Trades(@DaanCrypto)original view: BTC.D has returned below the year’s opening price; if altcoins are going to outperform overall, ETH should lead. Editor’s take: ETH’s relative strength is becoming the main storyline.
2. BigCheds(@BigCheds)original view: ETH is attempting another breakout. Editor’s take: spot is around 2632, with a 24h high at 2646; after breaking out, it’s more suitable to wait for a pullback to confirm.
3. Pentoshi(@Pentosh1)original view: Still bullish on ETH at 3000—3200; it may be ending a month-long consolidation. Editor’s take: the target can be watched, but only if 2500—2530 doesn’t break down, and there’s a breakout above 2646—2700.
4. Josh Olszewicz(@CarpeNoctom)original view: In the BTC/ETH COT, commercial net shorts are increasing. Editor’s take: this is a reminder for longs not to ignore the risk of overcrowding.
5. Altcoin Sherpa(@AltcoinSherpa)original view: There could be a small pullback; no new positions in the current area for now, but still holding spot and hoping for a BTC/ETH breakout. Editor’s take: the bias is still bullish—execution should wait for confirmation.
6. TXMC(@TXMCtrades)and Peter Brandt(@PeterLBrandt) both point to risk-on repair in their BTC outlook, but they also warn about the risk of false breakouts driven by liquidations.
Single path: If ETH holds 2500—2530, first look for a confirmed breakout at 2646—2700, then 2800; only if momentum extends strongly should you look for 3000—3200. If price falls back to 2500 and breaks below 2460, the setup fails.
Risk: This is a summary of public viewpoints, not trading instructions; perpetual contracts carry funding-rate risk, slippage risk, and liquidation risk.
What do you think: can ETH hold 2500 this time, or will it be a false breakout near 2646?
#BTC #ETH #BNB
335
·
--
【Top 10 Crypto Traders’ Highlights Today | BTC September 19】
Conclusion: Last night’s BTC move wasn’t a normal spike—it already swept through liquidity above 80,000. Today, there’s only one main line: watch whether 80,000 holds, then look for 82,000—83,000. If price drops back below 80,000 and can’t reclaim it, this route becomes invalid.
1) Daan Crypto Trades(@DaanCrypto)
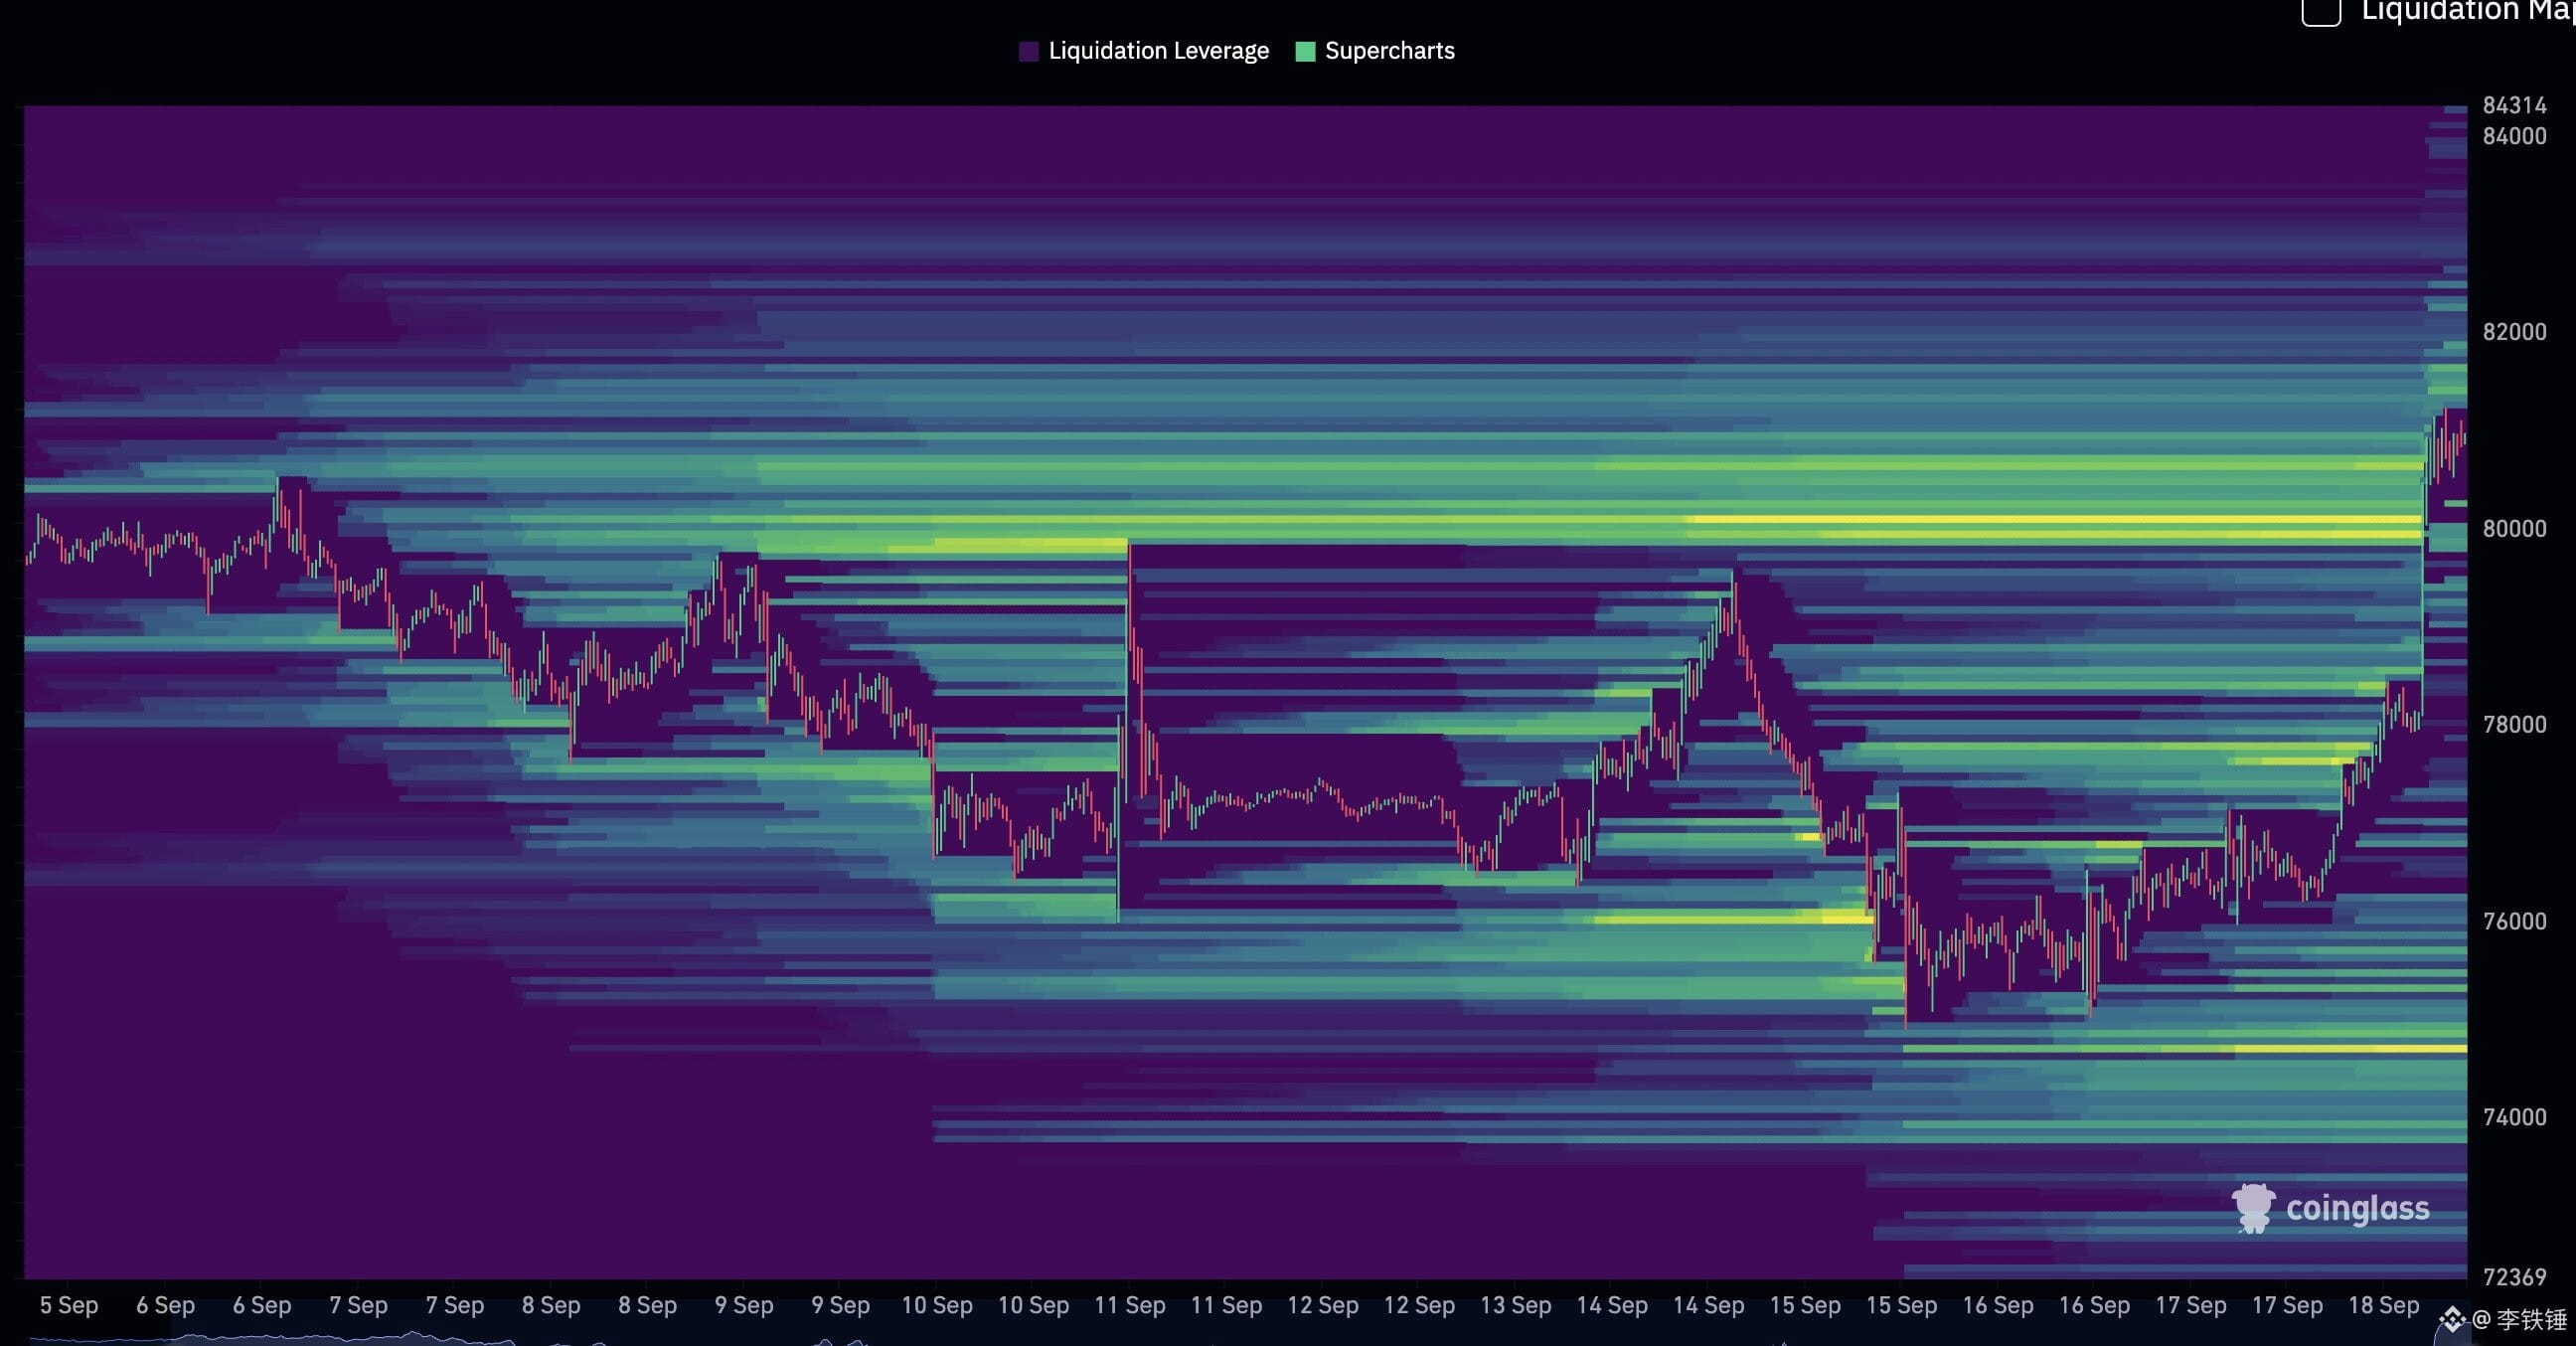
Original take: BTC has already taken out the big liquidity above 80,000; what remains is the range high resistance and the liquidity around 82,000—83,000.
Editor’s scenario: Spot is about 81,135, indicating price has entered the upper liquidity zone, but it hasn’t truly broken and stood above 82,000 yet. The key is whether 80,000 can flip from resistance into support.
2) Cheds(@BigCheds)
Original take: BTC has returned above 80,000, and the price action has become “spicy.”
Editor’s scenario: This aligns with Daan’s liquidity chart—80,000 is today’s most important confirmation level.
3) Pentoshi(@Pentosh1)
Original take: Several major coins broke out of a month-long consolidation range; the default assumption is that the move continues.
Editor’s scenario: If BTC doesn’t fall back into the breakout zone, treat it as a strong consolidation first rather than immediately judging that the pump failed.
Live data: BTCUSDT spot around 81,135; 24h high 81,400, low 76,296; increase about 6.096%. Funding rate 0.00006833, open interest 108,018.833 BTC.
Risk: The rise over the past 24 hours is already significant. Chasing long with high leverage can easily get washed out by the fluctuations within the 80,000—83,000 range. If it breaks below 80,000 and can’t be reclaimed—especially if it breaks below 79,500—consider the route invalid.
This search didn’t force a list of ten by scraping old posts; only verified, valid viewpoints from the past 24 hours were kept. Do you think BTC will first pull back to test 80,000 today, or go straight to sweep 82,000—83,000?
#BTC #ETH #BNB
【Top 10 Crypto Traders’ Highlights Today | BTC September 19】
Conclusion: Last night’s BTC move wasn’t a normal spike—it already swept through liquidity above 80,000. Today, there’s only one main line: watch whether 80,000 holds, then look for 82,000—83,000. If price drops back below 80,000 and can’t reclaim it, this route becomes invalid.
1) Daan Crypto Trades(@DaanCrypto)
Original take: BTC has already taken out the big liquidity above 80,000; what remains is the range high resistance and the liquidity around 82,000—83,000.
Editor’s scenario: Spot is about 81,135, indicating price has entered the upper liquidity zone, but it hasn’t truly broken and stood above 82,000 yet. The key is whether 80,000 can flip from resistance into support.
2) Cheds(@BigCheds)
Original take: BTC has returned above 80,000, and the price action has become “spicy.”
Editor’s scenario: This aligns with Daan’s liquidity chart—80,000 is today’s most important confirmation level.
3) Pentoshi(@Pentosh1)
Original take: Several major coins broke out of a month-long consolidation range; the default assumption is that the move continues.
Editor’s scenario: If BTC doesn’t fall back into the breakout zone, treat it as a strong consolidation first rather than immediately judging that the pump failed.
Live data: BTCUSDT spot around 81,135; 24h high 81,400, low 76,296; increase about 6.096%. Funding rate 0.00006833, open interest 108,018.833 BTC.
Risk: The rise over the past 24 hours is already significant. Chasing long with high leverage can easily get washed out by the fluctuations within the 80,000—83,000 range. If it breaks below 80,000 and can’t be reclaimed—especially if it breaks below 79,500—consider the route invalid.
This search didn’t force a list of ten by scraping old posts; only verified, valid viewpoints from the past 24 hours were kept. Do you think BTC will first pull back to test 80,000 today, or go straight to sweep 82,000—83,000?
#BTC #ETH #BNB
Conclusion: Last night’s BTC move wasn’t a normal spike—it already swept through liquidity above 80,000. Today, there’s only one main line: watch whether 80,000 holds, then look for 82,000—83,000. If price drops back below 80,000 and can’t reclaim it, this route becomes invalid.
1) Daan Crypto Trades(@DaanCrypto)
Original take: BTC has already taken out the big liquidity above 80,000; what remains is the range high resistance and the liquidity around 82,000—83,000.
Editor’s scenario: Spot is about 81,135, indicating price has entered the upper liquidity zone, but it hasn’t truly broken and stood above 82,000 yet. The key is whether 80,000 can flip from resistance into support.
2) Cheds(@BigCheds)
Original take: BTC has returned above 80,000, and the price action has become “spicy.”
Editor’s scenario: This aligns with Daan’s liquidity chart—80,000 is today’s most important confirmation level.
3) Pentoshi(@Pentosh1)
Original take: Several major coins broke out of a month-long consolidation range; the default assumption is that the move continues.
Editor’s scenario: If BTC doesn’t fall back into the breakout zone, treat it as a strong consolidation first rather than immediately judging that the pump failed.
Live data: BTCUSDT spot around 81,135; 24h high 81,400, low 76,296; increase about 6.096%. Funding rate 0.00006833, open interest 108,018.833 BTC.
Risk: The rise over the past 24 hours is already significant. Chasing long with high leverage can easily get washed out by the fluctuations within the 80,000—83,000 range. If it breaks below 80,000 and can’t be reclaimed—especially if it breaks below 79,500—consider the route invalid.
This search didn’t force a list of ten by scraping old posts; only verified, valid viewpoints from the past 24 hours were kept. Do you think BTC will first pull back to test 80,000 today, or go straight to sweep 82,000—83,000?
#BTC #ETH #BNB
339
·
--
【Top 10 Crypto Traders’ Highlights Today|BTC September 18】
For the evening BTC: A move above 78,000 is not a buy-more signal. The key is still the 76,000—81,000 range
Conclusion first: Tonight’s BTC is not about chasing a rebound. It’s about whether the 76,000—81,000 range can produce a valid breakout.
The only sources here are the smallest set of recent, verifiable observations—no pretending to be a complete “Top 10”:
1. Daan Crypto Trades(@DaanCrypto)original view on September 17: BTC is still within the 76,000—81,000 range. The next step is to wait for an effective daily close/breakout.
Editorial run-through: Based on Binance spot BTC at around 78,252, price is still in the upper part of the range. Holding above 78,000 is required first to consider 79,000, then 81,000.
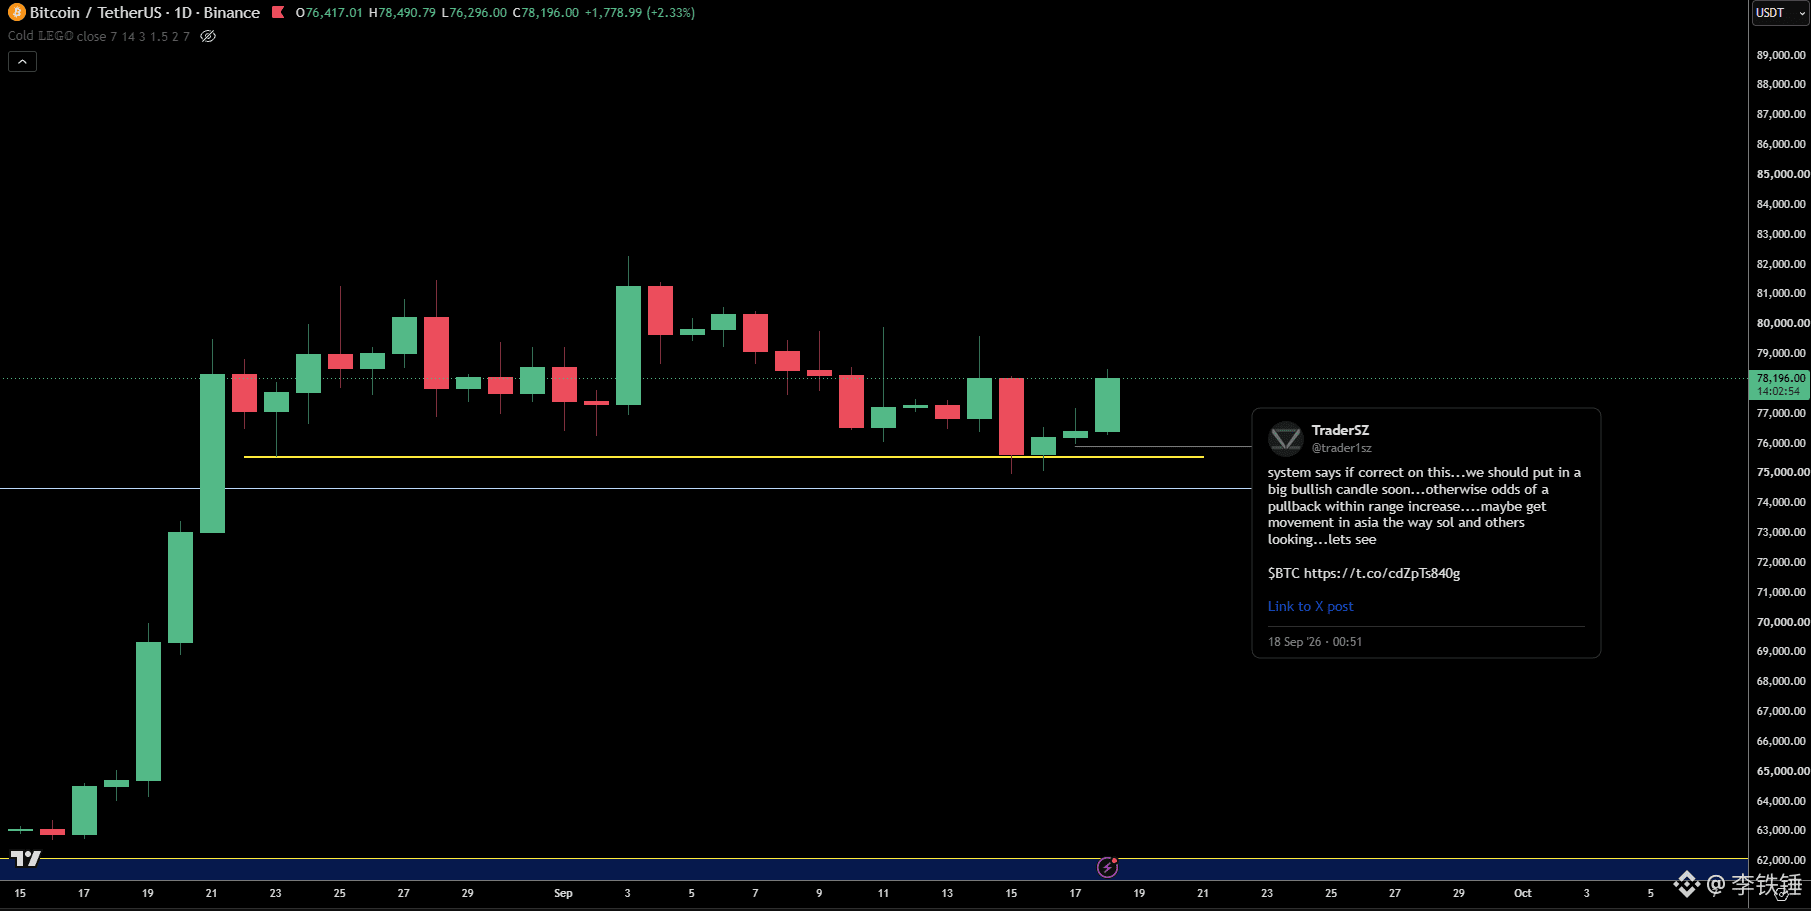
2. TraderSZ(@trader1sz)original view on September 18: Posted a BTC/USDT Binance 1D candlestick chart showing price rebounding above the support line around 75,500.
Editorial run-through: The chart supports a path of “slightly strong above support, but breakout not confirmed yet.”
3. Daan Crypto Trades(@DaanCrypto)September 18 addition: Total crypto market cap is still near the highs/resistance from May.
Editorial run-through: Any upward move in BTC still depends on overall risk appetite; you can’t simply write a rebound above 78,000 as trend confirmation.
Main route: Sideways-to-strong consolidation above 76,000—first look at 79,000, then 81,000. If it drops back below 76,000 on the 4-hour or daily timeframe, the setup is invalid. Leverage, funding rates, slippage, and liquidation risk all need to be considered separately.
Which matters more to you right now: a BTC breakout above 81,000, or worrying that 76,000 will fall again?
#BTC #ETH #BNB
【Top 10 Crypto Traders’ Highlights Today|BTC September 18】
For the evening BTC: A move above 78,000 is not a buy-more signal. The key is still the 76,000—81,000 range
Conclusion first: Tonight’s BTC is not about chasing a rebound. It’s about whether the 76,000—81,000 range can produce a valid breakout.
The only sources here are the smallest set of recent, verifiable observations—no pretending to be a complete “Top 10”:
1. Daan Crypto Trades(@DaanCrypto)original view on September 17: BTC is still within the 76,000—81,000 range. The next step is to wait for an effective daily close/breakout.
Editorial run-through: Based on Binance spot BTC at around 78,252, price is still in the upper part of the range. Holding above 78,000 is required first to consider 79,000, then 81,000.
2. TraderSZ(@trader1sz)original view on September 18: Posted a BTC/USDT Binance 1D candlestick chart showing price rebounding above the support line around 75,500.
Editorial run-through: The chart supports a path of “slightly strong above support, but breakout not confirmed yet.”
3. Daan Crypto Trades(@DaanCrypto)September 18 addition: Total crypto market cap is still near the highs/resistance from May.
Editorial run-through: Any upward move in BTC still depends on overall risk appetite; you can’t simply write a rebound above 78,000 as trend confirmation.
Main route: Sideways-to-strong consolidation above 76,000—first look at 79,000, then 81,000. If it drops back below 76,000 on the 4-hour or daily timeframe, the setup is invalid. Leverage, funding rates, slippage, and liquidation risk all need to be considered separately.
Which matters more to you right now: a BTC breakout above 81,000, or worrying that 76,000 will fall again?
#BTC #ETH #BNB
For the evening BTC: A move above 78,000 is not a buy-more signal. The key is still the 76,000—81,000 range
Conclusion first: Tonight’s BTC is not about chasing a rebound. It’s about whether the 76,000—81,000 range can produce a valid breakout.
The only sources here are the smallest set of recent, verifiable observations—no pretending to be a complete “Top 10”:
1. Daan Crypto Trades(@DaanCrypto)original view on September 17: BTC is still within the 76,000—81,000 range. The next step is to wait for an effective daily close/breakout.
Editorial run-through: Based on Binance spot BTC at around 78,252, price is still in the upper part of the range. Holding above 78,000 is required first to consider 79,000, then 81,000.
2. TraderSZ(@trader1sz)original view on September 18: Posted a BTC/USDT Binance 1D candlestick chart showing price rebounding above the support line around 75,500.
Editorial run-through: The chart supports a path of “slightly strong above support, but breakout not confirmed yet.”
3. Daan Crypto Trades(@DaanCrypto)September 18 addition: Total crypto market cap is still near the highs/resistance from May.
Editorial run-through: Any upward move in BTC still depends on overall risk appetite; you can’t simply write a rebound above 78,000 as trend confirmation.
Main route: Sideways-to-strong consolidation above 76,000—first look at 79,000, then 81,000. If it drops back below 76,000 on the 4-hour or daily timeframe, the setup is invalid. Leverage, funding rates, slippage, and liquidation risk all need to be considered separately.
Which matters more to you right now: a BTC breakout above 81,000, or worrying that 76,000 will fall again?
#BTC #ETH #BNB
1
202
·
--
【Top 10 Crypto Traders’ Highlights Today|ETH September 18】
Conclusion: ETH isn’t a mindless long chase right now—it’s waiting for range confirmation. In the past 24 hours, I only found five sufficiently relevant public trader viewpoints. I won’t pad the list with old posts just to make it “top 10.”
1)Daan Crypto Trades(@DaanCrypto)
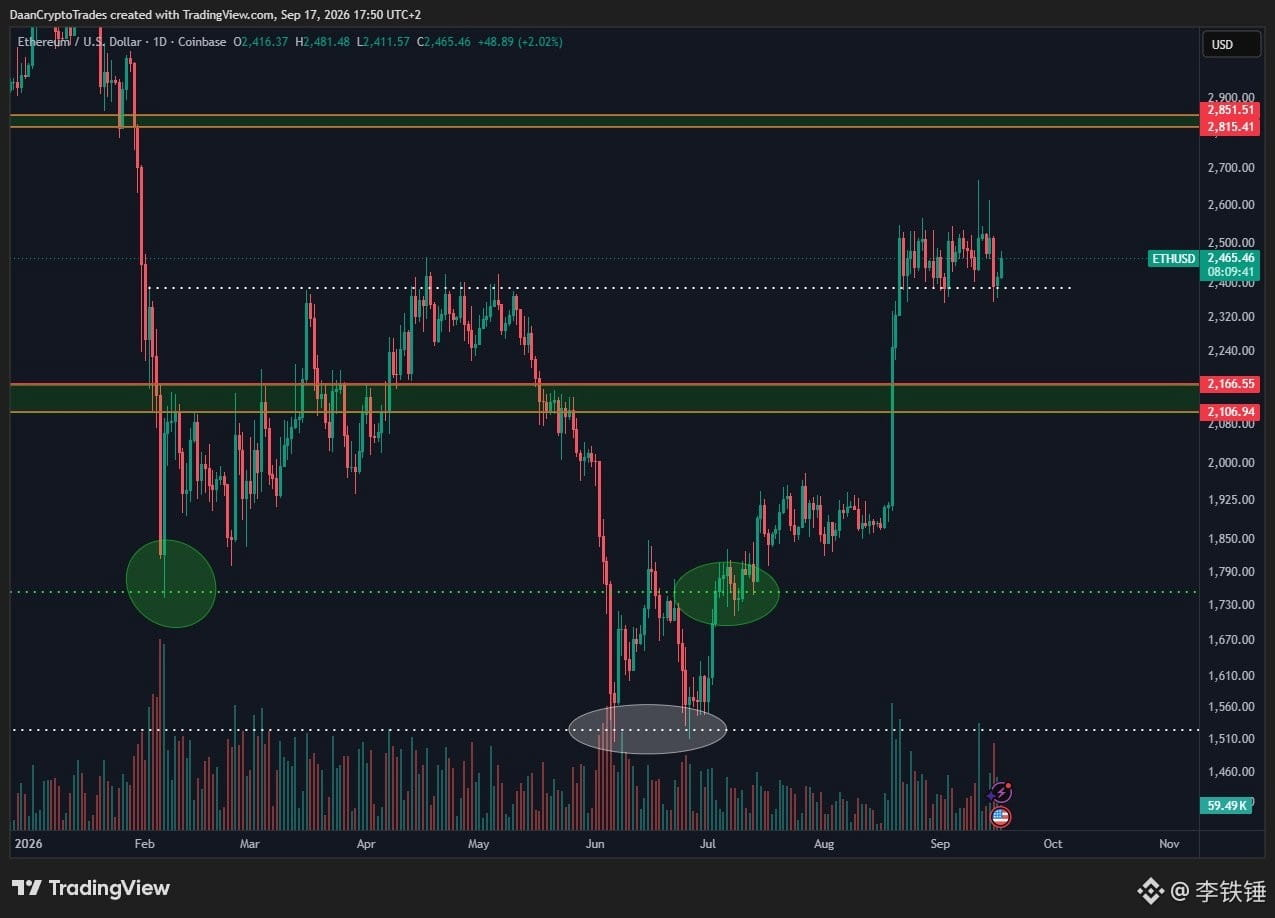
Original view: After this week’s events involving ETH and BTC, they’ve returned to the range. The next step is to see whether the daily chart truly closes with a breakout.
Editor’s take: Binance’s real-time ETH is around 2468; the 24h high is 2484 and the low is 2425. The main idea is to hold 2425—2400, then attempt 2484.
2)Pentoshi(@Pentosh1)
Original view: He wants to wait for ETH to break down below equal lows before adding, but price didn’t provide the opportunity.
Editor’s take: This looks more like “confirmation after sweeping liquidity,” not unconditional chasing longs near 2468.
3)Daan Crypto Trades(@DaanCrypto, cross-market)
Original view: Total crypto market cap is still stuck at the May highs / resistance, waiting for the market to digest after the FOMC and for ETF capital flows.
Editor’s take: For ETH to break above 2484, it’s best if total market cap also breaks upward at the same time—otherwise it’s easy to turn into a false breakout near the top of the range.
4)Cheds(@BigCheds, cross-market)
Original view: BTC’s 4-hour moving averages are converging.
Editor’s take: The majors are still waiting for direction to be chosen. ETH’s path should be written as conditional orders, not a definite bullish bet.
5)TraderSZ(@trader1sz, rotation)
Original view: Based on the cross pairs, SOL could still outperform; he mentioned SOLBTC and SLEBeta;inET H.
Editor’s take: If SOLETH continues to suppress, ETH may only be repairing within the range—not necessarily accelerating independently.
Single scenario: ETH holds 2425—2400, first watch 2484; only after a volume-backed confirmation above 2484 should you look toward 2520. Invalidation: the daily closes back below 2425, or BTC breaks down simultaneously.
Risks: This isn’t a copy-trade signal. Funding rates are still positive; chasing longs with high leverage encountering a false breakout can amplify liquidation risk.
Do you think ETH breaks above 2484 first, or pulls back to 2425 first?
#BTC #ETH #BNB
【Top 10 Crypto Traders’ Highlights Today|ETH September 18】
Conclusion: ETH isn’t a mindless long chase right now—it’s waiting for range confirmation. In the past 24 hours, I only found five sufficiently relevant public trader viewpoints. I won’t pad the list with old posts just to make it “top 10.”
1)Daan Crypto Trades(@DaanCrypto)
Original view: After this week’s events involving ETH and BTC, they’ve returned to the range. The next step is to see whether the daily chart truly closes with a breakout.
Editor’s take: Binance’s real-time ETH is around 2468; the 24h high is 2484 and the low is 2425. The main idea is to hold 2425—2400, then attempt 2484.
2)Pentoshi(@Pentosh1)
Original view: He wants to wait for ETH to break down below equal lows before adding, but price didn’t provide the opportunity.
Editor’s take: This looks more like “confirmation after sweeping liquidity,” not unconditional chasing longs near 2468.
3)Daan Crypto Trades(@DaanCrypto, cross-market)
Original view: Total crypto market cap is still stuck at the May highs / resistance, waiting for the market to digest after the FOMC and for ETF capital flows.
Editor’s take: For ETH to break above 2484, it’s best if total market cap also breaks upward at the same time—otherwise it’s easy to turn into a false breakout near the top of the range.
4)Cheds(@BigCheds, cross-market)
Original view: BTC’s 4-hour moving averages are converging.
Editor’s take: The majors are still waiting for direction to be chosen. ETH’s path should be written as conditional orders, not a definite bullish bet.
5)TraderSZ(@trader1sz, rotation)
Original view: Based on the cross pairs, SOL could still outperform; he mentioned SOLBTC and SLEBeta;inET H.
Editor’s take: If SOLETH continues to suppress, ETH may only be repairing within the range—not necessarily accelerating independently.
Single scenario: ETH holds 2425—2400, first watch 2484; only after a volume-backed confirmation above 2484 should you look toward 2520. Invalidation: the daily closes back below 2425, or BTC breaks down simultaneously.
Risks: This isn’t a copy-trade signal. Funding rates are still positive; chasing longs with high leverage encountering a false breakout can amplify liquidation risk.
Do you think ETH breaks above 2484 first, or pulls back to 2425 first?
#BTC #ETH #BNB
Conclusion: ETH isn’t a mindless long chase right now—it’s waiting for range confirmation. In the past 24 hours, I only found five sufficiently relevant public trader viewpoints. I won’t pad the list with old posts just to make it “top 10.”
1)Daan Crypto Trades(@DaanCrypto)
Original view: After this week’s events involving ETH and BTC, they’ve returned to the range. The next step is to see whether the daily chart truly closes with a breakout.
Editor’s take: Binance’s real-time ETH is around 2468; the 24h high is 2484 and the low is 2425. The main idea is to hold 2425—2400, then attempt 2484.
2)Pentoshi(@Pentosh1)
Original view: He wants to wait for ETH to break down below equal lows before adding, but price didn’t provide the opportunity.
Editor’s take: This looks more like “confirmation after sweeping liquidity,” not unconditional chasing longs near 2468.
3)Daan Crypto Trades(@DaanCrypto, cross-market)
Original view: Total crypto market cap is still stuck at the May highs / resistance, waiting for the market to digest after the FOMC and for ETF capital flows.
Editor’s take: For ETH to break above 2484, it’s best if total market cap also breaks upward at the same time—otherwise it’s easy to turn into a false breakout near the top of the range.
4)Cheds(@BigCheds, cross-market)
Original view: BTC’s 4-hour moving averages are converging.
Editor’s take: The majors are still waiting for direction to be chosen. ETH’s path should be written as conditional orders, not a definite bullish bet.
5)TraderSZ(@trader1sz, rotation)
Original view: Based on the cross pairs, SOL could still outperform; he mentioned SOLBTC and SLEBeta;inET H.
Editor’s take: If SOLETH continues to suppress, ETH may only be repairing within the range—not necessarily accelerating independently.
Single scenario: ETH holds 2425—2400, first watch 2484; only after a volume-backed confirmation above 2484 should you look toward 2520. Invalidation: the daily closes back below 2425, or BTC breaks down simultaneously.
Risks: This isn’t a copy-trade signal. Funding rates are still positive; chasing longs with high leverage encountering a false breakout can amplify liquidation risk.
Do you think ETH breaks above 2484 first, or pulls back to 2425 first?
#BTC #ETH #BNB
357
·
--
【Top 10 Crypto Traders’ Highlights Today|BTC September 18】
Top 10 Crypto Traders’ Highlights Today|BTC September 18
Early session takeaway: BTC hasn’t truly broken out yet—it has swept the lows and is now waiting for confirmation.
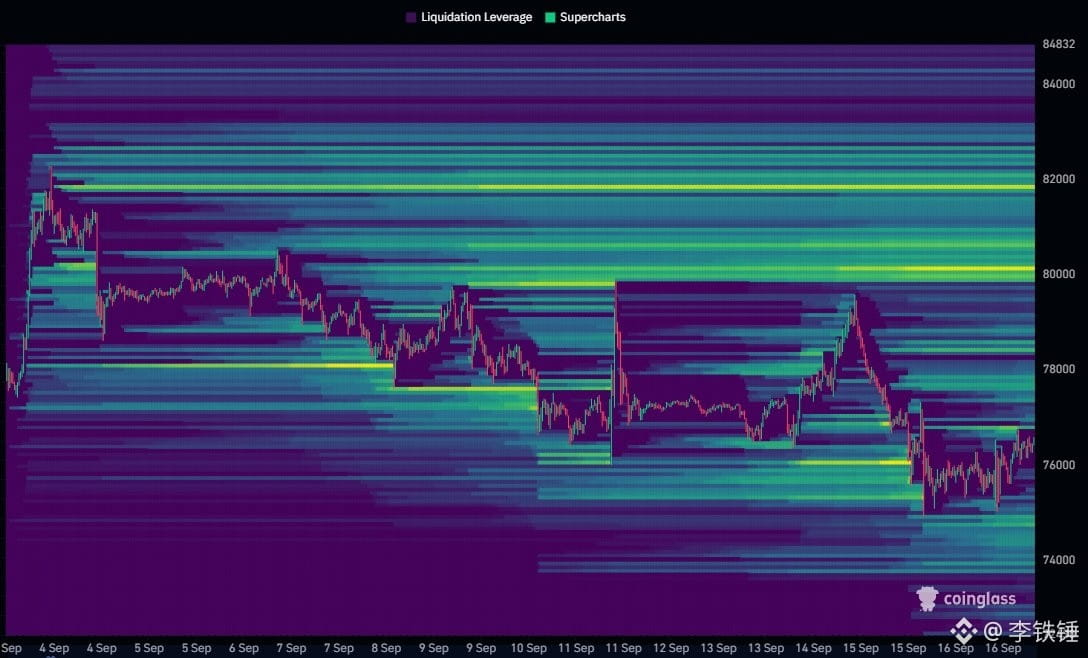
1. Daan Crypto Trades (@DaanCrypto) original view (September 17): BTC has already swept below the liquidity beneath the August lows; if it grinds back upward, 80,000 and 82,000 are the remaining major liquidity zones. Editor’s walkthrough: current price is around 76,393; first reclaim 77,100—only then does it have the qualification to look at 80,000.
2. Josh Olszewicz (@CarpeNoctom) original view (September 18): The 4-hour BTC chart has potential for a descending wedge. Editor’s walkthrough: the structure supports expectations for a rebound, but the confirmation point isn’t “see the wedge and chase”—it’s acceptance above 77,100.
3. Recent views from Pentoshi (@Pentosh1), Arthur Hayes (@CryptoHayes), and Altcoin Sherpa (@AltcoinSherpa) all point to: major coins are still ranging; for BTC, stability matters more than emotionally chasing longs. Editor’s walkthrough: today should be treated as range repair only, and not write the rebound as a one-way trend.
Single route: hold 75,700; first look at 76,500—77,100. After holding above 77,100, look at 80,000; if strength persists, then look at 82,000. If BTC breaks below 75,700 and the retest cannot reclaim 76,500, the route is invalid.
Risk warning: A summary of public viewpoints does not equal trading signals; contract leverage will amplify slippage, fees, and liquidation risk.
#BTC #ETH #BNB
【Top 10 Crypto Traders’ Highlights Today|BTC September 18】
Top 10 Crypto Traders’ Highlights Today|BTC September 18
Early session takeaway: BTC hasn’t truly broken out yet—it has swept the lows and is now waiting for confirmation.
1. Daan Crypto Trades (@DaanCrypto) original view (September 17): BTC has already swept below the liquidity beneath the August lows; if it grinds back upward, 80,000 and 82,000 are the remaining major liquidity zones. Editor’s walkthrough: current price is around 76,393; first reclaim 77,100—only then does it have the qualification to look at 80,000.
2. Josh Olszewicz (@CarpeNoctom) original view (September 18): The 4-hour BTC chart has potential for a descending wedge. Editor’s walkthrough: the structure supports expectations for a rebound, but the confirmation point isn’t “see the wedge and chase”—it’s acceptance above 77,100.
3. Recent views from Pentoshi (@Pentosh1), Arthur Hayes (@CryptoHayes), and Altcoin Sherpa (@AltcoinSherpa) all point to: major coins are still ranging; for BTC, stability matters more than emotionally chasing longs. Editor’s walkthrough: today should be treated as range repair only, and not write the rebound as a one-way trend.
Single route: hold 75,700; first look at 76,500—77,100. After holding above 77,100, look at 80,000; if strength persists, then look at 82,000. If BTC breaks below 75,700 and the retest cannot reclaim 76,500, the route is invalid.
Risk warning: A summary of public viewpoints does not equal trading signals; contract leverage will amplify slippage, fees, and liquidation risk.
#BTC #ETH #BNB
Top 10 Crypto Traders’ Highlights Today|BTC September 18
Early session takeaway: BTC hasn’t truly broken out yet—it has swept the lows and is now waiting for confirmation.
1. Daan Crypto Trades (@DaanCrypto) original view (September 17): BTC has already swept below the liquidity beneath the August lows; if it grinds back upward, 80,000 and 82,000 are the remaining major liquidity zones. Editor’s walkthrough: current price is around 76,393; first reclaim 77,100—only then does it have the qualification to look at 80,000.
2. Josh Olszewicz (@CarpeNoctom) original view (September 18): The 4-hour BTC chart has potential for a descending wedge. Editor’s walkthrough: the structure supports expectations for a rebound, but the confirmation point isn’t “see the wedge and chase”—it’s acceptance above 77,100.
3. Recent views from Pentoshi (@Pentosh1), Arthur Hayes (@CryptoHayes), and Altcoin Sherpa (@AltcoinSherpa) all point to: major coins are still ranging; for BTC, stability matters more than emotionally chasing longs. Editor’s walkthrough: today should be treated as range repair only, and not write the rebound as a one-way trend.
Single route: hold 75,700; first look at 76,500—77,100. After holding above 77,100, look at 80,000; if strength persists, then look at 82,000. If BTC breaks below 75,700 and the retest cannot reclaim 76,500, the route is invalid.
Risk warning: A summary of public viewpoints does not equal trading signals; contract leverage will amplify slippage, fees, and liquidation risk.
#BTC #ETH #BNB
23
·
--
【Top 10 Crypto Traders’ Highlights Today|ETH September 17】
In the midday, don’t rush to chase after ETH. The key is whether 2450 can hold steady.
Among trader opinions that can be verified over the past 24 hours, I’m not forcing it into ten—focusing on 5 key points:
1)BigCheds(@BigCheds)
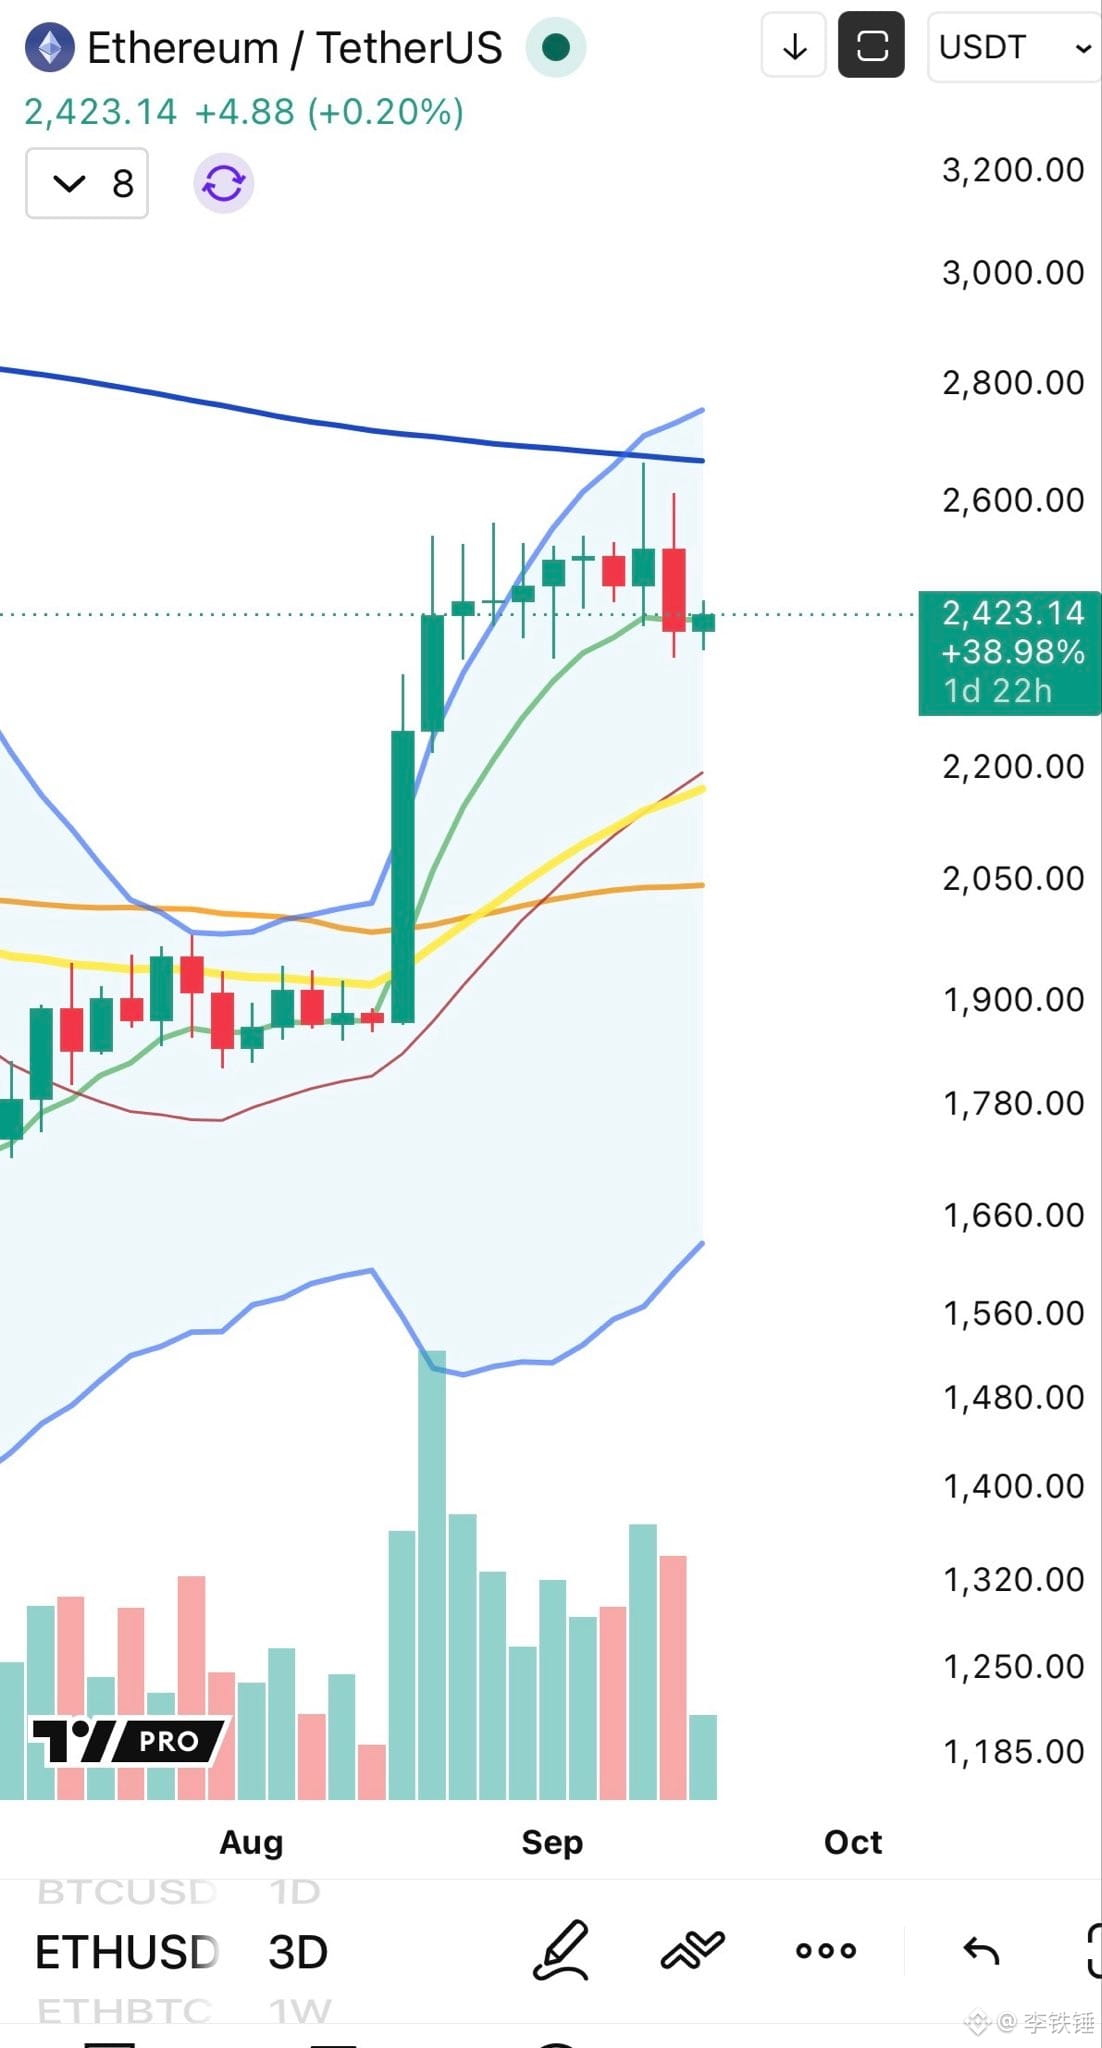
Original view: He posted an ETH 3-day chart, warning it could form a bearish checkmate.
Editorial analysis: This suggests ETH isn’t just breaking out strongly—it’s repeatedly confirming within the 2369–2445 range. If it can’t get above 2450, the outlook is weak, favoring consolidation near the highs.
2)Daan Crypto Trades(@DaanCrypto)
Original view: BTC is still around the August lows and near the 4H 200MA/EMA. After the FOMC and the address, major events that disturbed the market in the prior week are basically out of the way.
Editorial analysis: For ETH to keep repairing, the prerequisite is that BTC doesn’t drag risk appetite back down to the lower end of the range.
3)Arthur Hayes(@CryptoHayes)
Original view: In a high-debt environment, even rate hikes may stimulate demand for financial assets by boosting bank and short-term bond yields.
Editorial analysis: This is a mid-term liquidity-positive clue, but it doesn’t mean you can blindly chase longs right now at 2433.
4)The Flow Horse(@TheFlowHorse)
Original view: Joking about people who still judge BTC’s direction using funding rates.
Editorial analysis: ETH’s current funding rate isn’t extreme. In the midday, you should more directly watch whether price can accept and hold above 2450.
5)Peter Brandt(@PeterLBrandt)
Original view: Assume the next trade will lose. Uncertainty is usually resolved in the direction of the higher time frame.
Editorial analysis: So this trade path must have a clear invalidation level.
One route only: As long as ETH holds 2369, look for range-bound repair between 2369—2450. Only if it can build volume and stand above 2450, then pull back and hold 2430, would you then look for 2488—2520. A breakdown below 2369 invalidates this route.
Risk: After the FOMC, volatility may swing back and forth, and leveraged positions are prone to getting swept both ways. This article is a compilation of viewpoints, not investment advice.
Will you wait for ETH to firmly hold 2450, or wait to see reactions near 2369?
#BTC #ETH #BNB
【Top 10 Crypto Traders’ Highlights Today|ETH September 17】
In the midday, don’t rush to chase after ETH. The key is whether 2450 can hold steady.
Among trader opinions that can be verified over the past 24 hours, I’m not forcing it into ten—focusing on 5 key points:
1)BigCheds(@BigCheds)
Original view: He posted an ETH 3-day chart, warning it could form a bearish checkmate.
Editorial analysis: This suggests ETH isn’t just breaking out strongly—it’s repeatedly confirming within the 2369–2445 range. If it can’t get above 2450, the outlook is weak, favoring consolidation near the highs.
2)Daan Crypto Trades(@DaanCrypto)
Original view: BTC is still around the August lows and near the 4H 200MA/EMA. After the FOMC and the address, major events that disturbed the market in the prior week are basically out of the way.
Editorial analysis: For ETH to keep repairing, the prerequisite is that BTC doesn’t drag risk appetite back down to the lower end of the range.
3)Arthur Hayes(@CryptoHayes)
Original view: In a high-debt environment, even rate hikes may stimulate demand for financial assets by boosting bank and short-term bond yields.
Editorial analysis: This is a mid-term liquidity-positive clue, but it doesn’t mean you can blindly chase longs right now at 2433.
4)The Flow Horse(@TheFlowHorse)
Original view: Joking about people who still judge BTC’s direction using funding rates.
Editorial analysis: ETH’s current funding rate isn’t extreme. In the midday, you should more directly watch whether price can accept and hold above 2450.
5)Peter Brandt(@PeterLBrandt)
Original view: Assume the next trade will lose. Uncertainty is usually resolved in the direction of the higher time frame.
Editorial analysis: So this trade path must have a clear invalidation level.
One route only: As long as ETH holds 2369, look for range-bound repair between 2369—2450. Only if it can build volume and stand above 2450, then pull back and hold 2430, would you then look for 2488—2520. A breakdown below 2369 invalidates this route.
Risk: After the FOMC, volatility may swing back and forth, and leveraged positions are prone to getting swept both ways. This article is a compilation of viewpoints, not investment advice.
Will you wait for ETH to firmly hold 2450, or wait to see reactions near 2369?
#BTC #ETH #BNB
In the midday, don’t rush to chase after ETH. The key is whether 2450 can hold steady.
Among trader opinions that can be verified over the past 24 hours, I’m not forcing it into ten—focusing on 5 key points:
1)BigCheds(@BigCheds)
Original view: He posted an ETH 3-day chart, warning it could form a bearish checkmate.
Editorial analysis: This suggests ETH isn’t just breaking out strongly—it’s repeatedly confirming within the 2369–2445 range. If it can’t get above 2450, the outlook is weak, favoring consolidation near the highs.
2)Daan Crypto Trades(@DaanCrypto)
Original view: BTC is still around the August lows and near the 4H 200MA/EMA. After the FOMC and the address, major events that disturbed the market in the prior week are basically out of the way.
Editorial analysis: For ETH to keep repairing, the prerequisite is that BTC doesn’t drag risk appetite back down to the lower end of the range.
3)Arthur Hayes(@CryptoHayes)
Original view: In a high-debt environment, even rate hikes may stimulate demand for financial assets by boosting bank and short-term bond yields.
Editorial analysis: This is a mid-term liquidity-positive clue, but it doesn’t mean you can blindly chase longs right now at 2433.
4)The Flow Horse(@TheFlowHorse)
Original view: Joking about people who still judge BTC’s direction using funding rates.
Editorial analysis: ETH’s current funding rate isn’t extreme. In the midday, you should more directly watch whether price can accept and hold above 2450.
5)Peter Brandt(@PeterLBrandt)
Original view: Assume the next trade will lose. Uncertainty is usually resolved in the direction of the higher time frame.
Editorial analysis: So this trade path must have a clear invalidation level.
One route only: As long as ETH holds 2369, look for range-bound repair between 2369—2450. Only if it can build volume and stand above 2450, then pull back and hold 2430, would you then look for 2488—2520. A breakdown below 2369 invalidates this route.
Risk: After the FOMC, volatility may swing back and forth, and leveraged positions are prone to getting swept both ways. This article is a compilation of viewpoints, not investment advice.
Will you wait for ETH to firmly hold 2450, or wait to see reactions near 2369?
#BTC #ETH #BNB
1
203
·
--
[Top 10 Crypto Traders’ Highlights Today | BTC September 16]
For the evening BTC: rebound from the lower end of the range—first wait for confirmation at 76400
BTC now looks more like a “rebound confirmation” from the lower end of a range, not a buy point where you can simply guess the bottom.
1. Daan Crypto Trades(@DaanCrypto, original post 2026-09-16):BTC is positioned at the lower end of the range. With around 90% rate-hike expectations already priced in before the FOMC, the key is whether the outlook stays hawkish afterward. If it seems like a one-time move, risk assets may rebound. He also mentioned on 2026-09-15 that the first step is to reclaim 76400.
2. DonAlt(@DonAlt, original post 2026-09-16):publicly stated that he remains moderately bullish, but didn’t provide specific entry levels—so it can only serve as directional background.
The original view doesn’t equal my conclusion. Based on live conditions: as of 18:28 CST, Binance BTCUSDT spot is about 75,972, down about 1.216% over 24 hours. The perpetual mark price is about 75,927, funding rate around 0.002618%, and open interest about 106,991.762 BTC.
Main edit route: first see whether it can hold above 76400; once it holds, then look at the repair range of 76800—77300. The 4-hour low is around 75,350; if it breaks, the route is invalid.
Conditions to apply: hold 76400, and pullbacks should not quickly fall back.
Risks: FOMC, the US dollar, and liquidity can cause technical levels to fail quickly. Leverage amplifies slippage, liquidation risk, and funding-rate costs. No profit is promised; this does not constitute investment advice.
Will you wait for 76400 to be reclaimed, or keep waiting?
#BTC #ETH #BNB
[Top 10 Crypto Traders’ Highlights Today | BTC September 16]
For the evening BTC: rebound from the lower end of the range—first wait for confirmation at 76400
BTC now looks more like a “rebound confirmation” from the lower end of a range, not a buy point where you can simply guess the bottom.
1. Daan Crypto Trades(@DaanCrypto, original post 2026-09-16):BTC is positioned at the lower end of the range. With around 90% rate-hike expectations already priced in before the FOMC, the key is whether the outlook stays hawkish afterward. If it seems like a one-time move, risk assets may rebound. He also mentioned on 2026-09-15 that the first step is to reclaim 76400.
2. DonAlt(@DonAlt, original post 2026-09-16):publicly stated that he remains moderately bullish, but didn’t provide specific entry levels—so it can only serve as directional background.
The original view doesn’t equal my conclusion. Based on live conditions: as of 18:28 CST, Binance BTCUSDT spot is about 75,972, down about 1.216% over 24 hours. The perpetual mark price is about 75,927, funding rate around 0.002618%, and open interest about 106,991.762 BTC.
Main edit route: first see whether it can hold above 76400; once it holds, then look at the repair range of 76800—77300. The 4-hour low is around 75,350; if it breaks, the route is invalid.
Conditions to apply: hold 76400, and pullbacks should not quickly fall back.
Risks: FOMC, the US dollar, and liquidity can cause technical levels to fail quickly. Leverage amplifies slippage, liquidation risk, and funding-rate costs. No profit is promised; this does not constitute investment advice.
Will you wait for 76400 to be reclaimed, or keep waiting?
#BTC #ETH #BNB
For the evening BTC: rebound from the lower end of the range—first wait for confirmation at 76400
BTC now looks more like a “rebound confirmation” from the lower end of a range, not a buy point where you can simply guess the bottom.
1. Daan Crypto Trades(@DaanCrypto, original post 2026-09-16):BTC is positioned at the lower end of the range. With around 90% rate-hike expectations already priced in before the FOMC, the key is whether the outlook stays hawkish afterward. If it seems like a one-time move, risk assets may rebound. He also mentioned on 2026-09-15 that the first step is to reclaim 76400.
2. DonAlt(@DonAlt, original post 2026-09-16):publicly stated that he remains moderately bullish, but didn’t provide specific entry levels—so it can only serve as directional background.
The original view doesn’t equal my conclusion. Based on live conditions: as of 18:28 CST, Binance BTCUSDT spot is about 75,972, down about 1.216% over 24 hours. The perpetual mark price is about 75,927, funding rate around 0.002618%, and open interest about 106,991.762 BTC.
Main edit route: first see whether it can hold above 76400; once it holds, then look at the repair range of 76800—77300. The 4-hour low is around 75,350; if it breaks, the route is invalid.
Conditions to apply: hold 76400, and pullbacks should not quickly fall back.
Risks: FOMC, the US dollar, and liquidity can cause technical levels to fail quickly. Leverage amplifies slippage, liquidation risk, and funding-rate costs. No profit is promised; this does not constitute investment advice.
Will you wait for 76400 to be reclaimed, or keep waiting?
#BTC #ETH #BNB
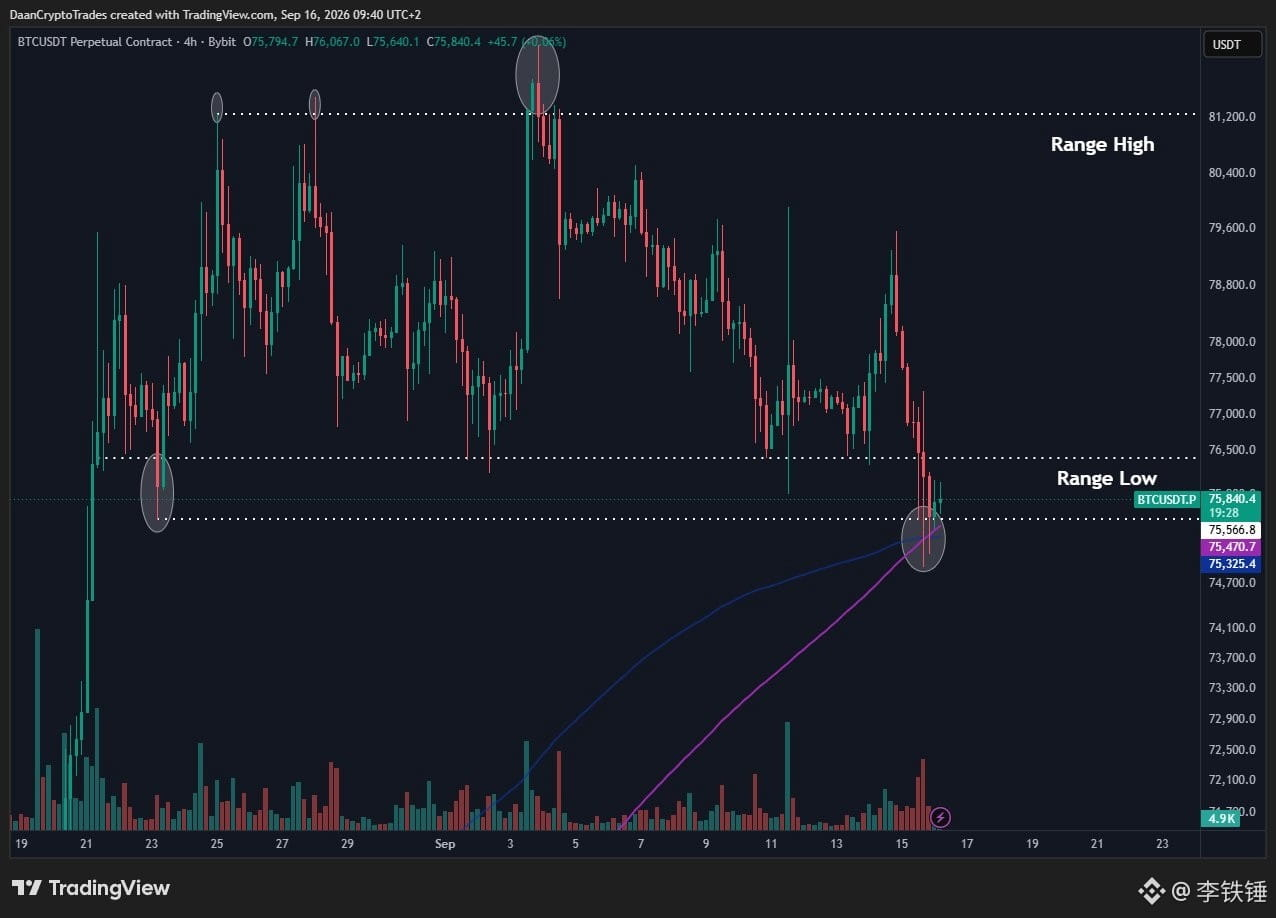
1
244
·
--
【Top 10 Crypto Traders’ Highlights Today|BTC September 15】
Tonight’s BTC: Don’t mistake fluctuations near the lower end of the range as confirmation of a trend
BTC now looks more like it’s making a choice along the lower edge of a high-volatility range. Daan Crypto Trades (@DaanCrypto) in the September 14 original post treated 74,000 and 83,000 as key levels for a higher timeframe; Cheds Trading (@BigCheds) in the September 15 original post pointed out that the 4-hour SMA is around 75,000. These viewpoints are not immediate signals.
Based on real-time data at 18:39: spot price 76,899, 24h -1.323%, high 79,570, low 76,667; perpetual mark price 76,876, funding rate 0.00007318. The editor provides only one path: if the 4-hour chart holds 76,700 and reclaims 77,060, watch 77,930, then 79,570; if the 4-hour close breaks below 76,600, the idea is invalidated—stop chasing. All the above levels are the editor’s scenario analysis and do not belong to any trader.
Risk: Wicks, slippage, liquidations, and leverage will amplify losses, and no outcome is guaranteed. Will you wait for confirmation at 77,060, or keep watching from the sidelines?
#BTC #ETH #BNB
【Top 10 Crypto Traders’ Highlights Today|BTC September 15】
Tonight’s BTC: Don’t mistake fluctuations near the lower end of the range as confirmation of a trend
BTC now looks more like it’s making a choice along the lower edge of a high-volatility range. Daan Crypto Trades (@DaanCrypto) in the September 14 original post treated 74,000 and 83,000 as key levels for a higher timeframe; Cheds Trading (@BigCheds) in the September 15 original post pointed out that the 4-hour SMA is around 75,000. These viewpoints are not immediate signals.
Based on real-time data at 18:39: spot price 76,899, 24h -1.323%, high 79,570, low 76,667; perpetual mark price 76,876, funding rate 0.00007318. The editor provides only one path: if the 4-hour chart holds 76,700 and reclaims 77,060, watch 77,930, then 79,570; if the 4-hour close breaks below 76,600, the idea is invalidated—stop chasing. All the above levels are the editor’s scenario analysis and do not belong to any trader.
Risk: Wicks, slippage, liquidations, and leverage will amplify losses, and no outcome is guaranteed. Will you wait for confirmation at 77,060, or keep watching from the sidelines?
#BTC #ETH #BNB
Tonight’s BTC: Don’t mistake fluctuations near the lower end of the range as confirmation of a trend
BTC now looks more like it’s making a choice along the lower edge of a high-volatility range. Daan Crypto Trades (@DaanCrypto) in the September 14 original post treated 74,000 and 83,000 as key levels for a higher timeframe; Cheds Trading (@BigCheds) in the September 15 original post pointed out that the 4-hour SMA is around 75,000. These viewpoints are not immediate signals.
Based on real-time data at 18:39: spot price 76,899, 24h -1.323%, high 79,570, low 76,667; perpetual mark price 76,876, funding rate 0.00007318. The editor provides only one path: if the 4-hour chart holds 76,700 and reclaims 77,060, watch 77,930, then 79,570; if the 4-hour close breaks below 76,600, the idea is invalidated—stop chasing. All the above levels are the editor’s scenario analysis and do not belong to any trader.
Risk: Wicks, slippage, liquidations, and leverage will amplify losses, and no outcome is guaranteed. Will you wait for confirmation at 77,060, or keep watching from the sidelines?
#BTC #ETH #BNB
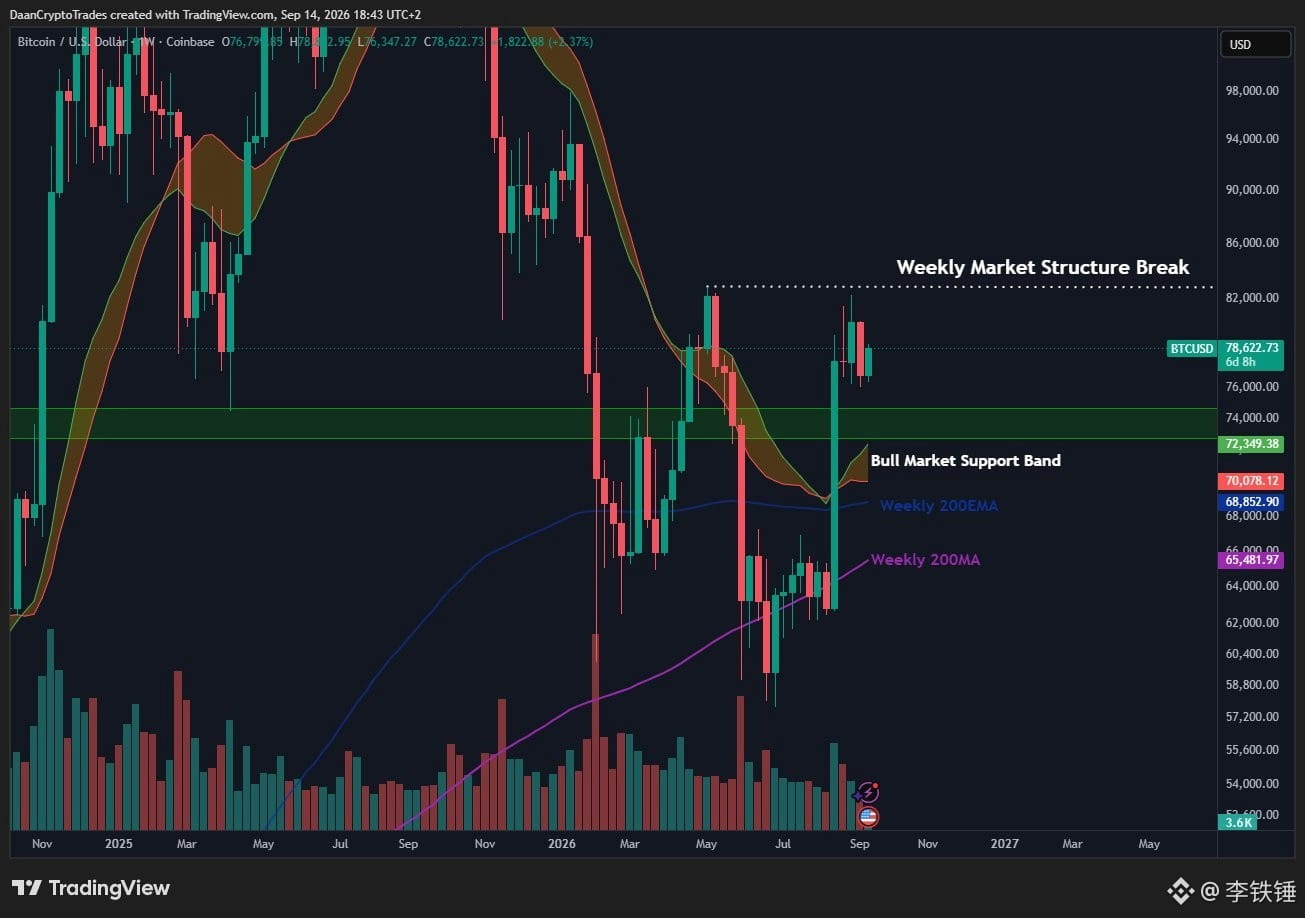
165
·
--
【Top 10 Crypto Traders’ Highlights Today|ETH September 15】
ETH is not a good spot to chase higher directly right now: 2488—2500, first look for support and follow-through. After regaining 2520, then observe for a move toward 2800. A valid breakdown below 2487 will invalidate this path.
1. Daan Crypto Trades|@DaanCrypto (Original post: September 15): The initial view was that the lower timeframe isn’t very clean, but local support remains and there’s still a chance to reach 2800. The editor’s live-trade scenario: current price is 2503, the 24h low is 2487.84. 2487 is the invalidation reference; 2520 is the level to regain and then observe.
2. The Flow Horse|@TheFlowHorse (Original post: September 15): The original view was that Ethereum trading is relatively constructive, possibly preparing for another push higher, but there are still chop and traps, and the author says they remain bullish. Editor’s scenario: when the current price is below the weighted average at 2530, only a return to 2520 would support the upside assumption.
3. Altcoin Sherpa|@AltcoinSherpa (Original post: September 15): The original view was to watch for repeated wick pokes in ETH. Editor’s scenario: this is a volatility observation, not an independent bullish signal.
This time, only 3 recent traders are verified to meet the minimum backstop evidence requirement, but it’s not a complete “Top 10” sample. Market snapshot: Binance spot ETHUSDT at 11:31, 2502.78, 24h -0.493%, low 2487.84.
2800 is an observation level near resistance, not a guaranteed outcome. Risks: the chart is ETH/USD 3-day; volatility, slippage, fees, funding rates, and leveraged liquidations may all amplify losses. No profit is promised, and this does not constitute trading advice. Will you wait for 2520 to hold firmly, or wait for a pullback?
#BTC #ETH #BNB
【Top 10 Crypto Traders’ Highlights Today|ETH September 15】
ETH is not a good spot to chase higher directly right now: 2488—2500, first look for support and follow-through. After regaining 2520, then observe for a move toward 2800. A valid breakdown below 2487 will invalidate this path.
1. Daan Crypto Trades|@DaanCrypto (Original post: September 15): The initial view was that the lower timeframe isn’t very clean, but local support remains and there’s still a chance to reach 2800. The editor’s live-trade scenario: current price is 2503, the 24h low is 2487.84. 2487 is the invalidation reference; 2520 is the level to regain and then observe.
2. The Flow Horse|@TheFlowHorse (Original post: September 15): The original view was that Ethereum trading is relatively constructive, possibly preparing for another push higher, but there are still chop and traps, and the author says they remain bullish. Editor’s scenario: when the current price is below the weighted average at 2530, only a return to 2520 would support the upside assumption.
3. Altcoin Sherpa|@AltcoinSherpa (Original post: September 15): The original view was to watch for repeated wick pokes in ETH. Editor’s scenario: this is a volatility observation, not an independent bullish signal.
This time, only 3 recent traders are verified to meet the minimum backstop evidence requirement, but it’s not a complete “Top 10” sample. Market snapshot: Binance spot ETHUSDT at 11:31, 2502.78, 24h -0.493%, low 2487.84.
2800 is an observation level near resistance, not a guaranteed outcome. Risks: the chart is ETH/USD 3-day; volatility, slippage, fees, funding rates, and leveraged liquidations may all amplify losses. No profit is promised, and this does not constitute trading advice. Will you wait for 2520 to hold firmly, or wait for a pullback?
#BTC #ETH #BNB
ETH is not a good spot to chase higher directly right now: 2488—2500, first look for support and follow-through. After regaining 2520, then observe for a move toward 2800. A valid breakdown below 2487 will invalidate this path.
1. Daan Crypto Trades|@DaanCrypto (Original post: September 15): The initial view was that the lower timeframe isn’t very clean, but local support remains and there’s still a chance to reach 2800. The editor’s live-trade scenario: current price is 2503, the 24h low is 2487.84. 2487 is the invalidation reference; 2520 is the level to regain and then observe.
2. The Flow Horse|@TheFlowHorse (Original post: September 15): The original view was that Ethereum trading is relatively constructive, possibly preparing for another push higher, but there are still chop and traps, and the author says they remain bullish. Editor’s scenario: when the current price is below the weighted average at 2530, only a return to 2520 would support the upside assumption.
3. Altcoin Sherpa|@AltcoinSherpa (Original post: September 15): The original view was to watch for repeated wick pokes in ETH. Editor’s scenario: this is a volatility observation, not an independent bullish signal.
This time, only 3 recent traders are verified to meet the minimum backstop evidence requirement, but it’s not a complete “Top 10” sample. Market snapshot: Binance spot ETHUSDT at 11:31, 2502.78, 24h -0.493%, low 2487.84.
2800 is an observation level near resistance, not a guaranteed outcome. Risks: the chart is ETH/USD 3-day; volatility, slippage, fees, funding rates, and leveraged liquidations may all amplify losses. No profit is promised, and this does not constitute trading advice. Will you wait for 2520 to hold firmly, or wait for a pullback?
#BTC #ETH #BNB
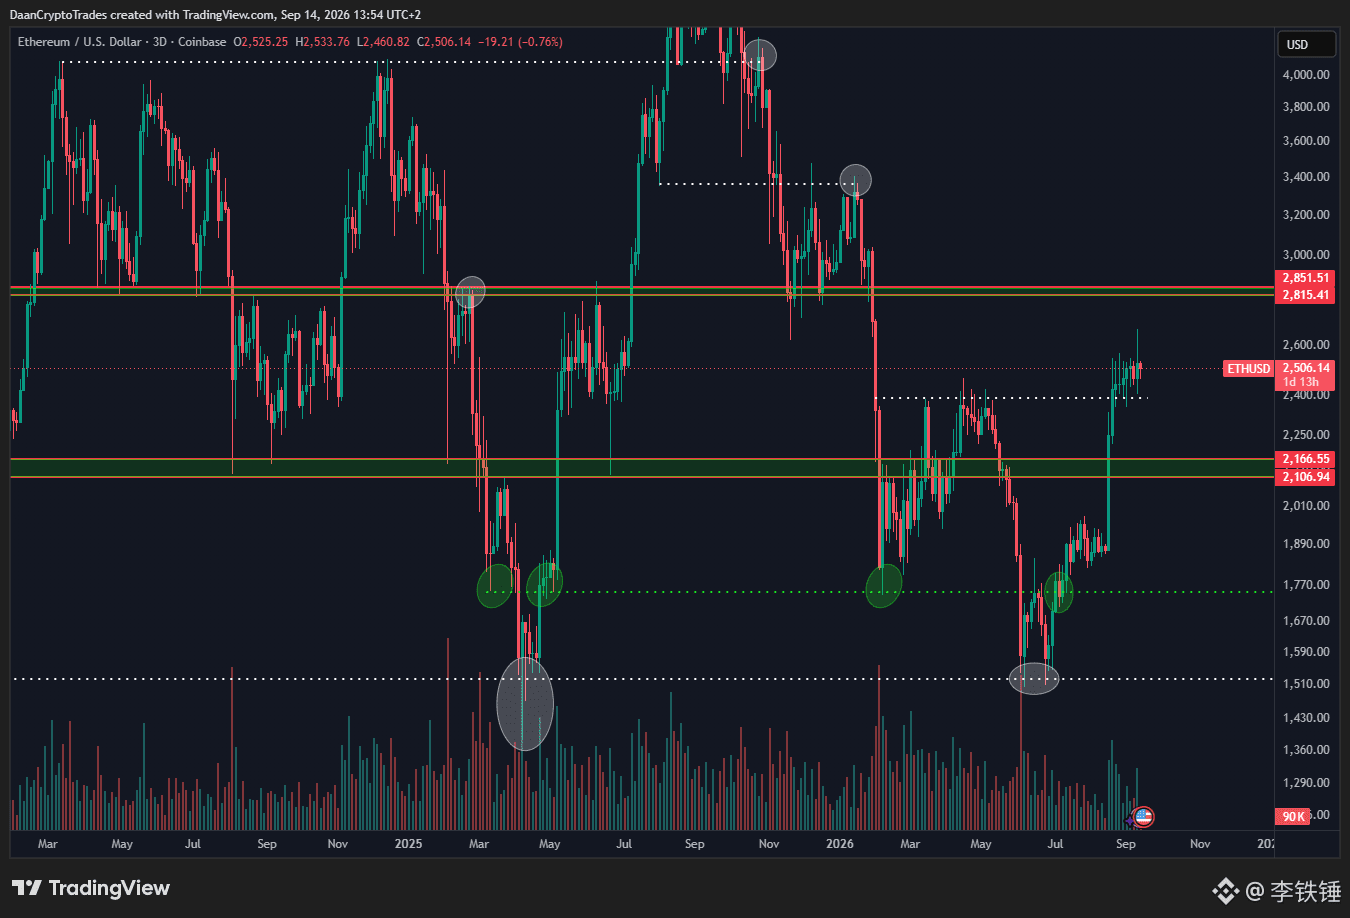
185
·
--
【Top 10 Crypto Traders’ Highlights Today|BTC September 14】
Top 10 Crypto Traders’ Highlights Today|BTC September 14】
Strictly speaking, there were insufficient viewpoints from the past 24 hours; this article has been expanded, with authorization, to cover roughly the last 7 days. It uses the smallest set of verifiable evidence with 2 credible viewpoints, and does not pretend to be a complete “top 10.”
1)Daan Crypto Trades (X: @DaanCrypto, original post 2026-09-13)
Original view: BTC is ranging near higher-timeframe resistance; 83000 has liquidity significance; holding 73000—74000 is what maintains the bullish view for the higher timeframes.
Editorial scenario: Binance BTCUSDT is around 77960; the 24-hour high is 78374 and the low is 76389. The only route: after establishing above 80000, watch 82500—83000; if it breaks below 76389, or if after standing above 80000 it quickly reclaims, the route is invalidated. If it further breaks below 74000, bullish conditions are weakened.
2)Trader XO (X: @Trader_XO, original post 2026-09-11)
Original view: BTC is suppressed by the 50-week moving average; it needs an effective reclaim and acceptance above it to be closer to a bull market confirmation. For now, it remains range-bound.
Editorial scenario: 80000 is a confirmation observation level, not a buy signal. Perpetual mark price is about 77922; funding rate is about 0.004885%; open interest is 106054 BTC. Leverage, slippage, fake breakouts, and event-driven volatility may amplify losses. No promises of returns, and not investment advice.
#BTC #ETH #BNB
【Top 10 Crypto Traders’ Highlights Today|BTC September 14】
Top 10 Crypto Traders’ Highlights Today|BTC September 14】
Strictly speaking, there were insufficient viewpoints from the past 24 hours; this article has been expanded, with authorization, to cover roughly the last 7 days. It uses the smallest set of verifiable evidence with 2 credible viewpoints, and does not pretend to be a complete “top 10.”
1)Daan Crypto Trades (X: @DaanCrypto, original post 2026-09-13)
Original view: BTC is ranging near higher-timeframe resistance; 83000 has liquidity significance; holding 73000—74000 is what maintains the bullish view for the higher timeframes.
Editorial scenario: Binance BTCUSDT is around 77960; the 24-hour high is 78374 and the low is 76389. The only route: after establishing above 80000, watch 82500—83000; if it breaks below 76389, or if after standing above 80000 it quickly reclaims, the route is invalidated. If it further breaks below 74000, bullish conditions are weakened.
2)Trader XO (X: @Trader_XO, original post 2026-09-11)
Original view: BTC is suppressed by the 50-week moving average; it needs an effective reclaim and acceptance above it to be closer to a bull market confirmation. For now, it remains range-bound.
Editorial scenario: 80000 is a confirmation observation level, not a buy signal. Perpetual mark price is about 77922; funding rate is about 0.004885%; open interest is 106054 BTC. Leverage, slippage, fake breakouts, and event-driven volatility may amplify losses. No promises of returns, and not investment advice.
#BTC #ETH #BNB
Top 10 Crypto Traders’ Highlights Today|BTC September 14】
Strictly speaking, there were insufficient viewpoints from the past 24 hours; this article has been expanded, with authorization, to cover roughly the last 7 days. It uses the smallest set of verifiable evidence with 2 credible viewpoints, and does not pretend to be a complete “top 10.”
1)Daan Crypto Trades (X: @DaanCrypto, original post 2026-09-13)
Original view: BTC is ranging near higher-timeframe resistance; 83000 has liquidity significance; holding 73000—74000 is what maintains the bullish view for the higher timeframes.
Editorial scenario: Binance BTCUSDT is around 77960; the 24-hour high is 78374 and the low is 76389. The only route: after establishing above 80000, watch 82500—83000; if it breaks below 76389, or if after standing above 80000 it quickly reclaims, the route is invalidated. If it further breaks below 74000, bullish conditions are weakened.
2)Trader XO (X: @Trader_XO, original post 2026-09-11)
Original view: BTC is suppressed by the 50-week moving average; it needs an effective reclaim and acceptance above it to be closer to a bull market confirmation. For now, it remains range-bound.
Editorial scenario: 80000 is a confirmation observation level, not a buy signal. Perpetual mark price is about 77922; funding rate is about 0.004885%; open interest is 106054 BTC. Leverage, slippage, fake breakouts, and event-driven volatility may amplify losses. No promises of returns, and not investment advice.
#BTC #ETH #BNB
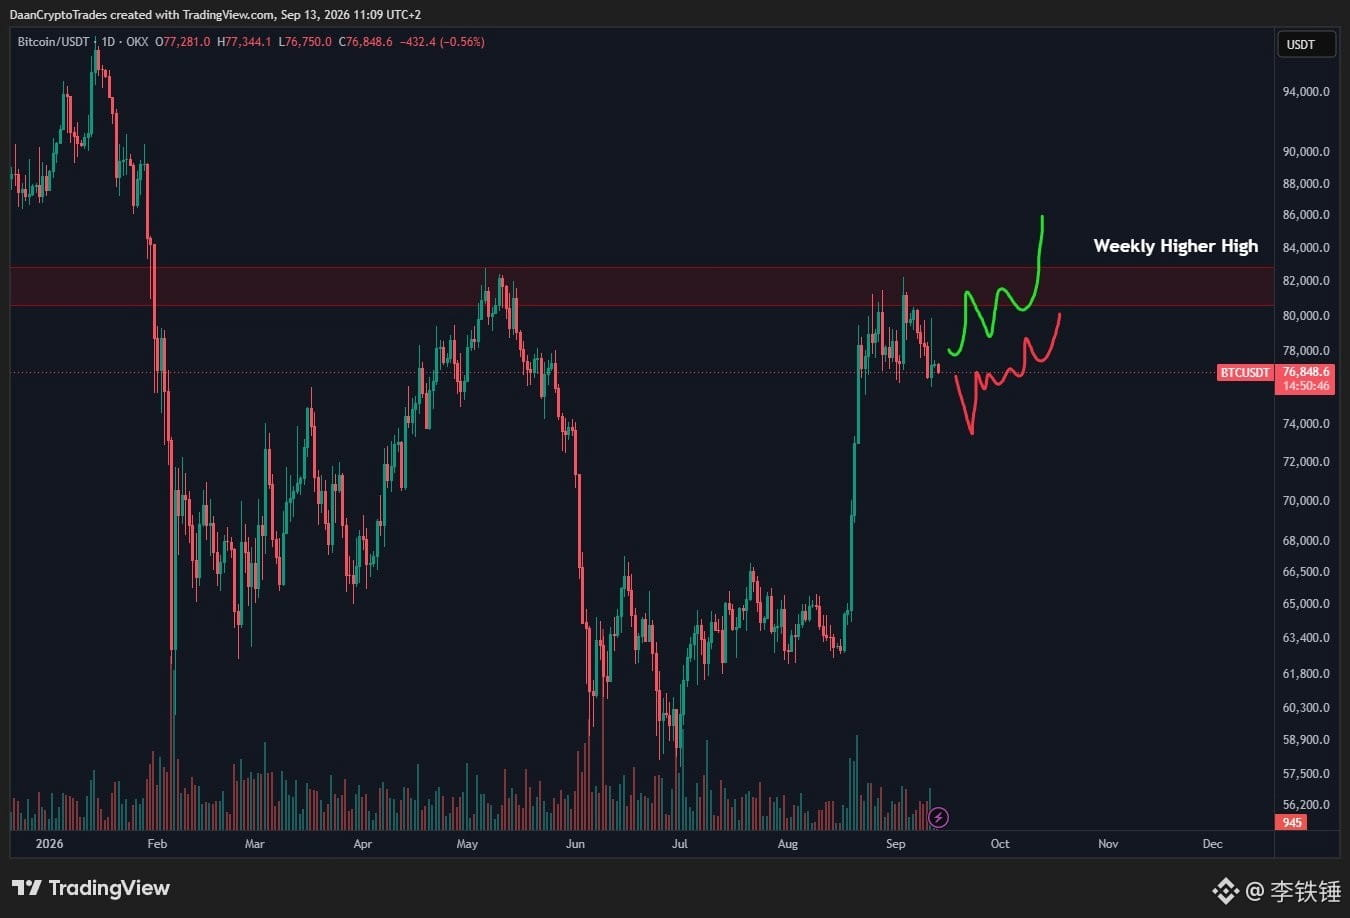
102
·
--
【Top 10 Crypto Traders’ Key Takeaways Today|BTC September 14】
BTC Morning Watch: A drop doesn’t necessarily mean a buy—the key is whether the defense zone can be held
Current BTC is around 76706. Binance 24h high 77450, low 76500; 4h low around 76623. Today, we only look at one route: pull back first—see whether 74000–76000 can hold. Only if BTC reclaims and stabilizes above 80000, then we look at 83000. An effective breakdown of 73000–74000, or a quick snap-back after a breakout means the route is invalid.
1)Daan Crypto Trades (X: @DaanCrypto, original post 2026-09-13 UTC)
Original view: BTC is near resistance in a higher cycle; 83000 could be a liquidity target. The key to maintaining a bullish stance in the mid-to-high timeframe is 73000–74000.
Editor’s take: The current price is still below the resistance level. 83000 is only a conditional target, not a guaranteed price to reach.
2)Trader XO (X: @Trader_XO, original post 2026-09-11 UTC)
Original view: BTC is being suppressed by the 50-week moving average. It needs to reclaim and accept above it to be considered strong. Until then, it’s still a range—don’t chase longs aggressively.
Editor’s take: In execution, wait for “reclaim + accept.” Don’t chase with a single sudden breakout candle.
FOMC, low liquidity, leverage, slippage, and the risk of fake breakouts are all high. No promises of profits. Use strict stop-losses and only trade within your means. Will you wait for acceptance above 80000, or treat the loss of 73000–74000 as your risk trigger?
Source: Daan Crypto Trades https://x.com/DaanCrypto/status/2099226862006288420; Trader XO https://x.com/Trader_XO/status/2098464299173740997
#BTC #ETH #BNB
【Top 10 Crypto Traders’ Key Takeaways Today|BTC September 14】
BTC Morning Watch: A drop doesn’t necessarily mean a buy—the key is whether the defense zone can be held
Current BTC is around 76706. Binance 24h high 77450, low 76500; 4h low around 76623. Today, we only look at one route: pull back first—see whether 74000–76000 can hold. Only if BTC reclaims and stabilizes above 80000, then we look at 83000. An effective breakdown of 73000–74000, or a quick snap-back after a breakout means the route is invalid.
1)Daan Crypto Trades (X: @DaanCrypto, original post 2026-09-13 UTC)
Original view: BTC is near resistance in a higher cycle; 83000 could be a liquidity target. The key to maintaining a bullish stance in the mid-to-high timeframe is 73000–74000.
Editor’s take: The current price is still below the resistance level. 83000 is only a conditional target, not a guaranteed price to reach.
2)Trader XO (X: @Trader_XO, original post 2026-09-11 UTC)
Original view: BTC is being suppressed by the 50-week moving average. It needs to reclaim and accept above it to be considered strong. Until then, it’s still a range—don’t chase longs aggressively.
Editor’s take: In execution, wait for “reclaim + accept.” Don’t chase with a single sudden breakout candle.
FOMC, low liquidity, leverage, slippage, and the risk of fake breakouts are all high. No promises of profits. Use strict stop-losses and only trade within your means. Will you wait for acceptance above 80000, or treat the loss of 73000–74000 as your risk trigger?
Source: Daan Crypto Trades https://x.com/DaanCrypto/status/2099226862006288420; Trader XO https://x.com/Trader_XO/status/2098464299173740997
#BTC #ETH #BNB
BTC Morning Watch: A drop doesn’t necessarily mean a buy—the key is whether the defense zone can be held
Current BTC is around 76706. Binance 24h high 77450, low 76500; 4h low around 76623. Today, we only look at one route: pull back first—see whether 74000–76000 can hold. Only if BTC reclaims and stabilizes above 80000, then we look at 83000. An effective breakdown of 73000–74000, or a quick snap-back after a breakout means the route is invalid.
1)Daan Crypto Trades (X: @DaanCrypto, original post 2026-09-13 UTC)
Original view: BTC is near resistance in a higher cycle; 83000 could be a liquidity target. The key to maintaining a bullish stance in the mid-to-high timeframe is 73000–74000.
Editor’s take: The current price is still below the resistance level. 83000 is only a conditional target, not a guaranteed price to reach.
2)Trader XO (X: @Trader_XO, original post 2026-09-11 UTC)
Original view: BTC is being suppressed by the 50-week moving average. It needs to reclaim and accept above it to be considered strong. Until then, it’s still a range—don’t chase longs aggressively.
Editor’s take: In execution, wait for “reclaim + accept.” Don’t chase with a single sudden breakout candle.
FOMC, low liquidity, leverage, slippage, and the risk of fake breakouts are all high. No promises of profits. Use strict stop-losses and only trade within your means. Will you wait for acceptance above 80000, or treat the loss of 73000–74000 as your risk trigger?
Source: Daan Crypto Trades https://x.com/DaanCrypto/status/2099226862006288420; Trader XO https://x.com/Trader_XO/status/2098464299173740997
#BTC #ETH #BNB
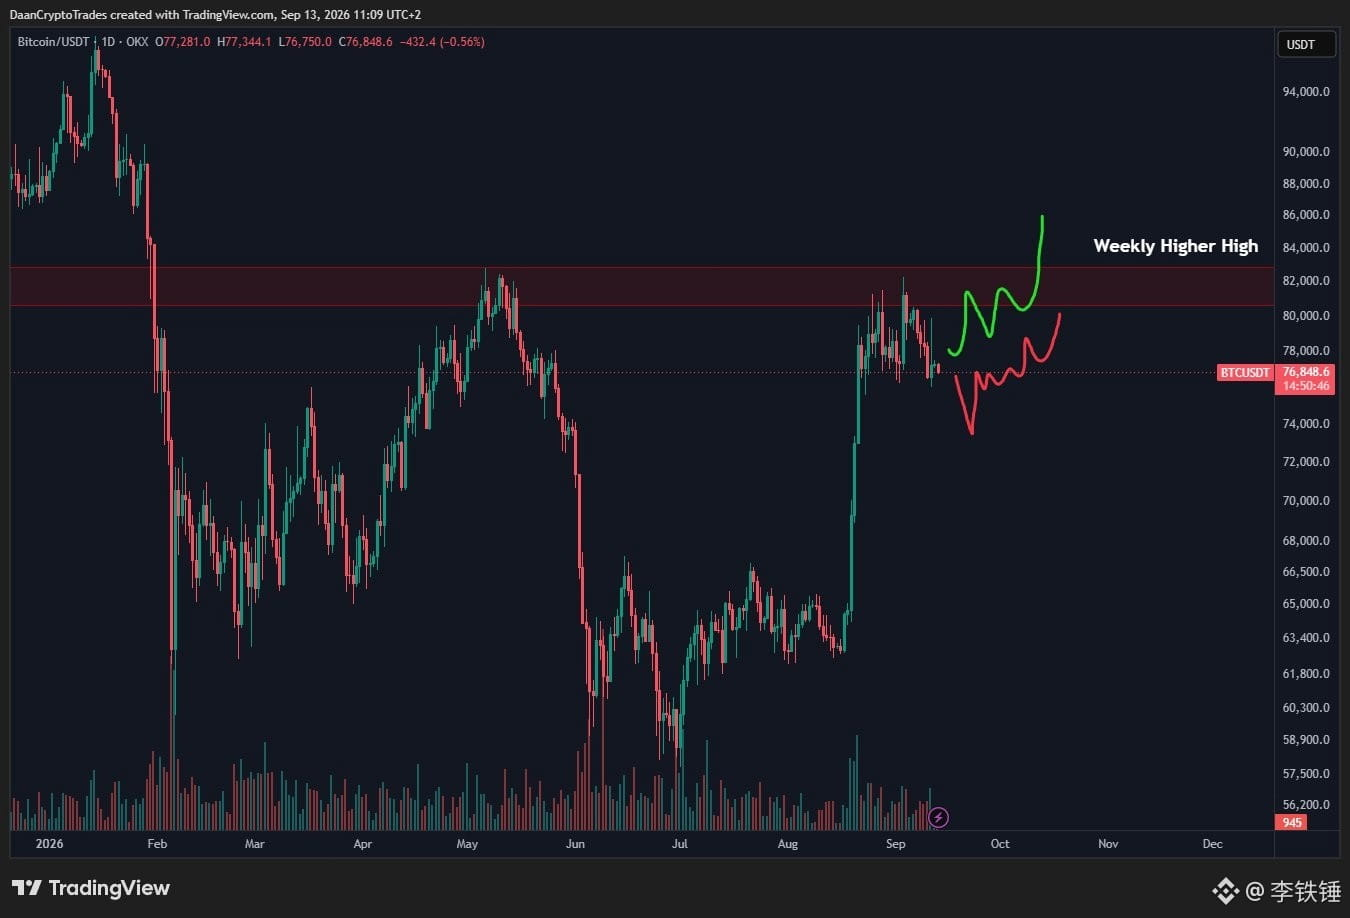
87
·
--
【Top 10 Crypto Traders’ Highlights Today|BTC September 13】
Let’s start with the conclusion: there aren’t ten people filled today, but we have verified 2 traders from recent coverage. The shared takeaway is not “jump in long right away”; rather, BTC is still trading within a range, and any breakout needs confirmation.
1. Daan Crypto Trades (X: @DaanCrypto)
Original view (2026-09-12): The weekly chart hasn’t seen major changes. BTC remains roughly between the May high around 83,000 and the key support around 74,000.
2. XO (X: @Trader_XO)
Original view (2026-09-11): BTC was again rejected from the 50-week moving average. Only if it reclaims that level and gains acceptance above it—while also seeing strong passive capital inflows—would it be closer to a bull-market state. Previously, it has still been a range.
Editor’s scenario based on live market conditions (2026-09-13 07:29 CST): Binance spot is 77,251.64; 24h +0.080%. High 77,505.67, low 77,059.75. Futures mark price 77,220.61; funding rate +0.004253%. The only main route is to hold range trading above 74,000 and wait for an effective breakout above 83,000. If it breaks below 74,000, that route becomes invalid, and you should not chase orders in the middle of the range. Leverage, slippage, and liquidation risks are to be borne by you yourself and do not constitute investment advice.
The evidence roundup doesn’t reach ten people—don’t treat this post as a complete “Top 10.”
#BTC #ETH #BNB
【Top 10 Crypto Traders’ Highlights Today|BTC September 13】
Let’s start with the conclusion: there aren’t ten people filled today, but we have verified 2 traders from recent coverage. The shared takeaway is not “jump in long right away”; rather, BTC is still trading within a range, and any breakout needs confirmation.
1. Daan Crypto Trades (X: @DaanCrypto)
Original view (2026-09-12): The weekly chart hasn’t seen major changes. BTC remains roughly between the May high around 83,000 and the key support around 74,000.
2. XO (X: @Trader_XO)
Original view (2026-09-11): BTC was again rejected from the 50-week moving average. Only if it reclaims that level and gains acceptance above it—while also seeing strong passive capital inflows—would it be closer to a bull-market state. Previously, it has still been a range.
Editor’s scenario based on live market conditions (2026-09-13 07:29 CST): Binance spot is 77,251.64; 24h +0.080%. High 77,505.67, low 77,059.75. Futures mark price 77,220.61; funding rate +0.004253%. The only main route is to hold range trading above 74,000 and wait for an effective breakout above 83,000. If it breaks below 74,000, that route becomes invalid, and you should not chase orders in the middle of the range. Leverage, slippage, and liquidation risks are to be borne by you yourself and do not constitute investment advice.
The evidence roundup doesn’t reach ten people—don’t treat this post as a complete “Top 10.”
#BTC #ETH #BNB
Let’s start with the conclusion: there aren’t ten people filled today, but we have verified 2 traders from recent coverage. The shared takeaway is not “jump in long right away”; rather, BTC is still trading within a range, and any breakout needs confirmation.
1. Daan Crypto Trades (X: @DaanCrypto)
Original view (2026-09-12): The weekly chart hasn’t seen major changes. BTC remains roughly between the May high around 83,000 and the key support around 74,000.
2. XO (X: @Trader_XO)
Original view (2026-09-11): BTC was again rejected from the 50-week moving average. Only if it reclaims that level and gains acceptance above it—while also seeing strong passive capital inflows—would it be closer to a bull-market state. Previously, it has still been a range.
Editor’s scenario based on live market conditions (2026-09-13 07:29 CST): Binance spot is 77,251.64; 24h +0.080%. High 77,505.67, low 77,059.75. Futures mark price 77,220.61; funding rate +0.004253%. The only main route is to hold range trading above 74,000 and wait for an effective breakout above 83,000. If it breaks below 74,000, that route becomes invalid, and you should not chase orders in the middle of the range. Leverage, slippage, and liquidation risks are to be borne by you yourself and do not constitute investment advice.
The evidence roundup doesn’t reach ten people—don’t treat this post as a complete “Top 10.”
#BTC #ETH #BNB
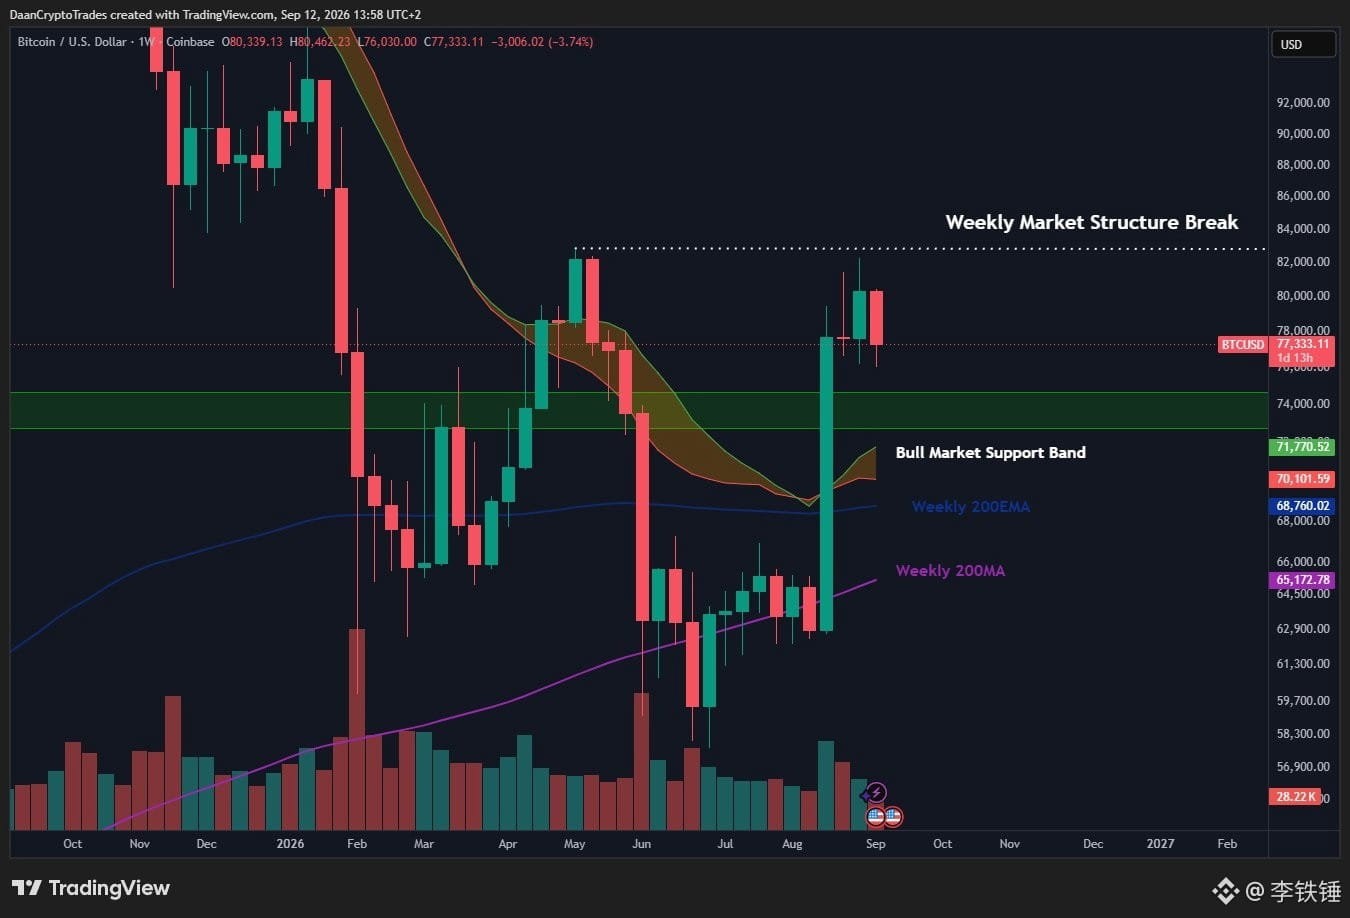
180
·
--
[Top 10 Crypto Traders’ Highlights Today | BTC September 11]
Counterintuitive conclusion: in the evening, BTC is not a breakout/chase-up position, but a confirmation point at the lower end of the range.
There’s only one main path: first check whether 76464 holds; only after the price reclaims 77500 should you watch the range repair toward 78000. An effective breakdown below 76000 invalidates the route.
1. Daan Crypto Trades (X: @DaanCrypto)
Original view: BTC returns to the bottom of the range, near the diagonal support; with CPI approaching, volatility over the next 24 hours may increase.
Editor’s scenario using real-time conditions: at 18:10, Binance spot is 77107; 24-hour high 78055, low 76464. Support is not guaranteed to rebound—wait for 77500 to be reclaimed first.
2. Arthur Hayes (X: @CryptoHayes)
Original view: Once 10-year Treasury yields are beyond 5%, you’d still need the MOVE index above 130 for a clear shift toward easing.
Editor’s scenario: this is a macro liquidity condition, not a BTC target; contract mark price is 77073, funding rate 0.00003375—don’t present it as a must-go-up signal.
Data: 24-hour drop of about 1.172%, volume 15197.2223 BTC; contract open interest 106626.076 BTC. Leverage amplifies volatility, slippage, and liquidation risk. We do not promise returns; this does not constitute investment advice.
This time, we only obtained 2 verifiable recent viewpoints, without padding the list to make “Top 10” with old content.
Are you more focused on the support holding at 76464, or whether 77500 can stay above and hold?
#BTC #ETH #BNB
[Top 10 Crypto Traders’ Highlights Today | BTC September 11]
Counterintuitive conclusion: in the evening, BTC is not a breakout/chase-up position, but a confirmation point at the lower end of the range.
There’s only one main path: first check whether 76464 holds; only after the price reclaims 77500 should you watch the range repair toward 78000. An effective breakdown below 76000 invalidates the route.
1. Daan Crypto Trades (X: @DaanCrypto)
Original view: BTC returns to the bottom of the range, near the diagonal support; with CPI approaching, volatility over the next 24 hours may increase.
Editor’s scenario using real-time conditions: at 18:10, Binance spot is 77107; 24-hour high 78055, low 76464. Support is not guaranteed to rebound—wait for 77500 to be reclaimed first.
2. Arthur Hayes (X: @CryptoHayes)
Original view: Once 10-year Treasury yields are beyond 5%, you’d still need the MOVE index above 130 for a clear shift toward easing.
Editor’s scenario: this is a macro liquidity condition, not a BTC target; contract mark price is 77073, funding rate 0.00003375—don’t present it as a must-go-up signal.
Data: 24-hour drop of about 1.172%, volume 15197.2223 BTC; contract open interest 106626.076 BTC. Leverage amplifies volatility, slippage, and liquidation risk. We do not promise returns; this does not constitute investment advice.
This time, we only obtained 2 verifiable recent viewpoints, without padding the list to make “Top 10” with old content.
Are you more focused on the support holding at 76464, or whether 77500 can stay above and hold?
#BTC #ETH #BNB
Counterintuitive conclusion: in the evening, BTC is not a breakout/chase-up position, but a confirmation point at the lower end of the range.
There’s only one main path: first check whether 76464 holds; only after the price reclaims 77500 should you watch the range repair toward 78000. An effective breakdown below 76000 invalidates the route.
1. Daan Crypto Trades (X: @DaanCrypto)
Original view: BTC returns to the bottom of the range, near the diagonal support; with CPI approaching, volatility over the next 24 hours may increase.
Editor’s scenario using real-time conditions: at 18:10, Binance spot is 77107; 24-hour high 78055, low 76464. Support is not guaranteed to rebound—wait for 77500 to be reclaimed first.
2. Arthur Hayes (X: @CryptoHayes)
Original view: Once 10-year Treasury yields are beyond 5%, you’d still need the MOVE index above 130 for a clear shift toward easing.
Editor’s scenario: this is a macro liquidity condition, not a BTC target; contract mark price is 77073, funding rate 0.00003375—don’t present it as a must-go-up signal.
Data: 24-hour drop of about 1.172%, volume 15197.2223 BTC; contract open interest 106626.076 BTC. Leverage amplifies volatility, slippage, and liquidation risk. We do not promise returns; this does not constitute investment advice.
This time, we only obtained 2 verifiable recent viewpoints, without padding the list to make “Top 10” with old content.
Are you more focused on the support holding at 76464, or whether 77500 can stay above and hold?
#BTC #ETH #BNB

1
88
Log in to explore more content
Join global crypto users on Binance Square
⚡️ Get latest and useful information about crypto.
💬 Trusted by the world’s largest crypto exchange.
👍 Discover real insights from verified creators.
Email / Phone number