
Tài Chính Cho Người Bận
170 Posts

Tài Chính Cho Người Bận
Report
Block User
9 năm trong ngành tài chính: 5 năm rèn luyện, 4 năm quản lý quỹ
Không cam kết lợi nhuận – Nhưng mình sẽ đảm bảo để đồng hành cùng bạn trên con đường Trading này
0 Following
273 Followers
247 Liked
Posts
All
Videos
Live
🚨 ETH IS PLUNGING – WHAT’S THE SCENARIO FOR TONIGHT, 13/11? 📉
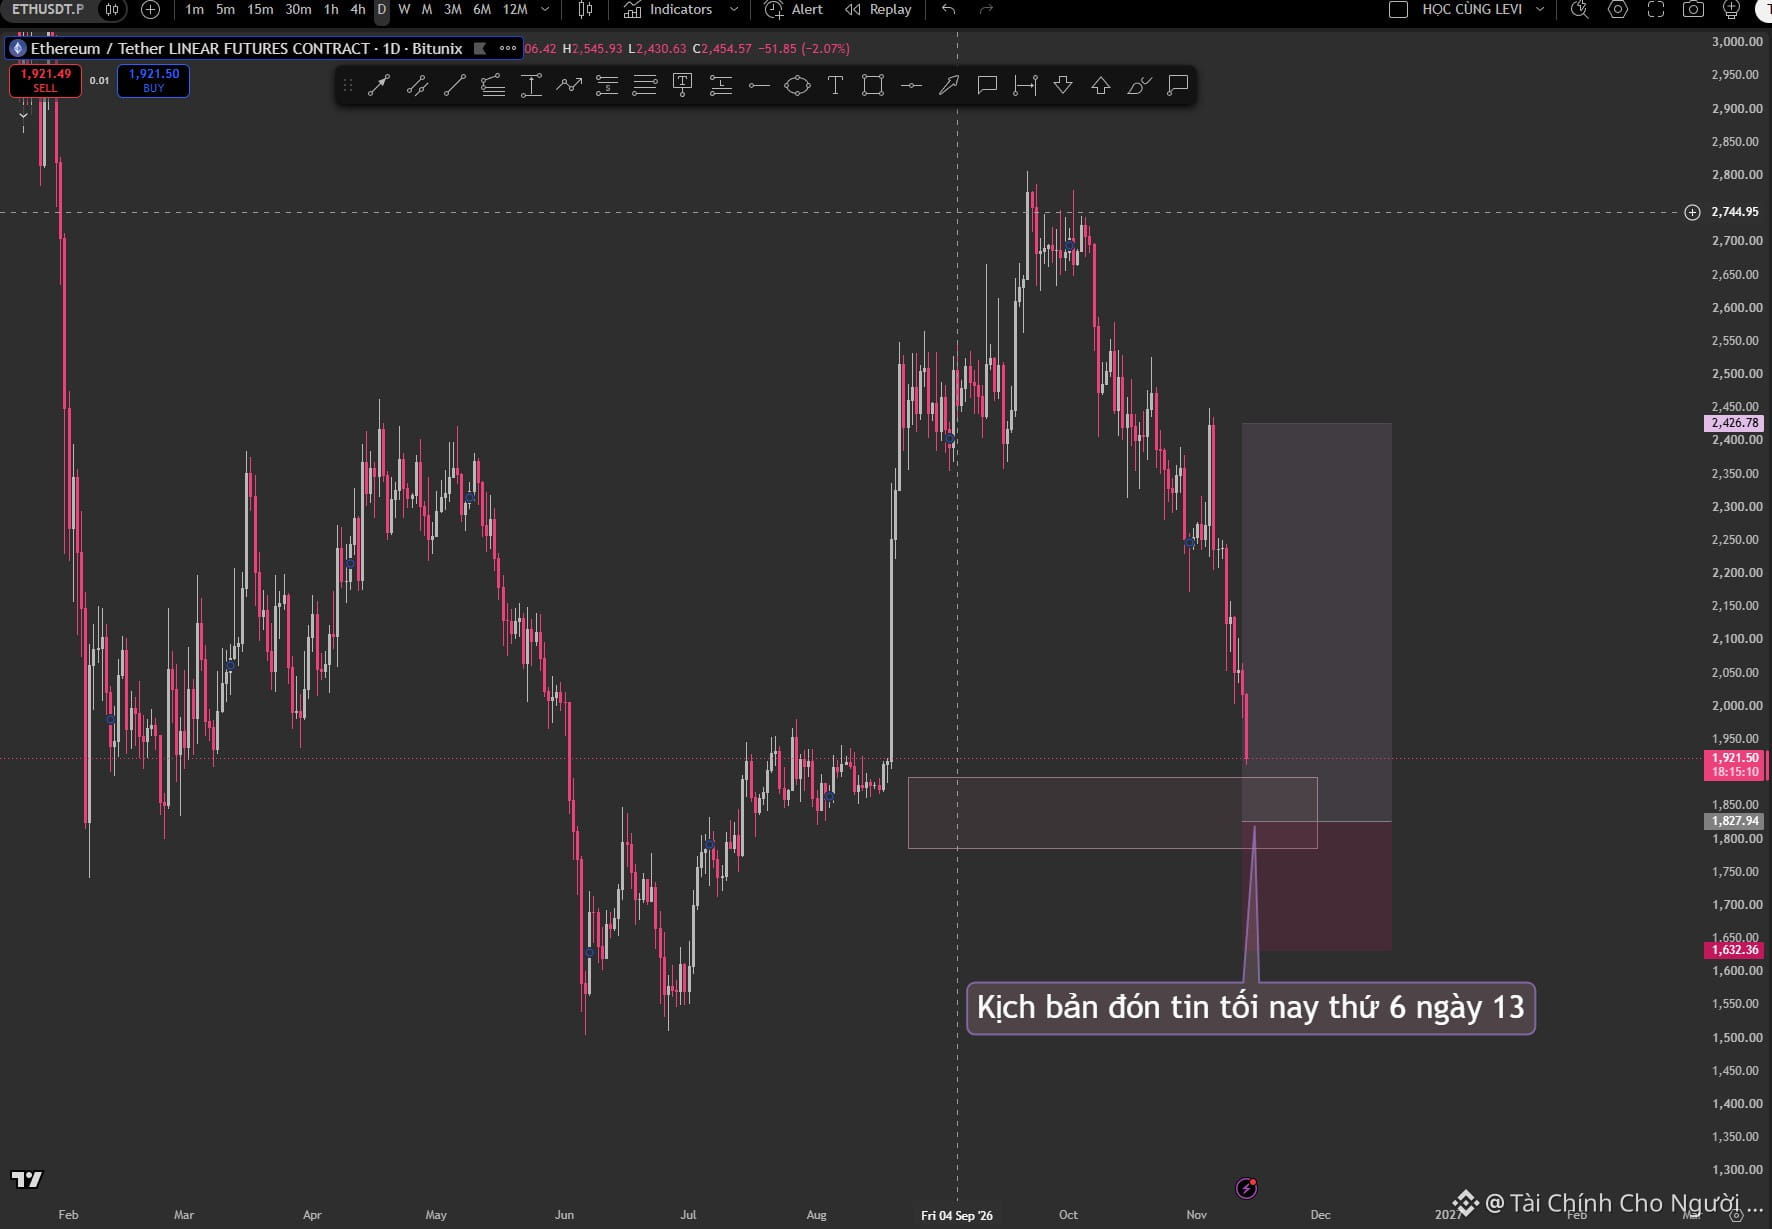
🔥 Ethereum (ETH) is facing intense selling pressure, with its price down nearly 5% to around 1,920 USDT on the daily chart.
📊 ETH/USDT TECHNICAL ANALYSIS:
🔴 Trend: Sellers are in control, and price action continues to weaken after losing key support levels.
🎯 Key price levels to watch:
Resistance: 2,000–2,050 USDT
Nearby support: 1,800–1,870 USDT
Deeper support: 1,630–1,650 USDT
⚡ TONIGHT’S SCENARIOS:
🟢 Scenario 1: ETH holds the 1,800–1,870 support zone, buying pressure emerges, and reversal signals are confirmed → A short-term recovery could take shape.
🔴 Scenario 2: ETH breaks below 1,800 and fails to reclaim support → It could continue falling toward the 1,630 USDT area.
💥 Will ETH rebound sharply tonight or continue to face a sell-off?
💬 Are you leaning LONG or SHORT? Share your thoughts in the comments below! 👇
⚠️ This content is for informational purposes only and is not investment advice. Manage your capital and risk when trading.
#ETH #Ethereum #Crypto #Binance #TechnicalAnalysis #Trading #ETHUSDT #Bitcoin #CryptoMarket #Futures
🚨 ETH IS PLUNGING – WHAT’S THE SCENARIO FOR TONIGHT, 13/11? 📉
🔥 Ethereum (ETH) is facing intense selling pressure, with its price down nearly 5% to around 1,920 USDT on the daily chart.
📊 ETH/USDT TECHNICAL ANALYSIS:
🔴 Trend: Sellers are in control, and price action continues to weaken after losing key support levels.
🎯 Key price levels to watch:
Resistance: 2,000–2,050 USDT
Nearby support: 1,800–1,870 USDT
Deeper support: 1,630–1,650 USDT
⚡ TONIGHT’S SCENARIOS:
🟢 Scenario 1: ETH holds the 1,800–1,870 support zone, buying pressure emerges, and reversal signals are confirmed → A short-term recovery could take shape.
🔴 Scenario 2: ETH breaks below 1,800 and fails to reclaim support → It could continue falling toward the 1,630 USDT area.
💥 Will ETH rebound sharply tonight or continue to face a sell-off?
💬 Are you leaning LONG or SHORT? Share your thoughts in the comments below! 👇
⚠️ This content is for informational purposes only and is not investment advice. Manage your capital and risk when trading.
#ETH #Ethereum #Crypto #Binance #TechnicalAnalysis #Trading #ETHUSDT #Bitcoin #CryptoMarket #Futures
🔥 Ethereum (ETH) is facing intense selling pressure, with its price down nearly 5% to around 1,920 USDT on the daily chart.
📊 ETH/USDT TECHNICAL ANALYSIS:
🔴 Trend: Sellers are in control, and price action continues to weaken after losing key support levels.
🎯 Key price levels to watch:
Resistance: 2,000–2,050 USDT
Nearby support: 1,800–1,870 USDT
Deeper support: 1,630–1,650 USDT
⚡ TONIGHT’S SCENARIOS:
🟢 Scenario 1: ETH holds the 1,800–1,870 support zone, buying pressure emerges, and reversal signals are confirmed → A short-term recovery could take shape.
🔴 Scenario 2: ETH breaks below 1,800 and fails to reclaim support → It could continue falling toward the 1,630 USDT area.
💥 Will ETH rebound sharply tonight or continue to face a sell-off?
💬 Are you leaning LONG or SHORT? Share your thoughts in the comments below! 👇
⚠️ This content is for informational purposes only and is not investment advice. Manage your capital and risk when trading.
#ETH #Ethereum #Crypto #Binance #TechnicalAnalysis #Trading #ETHUSDT #Bitcoin #CryptoMarket #Futures
270
🚨 BTC BOUNCES BACK STRONGLY TO $80,000 – IS A SHORTING OPPORTUNITY EMERGING?
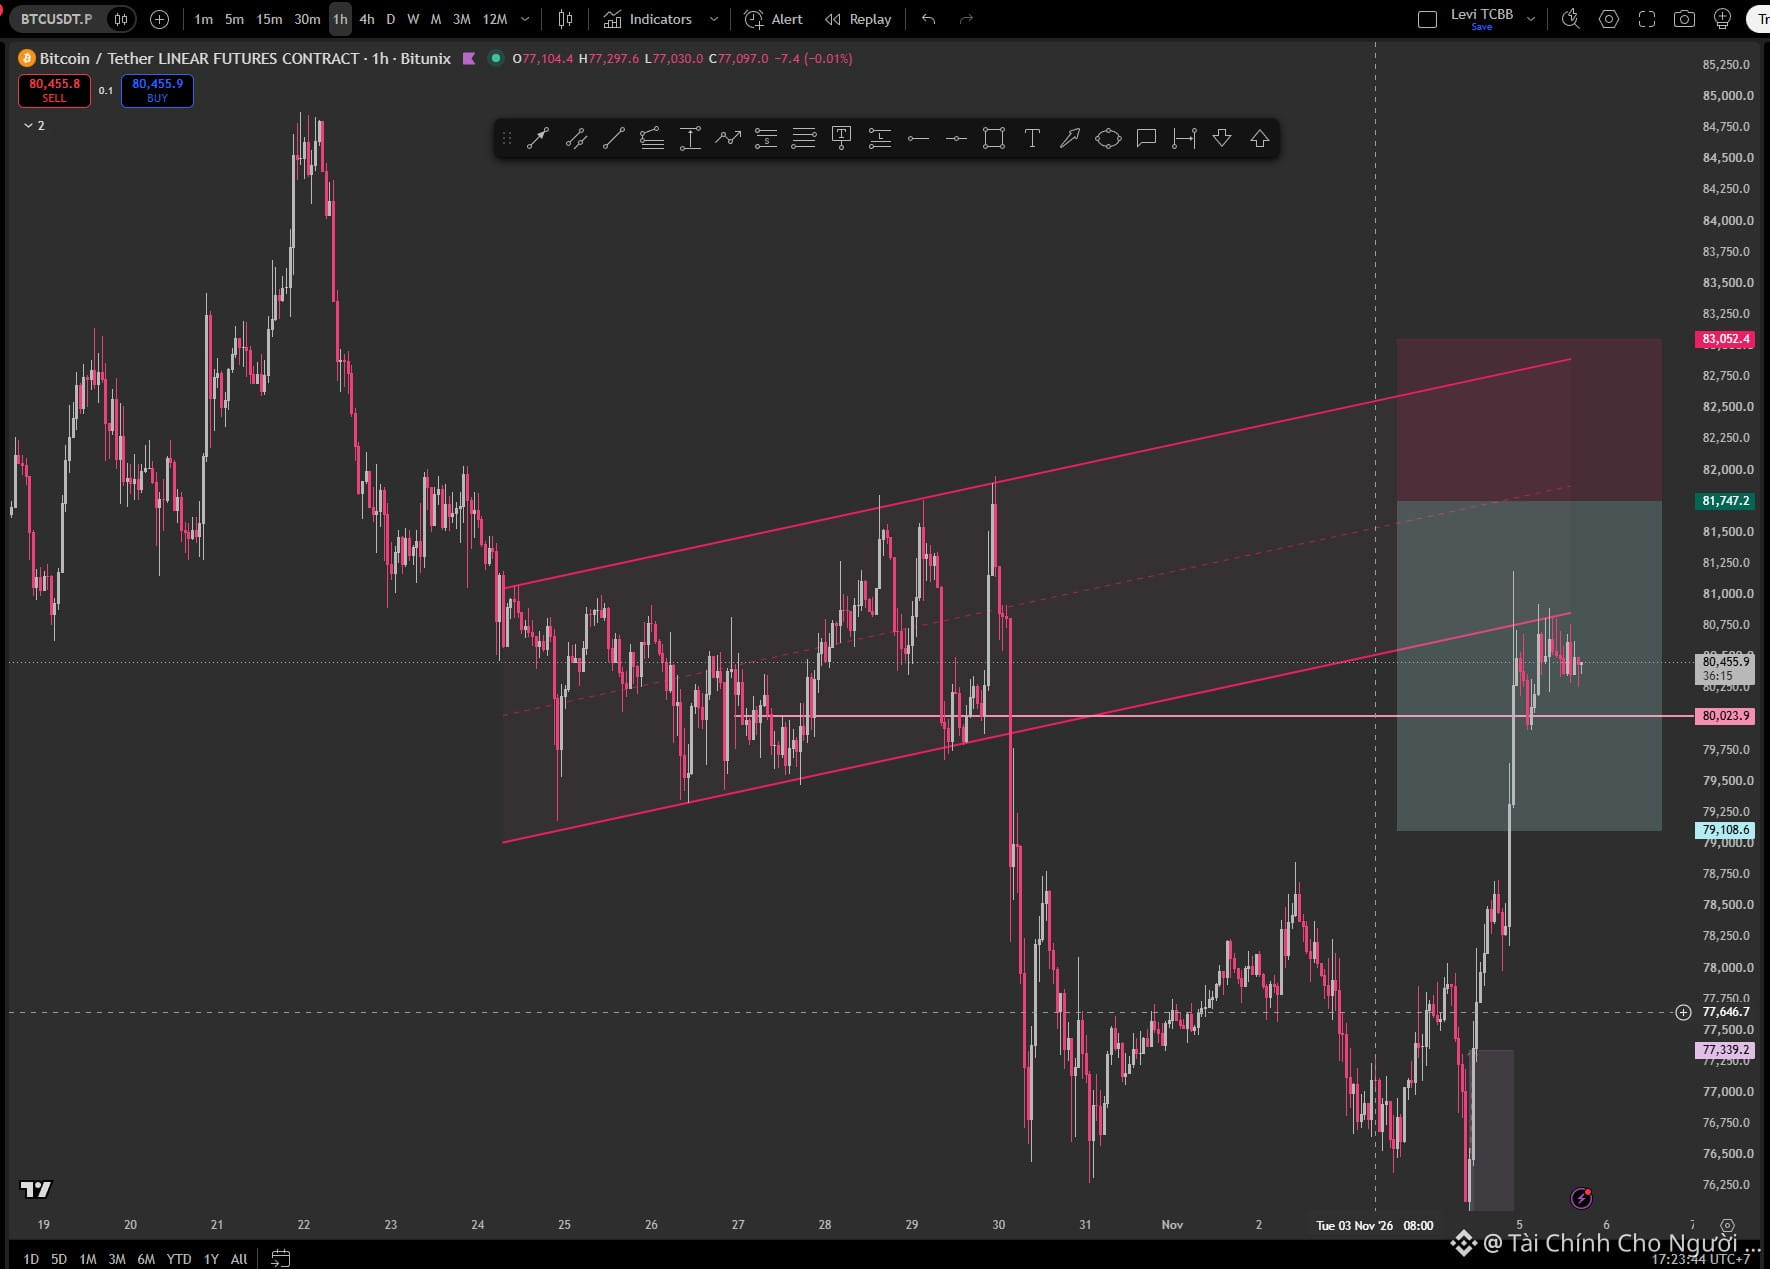
After a deep sweep down to the $76,000 area, BTC rebounded sharply and is now trading around $80,400.
📊 H1 technical outlook:
🔸 BTC is moving back to test the $80,000–$81,000 resistance zone, which previously served as important support.
🔸 The previous ascending price channel has been broken. The current rebound could be a retest of former support turned resistance.
🔸 Bearish scenario: If BTC is rejected at the $80,000–$81,700 zone, the price could return to test $79,100 and lower support areas.
🔸 Bullish scenario: If BTC breaks above and holds firmly over $81,700, buyers could continue toward $83,000.
🔥 Is BTC really reversing, or is this just a bounce before another drop?
Are you leaning LONG or SHORT? Share your thoughts below! 👇
⚠️ This analysis is for informational purposes only and is not investment advice (NFA/DYOR).
#BTC #Bitcoin #BTCUSDT #TechnicalAnalysis #BinanceSquare
🚨 BTC BOUNCES BACK STRONGLY TO $80,000 – IS A SHORTING OPPORTUNITY EMERGING?
After a deep sweep down to the $76,000 area, BTC rebounded sharply and is now trading around $80,400.
📊 H1 technical outlook:
🔸 BTC is moving back to test the $80,000–$81,000 resistance zone, which previously served as important support.
🔸 The previous ascending price channel has been broken. The current rebound could be a retest of former support turned resistance.
🔸 Bearish scenario: If BTC is rejected at the $80,000–$81,700 zone, the price could return to test $79,100 and lower support areas.
🔸 Bullish scenario: If BTC breaks above and holds firmly over $81,700, buyers could continue toward $83,000.
🔥 Is BTC really reversing, or is this just a bounce before another drop?
Are you leaning LONG or SHORT? Share your thoughts below! 👇
⚠️ This analysis is for informational purposes only and is not investment advice (NFA/DYOR).
#BTC #Bitcoin #BTCUSDT #TechnicalAnalysis #BinanceSquare
After a deep sweep down to the $76,000 area, BTC rebounded sharply and is now trading around $80,400.
📊 H1 technical outlook:
🔸 BTC is moving back to test the $80,000–$81,000 resistance zone, which previously served as important support.
🔸 The previous ascending price channel has been broken. The current rebound could be a retest of former support turned resistance.
🔸 Bearish scenario: If BTC is rejected at the $80,000–$81,700 zone, the price could return to test $79,100 and lower support areas.
🔸 Bullish scenario: If BTC breaks above and holds firmly over $81,700, buyers could continue toward $83,000.
🔥 Is BTC really reversing, or is this just a bounce before another drop?
Are you leaning LONG or SHORT? Share your thoughts below! 👇
⚠️ This analysis is for informational purposes only and is not investment advice (NFA/DYOR).
#BTC #Bitcoin #BTCUSDT #TechnicalAnalysis #BinanceSquare
1
296
🎙️ BTC - Gold - U.S. Stocks - FX Market Outlook

End
01 h 34 m 34 s
151
1
0
📊 GOLD ANALYSIS (XAU/USD) – Session Overview
Hello everyone, here’s a quick update on the gold market this morning, October 13.
Gold is trading around 4,172.53 (+0.88 / +0.02%). The latest reference close was around 4,171.65; the open was 4,174.40; and the intraday range was 4,150.785–4,175.885. Gold opened near the session high, fell back to the 4,150 area, then recovered to around the reference price, for an intraday range of about 25 points.
🔎 Technical Outlook
Short-term trend: Price is fluctuating around the opening and reference levels after a sweep of the low. Buying pressure emerged around 4,150, but there has not yet been clear confirmation of a breakout above the daily high.
Nearest resistance: 4,175–4,176 (daily high), followed by the 4,195–4,210 area (a price zone that has seen recent reactions).
Nearest support: 4,150–4,151 (daily low), with deeper support around 4,130–4,135 if selling pressure intensifies.
🧭 Suggested Strategy
Look for buying opportunities if price reaches clear support (around the daily low, near 4,150) and shows signs of holding. Always place your stop-loss below the structural low.
Look for selling opportunities if price rebounds to resistance at 4,175–4,176 but fails to hold. Place your stop-loss above the nearest swing high.
Manage your capital carefully: risk only a small portion of your account on each trade, and don’t FOMO-chase price while the range remains narrow.
⚠️ This information is shared for educational purposes and is not investment advice. You are responsible for your own decisions.
📊 GOLD ANALYSIS (XAU/USD) – Session Overview
Hello everyone, here’s a quick update on the gold market this morning, October 13.
Gold is trading around 4,172.53 (+0.88 / +0.02%). The latest reference close was around 4,171.65; the open was 4,174.40; and the intraday range was 4,150.785–4,175.885. Gold opened near the session high, fell back to the 4,150 area, then recovered to around the reference price, for an intraday range of about 25 points.
🔎 Technical Outlook
Short-term trend: Price is fluctuating around the opening and reference levels after a sweep of the low. Buying pressure emerged around 4,150, but there has not yet been clear confirmation of a breakout above the daily high.
Nearest resistance: 4,175–4,176 (daily high), followed by the 4,195–4,210 area (a price zone that has seen recent reactions).
Nearest support: 4,150–4,151 (daily low), with deeper support around 4,130–4,135 if selling pressure intensifies.
🧭 Suggested Strategy
Look for buying opportunities if price reaches clear support (around the daily low, near 4,150) and shows signs of holding. Always place your stop-loss below the structural low.
Look for selling opportunities if price rebounds to resistance at 4,175–4,176 but fails to hold. Place your stop-loss above the nearest swing high.
Manage your capital carefully: risk only a small portion of your account on each trade, and don’t FOMO-chase price while the range remains narrow.
⚠️ This information is shared for educational purposes and is not investment advice. You are responsible for your own decisions.
Hello everyone, here’s a quick update on the gold market this morning, October 13.
Gold is trading around 4,172.53 (+0.88 / +0.02%). The latest reference close was around 4,171.65; the open was 4,174.40; and the intraday range was 4,150.785–4,175.885. Gold opened near the session high, fell back to the 4,150 area, then recovered to around the reference price, for an intraday range of about 25 points.
🔎 Technical Outlook
Short-term trend: Price is fluctuating around the opening and reference levels after a sweep of the low. Buying pressure emerged around 4,150, but there has not yet been clear confirmation of a breakout above the daily high.
Nearest resistance: 4,175–4,176 (daily high), followed by the 4,195–4,210 area (a price zone that has seen recent reactions).
Nearest support: 4,150–4,151 (daily low), with deeper support around 4,130–4,135 if selling pressure intensifies.
🧭 Suggested Strategy
Look for buying opportunities if price reaches clear support (around the daily low, near 4,150) and shows signs of holding. Always place your stop-loss below the structural low.
Look for selling opportunities if price rebounds to resistance at 4,175–4,176 but fails to hold. Place your stop-loss above the nearest swing high.
Manage your capital carefully: risk only a small portion of your account on each trade, and don’t FOMO-chase price while the range remains narrow.
⚠️ This information is shared for educational purposes and is not investment advice. You are responsible for your own decisions.

1
264
Log in to explore more content
Join global crypto users on Binance Square
⚡️ Get latest and useful information about crypto.
💬 Trusted by the world’s largest crypto exchange.
👍 Discover real insights from verified creators.
Email / Phone number
Trending Topics
USPPIMissMayEaseBTCPressure
8,974 views
313 Discussing
US PPI Rises 6.5% a Year in October, Slightly Below 6.6% Forecast
Binance News
·10 Likes
·9.3k views
BitcoinCoreDisclosesTorTrafficVulnerability
1,239 views
108 Discussing
WhatWillDriveCryptoandStocks’NextRebound?
102,599 views
1,296 Discussing