

白鲸Crypto
835 Posts

白鲸Crypto
Report
Block User
关注公众号“白鲸Crypto”|币安邀请码手续费折扣:LB888

Creator Awards 2024

原创之星
Occasional Trader
5.7 Years
53 Following
32.2K+ Followers
42.8K+ Liked
2 Badges
Posts
All
Quotes
Videos
Live
·
--
#币安披露黑客事件进展63亿美元损失已弥补八成
Yesterday, the crypto market and US stocks were rocked by one shock after another. US tech companies’ earnings reports were a disaster, tech stocks fell 10% across the board, Intel dropped nearly 30%, Binance suffered the biggest hack in its history, spot ETFs saw a record $650 million in outflows in a single day, and institutions rushed to close positions.
In the past, Bitcoin would have fallen at least double digits under these conditions. But this time, after plunging from $81,000 to around $76,000, it was dragged right back up to $78,000 by massive buying pressure! Its biggest drop in a single day was only about 5%. With nothing but despair and bearish news all around, Bitcoin’s resilience this time has genuinely impressed me:
In the past, when an exchange suffered a black swan event, on-chain liquidity would dry up instantly, and retail investors could only join the panic selling, with no floor in sight. Things are different now. The spot Bitcoin ETF gives the market a powerful new channel, making Bitcoin’s holder base much more stable. Binance also responded extremely quickly, freezing the funds and promising full reimbursement, which brought the panic over a potential run to a minimum.
The large ETF outflows are institutions engaging in cash-and-carry arbitrage: buying spot ETFs with one hand and opening short positions with the other to collect funding rates and the basis. As macro risks intensified and the exchange ran into trouble, margin pressure on futures surged. To manage risk, they had no choice but to sell their spot ETFs while buying back their short positions. So the major players weren’t dumping because they were bearish; this was mechanical, defensive risk management. Once these arbitrage funds finish closing their positions, this source of targeted selling pressure will be completely exhausted.
Meanwhile, much of the market’s emotional selling pressure came from short-term speculative money and retail investors who chased prices above $82,000 from late September to mid-October. Spooked by the macro-driven plunge and the Binance incident, they quickly cut their losses and handed over their coins. Whales and long-term holders were placing buy orders around $77,000 amid the panic, transferring coins from weaker hands to stronger ones—from short-term speculators to patient, long-term capital. This kind of turnover is painful in the short term, but over the medium to long term, it leaves the market’s foundation far sturdier than before.
In the short term, the $76,000–$78,000 range has already passed an extreme stress test amid multiple negative catalysts. Most likely, prices will churn between $76,000 and $80,000 as the market absorbs the aftershocks of deleveraging in US stocks and the lingering fears from the Binance incident. There’s no need to panic blindly in the face of a black swan. Once US stocks stop falling, Binance’s reimbursement is finalized, and ETF flows return to net inflows, this downturn may well have carved out a golden opportunity ahead of the next rally.
Join the group chat to understand the market and stay on track 👇
#币安披露黑客事件进展63亿美元损失已弥补八成
Yesterday, the crypto market and US stocks were rocked by one shock after another. US tech companies’ earnings reports were a disaster, tech stocks fell 10% across the board, Intel dropped nearly 30%, Binance suffered the biggest hack in its history, spot ETFs saw a record $650 million in outflows in a single day, and institutions rushed to close positions.
In the past, Bitcoin would have fallen at least double digits under these conditions. But this time, after plunging from $81,000 to around $76,000, it was dragged right back up to $78,000 by massive buying pressure! Its biggest drop in a single day was only about 5%. With nothing but despair and bearish news all around, Bitcoin’s resilience this time has genuinely impressed me:
In the past, when an exchange suffered a black swan event, on-chain liquidity would dry up instantly, and retail investors could only join the panic selling, with no floor in sight. Things are different now. The spot Bitcoin ETF gives the market a powerful new channel, making Bitcoin’s holder base much more stable. Binance also responded extremely quickly, freezing the funds and promising full reimbursement, which brought the panic over a potential run to a minimum.
The large ETF outflows are institutions engaging in cash-and-carry arbitrage: buying spot ETFs with one hand and opening short positions with the other to collect funding rates and the basis. As macro risks intensified and the exchange ran into trouble, margin pressure on futures surged. To manage risk, they had no choice but to sell their spot ETFs while buying back their short positions. So the major players weren’t dumping because they were bearish; this was mechanical, defensive risk management. Once these arbitrage funds finish closing their positions, this source of targeted selling pressure will be completely exhausted.
Meanwhile, much of the market’s emotional selling pressure came from short-term speculative money and retail investors who chased prices above $82,000 from late September to mid-October. Spooked by the macro-driven plunge and the Binance incident, they quickly cut their losses and handed over their coins. Whales and long-term holders were placing buy orders around $77,000 amid the panic, transferring coins from weaker hands to stronger ones—from short-term speculators to patient, long-term capital. This kind of turnover is painful in the short term, but over the medium to long term, it leaves the market’s foundation far sturdier than before.
In the short term, the $76,000–$78,000 range has already passed an extreme stress test amid multiple negative catalysts. Most likely, prices will churn between $76,000 and $80,000 as the market absorbs the aftershocks of deleveraging in US stocks and the lingering fears from the Binance incident. There’s no need to panic blindly in the face of a black swan. Once US stocks stop falling, Binance’s reimbursement is finalized, and ETF flows return to net inflows, this downturn may well have carved out a golden opportunity ahead of the next rally.
Join the group chat to understand the market and stay on track 👇
Yesterday, the crypto market and US stocks were rocked by one shock after another. US tech companies’ earnings reports were a disaster, tech stocks fell 10% across the board, Intel dropped nearly 30%, Binance suffered the biggest hack in its history, spot ETFs saw a record $650 million in outflows in a single day, and institutions rushed to close positions.
In the past, Bitcoin would have fallen at least double digits under these conditions. But this time, after plunging from $81,000 to around $76,000, it was dragged right back up to $78,000 by massive buying pressure! Its biggest drop in a single day was only about 5%. With nothing but despair and bearish news all around, Bitcoin’s resilience this time has genuinely impressed me:
In the past, when an exchange suffered a black swan event, on-chain liquidity would dry up instantly, and retail investors could only join the panic selling, with no floor in sight. Things are different now. The spot Bitcoin ETF gives the market a powerful new channel, making Bitcoin’s holder base much more stable. Binance also responded extremely quickly, freezing the funds and promising full reimbursement, which brought the panic over a potential run to a minimum.
The large ETF outflows are institutions engaging in cash-and-carry arbitrage: buying spot ETFs with one hand and opening short positions with the other to collect funding rates and the basis. As macro risks intensified and the exchange ran into trouble, margin pressure on futures surged. To manage risk, they had no choice but to sell their spot ETFs while buying back their short positions. So the major players weren’t dumping because they were bearish; this was mechanical, defensive risk management. Once these arbitrage funds finish closing their positions, this source of targeted selling pressure will be completely exhausted.
Meanwhile, much of the market’s emotional selling pressure came from short-term speculative money and retail investors who chased prices above $82,000 from late September to mid-October. Spooked by the macro-driven plunge and the Binance incident, they quickly cut their losses and handed over their coins. Whales and long-term holders were placing buy orders around $77,000 amid the panic, transferring coins from weaker hands to stronger ones—from short-term speculators to patient, long-term capital. This kind of turnover is painful in the short term, but over the medium to long term, it leaves the market’s foundation far sturdier than before.
In the short term, the $76,000–$78,000 range has already passed an extreme stress test amid multiple negative catalysts. Most likely, prices will churn between $76,000 and $80,000 as the market absorbs the aftershocks of deleveraging in US stocks and the lingering fears from the Binance incident. There’s no need to panic blindly in the face of a black swan. Once US stocks stop falling, Binance’s reimbursement is finalized, and ETF flows return to net inflows, this downturn may well have carved out a golden opportunity ahead of the next rally.
Join the group chat to understand the market and stay on track 👇
1
5
3.2k
·
--
#两地址约12.8亿枚USDT遭冻结
Binance’s $6 billion heist has now, without a doubt, become the largest theft by value ever recorded in human history!
The incident was apparently caused by hackers breaking into an engineer’s laptop, gaining authorized access to the server, and directly submitting a withdrawal command. In just two years, three leading CEXs—Bybit, Bitget, and Binance—have all been breached one after another. I don’t think this is a coincidence. The underlying cause is basically the same: this is a fundamental weakness of centralized exchanges.
Many major companies are now adopting zero-trust security architectures, claiming to “never trust, always verify.” But engineers need elevated privileges to maintain and test systems. Hackers can attack employees’ devices and crack through every layer—even bastion hosts with multiple approval steps. That makes all identity-based authentication mechanisms virtually useless.
In fact, CEXs wear the decentralized clothing of Web3, but at their core, they are the most centralized kind of Web2 internet company. To let users deposit and withdraw funds in seconds, their systems have to be highly automated. If every withdrawal required a dozen executives to sign with hardware wallets, the user experience would be ruined, and everyone would leave for DEXs.
So hot wallets have to stay online, APIs have to remain open, and automated fund-sweeping programs have to run 24/7. This means that if hackers find an API privilege-escalation vulnerability on the internal network or forge a withdrawal command, they can drain all the funds!
Thankfully, Tether and Circle helped freeze the funds on-chain in an emergency. Although this recovered most of the losses, it treats the symptom, not the cause. As long as custody and trading aren’t separated, and people remain the trust hubs within automated systems, hot wallets will always be the industry’s biggest pain point!
Binance has set an example by announcing that it will fully cover the losses. That’s the responsibility and accountability of the world’s largest exchange—worthy of praise 👍. As the saying goes, if your own wallet gets hacked, the money is really gone; if you get hacked on an exchange, you can still be fully reimbursed 🤣. I believe in Binance’s capabilities and technology, and hope they can make their security a perfect 100.
Follow me so you don’t lose your way, and join my Binance group chat 👇
#两地址约12.8亿枚USDT遭冻结
Binance’s $6 billion heist has now, without a doubt, become the largest theft by value ever recorded in human history!
The incident was apparently caused by hackers breaking into an engineer’s laptop, gaining authorized access to the server, and directly submitting a withdrawal command. In just two years, three leading CEXs—Bybit, Bitget, and Binance—have all been breached one after another. I don’t think this is a coincidence. The underlying cause is basically the same: this is a fundamental weakness of centralized exchanges.
Many major companies are now adopting zero-trust security architectures, claiming to “never trust, always verify.” But engineers need elevated privileges to maintain and test systems. Hackers can attack employees’ devices and crack through every layer—even bastion hosts with multiple approval steps. That makes all identity-based authentication mechanisms virtually useless.
In fact, CEXs wear the decentralized clothing of Web3, but at their core, they are the most centralized kind of Web2 internet company. To let users deposit and withdraw funds in seconds, their systems have to be highly automated. If every withdrawal required a dozen executives to sign with hardware wallets, the user experience would be ruined, and everyone would leave for DEXs.
So hot wallets have to stay online, APIs have to remain open, and automated fund-sweeping programs have to run 24/7. This means that if hackers find an API privilege-escalation vulnerability on the internal network or forge a withdrawal command, they can drain all the funds!
Thankfully, Tether and Circle helped freeze the funds on-chain in an emergency. Although this recovered most of the losses, it treats the symptom, not the cause. As long as custody and trading aren’t separated, and people remain the trust hubs within automated systems, hot wallets will always be the industry’s biggest pain point!
Binance has set an example by announcing that it will fully cover the losses. That’s the responsibility and accountability of the world’s largest exchange—worthy of praise 👍. As the saying goes, if your own wallet gets hacked, the money is really gone; if you get hacked on an exchange, you can still be fully reimbursed 🤣. I believe in Binance’s capabilities and technology, and hope they can make their security a perfect 100.
Follow me so you don’t lose your way, and join my Binance group chat 👇
Binance’s $6 billion heist has now, without a doubt, become the largest theft by value ever recorded in human history!
The incident was apparently caused by hackers breaking into an engineer’s laptop, gaining authorized access to the server, and directly submitting a withdrawal command. In just two years, three leading CEXs—Bybit, Bitget, and Binance—have all been breached one after another. I don’t think this is a coincidence. The underlying cause is basically the same: this is a fundamental weakness of centralized exchanges.
Many major companies are now adopting zero-trust security architectures, claiming to “never trust, always verify.” But engineers need elevated privileges to maintain and test systems. Hackers can attack employees’ devices and crack through every layer—even bastion hosts with multiple approval steps. That makes all identity-based authentication mechanisms virtually useless.
In fact, CEXs wear the decentralized clothing of Web3, but at their core, they are the most centralized kind of Web2 internet company. To let users deposit and withdraw funds in seconds, their systems have to be highly automated. If every withdrawal required a dozen executives to sign with hardware wallets, the user experience would be ruined, and everyone would leave for DEXs.
So hot wallets have to stay online, APIs have to remain open, and automated fund-sweeping programs have to run 24/7. This means that if hackers find an API privilege-escalation vulnerability on the internal network or forge a withdrawal command, they can drain all the funds!
Thankfully, Tether and Circle helped freeze the funds on-chain in an emergency. Although this recovered most of the losses, it treats the symptom, not the cause. As long as custody and trading aren’t separated, and people remain the trust hubs within automated systems, hot wallets will always be the industry’s biggest pain point!
Binance has set an example by announcing that it will fully cover the losses. That’s the responsibility and accountability of the world’s largest exchange—worthy of praise 👍. As the saying goes, if your own wallet gets hacked, the money is really gone; if you get hacked on an exchange, you can still be fully reimbursed 🤣. I believe in Binance’s capabilities and technology, and hope they can make their security a perfect 100.
Follow me so you don’t lose your way, and join my Binance group chat 👇
2
1.9k
·
--
Bitget had just been hit for $300 million, and barely a month later, Binance was robbed of nearly $6 billion. This has now, without a doubt, become the largest recorded theft in human history!
The incident was apparently caused by hackers breaking into an engineer’s computer and using it to gain access to a service container, where they directly submitted a withdrawal instruction. From Bybit to Bitget, and now Binance, three leading CEXs have been breached one after another in just two years, and the underlying cause is the same in every case. I don’t think this is a coincidence anymore—it’s a fundamental weakness of centralized exchanges:
Many major companies are now adopting zero-trust security architectures, claiming to “never trust, always verify.” But engineers need high-level access to release updates, run tests, and maintain nodes. Hackers might bribe insiders, use social engineering and phishing, or breach personal devices. Once a device is compromised, even heavily controlled jump servers can be cracked one by one, rendering all identity-based authentication mechanisms effectively useless.
In essence, CEXs wear the decentralized guise of Web3, but at their core, they’re the most extreme kind of high-concurrency Web2 internet company. To provide tens of millions of users with fast deposits, withdrawals, and trading, their systems need to be highly automated. If every withdrawal required ten executives to sign with hardware wallets, the user experience would be ruined. So hot wallets have to stay online, APIs have to remain open, and automated consolidation programs have to run 24/7. This means that if hackers find an authorization vulnerability in an internal API or forge a withdrawal instruction, they can drain the funds!
Thankfully, Tether and Circle helped freeze the funds in an emergency on-chain. These safeguards prevented most of the losses, but they treat the symptoms, not the underlying problem. As long as custody and trading aren’t separated, and people remain the trust hubs in automated systems, hot wallets will always be the industry’s biggest pain point!
Follow me so you don’t lose your way, and join my group chat 👇
Bitget had just been hit for $300 million, and barely a month later, Binance was robbed of nearly $6 billion. This has now, without a doubt, become the largest recorded theft in human history!
The incident was apparently caused by hackers breaking into an engineer’s computer and using it to gain access to a service container, where they directly submitted a withdrawal instruction. From Bybit to Bitget, and now Binance, three leading CEXs have been breached one after another in just two years, and the underlying cause is the same in every case. I don’t think this is a coincidence anymore—it’s a fundamental weakness of centralized exchanges:
Many major companies are now adopting zero-trust security architectures, claiming to “never trust, always verify.” But engineers need high-level access to release updates, run tests, and maintain nodes. Hackers might bribe insiders, use social engineering and phishing, or breach personal devices. Once a device is compromised, even heavily controlled jump servers can be cracked one by one, rendering all identity-based authentication mechanisms effectively useless.
In essence, CEXs wear the decentralized guise of Web3, but at their core, they’re the most extreme kind of high-concurrency Web2 internet company. To provide tens of millions of users with fast deposits, withdrawals, and trading, their systems need to be highly automated. If every withdrawal required ten executives to sign with hardware wallets, the user experience would be ruined. So hot wallets have to stay online, APIs have to remain open, and automated consolidation programs have to run 24/7. This means that if hackers find an authorization vulnerability in an internal API or forge a withdrawal instruction, they can drain the funds!
Thankfully, Tether and Circle helped freeze the funds in an emergency on-chain. These safeguards prevented most of the losses, but they treat the symptoms, not the underlying problem. As long as custody and trading aren’t separated, and people remain the trust hubs in automated systems, hot wallets will always be the industry’s biggest pain point!
Follow me so you don’t lose your way, and join my group chat 👇
The incident was apparently caused by hackers breaking into an engineer’s computer and using it to gain access to a service container, where they directly submitted a withdrawal instruction. From Bybit to Bitget, and now Binance, three leading CEXs have been breached one after another in just two years, and the underlying cause is the same in every case. I don’t think this is a coincidence anymore—it’s a fundamental weakness of centralized exchanges:
Many major companies are now adopting zero-trust security architectures, claiming to “never trust, always verify.” But engineers need high-level access to release updates, run tests, and maintain nodes. Hackers might bribe insiders, use social engineering and phishing, or breach personal devices. Once a device is compromised, even heavily controlled jump servers can be cracked one by one, rendering all identity-based authentication mechanisms effectively useless.
In essence, CEXs wear the decentralized guise of Web3, but at their core, they’re the most extreme kind of high-concurrency Web2 internet company. To provide tens of millions of users with fast deposits, withdrawals, and trading, their systems need to be highly automated. If every withdrawal required ten executives to sign with hardware wallets, the user experience would be ruined. So hot wallets have to stay online, APIs have to remain open, and automated consolidation programs have to run 24/7. This means that if hackers find an authorization vulnerability in an internal API or forge a withdrawal instruction, they can drain the funds!
Thankfully, Tether and Circle helped freeze the funds in an emergency on-chain. These safeguards prevented most of the losses, but they treat the symptoms, not the underlying problem. As long as custody and trading aren’t separated, and people remain the trust hubs in automated systems, hot wallets will always be the industry’s biggest pain point!
Follow me so you don’t lose your way, and join my group chat 👇
6
1.9k
·
--
This year, the South Korean 🇰🇷 market has provided a textbook example of how leverage can magnify a market downturn.
Vulnerability in the U.S. is now rising:
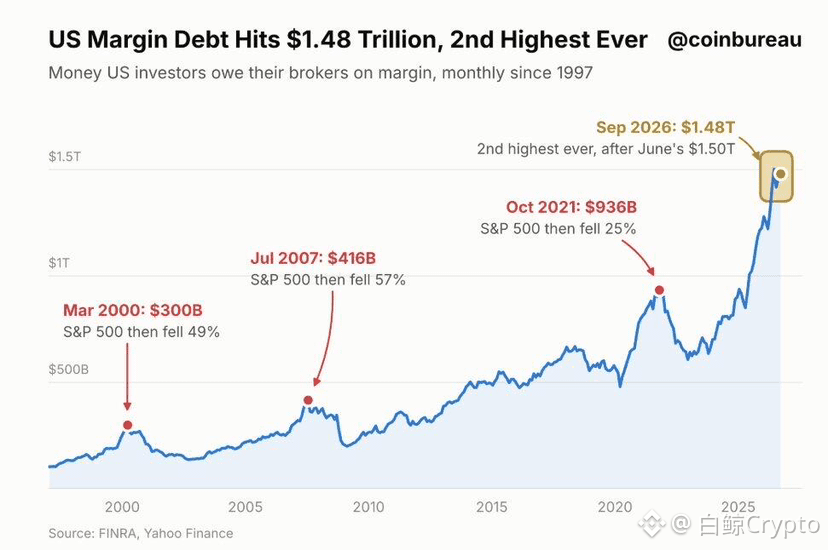
U.S. investors’ current margin debt has reached $1.48 trillion, the second-highest level on record.
According to the Financial Industry Regulatory Authority (FINRA), investors took on an additional $26 billion in margin debt in September alone. Current margin debt is just 1.5% below the record $1.50 trillion set in June.
Meanwhile, idle cash held by investors at brokerages has grown just 1.7% since October 2021, while margin debt has surged 58%.
Of course, the stock market’s overall value has also expanded.
According to First Trust data, relative to the S&P 500, investors have about $2.30 in margin debt for every $100 worth of S&P 500 stocks they hold—roughly in line with the average since 1997.
Historically, peaks in margin debt have often occurred within three months of a broader market peak:
1. March 2000: Margin debt reached $300 billion, followed by a 49% drop in the S&P 500.
2. July 2007: Margin debt reached $416 billion, followed by a 57% drop in the S&P 500.
3. October 2021: Margin debt reached $936 billion, followed by a 25% drop in the S&P 500.
In each of these market cycles, leveraged investors were forced to deleverage: margin debt fell 35%–55% from its respective peak.
This doesn’t mean a 📉 is inevitable, nor does it mean that “high margin debt directly causes a crash.” Rather, once selling begins, high leverage can amplify the decline. And extreme leverage levels tend to occur late in bull markets, when risk appetite is at its highest.
In other words, watch out for ⚠️ black swans:
1. Iran War Escalation — Trump says he won’t act before the midterms, but knowing Trump… What are the chances?
2. Credit Crisis — Bullish for 🍊
3. 🇫🇷
4. There’s also the issue of liquidity. If liquidity is poor, whether in the stock market or crypto, it can get ugly.
That’s all I can think of for now. Feel free to comment if you have anything else.
This year, the South Korean 🇰🇷 market has provided a textbook example of how leverage can magnify a market downturn.
Vulnerability in the U.S. is now rising:
U.S. investors’ current margin debt has reached $1.48 trillion, the second-highest level on record.
According to the Financial Industry Regulatory Authority (FINRA), investors took on an additional $26 billion in margin debt in September alone. Current margin debt is just 1.5% below the record $1.50 trillion set in June.
Meanwhile, idle cash held by investors at brokerages has grown just 1.7% since October 2021, while margin debt has surged 58%.
Of course, the stock market’s overall value has also expanded.
According to First Trust data, relative to the S&P 500, investors have about $2.30 in margin debt for every $100 worth of S&P 500 stocks they hold—roughly in line with the average since 1997.
Historically, peaks in margin debt have often occurred within three months of a broader market peak:
1. March 2000: Margin debt reached $300 billion, followed by a 49% drop in the S&P 500.
2. July 2007: Margin debt reached $416 billion, followed by a 57% drop in the S&P 500.
3. October 2021: Margin debt reached $936 billion, followed by a 25% drop in the S&P 500.
In each of these market cycles, leveraged investors were forced to deleverage: margin debt fell 35%–55% from its respective peak.
This doesn’t mean a 📉 is inevitable, nor does it mean that “high margin debt directly causes a crash.” Rather, once selling begins, high leverage can amplify the decline. And extreme leverage levels tend to occur late in bull markets, when risk appetite is at its highest.
In other words, watch out for ⚠️ black swans:
1. Iran War Escalation — Trump says he won’t act before the midterms, but knowing Trump… What are the chances?
2. Credit Crisis — Bullish for 🍊
3. 🇫🇷
4. There’s also the issue of liquidity. If liquidity is poor, whether in the stock market or crypto, it can get ugly.
That’s all I can think of for now. Feel free to comment if you have anything else.
Vulnerability in the U.S. is now rising:
U.S. investors’ current margin debt has reached $1.48 trillion, the second-highest level on record.
According to the Financial Industry Regulatory Authority (FINRA), investors took on an additional $26 billion in margin debt in September alone. Current margin debt is just 1.5% below the record $1.50 trillion set in June.
Meanwhile, idle cash held by investors at brokerages has grown just 1.7% since October 2021, while margin debt has surged 58%.
Of course, the stock market’s overall value has also expanded.
According to First Trust data, relative to the S&P 500, investors have about $2.30 in margin debt for every $100 worth of S&P 500 stocks they hold—roughly in line with the average since 1997.
Historically, peaks in margin debt have often occurred within three months of a broader market peak:
1. March 2000: Margin debt reached $300 billion, followed by a 49% drop in the S&P 500.
2. July 2007: Margin debt reached $416 billion, followed by a 57% drop in the S&P 500.
3. October 2021: Margin debt reached $936 billion, followed by a 25% drop in the S&P 500.
In each of these market cycles, leveraged investors were forced to deleverage: margin debt fell 35%–55% from its respective peak.
This doesn’t mean a 📉 is inevitable, nor does it mean that “high margin debt directly causes a crash.” Rather, once selling begins, high leverage can amplify the decline. And extreme leverage levels tend to occur late in bull markets, when risk appetite is at its highest.
In other words, watch out for ⚠️ black swans:
1. Iran War Escalation — Trump says he won’t act before the midterms, but knowing Trump… What are the chances?
2. Credit Crisis — Bullish for 🍊
3. 🇫🇷
4. There’s also the issue of liquidity. If liquidity is poor, whether in the stock market or crypto, it can get ugly.
That’s all I can think of for now. Feel free to comment if you have anything else.
2
1
1.1k
·
--
The market will rally before you know it #FOMC会议
But remember, opportunity favors the prepared
In a bull market, buying in installments is the best approach
Believe it or not, this bull market will be the one that most people miss out on
The buy-in point I emphasized on the livestream isn’t because the market is about to move right now—it’s so you won’t miss out later. You’ll come back and thank me!
The market will rally before you know it #FOMC会议
But remember, opportunity favors the prepared
In a bull market, buying in installments is the best approach
Believe it or not, this bull market will be the one that most people miss out on
The buy-in point I emphasized on the livestream isn’t because the market is about to move right now—it’s so you won’t miss out later. You’ll come back and thank me!
But remember, opportunity favors the prepared
In a bull market, buying in installments is the best approach
Believe it or not, this bull market will be the one that most people miss out on
The buy-in point I emphasized on the livestream isn’t because the market is about to move right now—it’s so you won’t miss out later. You’ll come back and thank me!
1k
·
--
What exactly are the big players doing right now?
ETFs were still seeing inflows just a few days ago, but then suddenly saw net outflows of $770 million over October 22–23. Clearly, some investors decided to take profits first:
BlackRock alone accounted for half of the outflows. Looking back, BlackRock has seen net inflows of around $2 billion from September through today, with its overall purchase cost basis around $82,000. That means its short-term holdings are still underwater.
U.S. stocks have been getting hammered over the past two trading days, raising clients’ appetite for safe havens. That sentiment spilling over into Bitcoin ETFs makes perfect sense. So the short-term outflows aren’t because BlackRock itself is bearish; its clients are pulling out, forcing it to process redemptions.
Besides, it takes at least months for major institutions to change course. Two or three consecutive weeks of net outflows would be needed to indicate that institutions are systematically pulling back. BlackRock’s Bitcoin ETF accounts for 60% of the entire ETF market, making it a major buying force and a clear market barometer.
Now let’s look at on-chain data:
1) Wallets holding between 10 and 10,000 BTC, $BTC , have been gradually accumulating during the market’s swings, buying a total of 85,000 to 89,000 BTC.
2) Whale holdings have also risen back to 3.03 million BTC, with the fastest monthly accumulation pace since February this year.
3) Since October, market maker Wintermute has transferred 9,458 BTC—worth around $770 million—to 40 new wallets for safekeeping.
4) In addition, Strive holds 36,818 BTC, while treasury companies such as Strategy have bought a combined 135,979 BTC and are still accumulating.
Their stance is clear: buy the dips and lock up the coins. The short-term players are selling high and seeking safety, while the long-term players are accumulating on dips. The market is still caught in a tug-of-war.
Don’t mistake short-term outflows for a signal of a major crash, and don’t take whale accumulation as a sign that prices are about to skyrocket. Just be patient and hold on to your coins~
Follow me and join my group chat. Lao Bai will help you make sense of things and stay on track👇
{future}(BTCUSDT)
What exactly are the big players doing right now?
ETFs were still seeing inflows just a few days ago, but then suddenly saw net outflows of $770 million over October 22–23. Clearly, some investors decided to take profits first:
BlackRock alone accounted for half of the outflows. Looking back, BlackRock has seen net inflows of around $2 billion from September through today, with its overall purchase cost basis around $82,000. That means its short-term holdings are still underwater.
U.S. stocks have been getting hammered over the past two trading days, raising clients’ appetite for safe havens. That sentiment spilling over into Bitcoin ETFs makes perfect sense. So the short-term outflows aren’t because BlackRock itself is bearish; its clients are pulling out, forcing it to process redemptions.
Besides, it takes at least months for major institutions to change course. Two or three consecutive weeks of net outflows would be needed to indicate that institutions are systematically pulling back. BlackRock’s Bitcoin ETF accounts for 60% of the entire ETF market, making it a major buying force and a clear market barometer.
Now let’s look at on-chain data:
1) Wallets holding between 10 and 10,000 BTC, $BTC , have been gradually accumulating during the market’s swings, buying a total of 85,000 to 89,000 BTC.
2) Whale holdings have also risen back to 3.03 million BTC, with the fastest monthly accumulation pace since February this year.
3) Since October, market maker Wintermute has transferred 9,458 BTC—worth around $770 million—to 40 new wallets for safekeeping.
4) In addition, Strive holds 36,818 BTC, while treasury companies such as Strategy have bought a combined 135,979 BTC and are still accumulating.
Their stance is clear: buy the dips and lock up the coins. The short-term players are selling high and seeking safety, while the long-term players are accumulating on dips. The market is still caught in a tug-of-war.
Don’t mistake short-term outflows for a signal of a major crash, and don’t take whale accumulation as a sign that prices are about to skyrocket. Just be patient and hold on to your coins~
Follow me and join my group chat. Lao Bai will help you make sense of things and stay on track👇
ETFs were still seeing inflows just a few days ago, but then suddenly saw net outflows of $770 million over October 22–23. Clearly, some investors decided to take profits first:
BlackRock alone accounted for half of the outflows. Looking back, BlackRock has seen net inflows of around $2 billion from September through today, with its overall purchase cost basis around $82,000. That means its short-term holdings are still underwater.
U.S. stocks have been getting hammered over the past two trading days, raising clients’ appetite for safe havens. That sentiment spilling over into Bitcoin ETFs makes perfect sense. So the short-term outflows aren’t because BlackRock itself is bearish; its clients are pulling out, forcing it to process redemptions.
Besides, it takes at least months for major institutions to change course. Two or three consecutive weeks of net outflows would be needed to indicate that institutions are systematically pulling back. BlackRock’s Bitcoin ETF accounts for 60% of the entire ETF market, making it a major buying force and a clear market barometer.
Now let’s look at on-chain data:
1) Wallets holding between 10 and 10,000 BTC, $BTC , have been gradually accumulating during the market’s swings, buying a total of 85,000 to 89,000 BTC.
2) Whale holdings have also risen back to 3.03 million BTC, with the fastest monthly accumulation pace since February this year.
3) Since October, market maker Wintermute has transferred 9,458 BTC—worth around $770 million—to 40 new wallets for safekeeping.
4) In addition, Strive holds 36,818 BTC, while treasury companies such as Strategy have bought a combined 135,979 BTC and are still accumulating.
Their stance is clear: buy the dips and lock up the coins. The short-term players are selling high and seeking safety, while the long-term players are accumulating on dips. The market is still caught in a tug-of-war.
Don’t mistake short-term outflows for a signal of a major crash, and don’t take whale accumulation as a sign that prices are about to skyrocket. Just be patient and hold on to your coins~
Follow me and join my group chat. Lao Bai will help you make sense of things and stay on track👇
1
7
4.7k
·
--
$BTC The market is looking pretty interesting right now. Retail traders are aggressively shorting, and if this keeps up, the big players are probably going to squeeze them:
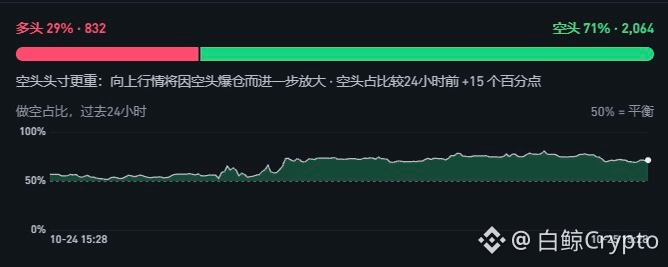
Short positions surged by another 15 percentage points over the past day. Shorts now account for as much as 71%, while longs make up only 29%. This is a classic setup: when everyone thinks the market is going to fall and rushes to open short positions, it often stops falling. There’s clearly buying support around 79,600, and selling momentum is getting weaker and weaker.
The range between 81,400 and 82,000 is packed with highly leveraged short positions—fuel just waiting for the big players. If the price nudges up and breaks above 81,400, the shorts could get squeezed, pushing the price straight up. So the most likely scenario for now is some choppy consolidation, followed by a sudden rally that liquidates the shorts above.
Here’s my personal take on short-term trading:
Either way, I absolutely wouldn’t chase a short at this level. Shorting here is like dancing on the edge of a cliff. If you want to go long, you could try a small position around the current price of 80,500, or wait for a pullback to around 80,000 before entering. Be sure to use a stop-loss, set below 79,600. If the price breaks below that, it means my read was wrong, and I’ll take the loss and exit.
For upside targets, I’d be watching 81,400 first. If the price breaks through and holds above it, it could very likely reach 82,000. If it rallies into the 81,400–82,000 range and starts losing momentum, consider reducing your position or exiting. If it really takes off, we could see a pretty decent move up. In any case, watch your position size and use a stop-loss—wicky moves are bound to happen in this market.
Follow me and join my group chat. Old Bai will help you understand the trend and stay on track👇
$BTC The market is looking pretty interesting right now. Retail traders are aggressively shorting, and if this keeps up, the big players are probably going to squeeze them:
Short positions surged by another 15 percentage points over the past day. Shorts now account for as much as 71%, while longs make up only 29%. This is a classic setup: when everyone thinks the market is going to fall and rushes to open short positions, it often stops falling. There’s clearly buying support around 79,600, and selling momentum is getting weaker and weaker.
The range between 81,400 and 82,000 is packed with highly leveraged short positions—fuel just waiting for the big players. If the price nudges up and breaks above 81,400, the shorts could get squeezed, pushing the price straight up. So the most likely scenario for now is some choppy consolidation, followed by a sudden rally that liquidates the shorts above.
Here’s my personal take on short-term trading:
Either way, I absolutely wouldn’t chase a short at this level. Shorting here is like dancing on the edge of a cliff. If you want to go long, you could try a small position around the current price of 80,500, or wait for a pullback to around 80,000 before entering. Be sure to use a stop-loss, set below 79,600. If the price breaks below that, it means my read was wrong, and I’ll take the loss and exit.
For upside targets, I’d be watching 81,400 first. If the price breaks through and holds above it, it could very likely reach 82,000. If it rallies into the 81,400–82,000 range and starts losing momentum, consider reducing your position or exiting. If it really takes off, we could see a pretty decent move up. In any case, watch your position size and use a stop-loss—wicky moves are bound to happen in this market.
Follow me and join my group chat. Old Bai will help you understand the trend and stay on track👇
Short positions surged by another 15 percentage points over the past day. Shorts now account for as much as 71%, while longs make up only 29%. This is a classic setup: when everyone thinks the market is going to fall and rushes to open short positions, it often stops falling. There’s clearly buying support around 79,600, and selling momentum is getting weaker and weaker.
The range between 81,400 and 82,000 is packed with highly leveraged short positions—fuel just waiting for the big players. If the price nudges up and breaks above 81,400, the shorts could get squeezed, pushing the price straight up. So the most likely scenario for now is some choppy consolidation, followed by a sudden rally that liquidates the shorts above.
Here’s my personal take on short-term trading:
Either way, I absolutely wouldn’t chase a short at this level. Shorting here is like dancing on the edge of a cliff. If you want to go long, you could try a small position around the current price of 80,500, or wait for a pullback to around 80,000 before entering. Be sure to use a stop-loss, set below 79,600. If the price breaks below that, it means my read was wrong, and I’ll take the loss and exit.
For upside targets, I’d be watching 81,400 first. If the price breaks through and holds above it, it could very likely reach 82,000. If it rallies into the 81,400–82,000 range and starts losing momentum, consider reducing your position or exiting. If it really takes off, we could see a pretty decent move up. In any case, watch your position size and use a stop-loss—wicky moves are bound to happen in this market.
Follow me and join my group chat. Old Bai will help you understand the trend and stay on track👇
4
15
11.9k
·
--

Article
Do Altcoins Still Have a Future?The era of broad-based gains in altcoin bull markets is over, but altcoins as an asset class are not going away. What’s disappearing is the liquidity premium of “any coin can go up.” What remains are a very small number of assets whose value can be validated by cash flow, compliant on-ramps, and network effects:
I. The most vulnerable part of the altcoin market right now
$BTC Repeatedly rejected near 84,000, with heavy overhead selling pressure, the market is consolidating in the 80,000–85,000 range in the short term as it waits for direction. But the real danger isn’t the broader market’s choppiness itself—it’s the positioning in altcoins.
Since leverage peaked in early October, more than 40% of large-cap altcoins have remained near their highest leverage levels of 2026, while the share of mid-cap altcoins in a highly leveraged state has climbed to a new year-to-date high. A round of liquidations worth about $850 million took place on October 15, but newly opened leveraged long positions quickly filled the gap afterward, with borrowed money taking the place of what had been cleared out.
Do Altcoins Still Have a Future?
The era of broad-based gains in altcoin bull markets is over, but altcoins as an asset class are not going away. What’s disappearing is the liquidity premium of “any coin can go up.” What remains are a very small number of assets whose value can be validated by cash flow, compliant on-ramps, and network effects:
I. The most vulnerable part of the altcoin market right now
$BTC Repeatedly rejected near 84,000, with heavy overhead selling pressure, the market is consolidating in the 80,000–85,000 range in the short term as it waits for direction. But the real danger isn’t the broader market’s choppiness itself—it’s the positioning in altcoins.
Since leverage peaked in early October, more than 40% of large-cap altcoins have remained near their highest leverage levels of 2026, while the share of mid-cap altcoins in a highly leveraged state has climbed to a new year-to-date high. A round of liquidations worth about $850 million took place on October 15, but newly opened leveraged long positions quickly filled the gap afterward, with borrowed money taking the place of what had been cleared out.
I. The most vulnerable part of the altcoin market right now
$BTC Repeatedly rejected near 84,000, with heavy overhead selling pressure, the market is consolidating in the 80,000–85,000 range in the short term as it waits for direction. But the real danger isn’t the broader market’s choppiness itself—it’s the positioning in altcoins.
Since leverage peaked in early October, more than 40% of large-cap altcoins have remained near their highest leverage levels of 2026, while the share of mid-cap altcoins in a highly leveraged state has climbed to a new year-to-date high. A round of liquidations worth about $850 million took place on October 15, but newly opened leveraged long positions quickly filled the gap afterward, with borrowed money taking the place of what had been cleared out.
1
2
2.3k
·
--
The era when you could buy any altcoin with your eyes closed and watch it go up is over. From now on, only a tiny handful will survive:
More than 40% of large-cap altcoins now have leverage near their yearly highs, while leverage in mid-cap coins has also hit a record. Around $850 million was liquidated on October 15, and leveraged buyers were quick to borrow money and take their place. Prices aren’t being supported by real spot buying; they’re being propped up by borrowed money and leverage. Small coins have thin order books, so when market makers pull out, liquidations can easily cascade. That’s where things stand now.
The Fed’s decision on October 29 and the November 3 midterm elections are only six days apart, and could break Bitcoin’s sideways trend. Institutions fear uncertainty, so money is concentrating in BTC and ETH. Altcoins fell 5.69% in a week, while BTC fell just 1.99%—the flow of funds is clear.
Over the past 30 days, BTC ETFs saw net inflows of about $2.09 billion, while ETH ETFs saw net outflows of about $319 million and SOL ETFs about $33.2 million. What’s more, BlackRock, the largest institutional player, only buys Bitcoin and Ether through its ETFs. Altcoins can’t count on money spilling over after the broader market rallies.
The sell pressure from VC-backed projects is the most frustrating. Recently, ZRO had an unlock worth around $43.3 million; ALLO has an unlock in November equivalent to about 64% of its circulating supply; and HUMA’s team and investor allocations are unlocking in a concentrated wave. Spot demand is already thin, so prices are bound to come under pressure. Why are so many people still falling for this?
Only these kinds of coins will survive:
First: coins with real cash flow. It’s not enough for a project to generate revenue—the revenue must be mandatorily distributed to token holders through buybacks, burns, or staking rewards. For example, Aave is projected to generate about $47 million in annual revenue from its Ethereum lending protocol. Hyperliquid generated more than $800 million in revenue over the past year, with about 99% used to buy back and burn HYPE.
Second: protocols that can provide the underlying settlement, custody, and clearing infrastructure for Wall Street’s compliant financial rails. These may be able to capture incremental demand from traditional finance. Partnerships alone aren’t enough—you also need to see whether TVL and fees are actually accruing on-chain.
Third: public blockchains whose gas fees and TVL won’t disappear as narratives rotate. Ethereum has around $52.3 billion in DeFi TVL, compared with about $6.2 billion for Solana. Solana’s on-chain fees rank among the highest of the six largest public blockchains. The value of a blockchain token doesn’t come from having lots of ecosystem projects; it comes from underlying assets and trading activity creating sustained, inelastic demand for gas, giving the token a durable demand base.
🙅Finally, stay away from highly leveraged altcoin futures. That’s just handing your margin to market makers. Follow me and join my group chat—Lao Bai will help you understand the trends 👇
The era when you could buy any altcoin with your eyes closed and watch it go up is over. From now on, only a tiny handful will survive:
More than 40% of large-cap altcoins now have leverage near their yearly highs, while leverage in mid-cap coins has also hit a record. Around $850 million was liquidated on October 15, and leveraged buyers were quick to borrow money and take their place. Prices aren’t being supported by real spot buying; they’re being propped up by borrowed money and leverage. Small coins have thin order books, so when market makers pull out, liquidations can easily cascade. That’s where things stand now.
The Fed’s decision on October 29 and the November 3 midterm elections are only six days apart, and could break Bitcoin’s sideways trend. Institutions fear uncertainty, so money is concentrating in BTC and ETH. Altcoins fell 5.69% in a week, while BTC fell just 1.99%—the flow of funds is clear.
Over the past 30 days, BTC ETFs saw net inflows of about $2.09 billion, while ETH ETFs saw net outflows of about $319 million and SOL ETFs about $33.2 million. What’s more, BlackRock, the largest institutional player, only buys Bitcoin and Ether through its ETFs. Altcoins can’t count on money spilling over after the broader market rallies.
The sell pressure from VC-backed projects is the most frustrating. Recently, ZRO had an unlock worth around $43.3 million; ALLO has an unlock in November equivalent to about 64% of its circulating supply; and HUMA’s team and investor allocations are unlocking in a concentrated wave. Spot demand is already thin, so prices are bound to come under pressure. Why are so many people still falling for this?
Only these kinds of coins will survive:
First: coins with real cash flow. It’s not enough for a project to generate revenue—the revenue must be mandatorily distributed to token holders through buybacks, burns, or staking rewards. For example, Aave is projected to generate about $47 million in annual revenue from its Ethereum lending protocol. Hyperliquid generated more than $800 million in revenue over the past year, with about 99% used to buy back and burn HYPE.
Second: protocols that can provide the underlying settlement, custody, and clearing infrastructure for Wall Street’s compliant financial rails. These may be able to capture incremental demand from traditional finance. Partnerships alone aren’t enough—you also need to see whether TVL and fees are actually accruing on-chain.
Third: public blockchains whose gas fees and TVL won’t disappear as narratives rotate. Ethereum has around $52.3 billion in DeFi TVL, compared with about $6.2 billion for Solana. Solana’s on-chain fees rank among the highest of the six largest public blockchains. The value of a blockchain token doesn’t come from having lots of ecosystem projects; it comes from underlying assets and trading activity creating sustained, inelastic demand for gas, giving the token a durable demand base.
🙅Finally, stay away from highly leveraged altcoin futures. That’s just handing your margin to market makers. Follow me and join my group chat—Lao Bai will help you understand the trends 👇
More than 40% of large-cap altcoins now have leverage near their yearly highs, while leverage in mid-cap coins has also hit a record. Around $850 million was liquidated on October 15, and leveraged buyers were quick to borrow money and take their place. Prices aren’t being supported by real spot buying; they’re being propped up by borrowed money and leverage. Small coins have thin order books, so when market makers pull out, liquidations can easily cascade. That’s where things stand now.
The Fed’s decision on October 29 and the November 3 midterm elections are only six days apart, and could break Bitcoin’s sideways trend. Institutions fear uncertainty, so money is concentrating in BTC and ETH. Altcoins fell 5.69% in a week, while BTC fell just 1.99%—the flow of funds is clear.
Over the past 30 days, BTC ETFs saw net inflows of about $2.09 billion, while ETH ETFs saw net outflows of about $319 million and SOL ETFs about $33.2 million. What’s more, BlackRock, the largest institutional player, only buys Bitcoin and Ether through its ETFs. Altcoins can’t count on money spilling over after the broader market rallies.
The sell pressure from VC-backed projects is the most frustrating. Recently, ZRO had an unlock worth around $43.3 million; ALLO has an unlock in November equivalent to about 64% of its circulating supply; and HUMA’s team and investor allocations are unlocking in a concentrated wave. Spot demand is already thin, so prices are bound to come under pressure. Why are so many people still falling for this?
Only these kinds of coins will survive:
First: coins with real cash flow. It’s not enough for a project to generate revenue—the revenue must be mandatorily distributed to token holders through buybacks, burns, or staking rewards. For example, Aave is projected to generate about $47 million in annual revenue from its Ethereum lending protocol. Hyperliquid generated more than $800 million in revenue over the past year, with about 99% used to buy back and burn HYPE.
Second: protocols that can provide the underlying settlement, custody, and clearing infrastructure for Wall Street’s compliant financial rails. These may be able to capture incremental demand from traditional finance. Partnerships alone aren’t enough—you also need to see whether TVL and fees are actually accruing on-chain.
Third: public blockchains whose gas fees and TVL won’t disappear as narratives rotate. Ethereum has around $52.3 billion in DeFi TVL, compared with about $6.2 billion for Solana. Solana’s on-chain fees rank among the highest of the six largest public blockchains. The value of a blockchain token doesn’t come from having lots of ecosystem projects; it comes from underlying assets and trading activity creating sustained, inelastic demand for gas, giving the token a durable demand base.
🙅Finally, stay away from highly leveraged altcoin futures. That’s just handing your margin to market makers. Follow me and join my group chat—Lao Bai will help you understand the trends 👇
1
3.4k
·
--
#比特币突破8.2万美元
$BTC Volatility has fallen and the price has started moving sideways. It has retested the area around 80k several times and bounced back. Most of the selling pressure from bears has been released. No matter how sharply the price breaks down, as long as it can quickly recover and hold above 80k, the trend still points upward:
The 84,000–86,000 range is a major danger zone for leveraged bears, with far more short leverage stacked above than below. If major players want to harvest liquidity, pushing the price up to trigger liquidations in this short zone would face much less resistance than crashing it down to liquidate longs.
There are a lot of breakeven sell orders in the 84,000–86,000 area. If spot buying, together with ETF inflows, can absorb this selling pressure, it could immediately trigger short covering above, rapidly pushing the price to the previous high or even higher. That’s what a short squeeze is.
Short covering provides the first splash of fuel, but it’s only enough to get the engine started. We’ve already seen the power of a short squeeze once this year: after Bitcoin broke through 84,000, more than $648 million in short positions were liquidated, including $278 million in short positions. The resulting buying pressure pushed the price straight to 87,000. If it happens again this time, the price could be driven toward 90,000!
There’s nothing new under the sun. The market just gives a new group of people the same old story. Follow me and join my fan group to make sense of the market and stay on track! 👇
#比特币突破8.2万美元
$BTC Volatility has fallen and the price has started moving sideways. It has retested the area around 80k several times and bounced back. Most of the selling pressure from bears has been released. No matter how sharply the price breaks down, as long as it can quickly recover and hold above 80k, the trend still points upward:
The 84,000–86,000 range is a major danger zone for leveraged bears, with far more short leverage stacked above than below. If major players want to harvest liquidity, pushing the price up to trigger liquidations in this short zone would face much less resistance than crashing it down to liquidate longs.
There are a lot of breakeven sell orders in the 84,000–86,000 area. If spot buying, together with ETF inflows, can absorb this selling pressure, it could immediately trigger short covering above, rapidly pushing the price to the previous high or even higher. That’s what a short squeeze is.
Short covering provides the first splash of fuel, but it’s only enough to get the engine started. We’ve already seen the power of a short squeeze once this year: after Bitcoin broke through 84,000, more than $648 million in short positions were liquidated, including $278 million in short positions. The resulting buying pressure pushed the price straight to 87,000. If it happens again this time, the price could be driven toward 90,000!
There’s nothing new under the sun. The market just gives a new group of people the same old story. Follow me and join my fan group to make sense of the market and stay on track! 👇
$BTC Volatility has fallen and the price has started moving sideways. It has retested the area around 80k several times and bounced back. Most of the selling pressure from bears has been released. No matter how sharply the price breaks down, as long as it can quickly recover and hold above 80k, the trend still points upward:
The 84,000–86,000 range is a major danger zone for leveraged bears, with far more short leverage stacked above than below. If major players want to harvest liquidity, pushing the price up to trigger liquidations in this short zone would face much less resistance than crashing it down to liquidate longs.
There are a lot of breakeven sell orders in the 84,000–86,000 area. If spot buying, together with ETF inflows, can absorb this selling pressure, it could immediately trigger short covering above, rapidly pushing the price to the previous high or even higher. That’s what a short squeeze is.
Short covering provides the first splash of fuel, but it’s only enough to get the engine started. We’ve already seen the power of a short squeeze once this year: after Bitcoin broke through 84,000, more than $648 million in short positions were liquidated, including $278 million in short positions. The resulting buying pressure pushed the price straight to 87,000. If it happens again this time, the price could be driven toward 90,000!
There’s nothing new under the sun. The market just gives a new group of people the same old story. Follow me and join my fan group to make sense of the market and stay on track! 👇
3
2.3k
·
--
#比特币重回8.4万美元
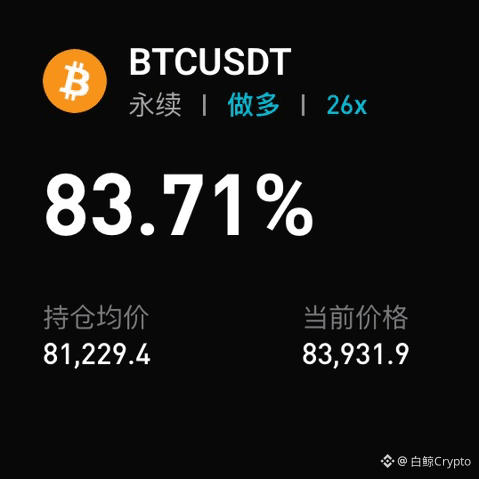
Leveraged funds are aggressively shorting futures, with short positions reaching as high as 6.2w contracts of $BTC —far exceeding the 2.8w contracts of $BTC held by longs. Retail traders on the futures market were frightened by this wave of selling and suffered a cascade of liquidations. These highly leveraged gamblers are just pawns helping to drive the market down:
While major players quietly buy up assets on the spot market, they open short positions in the futures market to hedge or push prices down. The goal is to flush out leverage—a win-win for them. Spot ETFs did see a brief outflow of funds in early October, which served as the spark that triggered market panic.
But looking at the month as a whole, giants like BlackRock are still net buyers, and the foundation remains solid. The major players aren't preparing to exit; they're reducing leverage. Retail investors are panic-selling their holdings at a loss, and those very holdings are landing in the pockets of the folks who followed Lao Bai's advice to buy the dip around 80,000.
The price pulled back from a high of 87,000, dipping as low as around 80,000—right into the core accumulation zone we had previously identified. Major players had buy orders stacked along this wall of buying support, built up with capital, and all the selling pressure was absorbed as soon as it hit. After bottoming out, the price rebounded quickly and is now back above 84,000. Panic-driven selling pressure has been exhausted, and a short-term recovery bounce is now underway.
The market is currently in a recovery phase after major players stepped in to support prices. To avoid getting shaken out in the volatility ahead, hold on to your bottom-priced holdings. The first resistance zone above is 86,000–87,000. Only a break above the previous high of 87,395 would confirm a new major uptrend. At 84,000, the market is in the middle of a rebound; if you haven't entered, I don't recommend chasing the rally. Be patient and wait for a pullback to the expected level, and always leave yourself some room to maneuver.
As I said last time, October is a quiet period for macroeconomic data, when major players have the easiest time controlling the market. The real test will come with the midterm elections in November and the year-end rate-hike test in December. Prices were pushed down, but weak hands were shaken out; newcomers took their place. The point of a shakeout is to move holdings from the hands of the fearful into the hands of the patient.
Follow me and join my fan group to make sense of the market and stay on track! Let's patiently wait for the market move that's ours!🚀
#比特币重回8.4万美元
Leveraged funds are aggressively shorting futures, with short positions reaching as high as 6.2w contracts of $BTC —far exceeding the 2.8w contracts of $BTC held by longs. Retail traders on the futures market were frightened by this wave of selling and suffered a cascade of liquidations. These highly leveraged gamblers are just pawns helping to drive the market down:
While major players quietly buy up assets on the spot market, they open short positions in the futures market to hedge or push prices down. The goal is to flush out leverage—a win-win for them. Spot ETFs did see a brief outflow of funds in early October, which served as the spark that triggered market panic.
But looking at the month as a whole, giants like BlackRock are still net buyers, and the foundation remains solid. The major players aren't preparing to exit; they're reducing leverage. Retail investors are panic-selling their holdings at a loss, and those very holdings are landing in the pockets of the folks who followed Lao Bai's advice to buy the dip around 80,000.
The price pulled back from a high of 87,000, dipping as low as around 80,000—right into the core accumulation zone we had previously identified. Major players had buy orders stacked along this wall of buying support, built up with capital, and all the selling pressure was absorbed as soon as it hit. After bottoming out, the price rebounded quickly and is now back above 84,000. Panic-driven selling pressure has been exhausted, and a short-term recovery bounce is now underway.
The market is currently in a recovery phase after major players stepped in to support prices. To avoid getting shaken out in the volatility ahead, hold on to your bottom-priced holdings. The first resistance zone above is 86,000–87,000. Only a break above the previous high of 87,395 would confirm a new major uptrend. At 84,000, the market is in the middle of a rebound; if you haven't entered, I don't recommend chasing the rally. Be patient and wait for a pullback to the expected level, and always leave yourself some room to maneuver.
As I said last time, October is a quiet period for macroeconomic data, when major players have the easiest time controlling the market. The real test will come with the midterm elections in November and the year-end rate-hike test in December. Prices were pushed down, but weak hands were shaken out; newcomers took their place. The point of a shakeout is to move holdings from the hands of the fearful into the hands of the patient.
Follow me and join my fan group to make sense of the market and stay on track! Let's patiently wait for the market move that's ours!🚀
Leveraged funds are aggressively shorting futures, with short positions reaching as high as 6.2w contracts of $BTC —far exceeding the 2.8w contracts of $BTC held by longs. Retail traders on the futures market were frightened by this wave of selling and suffered a cascade of liquidations. These highly leveraged gamblers are just pawns helping to drive the market down:
While major players quietly buy up assets on the spot market, they open short positions in the futures market to hedge or push prices down. The goal is to flush out leverage—a win-win for them. Spot ETFs did see a brief outflow of funds in early October, which served as the spark that triggered market panic.
But looking at the month as a whole, giants like BlackRock are still net buyers, and the foundation remains solid. The major players aren't preparing to exit; they're reducing leverage. Retail investors are panic-selling their holdings at a loss, and those very holdings are landing in the pockets of the folks who followed Lao Bai's advice to buy the dip around 80,000.
The price pulled back from a high of 87,000, dipping as low as around 80,000—right into the core accumulation zone we had previously identified. Major players had buy orders stacked along this wall of buying support, built up with capital, and all the selling pressure was absorbed as soon as it hit. After bottoming out, the price rebounded quickly and is now back above 84,000. Panic-driven selling pressure has been exhausted, and a short-term recovery bounce is now underway.
The market is currently in a recovery phase after major players stepped in to support prices. To avoid getting shaken out in the volatility ahead, hold on to your bottom-priced holdings. The first resistance zone above is 86,000–87,000. Only a break above the previous high of 87,395 would confirm a new major uptrend. At 84,000, the market is in the middle of a rebound; if you haven't entered, I don't recommend chasing the rally. Be patient and wait for a pullback to the expected level, and always leave yourself some room to maneuver.
As I said last time, October is a quiet period for macroeconomic data, when major players have the easiest time controlling the market. The real test will come with the midterm elections in November and the year-end rate-hike test in December. Prices were pushed down, but weak hands were shaken out; newcomers took their place. The point of a shakeout is to move holdings from the hands of the fearful into the hands of the patient.
Follow me and join my fan group to make sense of the market and stay on track! Let's patiently wait for the market move that's ours!🚀

1
1
3
5.9k
·
--
#比特币跌破8.1万美元
This pullback in Bitcoin was entirely within expectations. The price levels were all within the range I anticipated. If you want to know more, you can look back at my earlier posts. Here are some more of my thoughts:
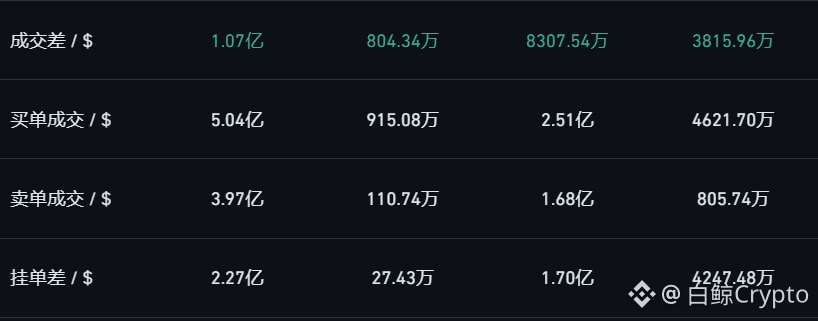
Although Bitcoin’s price has been sliding over the past few days, the order-book data has been the clearest thing to track. There’s a very interesting pattern: at several leading exchanges, large orders showed net inflows throughout the decline, whether measured by the difference in executed trades or resting orders. On Binance’s spot market, the imbalance between buys and sells was huge: net buy orders were more than five times net sell orders. Prices were being pushed down, while major players were accumulating.
The drop wasn’t driven by major players actively dumping the market. After trading sideways for a while, the market fell without any attempt to lure buyers in or set a trap. It’s pretty clear that panic selling by retail traders and a cascade of liquidations among highly leveraged longs were to blame. The market makers simply cast their nets below and quietly waited for panic-sold coins to fall in.
Based on the average purchase price, the key range where major players concentrated their accumulation this time was 81000-82000. Whenever the price falls into this range, a large number of pre-placed buy orders are triggered, absorbing all the selling pressure. As long as this buy-side defense, built up with capital, holds, the market could easily rebound after the major players have supported it and retail panic selling has run its course. So be patient and wait for the recovery~
There’s nothing new under the sun; the market just finds a new group of people to repeat the same story. Follow me and join my fan group, so you can make sense of the market and stay on track!
#比特币跌破8.1万美元
This pullback in Bitcoin was entirely within expectations. The price levels were all within the range I anticipated. If you want to know more, you can look back at my earlier posts. Here are some more of my thoughts:
Although Bitcoin’s price has been sliding over the past few days, the order-book data has been the clearest thing to track. There’s a very interesting pattern: at several leading exchanges, large orders showed net inflows throughout the decline, whether measured by the difference in executed trades or resting orders. On Binance’s spot market, the imbalance between buys and sells was huge: net buy orders were more than five times net sell orders. Prices were being pushed down, while major players were accumulating.
The drop wasn’t driven by major players actively dumping the market. After trading sideways for a while, the market fell without any attempt to lure buyers in or set a trap. It’s pretty clear that panic selling by retail traders and a cascade of liquidations among highly leveraged longs were to blame. The market makers simply cast their nets below and quietly waited for panic-sold coins to fall in.
Based on the average purchase price, the key range where major players concentrated their accumulation this time was 81000-82000. Whenever the price falls into this range, a large number of pre-placed buy orders are triggered, absorbing all the selling pressure. As long as this buy-side defense, built up with capital, holds, the market could easily rebound after the major players have supported it and retail panic selling has run its course. So be patient and wait for the recovery~
There’s nothing new under the sun; the market just finds a new group of people to repeat the same story. Follow me and join my fan group, so you can make sense of the market and stay on track!
This pullback in Bitcoin was entirely within expectations. The price levels were all within the range I anticipated. If you want to know more, you can look back at my earlier posts. Here are some more of my thoughts:
Although Bitcoin’s price has been sliding over the past few days, the order-book data has been the clearest thing to track. There’s a very interesting pattern: at several leading exchanges, large orders showed net inflows throughout the decline, whether measured by the difference in executed trades or resting orders. On Binance’s spot market, the imbalance between buys and sells was huge: net buy orders were more than five times net sell orders. Prices were being pushed down, while major players were accumulating.
The drop wasn’t driven by major players actively dumping the market. After trading sideways for a while, the market fell without any attempt to lure buyers in or set a trap. It’s pretty clear that panic selling by retail traders and a cascade of liquidations among highly leveraged longs were to blame. The market makers simply cast their nets below and quietly waited for panic-sold coins to fall in.
Based on the average purchase price, the key range where major players concentrated their accumulation this time was 81000-82000. Whenever the price falls into this range, a large number of pre-placed buy orders are triggered, absorbing all the selling pressure. As long as this buy-side defense, built up with capital, holds, the market could easily rebound after the major players have supported it and retail panic selling has run its course. So be patient and wait for the recovery~
There’s nothing new under the sun; the market just finds a new group of people to repeat the same story. Follow me and join my fan group, so you can make sense of the market and stay on track!
2
2k
·
--
8w is an opportunity—log in to the account 🧑🏼💻
8w is an opportunity—log in to the account 🧑🏼💻
1
463
·
--
There’s less than a month to go until the U.S. midterm elections on November 3, 2026. Tether believes the election could have a seismic impact on the crypto industry:
The basic idea is that the policy gains the crypto industry has managed to push through over the past year, after crypto interests poured money into lobbying, may all hinge on this vote.
Polls suggest Democrats are likely to retake the House, while the odds of them flipping the Senate are also around 60%. If control of Congress changes hands, the pro-crypto advantage the industry has built with real money could disappear overnight.
Think back to September 15: in a procedural vote in the Senate, the CLARITY Act got just 49 votes. It didn’t even come close to the 60-vote threshold, and the bill stalled. If Democrats take control of Congress, the bill is basically unlikely to pass anytime soon.
One major donor has raised more than $100 million and has $122 million in cash on hand. They’re the biggest spender of this election cycle, accounting for more than a third of all corporate political donations. They’re backing candidates from both parties, giving money to anyone who supports the CLARITY Act. But if Democrats win overall, the victories of individual Democratic candidates you backed won’t change who controls Congress.
Until the results are in, the market is entering a period of political uncertainty—the policy vacuum window mentioned in my previous post. If Democrats win, the market will price in expectations that crypto legislation will remain stalled for the long term. If Republicans hold on, the market will get a brief sigh of relief.
The political battle in Washington could move the market even before Powell’s remarks do. Real opportunities often emerge when everyone is disoriented by political noise and macroeconomic pressure. Follow me so you don’t get lost—Lao Bai will help you understand the market and get your thinking straight!
There’s less than a month to go until the U.S. midterm elections on November 3, 2026. Tether believes the election could have a seismic impact on the crypto industry:
The basic idea is that the policy gains the crypto industry has managed to push through over the past year, after crypto interests poured money into lobbying, may all hinge on this vote.
Polls suggest Democrats are likely to retake the House, while the odds of them flipping the Senate are also around 60%. If control of Congress changes hands, the pro-crypto advantage the industry has built with real money could disappear overnight.
Think back to September 15: in a procedural vote in the Senate, the CLARITY Act got just 49 votes. It didn’t even come close to the 60-vote threshold, and the bill stalled. If Democrats take control of Congress, the bill is basically unlikely to pass anytime soon.
One major donor has raised more than $100 million and has $122 million in cash on hand. They’re the biggest spender of this election cycle, accounting for more than a third of all corporate political donations. They’re backing candidates from both parties, giving money to anyone who supports the CLARITY Act. But if Democrats win overall, the victories of individual Democratic candidates you backed won’t change who controls Congress.
Until the results are in, the market is entering a period of political uncertainty—the policy vacuum window mentioned in my previous post. If Democrats win, the market will price in expectations that crypto legislation will remain stalled for the long term. If Republicans hold on, the market will get a brief sigh of relief.
The political battle in Washington could move the market even before Powell’s remarks do. Real opportunities often emerge when everyone is disoriented by political noise and macroeconomic pressure. Follow me so you don’t get lost—Lao Bai will help you understand the market and get your thinking straight!
The basic idea is that the policy gains the crypto industry has managed to push through over the past year, after crypto interests poured money into lobbying, may all hinge on this vote.
Polls suggest Democrats are likely to retake the House, while the odds of them flipping the Senate are also around 60%. If control of Congress changes hands, the pro-crypto advantage the industry has built with real money could disappear overnight.
Think back to September 15: in a procedural vote in the Senate, the CLARITY Act got just 49 votes. It didn’t even come close to the 60-vote threshold, and the bill stalled. If Democrats take control of Congress, the bill is basically unlikely to pass anytime soon.
One major donor has raised more than $100 million and has $122 million in cash on hand. They’re the biggest spender of this election cycle, accounting for more than a third of all corporate political donations. They’re backing candidates from both parties, giving money to anyone who supports the CLARITY Act. But if Democrats win overall, the victories of individual Democratic candidates you backed won’t change who controls Congress.
Until the results are in, the market is entering a period of political uncertainty—the policy vacuum window mentioned in my previous post. If Democrats win, the market will price in expectations that crypto legislation will remain stalled for the long term. If Republicans hold on, the market will get a brief sigh of relief.
The political battle in Washington could move the market even before Powell’s remarks do. Real opportunities often emerge when everyone is disoriented by political noise and macroeconomic pressure. Follow me so you don’t get lost—Lao Bai will help you understand the market and get your thinking straight!
5
8k
·
--
#比特币涨至8.65万美元后回落
After the jobs report came in much cooler than expected, the market got excited right away and Bitcoin surged to 87,000. It looked like the bull market was back! But it shot up and then immediately fell again. Clearly, this was a rebound, not the start of a new major rally:
That’s because what the market is really trading on isn’t whether rates will be cut in October, but whether the Fed will make one final rate hike this year. Expectations are sharply divided: there’s about a 77% chance rates will stay unchanged in October, but still a 66% chance of another 25-basis-point hike in December. In other words, an October pause has already been priced in. The real uncertainty hanging over the market is that year-end rate hike.
More importantly, October is a data lull for macro policy. The Fed just raised rates in September, and the next FOMC meeting is at the end of October. The surprisingly weak jobs report has also raised the odds of no October hike, leaving no major macro catalysts in the near term to send the market crashing or soaring. For big players, this is calm water with no wind or waves—the perfect time to shake out weak hands. If they wait until November, when data releases pile up, or until the big December rate decision, unexpected macro news could easily disrupt their plans. If they shake out the market now, they can stay in complete control of the timing.
BlackRock has been a net buyer of $1.57 billion over the past month, and the spot-market foundation is extremely solid. That’s strong confirmation that big players aren’t looking to trigger a crash and run. I’ve already explained how their positions are structured: they’re buying spot while pushing down futures. It’s not just arbitrage—there’s a strong possibility they’re shaking out weak hands, aiming to reduce leverage and ease pressure while profiting from market arbitrage. A win-win.
The more aggressively they shake out the market, the less resistance there’ll be later. Keep an eye on the levels I mentioned before: around 82,000 and 80,000. If you can pick up bloodied coins at 80,000 or below, you’ve scored a bargain. There’s nothing new under the sun; the market just keeps telling the same story with a different cast. Follow me to understand the market and stay on track!
#比特币涨至8.65万美元后回落
After the jobs report came in much cooler than expected, the market got excited right away and Bitcoin surged to 87,000. It looked like the bull market was back! But it shot up and then immediately fell again. Clearly, this was a rebound, not the start of a new major rally:
That’s because what the market is really trading on isn’t whether rates will be cut in October, but whether the Fed will make one final rate hike this year. Expectations are sharply divided: there’s about a 77% chance rates will stay unchanged in October, but still a 66% chance of another 25-basis-point hike in December. In other words, an October pause has already been priced in. The real uncertainty hanging over the market is that year-end rate hike.
More importantly, October is a data lull for macro policy. The Fed just raised rates in September, and the next FOMC meeting is at the end of October. The surprisingly weak jobs report has also raised the odds of no October hike, leaving no major macro catalysts in the near term to send the market crashing or soaring. For big players, this is calm water with no wind or waves—the perfect time to shake out weak hands. If they wait until November, when data releases pile up, or until the big December rate decision, unexpected macro news could easily disrupt their plans. If they shake out the market now, they can stay in complete control of the timing.
BlackRock has been a net buyer of $1.57 billion over the past month, and the spot-market foundation is extremely solid. That’s strong confirmation that big players aren’t looking to trigger a crash and run. I’ve already explained how their positions are structured: they’re buying spot while pushing down futures. It’s not just arbitrage—there’s a strong possibility they’re shaking out weak hands, aiming to reduce leverage and ease pressure while profiting from market arbitrage. A win-win.
The more aggressively they shake out the market, the less resistance there’ll be later. Keep an eye on the levels I mentioned before: around 82,000 and 80,000. If you can pick up bloodied coins at 80,000 or below, you’ve scored a bargain. There’s nothing new under the sun; the market just keeps telling the same story with a different cast. Follow me to understand the market and stay on track!
After the jobs report came in much cooler than expected, the market got excited right away and Bitcoin surged to 87,000. It looked like the bull market was back! But it shot up and then immediately fell again. Clearly, this was a rebound, not the start of a new major rally:
That’s because what the market is really trading on isn’t whether rates will be cut in October, but whether the Fed will make one final rate hike this year. Expectations are sharply divided: there’s about a 77% chance rates will stay unchanged in October, but still a 66% chance of another 25-basis-point hike in December. In other words, an October pause has already been priced in. The real uncertainty hanging over the market is that year-end rate hike.
More importantly, October is a data lull for macro policy. The Fed just raised rates in September, and the next FOMC meeting is at the end of October. The surprisingly weak jobs report has also raised the odds of no October hike, leaving no major macro catalysts in the near term to send the market crashing or soaring. For big players, this is calm water with no wind or waves—the perfect time to shake out weak hands. If they wait until November, when data releases pile up, or until the big December rate decision, unexpected macro news could easily disrupt their plans. If they shake out the market now, they can stay in complete control of the timing.
BlackRock has been a net buyer of $1.57 billion over the past month, and the spot-market foundation is extremely solid. That’s strong confirmation that big players aren’t looking to trigger a crash and run. I’ve already explained how their positions are structured: they’re buying spot while pushing down futures. It’s not just arbitrage—there’s a strong possibility they’re shaking out weak hands, aiming to reduce leverage and ease pressure while profiting from market arbitrage. A win-win.
The more aggressively they shake out the market, the less resistance there’ll be later. Keep an eye on the levels I mentioned before: around 82,000 and 80,000. If you can pick up bloodied coins at 80,000 or below, you’ve scored a bargain. There’s nothing new under the sun; the market just keeps telling the same story with a different cast. Follow me to understand the market and stay on track!
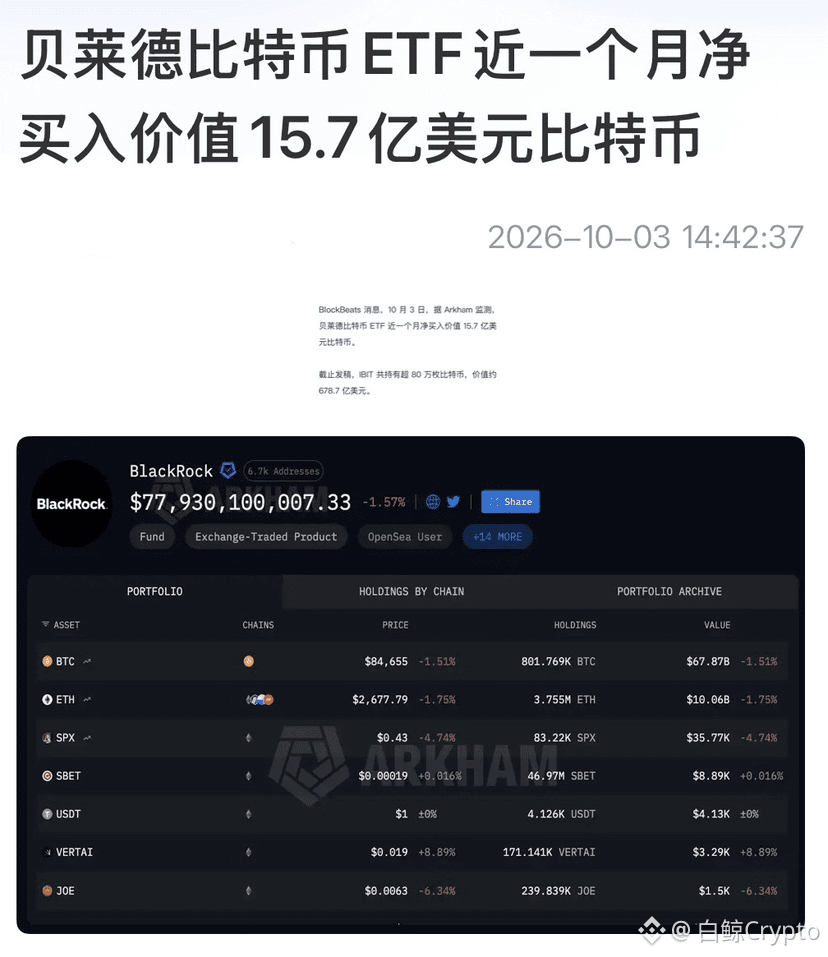
2
32
34.2k
·
--
You previously mentioned that there’s a large backlog of highly leveraged long positions below 83k-78k due to the earlier warning, so be on guard against the main force inserting downward needles. Now the signal to wash the market has officially triggered:
Daily net inflows into Bitcoin ETFs are now down to just $15.1 million. Compared with the furious $1 billion outflow on September 21, institutional buying has almost stopped. As a result, over the past few days it hasn’t been easy to push prices above 85k. The spot-engine is temporarily sputtering. Previously, prices were pushed from 78k to 85k purely because Wall Street’s ETFs were smashing the spot market day after day with billions in real money. Now ETF buying has slowed to only $15 million, and the market has lost its biggest one-way driving force.
Earlier on, because ETF buying was too aggressive, market makers didn’t dare to freely dump price downward. Now that institutional buying has withdrawn, the liquidation chips from the highly leveraged chasing longs piled up in the 82,000—83,000 dollar range are completely exposed to the market makers’ crosshairs. Without strong spot bids propping it up, taking out these leveraged longs with a downward needle is now an extremely low-cost, extremely high-return move.
The game has entered the most critical leverage-clearing phase. Around $82,000 is a very high-value liquidation price point for longs that chased at the highs! Now the price at 83,000 is only one step away. Liquidating the longs at 82,000 is the first gate; $80,000 is the second line of defense. Once $82,000 is penetrated from below, the drop continues down to as far as 79,500, where more leveraged positions are stacked. If the needle goes all the way there, the total global liquidation amount would likely not be less than $2 billion.
The ETF is just taking a break. The institutional spot base is extremely solid and they haven’t sold. This kind of micro-level pin is purely about blowing up leverage—it's just that the leverage level piled up in the market is too high, so the market has a need to kill leverage. The more vicious the washout, the smaller the resistance will be afterward. If you can wash out the high-leverage longs, 78k-80k is absolutely bloody chips—picking them up means you’re winning. The market always repeats the cycle of squeezing leverage, building up energy, breaking out, and distributing inventory. Tap follow to understand the trend—don’t get lost!
You previously mentioned that there’s a large backlog of highly leveraged long positions below 83k-78k due to the earlier warning, so be on guard against the main force inserting downward needles. Now the signal to wash the market has officially triggered:
Daily net inflows into Bitcoin ETFs are now down to just $15.1 million. Compared with the furious $1 billion outflow on September 21, institutional buying has almost stopped. As a result, over the past few days it hasn’t been easy to push prices above 85k. The spot-engine is temporarily sputtering. Previously, prices were pushed from 78k to 85k purely because Wall Street’s ETFs were smashing the spot market day after day with billions in real money. Now ETF buying has slowed to only $15 million, and the market has lost its biggest one-way driving force.
Earlier on, because ETF buying was too aggressive, market makers didn’t dare to freely dump price downward. Now that institutional buying has withdrawn, the liquidation chips from the highly leveraged chasing longs piled up in the 82,000—83,000 dollar range are completely exposed to the market makers’ crosshairs. Without strong spot bids propping it up, taking out these leveraged longs with a downward needle is now an extremely low-cost, extremely high-return move.
The game has entered the most critical leverage-clearing phase. Around $82,000 is a very high-value liquidation price point for longs that chased at the highs! Now the price at 83,000 is only one step away. Liquidating the longs at 82,000 is the first gate; $80,000 is the second line of defense. Once $82,000 is penetrated from below, the drop continues down to as far as 79,500, where more leveraged positions are stacked. If the needle goes all the way there, the total global liquidation amount would likely not be less than $2 billion.
The ETF is just taking a break. The institutional spot base is extremely solid and they haven’t sold. This kind of micro-level pin is purely about blowing up leverage—it's just that the leverage level piled up in the market is too high, so the market has a need to kill leverage. The more vicious the washout, the smaller the resistance will be afterward. If you can wash out the high-leverage longs, 78k-80k is absolutely bloody chips—picking them up means you’re winning. The market always repeats the cycle of squeezing leverage, building up energy, breaking out, and distributing inventory. Tap follow to understand the trend—don’t get lost!
Daily net inflows into Bitcoin ETFs are now down to just $15.1 million. Compared with the furious $1 billion outflow on September 21, institutional buying has almost stopped. As a result, over the past few days it hasn’t been easy to push prices above 85k. The spot-engine is temporarily sputtering. Previously, prices were pushed from 78k to 85k purely because Wall Street’s ETFs were smashing the spot market day after day with billions in real money. Now ETF buying has slowed to only $15 million, and the market has lost its biggest one-way driving force.
Earlier on, because ETF buying was too aggressive, market makers didn’t dare to freely dump price downward. Now that institutional buying has withdrawn, the liquidation chips from the highly leveraged chasing longs piled up in the 82,000—83,000 dollar range are completely exposed to the market makers’ crosshairs. Without strong spot bids propping it up, taking out these leveraged longs with a downward needle is now an extremely low-cost, extremely high-return move.
The game has entered the most critical leverage-clearing phase. Around $82,000 is a very high-value liquidation price point for longs that chased at the highs! Now the price at 83,000 is only one step away. Liquidating the longs at 82,000 is the first gate; $80,000 is the second line of defense. Once $82,000 is penetrated from below, the drop continues down to as far as 79,500, where more leveraged positions are stacked. If the needle goes all the way there, the total global liquidation amount would likely not be less than $2 billion.
The ETF is just taking a break. The institutional spot base is extremely solid and they haven’t sold. This kind of micro-level pin is purely about blowing up leverage—it's just that the leverage level piled up in the market is too high, so the market has a need to kill leverage. The more vicious the washout, the smaller the resistance will be afterward. If you can wash out the high-leverage longs, 78k-80k is absolutely bloody chips—picking them up means you’re winning. The market always repeats the cycle of squeezing leverage, building up energy, breaking out, and distributing inventory. Tap follow to understand the trend—don’t get lost!
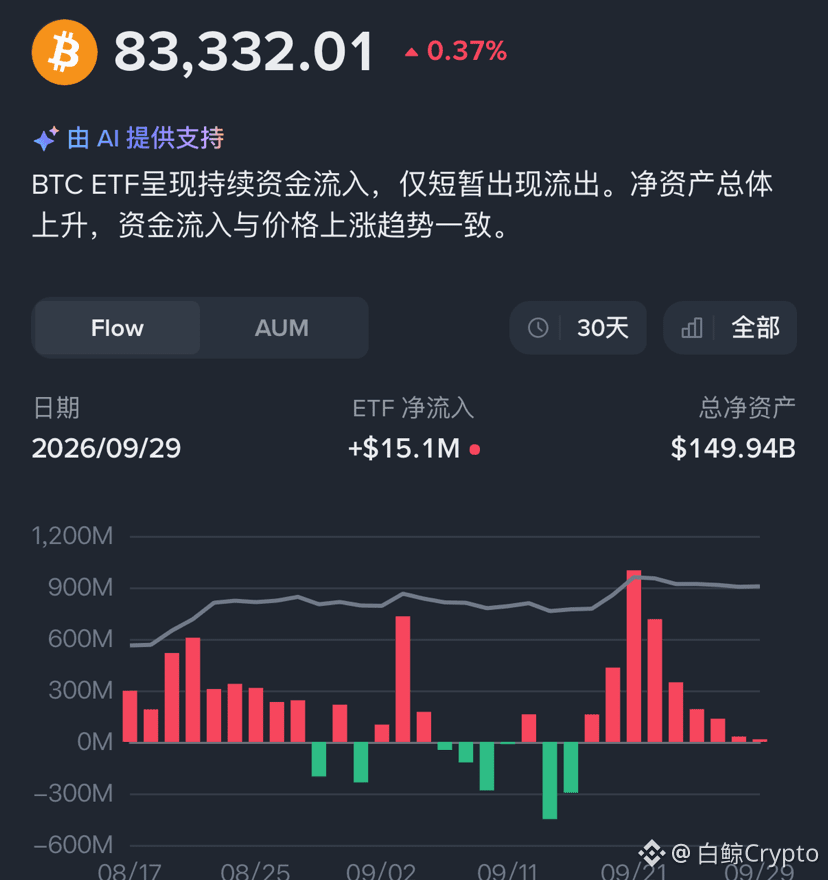
1
4
4.3k
·
--
Analyze the Order Book Data
CME Bitcoin positions have surged straight through the $10 billion mark, setting a new high. Trading volume on the order book is highly concentrated during the U.S. and European session. Asian retail traders are still on the sidelines, while Western institutions are already疯狂 sweeping up.
Wall Street is indeed buying—but they aren’t blindly bullish. When CME open interest breaks above $10 billion, don’t assume institutions are planning a one-way vertical rally. Institutional longs have added some long-term base positions, but leveraged funds’ shorts are疯狂 pressing down; shorts are far outnumbering longs!
Institutions are buying spot while executing dual-sided cash-and-carry arbitrage with short futures. They buy spot on the ETF side and open short positions on the CME futures side to lock in funding rates and basis. Wall Street doesn’t bet on a one-way move; they profit from risk-free interest rate spreads. With such tight risk control, institutions absolutely won’t allow the market to get out of hand. With spot buying propping things up, the likelihood of the broader market instantly collapsing and crashing is low—so don’t let the shorts raise their expectations too high.
When the price touched 87,000, the shorts above have essentially been swept out. That means the fuel for a squeeze-driven move has been used up. In the $83,000 to $78,000 range, there’s an extremely dense pile of high-leverage longs. On top of that, between 86,000 and 88,000, there is a heavy sell-wall. The resistance to push higher is substantial, while the pull toward liquidation downward is quite strong. So you need to guard against the main force stabbing downward—washing out those high-leverage longs. If it drops to 78,000–80,000, you can pick up “bloodied” chips!
Analyze the Order Book Data
CME Bitcoin positions have surged straight through the $10 billion mark, setting a new high. Trading volume on the order book is highly concentrated during the U.S. and European session. Asian retail traders are still on the sidelines, while Western institutions are already疯狂 sweeping up.
Wall Street is indeed buying—but they aren’t blindly bullish. When CME open interest breaks above $10 billion, don’t assume institutions are planning a one-way vertical rally. Institutional longs have added some long-term base positions, but leveraged funds’ shorts are疯狂 pressing down; shorts are far outnumbering longs!
Institutions are buying spot while executing dual-sided cash-and-carry arbitrage with short futures. They buy spot on the ETF side and open short positions on the CME futures side to lock in funding rates and basis. Wall Street doesn’t bet on a one-way move; they profit from risk-free interest rate spreads. With such tight risk control, institutions absolutely won’t allow the market to get out of hand. With spot buying propping things up, the likelihood of the broader market instantly collapsing and crashing is low—so don’t let the shorts raise their expectations too high.
When the price touched 87,000, the shorts above have essentially been swept out. That means the fuel for a squeeze-driven move has been used up. In the $83,000 to $78,000 range, there’s an extremely dense pile of high-leverage longs. On top of that, between 86,000 and 88,000, there is a heavy sell-wall. The resistance to push higher is substantial, while the pull toward liquidation downward is quite strong. So you need to guard against the main force stabbing downward—washing out those high-leverage longs. If it drops to 78,000–80,000, you can pick up “bloodied” chips!
CME Bitcoin positions have surged straight through the $10 billion mark, setting a new high. Trading volume on the order book is highly concentrated during the U.S. and European session. Asian retail traders are still on the sidelines, while Western institutions are already疯狂 sweeping up.
Wall Street is indeed buying—but they aren’t blindly bullish. When CME open interest breaks above $10 billion, don’t assume institutions are planning a one-way vertical rally. Institutional longs have added some long-term base positions, but leveraged funds’ shorts are疯狂 pressing down; shorts are far outnumbering longs!
Institutions are buying spot while executing dual-sided cash-and-carry arbitrage with short futures. They buy spot on the ETF side and open short positions on the CME futures side to lock in funding rates and basis. Wall Street doesn’t bet on a one-way move; they profit from risk-free interest rate spreads. With such tight risk control, institutions absolutely won’t allow the market to get out of hand. With spot buying propping things up, the likelihood of the broader market instantly collapsing and crashing is low—so don’t let the shorts raise their expectations too high.
When the price touched 87,000, the shorts above have essentially been swept out. That means the fuel for a squeeze-driven move has been used up. In the $83,000 to $78,000 range, there’s an extremely dense pile of high-leverage longs. On top of that, between 86,000 and 88,000, there is a heavy sell-wall. The resistance to push higher is substantial, while the pull toward liquidation downward is quite strong. So you need to guard against the main force stabbing downward—washing out those high-leverage longs. If it drops to 78,000–80,000, you can pick up “bloodied” chips!
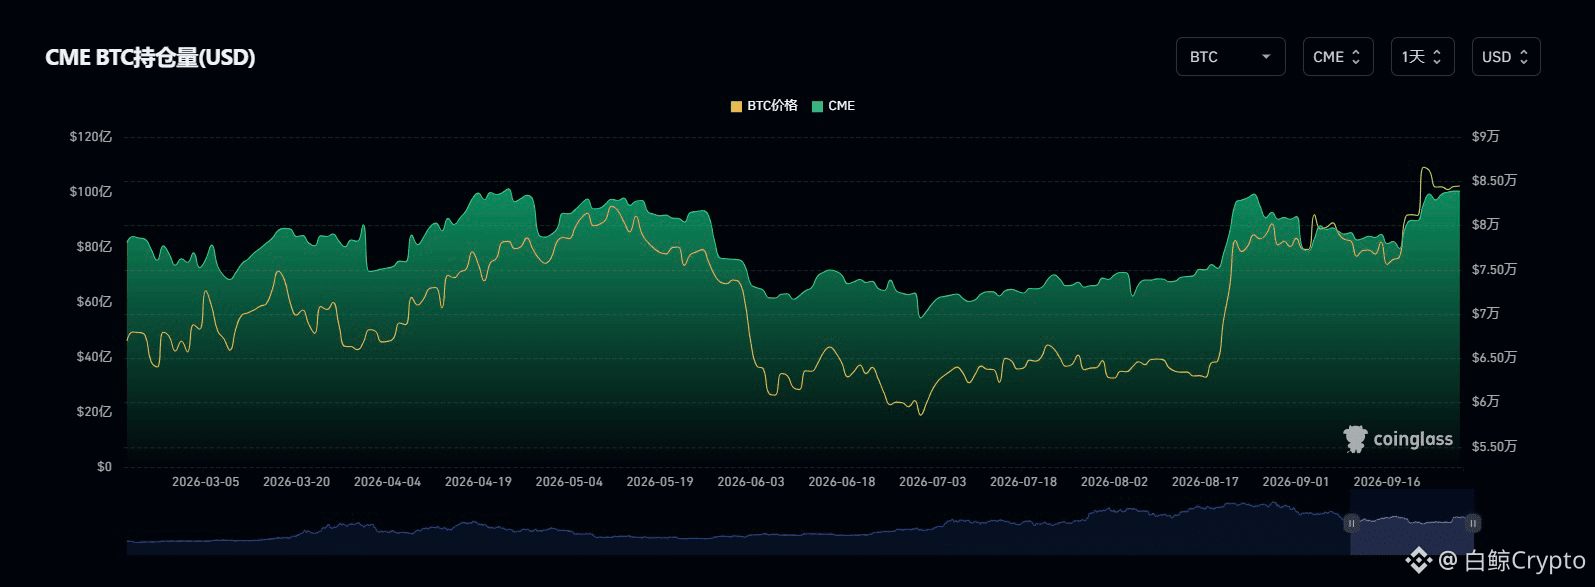
1
1
1.3k
·
--
#比特币现货ETF净流入9.99亿美元
Last time, I said to watch the inflows of ETF funds. Now the signal is very clear. On Monday, the single-day net inflow into the BTC ETF was nearly $1 billion, while the net inflow into the Ethereum ETF was $270 million. Combined, that’s roughly $1.3 billion in total inflows. With this data laid out, the market’s core driving force has undergone a stage-based shift:
Previously, the move from 76,000 to around 83,000 was mainly driven by liquidation-related forces from on-exchange derivatives that created a short squeeze. The price was pushed up by passive buying triggered when short positions hit stop-losses or got liquidated. Before, I was worried that once the shorts between 76,000 and 83,000 were swept clean, the buy-side momentum would dry up. But with ETF inflows totaling nearly $2 billion when combining Friday and Monday, this is no longer a microstructure squeeze—now it’s targeted macro fund “irrigation.”
Now, Wall Street institutions are directly taking out nearly $1.3 billion in real money via ETFs to sweep the market, chewing through the sell-wall pressure on the order of tens of millions and forcing it away. This confirms that real off-exchange capital is forcibly pushing up the bottom. The market has officially shifted to a traditional institutional spot-cash “taking up” mode. A daily figure of $1.3 billion is extremely outrageous; historically, it’s also rare. If, over the next few days, inflows can be maintained around $300–500 million, then 85,000 might only be a transit stop.
If today it’s $1 billion, but tomorrow it directly shrinks to $100 million—or even turns negative—then these two days of explosive rally would have essentially overdrawn the future buying power. As before, keep a close eye on the daily ETF data. When there is overwhelming buy-side order flow from institutions, any technical resistance is basically paper-thin. Don’t go against the trend, and don’t go against Wall Street.
#比特币现货ETF净流入9.99亿美元
Last time, I said to watch the inflows of ETF funds. Now the signal is very clear. On Monday, the single-day net inflow into the BTC ETF was nearly $1 billion, while the net inflow into the Ethereum ETF was $270 million. Combined, that’s roughly $1.3 billion in total inflows. With this data laid out, the market’s core driving force has undergone a stage-based shift:
Previously, the move from 76,000 to around 83,000 was mainly driven by liquidation-related forces from on-exchange derivatives that created a short squeeze. The price was pushed up by passive buying triggered when short positions hit stop-losses or got liquidated. Before, I was worried that once the shorts between 76,000 and 83,000 were swept clean, the buy-side momentum would dry up. But with ETF inflows totaling nearly $2 billion when combining Friday and Monday, this is no longer a microstructure squeeze—now it’s targeted macro fund “irrigation.”
Now, Wall Street institutions are directly taking out nearly $1.3 billion in real money via ETFs to sweep the market, chewing through the sell-wall pressure on the order of tens of millions and forcing it away. This confirms that real off-exchange capital is forcibly pushing up the bottom. The market has officially shifted to a traditional institutional spot-cash “taking up” mode. A daily figure of $1.3 billion is extremely outrageous; historically, it’s also rare. If, over the next few days, inflows can be maintained around $300–500 million, then 85,000 might only be a transit stop.
If today it’s $1 billion, but tomorrow it directly shrinks to $100 million—or even turns negative—then these two days of explosive rally would have essentially overdrawn the future buying power. As before, keep a close eye on the daily ETF data. When there is overwhelming buy-side order flow from institutions, any technical resistance is basically paper-thin. Don’t go against the trend, and don’t go against Wall Street.
Last time, I said to watch the inflows of ETF funds. Now the signal is very clear. On Monday, the single-day net inflow into the BTC ETF was nearly $1 billion, while the net inflow into the Ethereum ETF was $270 million. Combined, that’s roughly $1.3 billion in total inflows. With this data laid out, the market’s core driving force has undergone a stage-based shift:
Previously, the move from 76,000 to around 83,000 was mainly driven by liquidation-related forces from on-exchange derivatives that created a short squeeze. The price was pushed up by passive buying triggered when short positions hit stop-losses or got liquidated. Before, I was worried that once the shorts between 76,000 and 83,000 were swept clean, the buy-side momentum would dry up. But with ETF inflows totaling nearly $2 billion when combining Friday and Monday, this is no longer a microstructure squeeze—now it’s targeted macro fund “irrigation.”
Now, Wall Street institutions are directly taking out nearly $1.3 billion in real money via ETFs to sweep the market, chewing through the sell-wall pressure on the order of tens of millions and forcing it away. This confirms that real off-exchange capital is forcibly pushing up the bottom. The market has officially shifted to a traditional institutional spot-cash “taking up” mode. A daily figure of $1.3 billion is extremely outrageous; historically, it’s also rare. If, over the next few days, inflows can be maintained around $300–500 million, then 85,000 might only be a transit stop.
If today it’s $1 billion, but tomorrow it directly shrinks to $100 million—or even turns negative—then these two days of explosive rally would have essentially overdrawn the future buying power. As before, keep a close eye on the daily ETF data. When there is overwhelming buy-side order flow from institutions, any technical resistance is basically paper-thin. Don’t go against the trend, and don’t go against Wall Street.
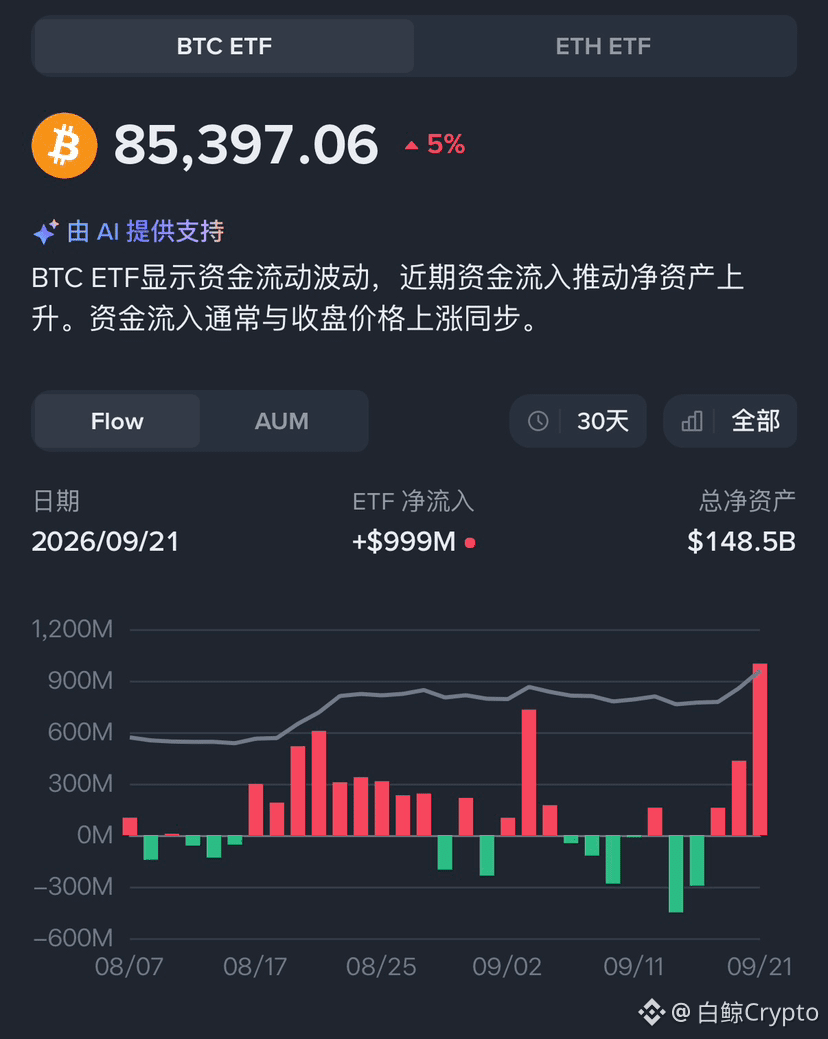
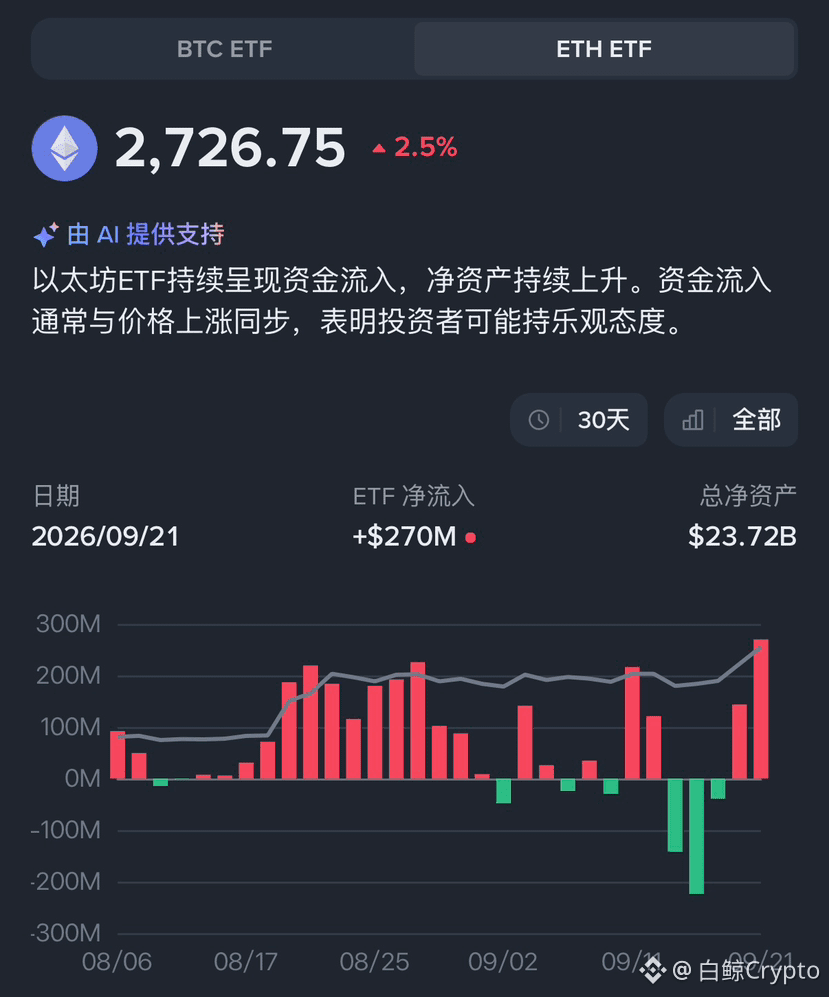
1
2
1.3k
Log in to explore more content
Join global crypto users on Binance Square
⚡️ Get latest and useful information about crypto.
💬 Trusted by the world’s largest crypto exchange.
👍 Discover real insights from verified creators.
Email / Phone number
Trending Topics
WithdrawalsBack: 15 networks live
348 views
19 Discussing
Binance News Update | Binance Reopens Withdrawals for BTC, ETH, USDT and More Across 15 Networks, Meeting Its Sunday Target
Binance News
·22 Likes
·8.8k views
BinanceUpdatesProofofReservesAddresses
33,478 views
752 Discussing
BinanceToResumePhaseOneOfWithdrawals
65,817 views
1,006 Discussing