

KanT Crypto
4.4k Posts

KanT Crypto
Report
Block User
Decoding Politics. Tracking Crypto. Real-time news. 100% Signal with 0% Noise.
Open Trade

BNB Holder
Frequent Trader
1.2 Years
124 Following
1.7K+ Followers
8.2K+ Liked
Posts
Portfolio
All
Quotes
Videos
Live
PINNED
·
--
Bullish
Verified
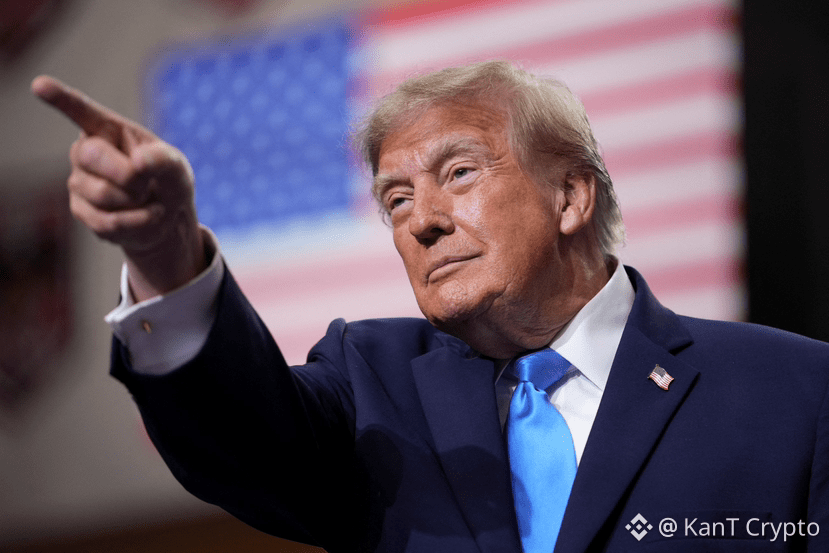
🚨 BREAKING: 🇺🇸 Trump Reportedly Signs Order Letting Tax-Free Red Diesel Run on US Highways
The move would allow dyed off-road diesel, normally reserved for farms and heavy equipment, on public roads for the rest of 2026.
It's the same fuel. The red dye only marks that highway taxes weren't paid: 24.3 cents a gallon federal, plus about 35.5 cents in state taxes on average. Louisiana and Nebraska had already eased the rules on their own.
The catch: analysts say it won't lower the wholesale price. Refiners still get market rates, so the relief comes from skipped taxes, not more supply.
For markets, cheaper fuel at the pump cools inflation a little, and every bit helps the case for a Fed on hold.
Watch whether pump prices actually fall, and whether the diesel export-ban talk comes back.
Not financial advice.
$CL
{future}(CLUSDT)
$BZ
{future}(BZUSDT)
$NATGAS
{future}(NATGASUSDT)
🚨 BREAKING: 🇺🇸 Trump Reportedly Signs Order Letting Tax-Free Red Diesel Run on US Highways
The move would allow dyed off-road diesel, normally reserved for farms and heavy equipment, on public roads for the rest of 2026.
It's the same fuel. The red dye only marks that highway taxes weren't paid: 24.3 cents a gallon federal, plus about 35.5 cents in state taxes on average. Louisiana and Nebraska had already eased the rules on their own.
The catch: analysts say it won't lower the wholesale price. Refiners still get market rates, so the relief comes from skipped taxes, not more supply.
For markets, cheaper fuel at the pump cools inflation a little, and every bit helps the case for a Fed on hold.
Watch whether pump prices actually fall, and whether the diesel export-ban talk comes back.
Not financial advice.
$CL
$BZ
$NATGAS
The move would allow dyed off-road diesel, normally reserved for farms and heavy equipment, on public roads for the rest of 2026.
It's the same fuel. The red dye only marks that highway taxes weren't paid: 24.3 cents a gallon federal, plus about 35.5 cents in state taxes on average. Louisiana and Nebraska had already eased the rules on their own.
The catch: analysts say it won't lower the wholesale price. Refiners still get market rates, so the relief comes from skipped taxes, not more supply.
For markets, cheaper fuel at the pump cools inflation a little, and every bit helps the case for a Fed on hold.
Watch whether pump prices actually fall, and whether the diesel export-ban talk comes back.
Not financial advice.
$CL
$BZ
$NATGAS
1
1
26
31.3k
PINNED
·
--
Bearish
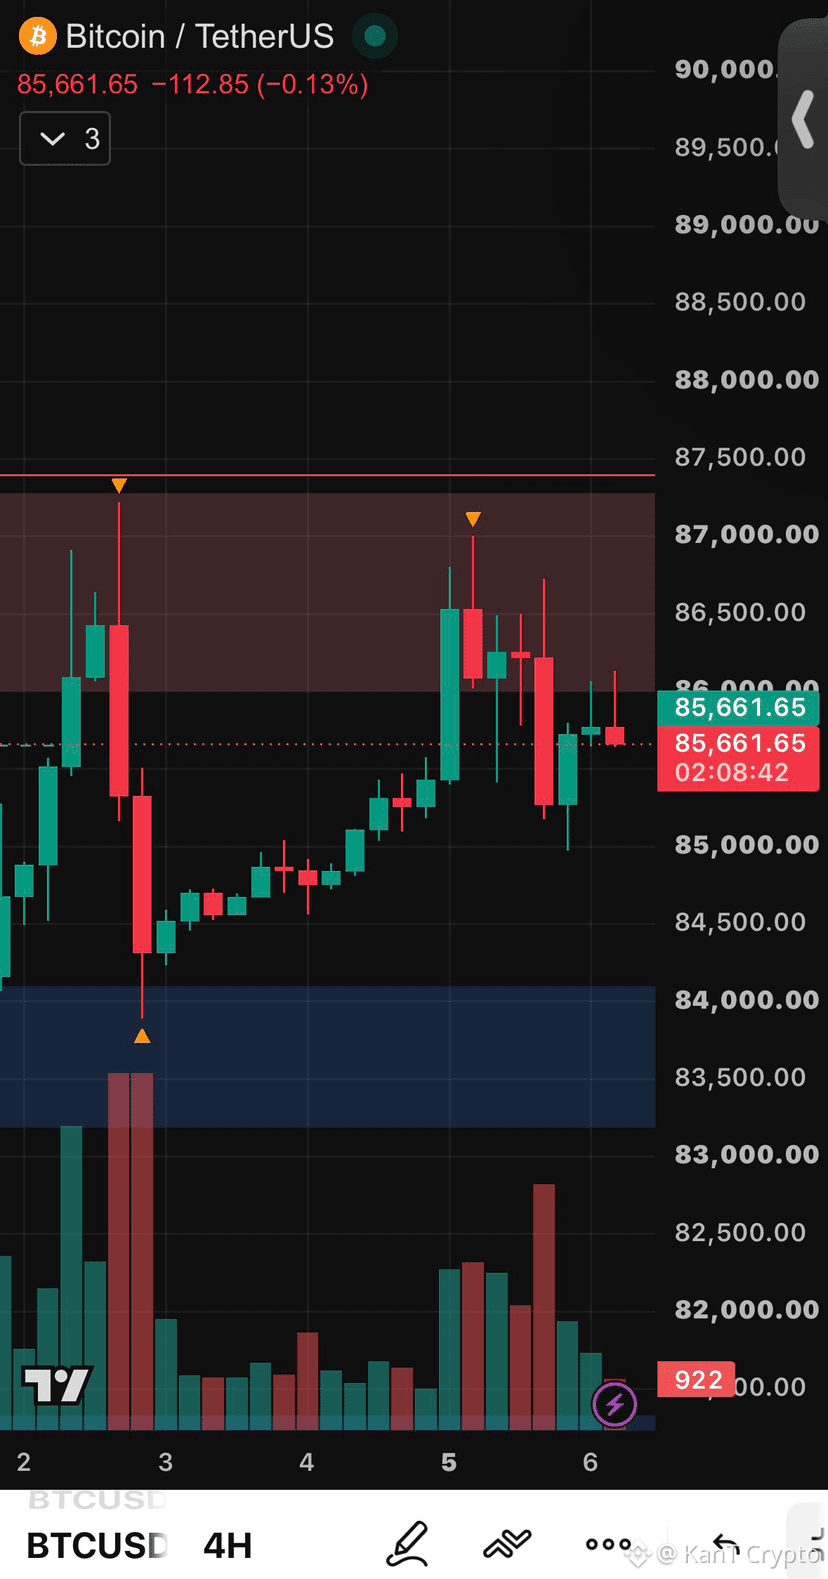
⚠️ The $87K Wall Just Blocked Bitcoin for the Third Time
Same wall. Same result.
Late September: rejected at $87.4K.
October 2: rejected at $87.2K.
October 5: rejected near $87K, then sold straight down to $85K.
Now BTC sits at $85,660 on the 4H, catching its breath. 👀
For the record, last time we said another rejection would make $85K the first stop. That's exactly where the selling paused, and the level is holding for now.
Look closer at those tops, though. Each push peaks a little lower: $87.4K, $87.2K, $87K, then $86.7K, and the latest bounce stalled near $86.1K. Buyers keep showing up, just with less force each time.
The lows tell the opposite story: $83.9K after the jobs-report flush, $85K this time. Higher lows under lower highs means the range is getting squeezed from both sides, and squeezes don't last forever.
The levels.
A 4H close above $87.4K finally breaks the wall, and the September highs turn into support.
Lose $85K, and the $83.2K to $84.1K demand zone is next, the same area that caught the last flush.
When a range tightens like this, the break usually comes fast. Let it pick a direction before you do.
Fourth try breaks the wall, or does $85K crack first? 🔥
Not financial advice.
$BTC
{future}(BTCUSDT)
$RLC
{future}(RLCUSDT)
$NEAR
{future}(NEARUSDT)
⚠️ The $87K Wall Just Blocked Bitcoin for the Third Time
Same wall. Same result.
Late September: rejected at $87.4K.
October 2: rejected at $87.2K.
October 5: rejected near $87K, then sold straight down to $85K.
Now BTC sits at $85,660 on the 4H, catching its breath. 👀
For the record, last time we said another rejection would make $85K the first stop. That's exactly where the selling paused, and the level is holding for now.
Look closer at those tops, though. Each push peaks a little lower: $87.4K, $87.2K, $87K, then $86.7K, and the latest bounce stalled near $86.1K. Buyers keep showing up, just with less force each time.
The lows tell the opposite story: $83.9K after the jobs-report flush, $85K this time. Higher lows under lower highs means the range is getting squeezed from both sides, and squeezes don't last forever.
The levels.
A 4H close above $87.4K finally breaks the wall, and the September highs turn into support.
Lose $85K, and the $83.2K to $84.1K demand zone is next, the same area that caught the last flush.
When a range tightens like this, the break usually comes fast. Let it pick a direction before you do.
Fourth try breaks the wall, or does $85K crack first? 🔥
Not financial advice.
$BTC
$RLC
$NEAR
Same wall. Same result.
Late September: rejected at $87.4K.
October 2: rejected at $87.2K.
October 5: rejected near $87K, then sold straight down to $85K.
Now BTC sits at $85,660 on the 4H, catching its breath. 👀
For the record, last time we said another rejection would make $85K the first stop. That's exactly where the selling paused, and the level is holding for now.
Look closer at those tops, though. Each push peaks a little lower: $87.4K, $87.2K, $87K, then $86.7K, and the latest bounce stalled near $86.1K. Buyers keep showing up, just with less force each time.
The lows tell the opposite story: $83.9K after the jobs-report flush, $85K this time. Higher lows under lower highs means the range is getting squeezed from both sides, and squeezes don't last forever.
The levels.
A 4H close above $87.4K finally breaks the wall, and the September highs turn into support.
Lose $85K, and the $83.2K to $84.1K demand zone is next, the same area that caught the last flush.
When a range tightens like this, the break usually comes fast. Let it pick a direction before you do.
Fourth try breaks the wall, or does $85K crack first? 🔥
Not financial advice.
$BTC
$RLC
$NEAR
1
8
7.3k
·
--
Bearish
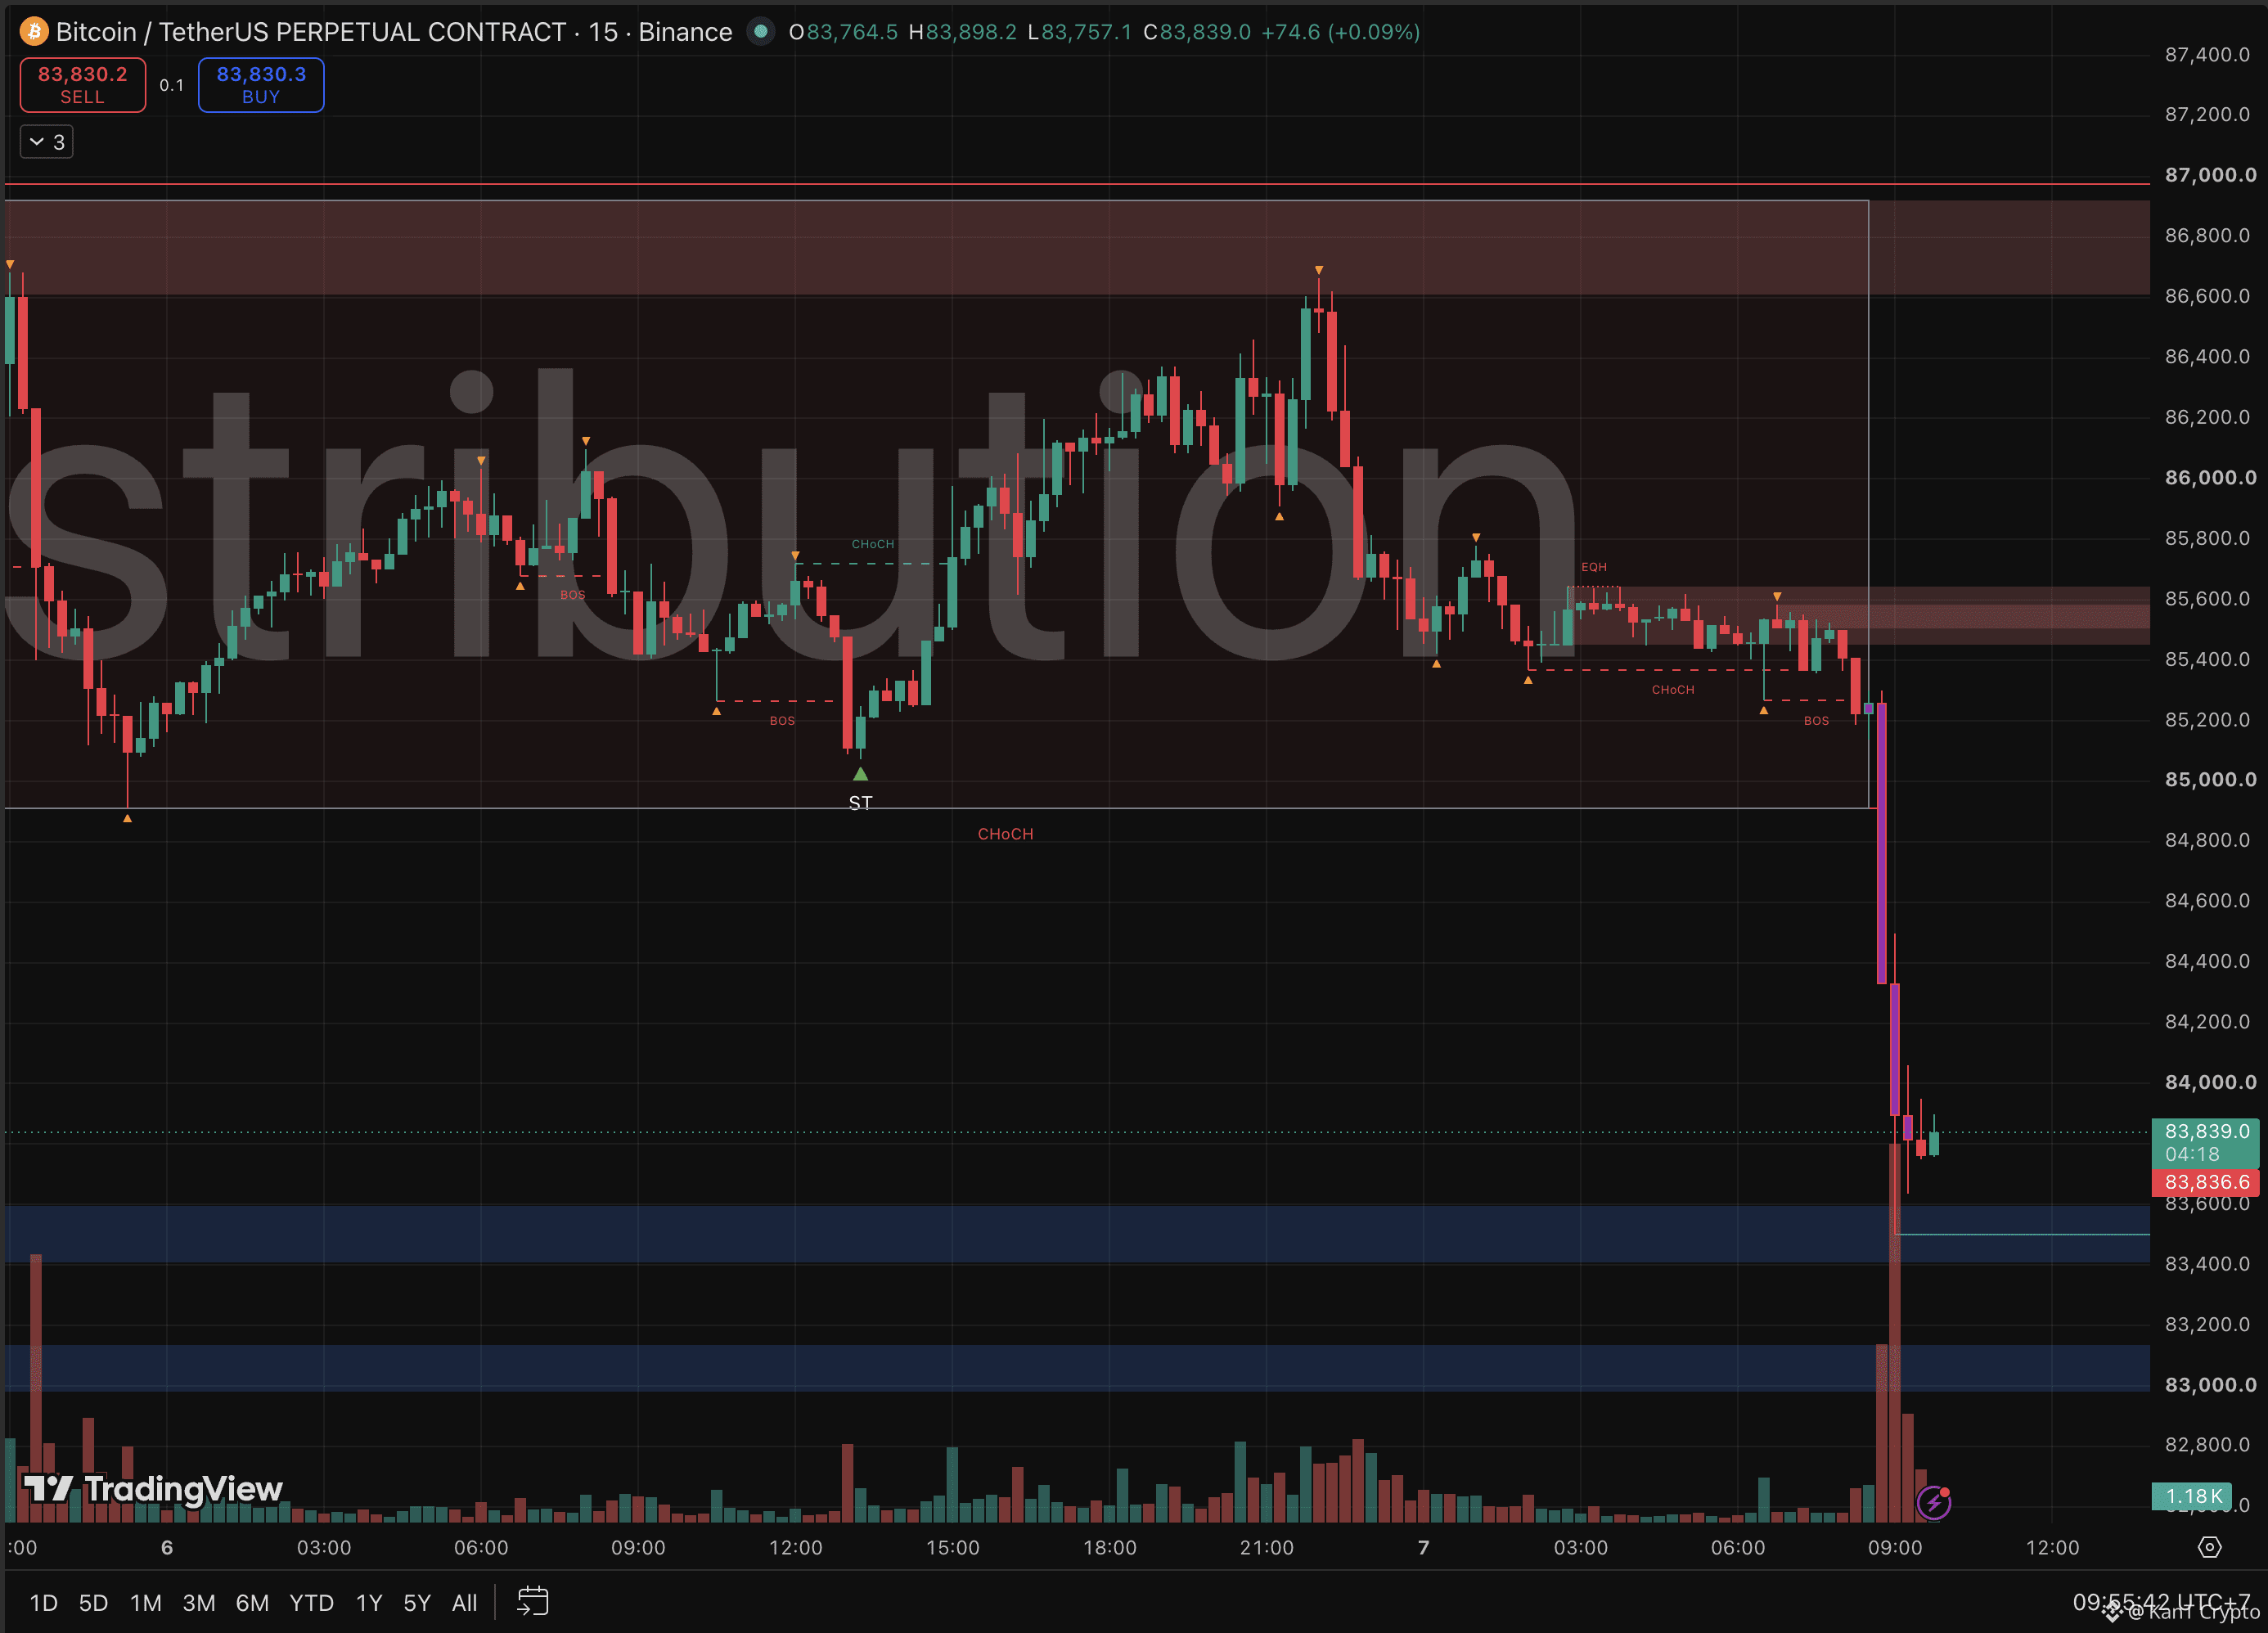
🚨 BREAKING: Bitcoin Just Dropped $2,200 in Under Two Hours
BTC slid from around $85.6K to a low near $83.4K, and leveraged longs took the hit. Liquidation trackers reportedly show over $400 million in longs wiped out.
Why so fast? 👀
The range had been squeezing for days, with lower highs pressing on higher lows. Stops and liquidation levels likely sat just under the range floor near $85K. Once price slipped through, every forced sell pushed it lower and triggered the next one. That's a liquidation cascade.
For the record, this morning we said losing $84.9K would put the $83K to $84K cushion in play. It took a couple of hours. Price now sits around $83,840, right inside that zone.
What comes next depends on whether the cushion holds.
Hold $83.4K, and this can turn into a flush that cleared out late leverage, a reset rather than a breakdown.
Lose $83K, and the $80K to $81.3K zone becomes the next magnet.
Bulls need back above $85K to repair the damage.
The Fed's September meeting minutes land later today at 2 p.m. ET, so the volatility may not be done.
Cascades end when the forced sellers run out. Don't become one of them.
Flush and recover, or more pain toward $81K? 🔥
Not financial advice. $BTC
{future}(BTCUSDT)
$RLC
{future}(RLCUSDT)
$BR
{future}(BRUSDT)
🚨 BREAKING: Bitcoin Just Dropped $2,200 in Under Two Hours
BTC slid from around $85.6K to a low near $83.4K, and leveraged longs took the hit. Liquidation trackers reportedly show over $400 million in longs wiped out.
Why so fast? 👀
The range had been squeezing for days, with lower highs pressing on higher lows. Stops and liquidation levels likely sat just under the range floor near $85K. Once price slipped through, every forced sell pushed it lower and triggered the next one. That's a liquidation cascade.
For the record, this morning we said losing $84.9K would put the $83K to $84K cushion in play. It took a couple of hours. Price now sits around $83,840, right inside that zone.
What comes next depends on whether the cushion holds.
Hold $83.4K, and this can turn into a flush that cleared out late leverage, a reset rather than a breakdown.
Lose $83K, and the $80K to $81.3K zone becomes the next magnet.
Bulls need back above $85K to repair the damage.
The Fed's September meeting minutes land later today at 2 p.m. ET, so the volatility may not be done.
Cascades end when the forced sellers run out. Don't become one of them.
Flush and recover, or more pain toward $81K? 🔥
Not financial advice. $BTC
$RLC
$BR
BTC slid from around $85.6K to a low near $83.4K, and leveraged longs took the hit. Liquidation trackers reportedly show over $400 million in longs wiped out.
Why so fast? 👀
The range had been squeezing for days, with lower highs pressing on higher lows. Stops and liquidation levels likely sat just under the range floor near $85K. Once price slipped through, every forced sell pushed it lower and triggered the next one. That's a liquidation cascade.
For the record, this morning we said losing $84.9K would put the $83K to $84K cushion in play. It took a couple of hours. Price now sits around $83,840, right inside that zone.
What comes next depends on whether the cushion holds.
Hold $83.4K, and this can turn into a flush that cleared out late leverage, a reset rather than a breakdown.
Lose $83K, and the $80K to $81.3K zone becomes the next magnet.
Bulls need back above $85K to repair the damage.
The Fed's September meeting minutes land later today at 2 p.m. ET, so the volatility may not be done.
Cascades end when the forced sellers run out. Don't become one of them.
Flush and recover, or more pain toward $81K? 🔥
Not financial advice. $BTC
$RLC
$BR
2
1.6k
·
--
Bearish
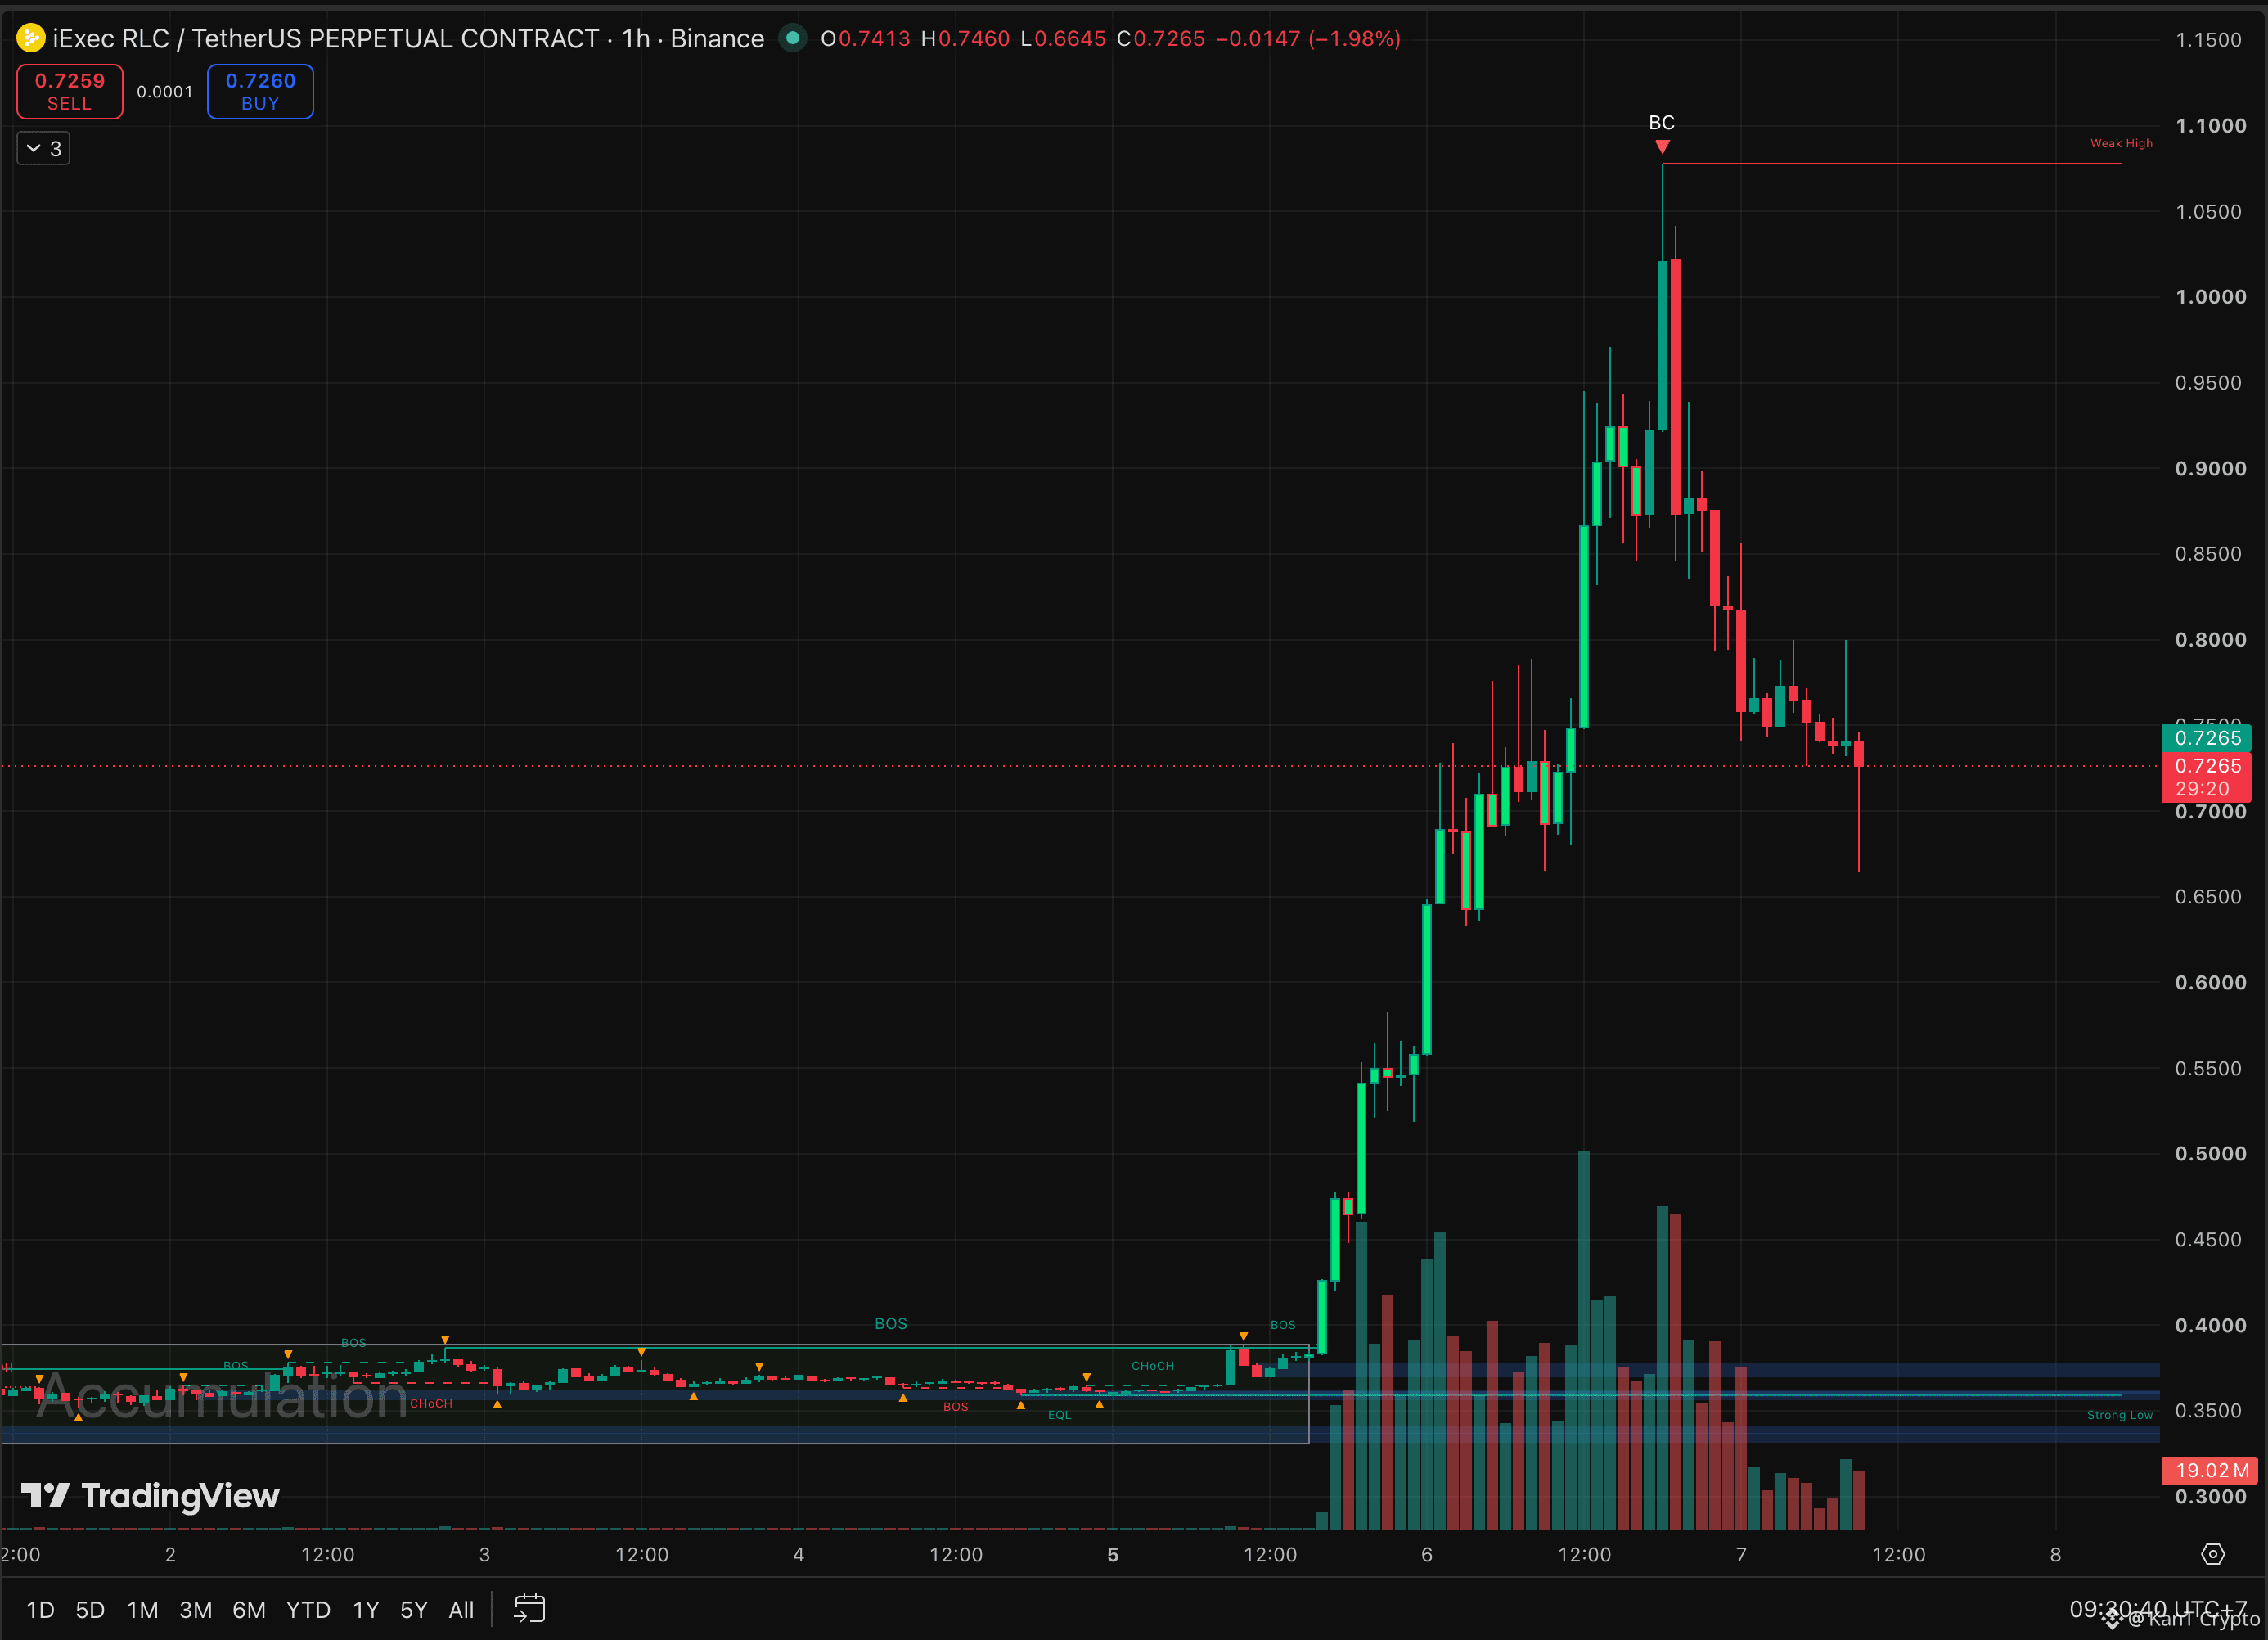
⚖️ RLC's Rocket Stalled Above $1. Reload or Return to the Launchpad?
It broke $1, tagged about $1.08, and then gravity showed up.
Now $0.73, roughly 33% off the top.
For the record, every level from last time got hit, in order. The push above $0.90 reached the $1 magnet and beyond. Then the drop sliced through $0.90 and $0.79, and this hour just wicked into $0.665 before bouncing. 👀
So which is it?
The case for a reload:
That $0.665 wick got bought immediately.
Selling volume on the way down is far lighter than the buying on the way up.
The $0.665 to $0.79 range could become the new base.
The case for the launchpad:
The top printed a buying climax on heavy volume, a classic exhaustion signal.
Price has lost two support levels in a row.
Below $0.665, there's little in the way until $0.55, then the $0.34 to $0.39 base where it all started.
The levels.
Hold $0.665 and reclaim $0.79, and the reload case takes over.
Lose $0.665 on a close, and the trip back toward the pad gets real.
Rockets need fuel to relaunch. Watch whether volume comes back before trusting the bounce.
Reload above $0.79, or back to the pad? 🔥
Not financial advice.
$RLC
{future}(RLCUSDT)
$ORCA
{future}(ORCAUSDT)
$BR
{future}(BRUSDT)
⚖️ RLC's Rocket Stalled Above $1. Reload or Return to the Launchpad?
It broke $1, tagged about $1.08, and then gravity showed up.
Now $0.73, roughly 33% off the top.
For the record, every level from last time got hit, in order. The push above $0.90 reached the $1 magnet and beyond. Then the drop sliced through $0.90 and $0.79, and this hour just wicked into $0.665 before bouncing. 👀
So which is it?
The case for a reload:
That $0.665 wick got bought immediately.
Selling volume on the way down is far lighter than the buying on the way up.
The $0.665 to $0.79 range could become the new base.
The case for the launchpad:
The top printed a buying climax on heavy volume, a classic exhaustion signal.
Price has lost two support levels in a row.
Below $0.665, there's little in the way until $0.55, then the $0.34 to $0.39 base where it all started.
The levels.
Hold $0.665 and reclaim $0.79, and the reload case takes over.
Lose $0.665 on a close, and the trip back toward the pad gets real.
Rockets need fuel to relaunch. Watch whether volume comes back before trusting the bounce.
Reload above $0.79, or back to the pad? 🔥
Not financial advice.
$RLC
$ORCA
$BR
It broke $1, tagged about $1.08, and then gravity showed up.
Now $0.73, roughly 33% off the top.
For the record, every level from last time got hit, in order. The push above $0.90 reached the $1 magnet and beyond. Then the drop sliced through $0.90 and $0.79, and this hour just wicked into $0.665 before bouncing. 👀
So which is it?
The case for a reload:
That $0.665 wick got bought immediately.
Selling volume on the way down is far lighter than the buying on the way up.
The $0.665 to $0.79 range could become the new base.
The case for the launchpad:
The top printed a buying climax on heavy volume, a classic exhaustion signal.
Price has lost two support levels in a row.
Below $0.665, there's little in the way until $0.55, then the $0.34 to $0.39 base where it all started.
The levels.
Hold $0.665 and reclaim $0.79, and the reload case takes over.
Lose $0.665 on a close, and the trip back toward the pad gets real.
Rockets need fuel to relaunch. Watch whether volume comes back before trusting the bounce.
Reload above $0.79, or back to the pad? 🔥
Not financial advice.
$RLC
$ORCA
$BR
2
4
1.3k
·
--
Bullish
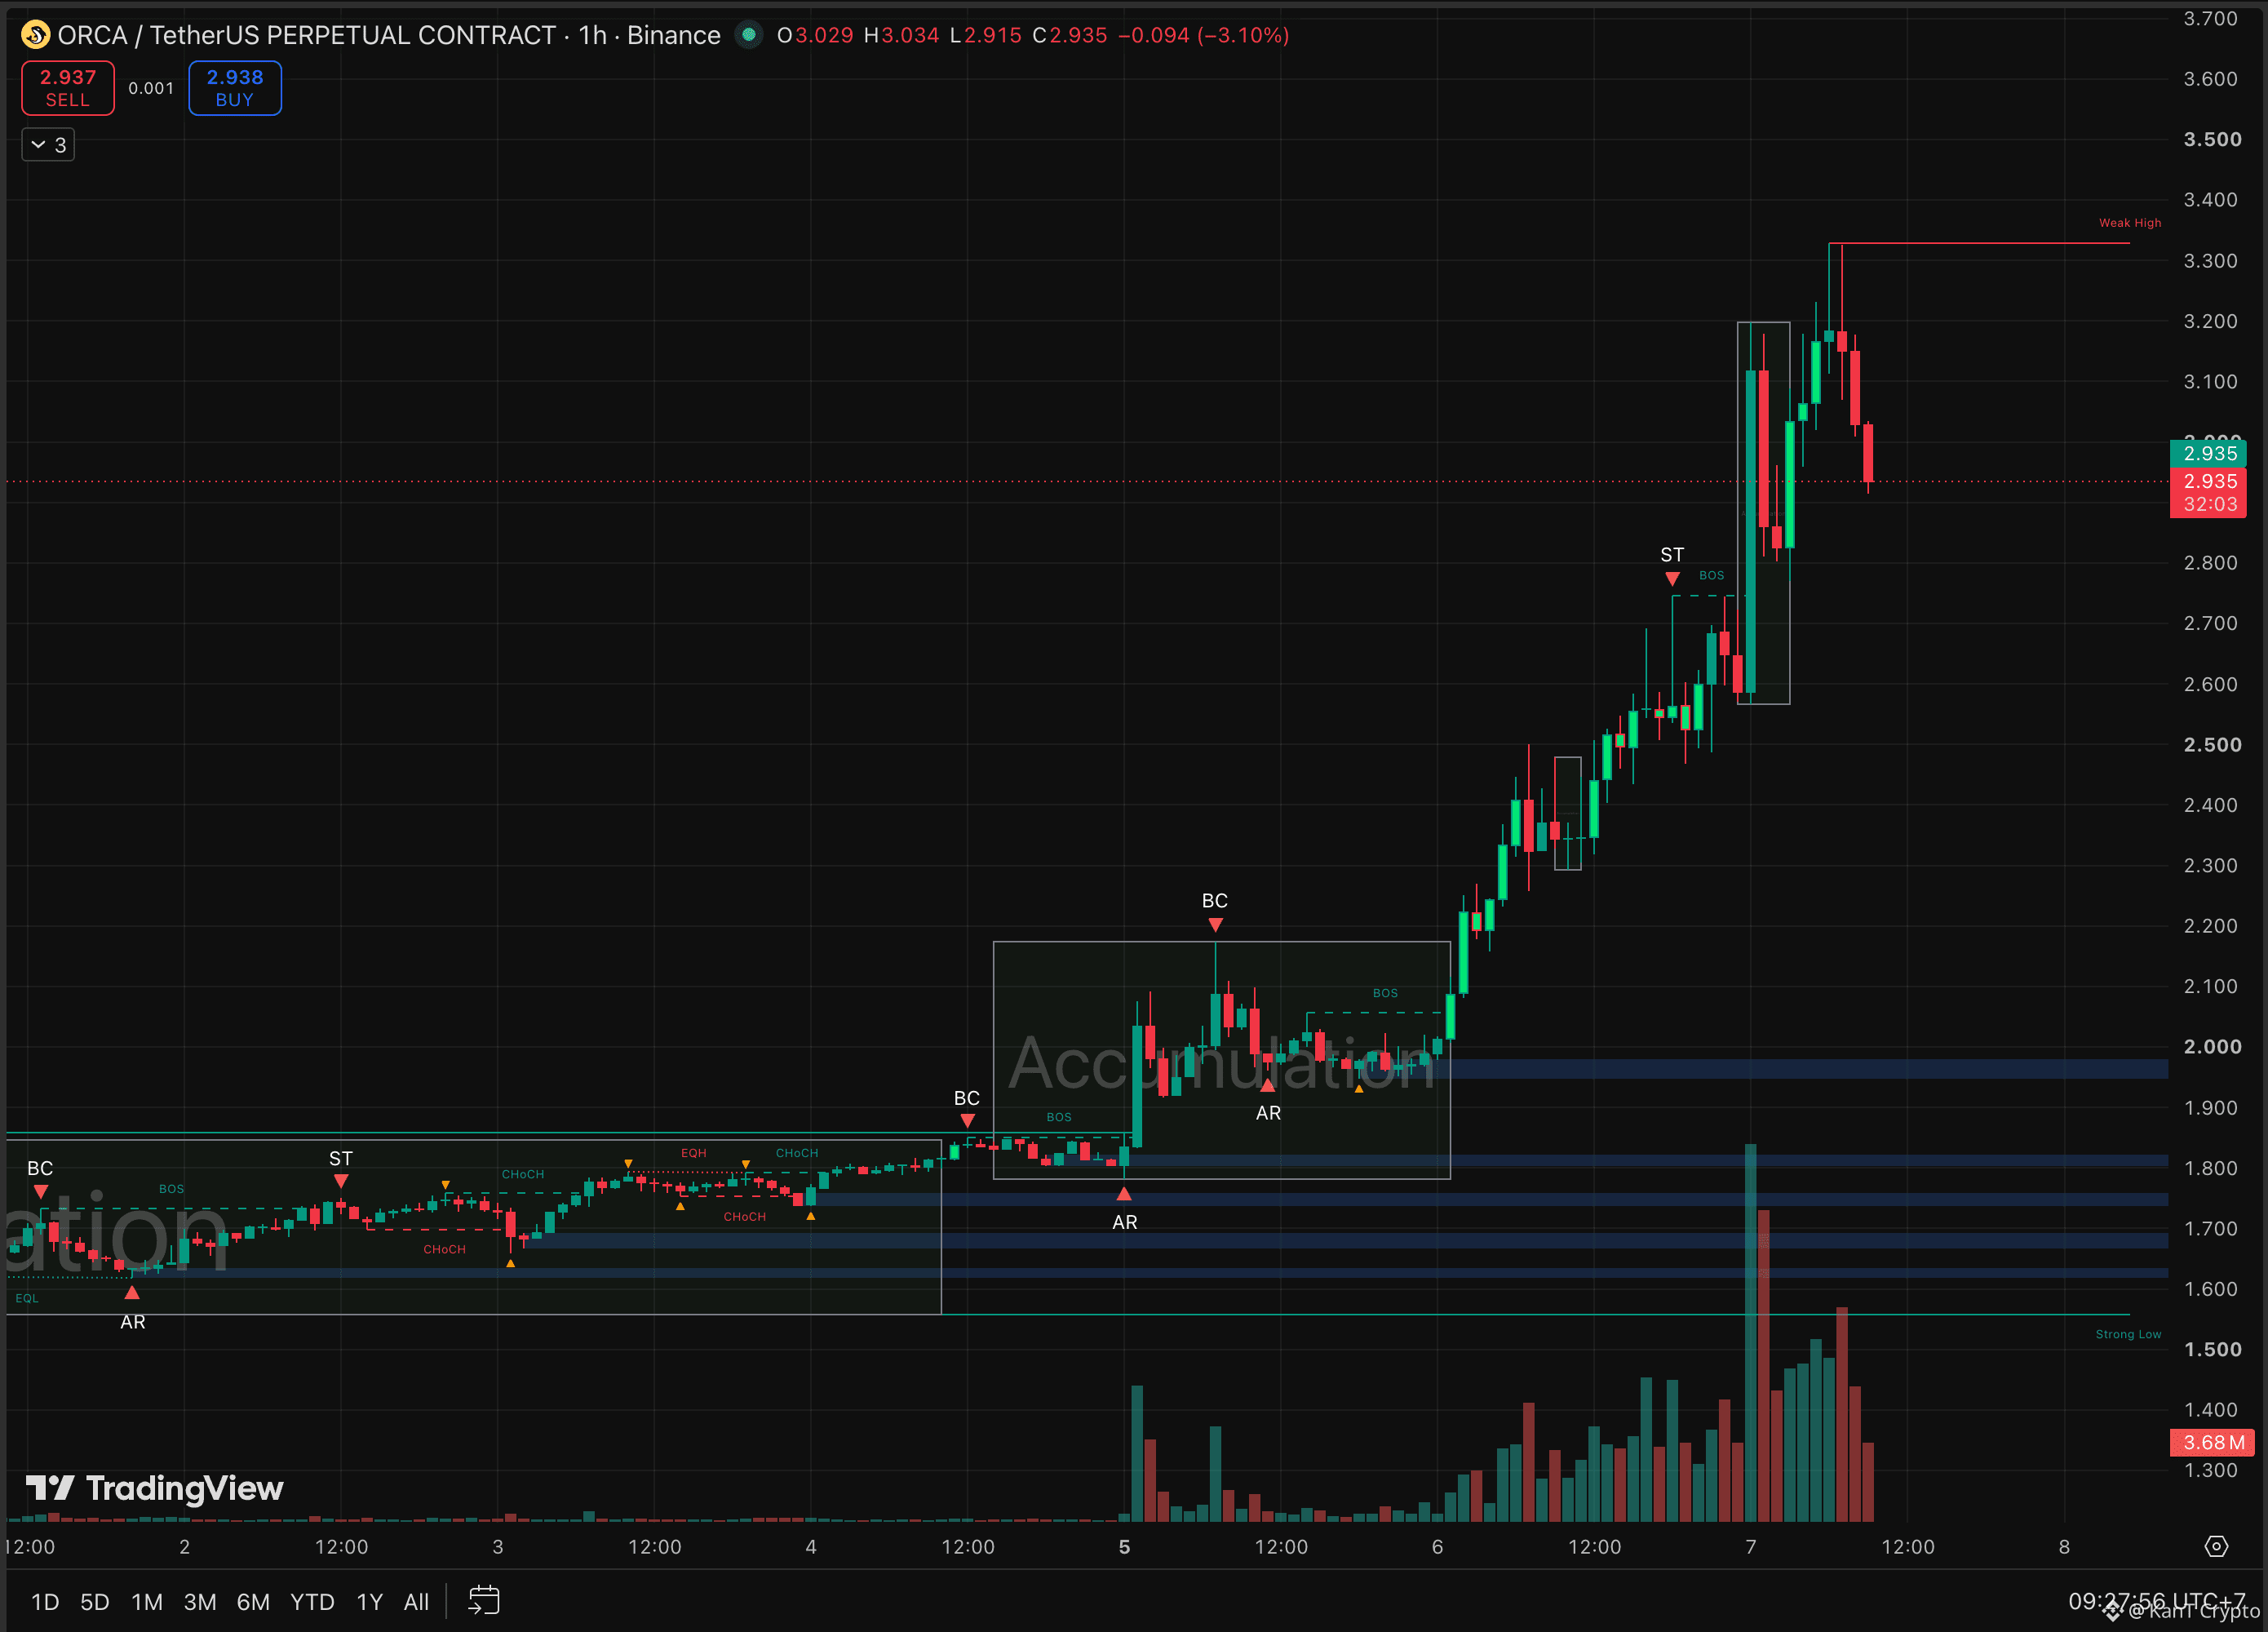
🚀 ORCA Nearly Doubled in a Week. Now It's Catching Its Breath
$1.56 to $3.33.
Two clean bases, two breakouts, one big candle on the heaviest volume of the move.
Now $2.93, the first real pullback of the run, about 12% off the high.
This is the moment that decides what kind of rally it was. 👀
Healthy trends pull back and hold old resistance as support.
Exhausted ones slice straight through it.
A little history helps here too. ORCA has sprinted before this year. February's spike to about $1.62 faded all the way back near $1.10 by August. Momentum alone hasn't been enough to keep it up.
And for perspective, even at $3, ORCA is still roughly 87% below its $22.28 all-time high.
The levels.
Hold $2.80 to $2.85, the floor of the last range, and another shot at $3.33 is on the table.
Lose it, and $2.60 to $2.70 is the next shelf.
Below that, $1.95 to $2.05 is where the second base broke out.
Rallies are proven on the pullback, not on the way up.
Reload above $2.80, or a deeper reset first? 🔥
Not financial advice.
$ORCA
{future}(ORCAUSDT)
$RLC
{future}(RLCUSDT)
$BR
{future}(BRUSDT)
🚀 ORCA Nearly Doubled in a Week. Now It's Catching Its Breath
$1.56 to $3.33.
Two clean bases, two breakouts, one big candle on the heaviest volume of the move.
Now $2.93, the first real pullback of the run, about 12% off the high.
This is the moment that decides what kind of rally it was. 👀
Healthy trends pull back and hold old resistance as support.
Exhausted ones slice straight through it.
A little history helps here too. ORCA has sprinted before this year. February's spike to about $1.62 faded all the way back near $1.10 by August. Momentum alone hasn't been enough to keep it up.
And for perspective, even at $3, ORCA is still roughly 87% below its $22.28 all-time high.
The levels.
Hold $2.80 to $2.85, the floor of the last range, and another shot at $3.33 is on the table.
Lose it, and $2.60 to $2.70 is the next shelf.
Below that, $1.95 to $2.05 is where the second base broke out.
Rallies are proven on the pullback, not on the way up.
Reload above $2.80, or a deeper reset first? 🔥
Not financial advice.
$ORCA
$RLC
$BR
$1.56 to $3.33.
Two clean bases, two breakouts, one big candle on the heaviest volume of the move.
Now $2.93, the first real pullback of the run, about 12% off the high.
This is the moment that decides what kind of rally it was. 👀
Healthy trends pull back and hold old resistance as support.
Exhausted ones slice straight through it.
A little history helps here too. ORCA has sprinted before this year. February's spike to about $1.62 faded all the way back near $1.10 by August. Momentum alone hasn't been enough to keep it up.
And for perspective, even at $3, ORCA is still roughly 87% below its $22.28 all-time high.
The levels.
Hold $2.80 to $2.85, the floor of the last range, and another shot at $3.33 is on the table.
Lose it, and $2.60 to $2.70 is the next shelf.
Below that, $1.95 to $2.05 is where the second base broke out.
Rallies are proven on the pullback, not on the way up.
Reload above $2.80, or a deeper reset first? 🔥
Not financial advice.
$ORCA
$RLC
$BR
1
786
·
--
Bullish
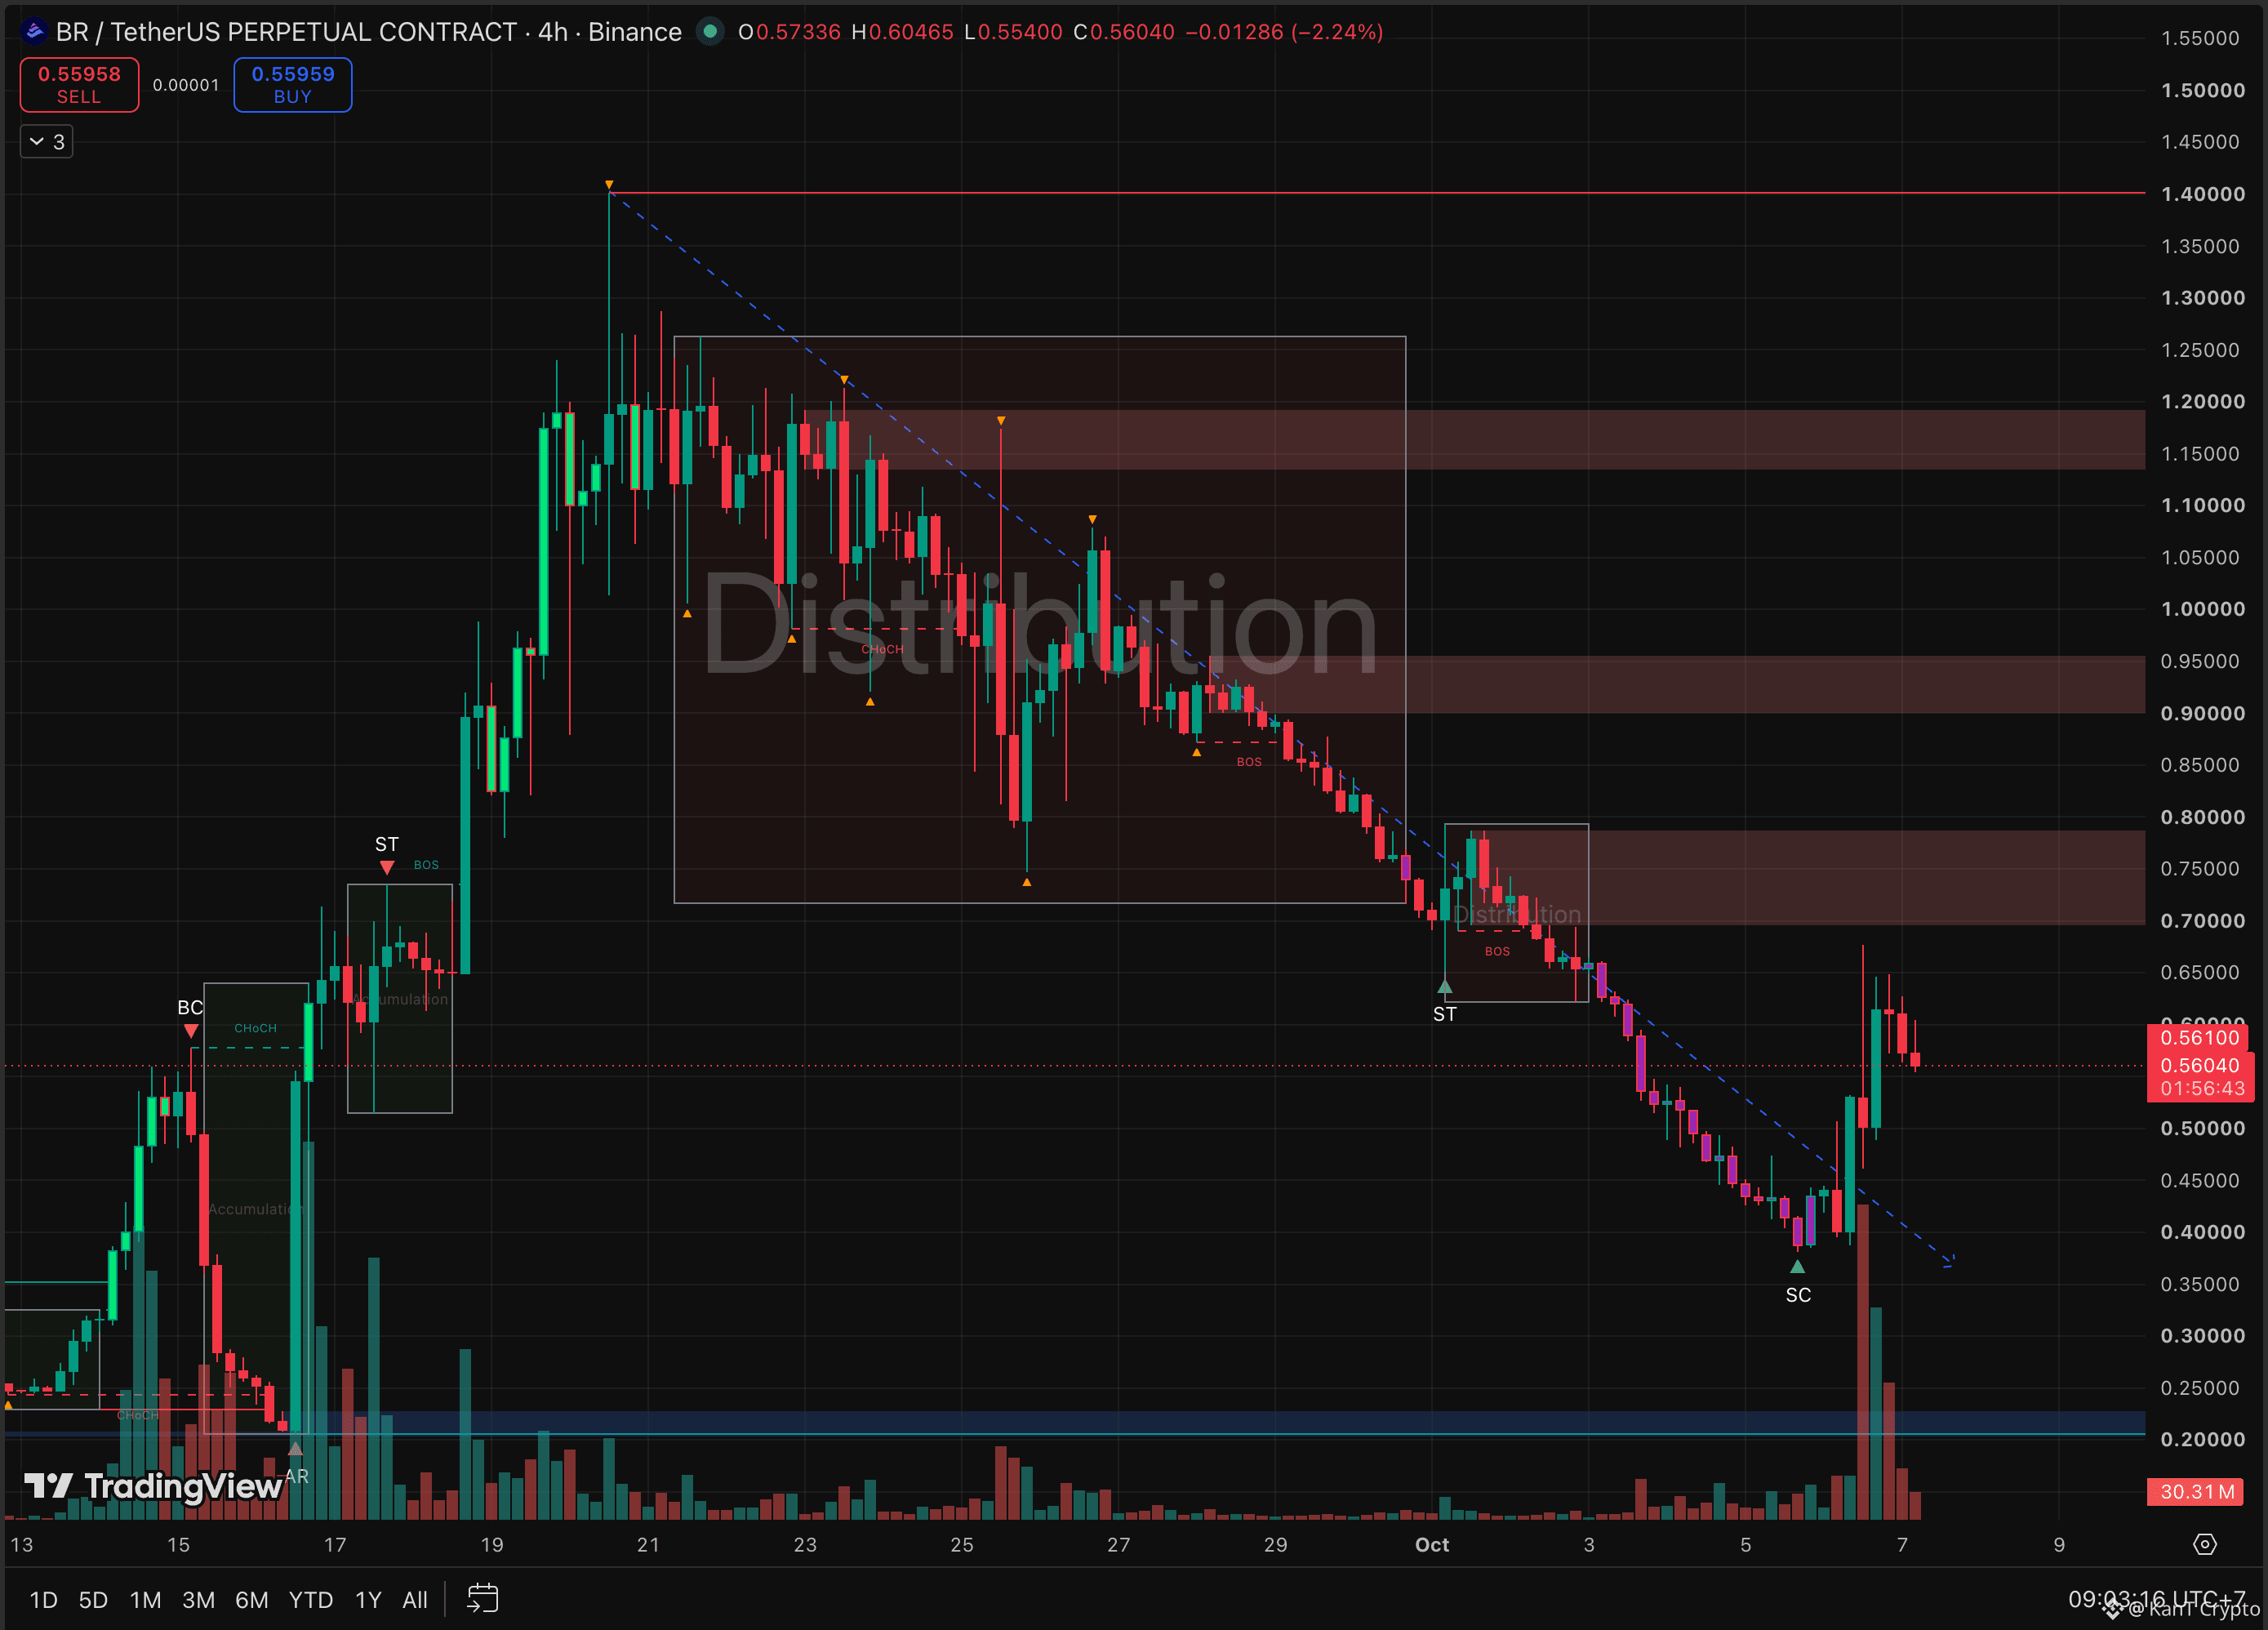
📈 BR Crashed 73%, Then Bounced 78% in a Day. Bottom or Bait?
$1.40 to $0.38.
Then $0.38 to $0.67 in a single day.
Now $0.56.
A month of pain, erased in an afternoon.
But know the script. 👀
Panic dumps end in a selling climax.
The first bounce after it, the automatic rally, almost always overshoots.
The real verdict comes on the retest.
Buyers defend the lows again? Base.
They don't? That wasn't the bottom.
And the fundamentals aren't doing the lifting.
About $75K in protocol revenue for Q3, per DeFiLlama.
Only ~29% of supply circulating.
Pure speculation, and speculation cuts both ways.
The levels.
Hold $0.50, and it can range under the $0.70 to $0.79 supply.
Lose it, and $0.38 to $0.45 gets retested.
Reclaim $0.79, and the bounce becomes a real recovery.
Bounces this big feel like bottoms. Make the retest prove it.
Real bottom, or a bounce to sell into? 🔥
Not financial advice.
$BR
{future}(BRUSDT)
$NMR
{future}(NMRUSDT)
$ORCA
{future}(ORCAUSDT)
📈 BR Crashed 73%, Then Bounced 78% in a Day. Bottom or Bait?
$1.40 to $0.38.
Then $0.38 to $0.67 in a single day.
Now $0.56.
A month of pain, erased in an afternoon.
But know the script. 👀
Panic dumps end in a selling climax.
The first bounce after it, the automatic rally, almost always overshoots.
The real verdict comes on the retest.
Buyers defend the lows again? Base.
They don't? That wasn't the bottom.
And the fundamentals aren't doing the lifting.
About $75K in protocol revenue for Q3, per DeFiLlama.
Only ~29% of supply circulating.
Pure speculation, and speculation cuts both ways.
The levels.
Hold $0.50, and it can range under the $0.70 to $0.79 supply.
Lose it, and $0.38 to $0.45 gets retested.
Reclaim $0.79, and the bounce becomes a real recovery.
Bounces this big feel like bottoms. Make the retest prove it.
Real bottom, or a bounce to sell into? 🔥
Not financial advice.
$BR
$NMR
$ORCA
$1.40 to $0.38.
Then $0.38 to $0.67 in a single day.
Now $0.56.
A month of pain, erased in an afternoon.
But know the script. 👀
Panic dumps end in a selling climax.
The first bounce after it, the automatic rally, almost always overshoots.
The real verdict comes on the retest.
Buyers defend the lows again? Base.
They don't? That wasn't the bottom.
And the fundamentals aren't doing the lifting.
About $75K in protocol revenue for Q3, per DeFiLlama.
Only ~29% of supply circulating.
Pure speculation, and speculation cuts both ways.
The levels.
Hold $0.50, and it can range under the $0.70 to $0.79 supply.
Lose it, and $0.38 to $0.45 gets retested.
Reclaim $0.79, and the bounce becomes a real recovery.
Bounces this big feel like bottoms. Make the retest prove it.
Real bottom, or a bounce to sell into? 🔥
Not financial advice.
$BR
$NMR
$ORCA
1
625
·
--
Bearish
Verified
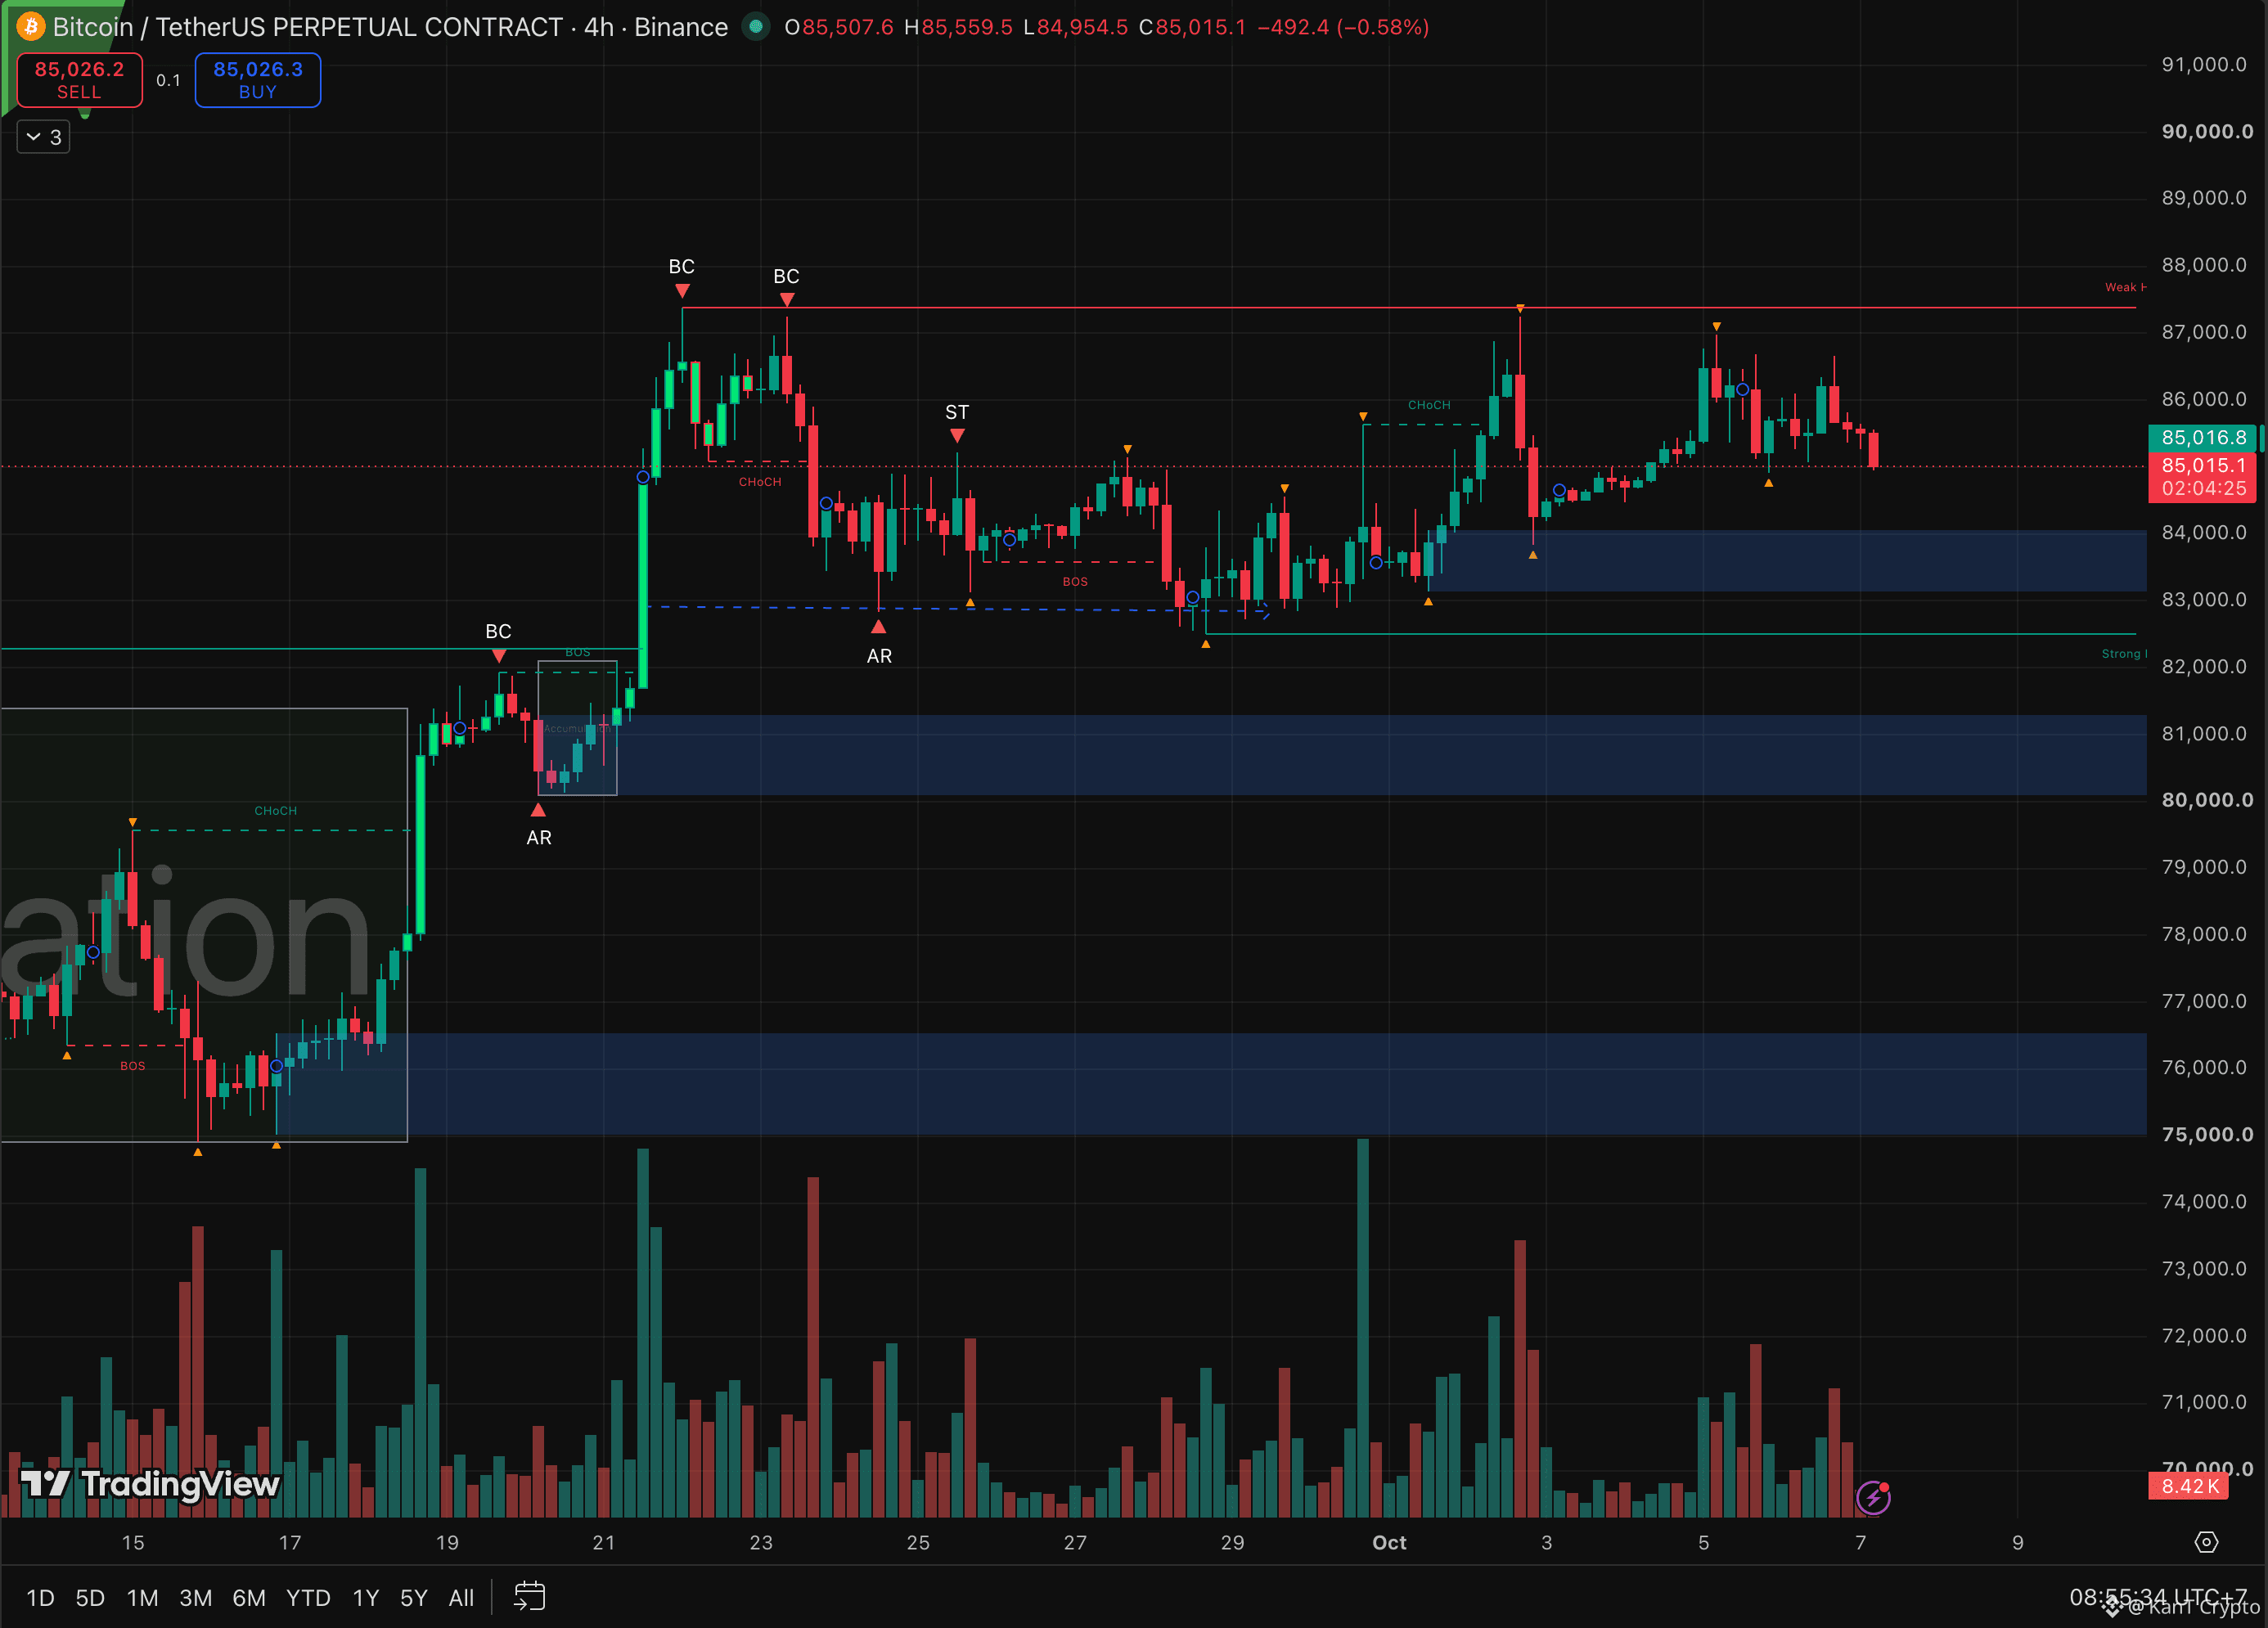
⚠️ Another Miss at $87K. Bitcoin's $83K Cushion Is Coming Into View
Four pushes at the same ceiling, and each one fell shorter than the last.
Late September: $87.4K.
October 2: $87.3K.
October 5: about $87K.
October 6: $86.6K.
Now BTC is back at $85,015 on the 4H, sitting right on the $85K line we flagged yesterday. 👀
Fading highs like that usually mean buyers are running out of steam at the top. But the lows haven't cracked yet: $82.4K, then $83K, $83.9K, and about $84.9K on the latest dip, which price is testing right now. As long as that last higher low holds, the squeeze is still alive.
Lose $84.9K, though, and the pattern flips. Next in line is the $83.1K to $84K demand zone, the cushion that caught the October 2 flush. Below that, $82.5K is the strong low, with the $80K to $81.3K zone after it.
There's a catalyst on the calendar too. Minutes from the September Fed meeting, the one that delivered a rate hike, drop today at 2 p.m. ET. Any hint of more hikes ahead could add pressure. A softer tone could give bulls another shot at the wall.
The levels.
Reclaim $86.6K, and the $87.4K wall comes back into play.
Lose $84.9K, and the $83K to $84K cushion gets tested.
The ceiling keeps getting lower. Respect it until a close says otherwise.
Cushion holds, or does $83K give way? 🔥
Not financial advice.
$BTC
{future}(BTCUSDT)
$ORCA
{future}(ORCAUSDT)
$BR
{future}(BRUSDT)
⚠️ Another Miss at $87K. Bitcoin's $83K Cushion Is Coming Into View
Four pushes at the same ceiling, and each one fell shorter than the last.
Late September: $87.4K.
October 2: $87.3K.
October 5: about $87K.
October 6: $86.6K.
Now BTC is back at $85,015 on the 4H, sitting right on the $85K line we flagged yesterday. 👀
Fading highs like that usually mean buyers are running out of steam at the top. But the lows haven't cracked yet: $82.4K, then $83K, $83.9K, and about $84.9K on the latest dip, which price is testing right now. As long as that last higher low holds, the squeeze is still alive.
Lose $84.9K, though, and the pattern flips. Next in line is the $83.1K to $84K demand zone, the cushion that caught the October 2 flush. Below that, $82.5K is the strong low, with the $80K to $81.3K zone after it.
There's a catalyst on the calendar too. Minutes from the September Fed meeting, the one that delivered a rate hike, drop today at 2 p.m. ET. Any hint of more hikes ahead could add pressure. A softer tone could give bulls another shot at the wall.
The levels.
Reclaim $86.6K, and the $87.4K wall comes back into play.
Lose $84.9K, and the $83K to $84K cushion gets tested.
The ceiling keeps getting lower. Respect it until a close says otherwise.
Cushion holds, or does $83K give way? 🔥
Not financial advice.
$BTC
$ORCA
$BR
Four pushes at the same ceiling, and each one fell shorter than the last.
Late September: $87.4K.
October 2: $87.3K.
October 5: about $87K.
October 6: $86.6K.
Now BTC is back at $85,015 on the 4H, sitting right on the $85K line we flagged yesterday. 👀
Fading highs like that usually mean buyers are running out of steam at the top. But the lows haven't cracked yet: $82.4K, then $83K, $83.9K, and about $84.9K on the latest dip, which price is testing right now. As long as that last higher low holds, the squeeze is still alive.
Lose $84.9K, though, and the pattern flips. Next in line is the $83.1K to $84K demand zone, the cushion that caught the October 2 flush. Below that, $82.5K is the strong low, with the $80K to $81.3K zone after it.
There's a catalyst on the calendar too. Minutes from the September Fed meeting, the one that delivered a rate hike, drop today at 2 p.m. ET. Any hint of more hikes ahead could add pressure. A softer tone could give bulls another shot at the wall.
The levels.
Reclaim $86.6K, and the $87.4K wall comes back into play.
Lose $84.9K, and the $83K to $84K cushion gets tested.
The ceiling keeps getting lower. Respect it until a close says otherwise.
Cushion holds, or does $83K give way? 🔥
Not financial advice.
$BTC
$ORCA
$BR
2
2.7k
·
--
Bullish
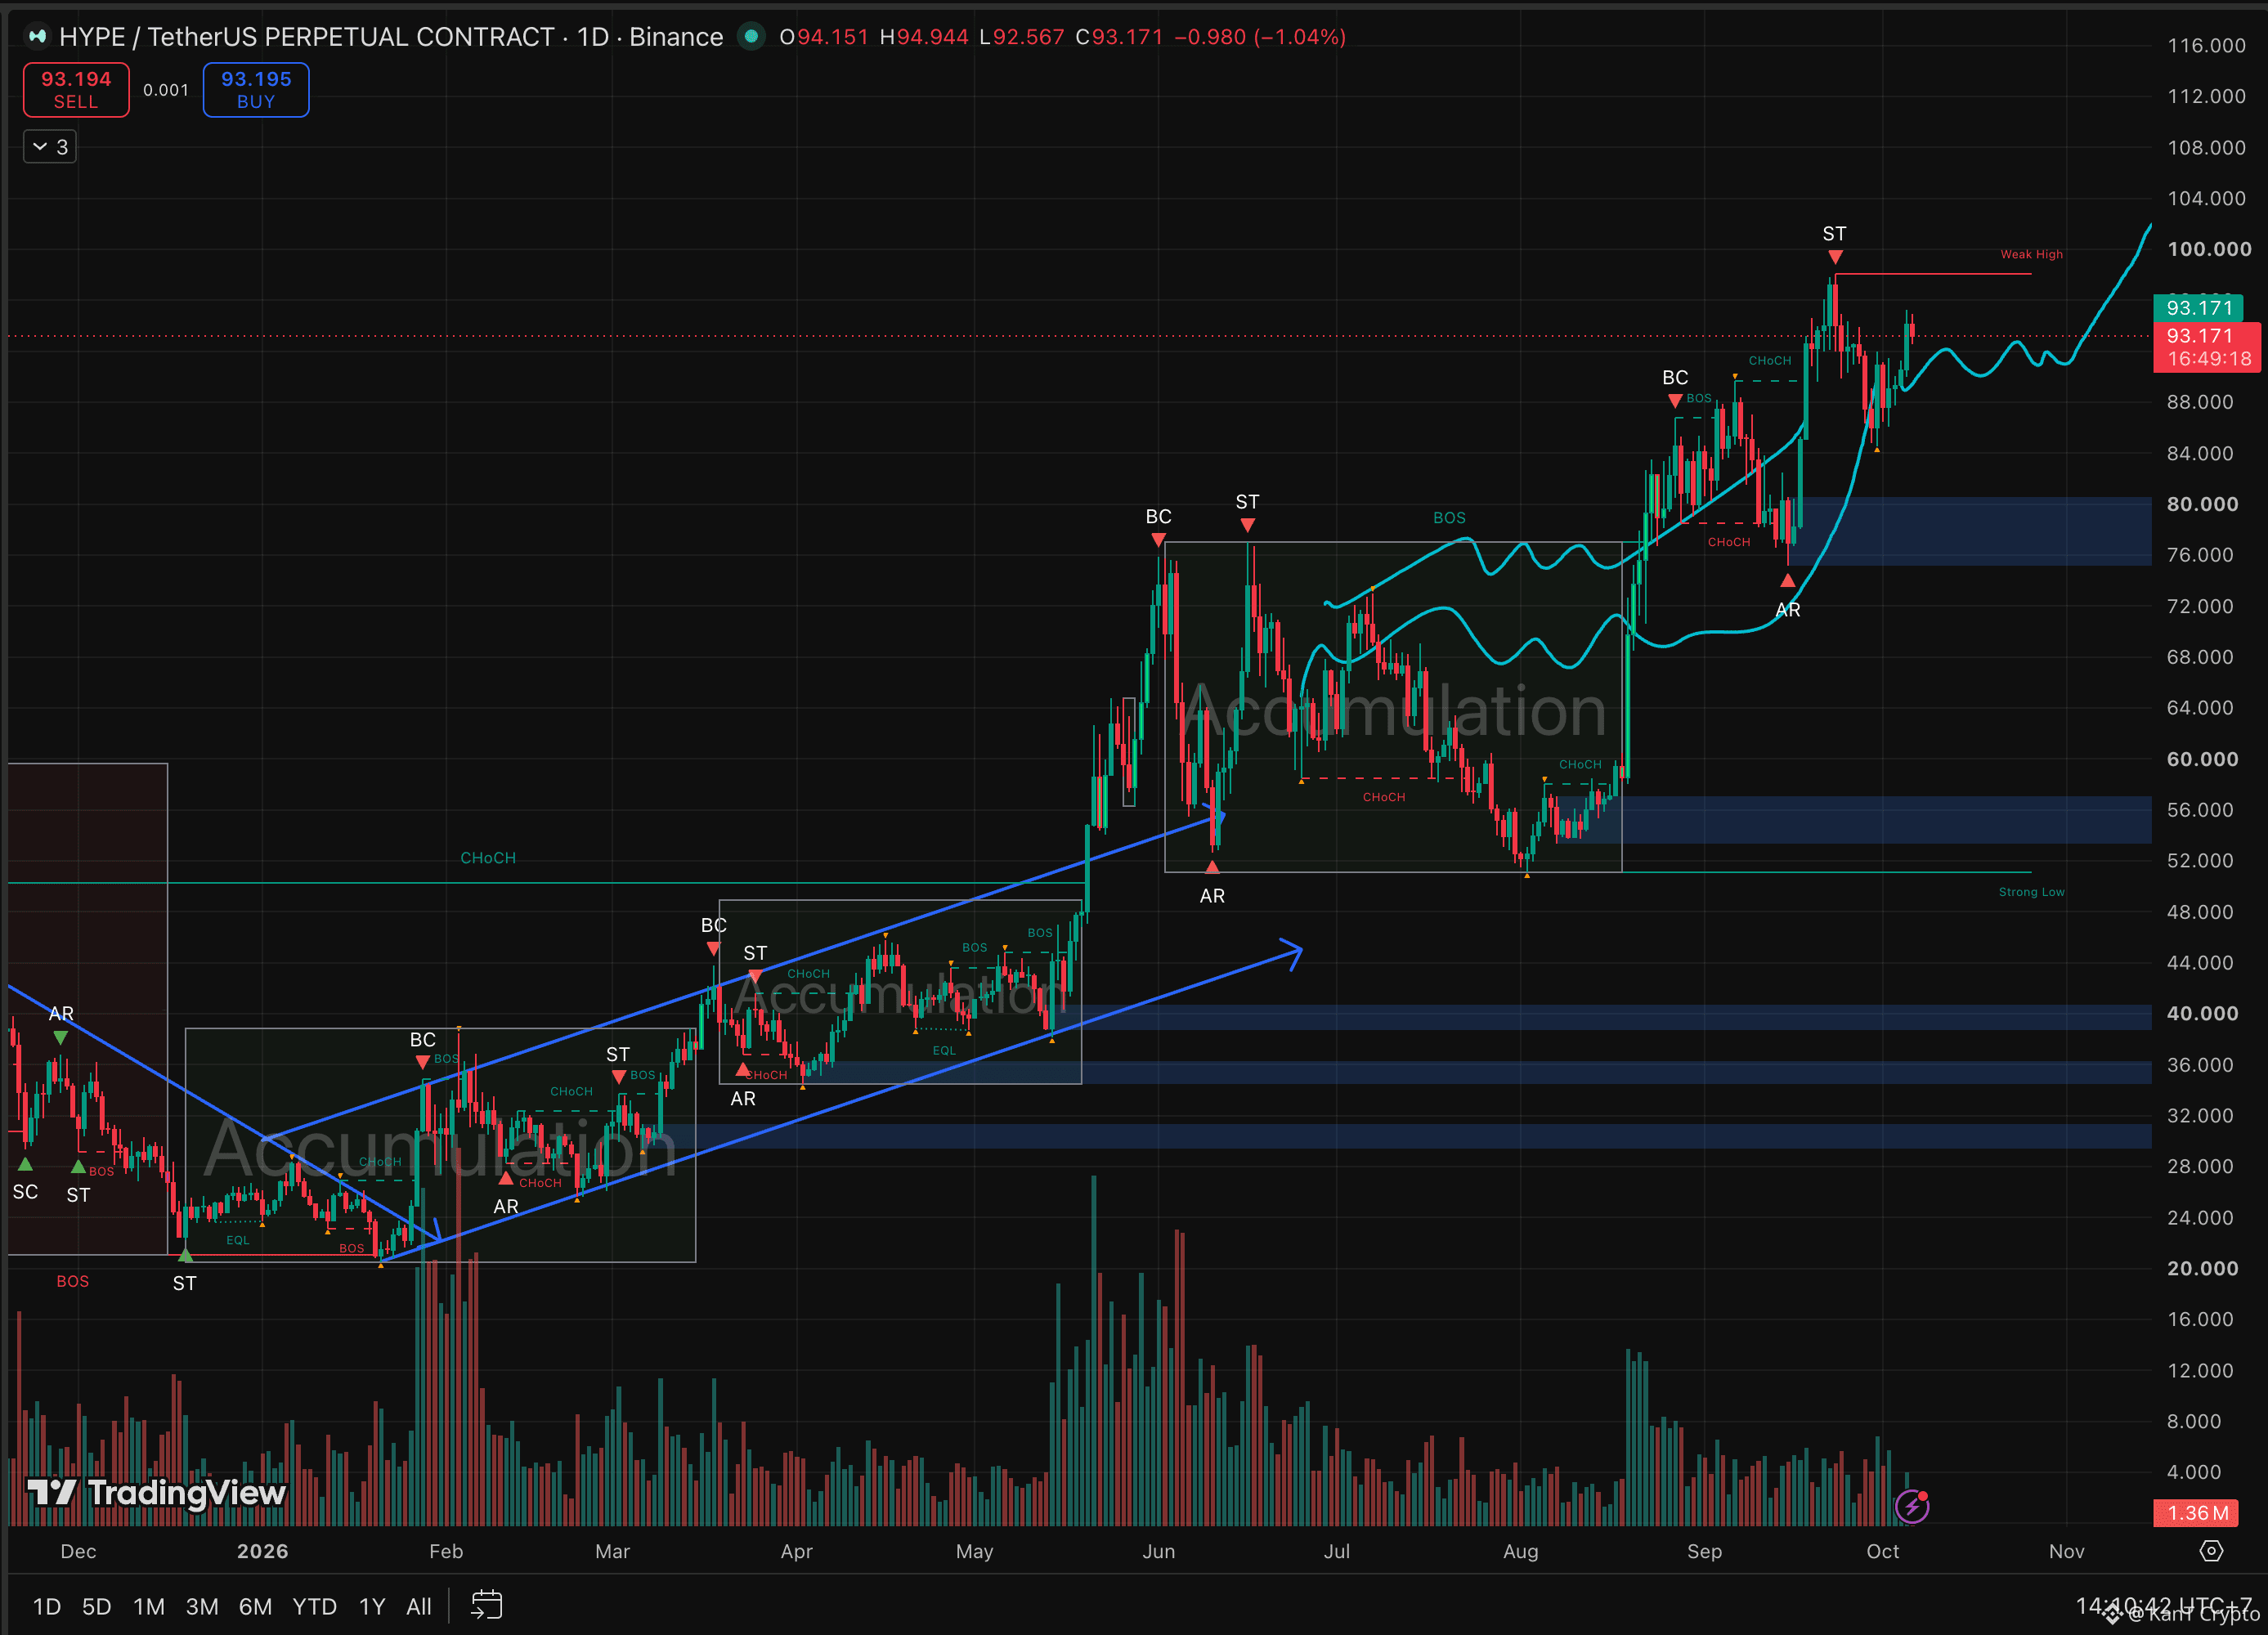
📈 HYPE's Long-Term Trend Is Still Doing Exactly What It Said
Zoom out to the daily and the pattern is almost boring in its consistency.
Base, breakout, higher base. Four times in under a year.
December to March: a base between $20 and $38.
March to May: a base between $35 and $48.
June to August: a base between $51 and $77.
September to now: a range between $75 and $98.
Every floor sits above the last one: about $20 in January, $35 in April, $51 in August, $75 in September. That's a textbook staircase uptrend, and it hasn't broken once. 👀
From the January low to the late-September peak near $98, HYPE has run close to 5x.
Now it's at $93, pausing under that peak. The September push printed a secondary test near $98, a retest of the highs, then pulled back to about $84. That's a normal reset inside the latest range, not a trend break.
The long-term read stays the same: as long as the staircase keeps printing higher lows, each range is fuel for the next leg.
The levels.
A daily close above $98, then $100, opens the next step.
Lose $84, and the $75.5 to $80.5 demand zone, where September's pullback was bought, becomes the test that matters. The trend only truly breaks below that.
Trends like this reward patience more than prediction. Stick with the structure until the structure says otherwise.
$100 next, or one more range before the next leg? 🔥
Not financial advice. $HYPE
{future}(HYPEUSDT)
$RLC
{future}(RLCUSDT)
$NEAR
{future}(NEARUSDT)
📈 HYPE's Long-Term Trend Is Still Doing Exactly What It Said
Zoom out to the daily and the pattern is almost boring in its consistency.
Base, breakout, higher base. Four times in under a year.
December to March: a base between $20 and $38.
March to May: a base between $35 and $48.
June to August: a base between $51 and $77.
September to now: a range between $75 and $98.
Every floor sits above the last one: about $20 in January, $35 in April, $51 in August, $75 in September. That's a textbook staircase uptrend, and it hasn't broken once. 👀
From the January low to the late-September peak near $98, HYPE has run close to 5x.
Now it's at $93, pausing under that peak. The September push printed a secondary test near $98, a retest of the highs, then pulled back to about $84. That's a normal reset inside the latest range, not a trend break.
The long-term read stays the same: as long as the staircase keeps printing higher lows, each range is fuel for the next leg.
The levels.
A daily close above $98, then $100, opens the next step.
Lose $84, and the $75.5 to $80.5 demand zone, where September's pullback was bought, becomes the test that matters. The trend only truly breaks below that.
Trends like this reward patience more than prediction. Stick with the structure until the structure says otherwise.
$100 next, or one more range before the next leg? 🔥
Not financial advice. $HYPE
$RLC
$NEAR
Zoom out to the daily and the pattern is almost boring in its consistency.
Base, breakout, higher base. Four times in under a year.
December to March: a base between $20 and $38.
March to May: a base between $35 and $48.
June to August: a base between $51 and $77.
September to now: a range between $75 and $98.
Every floor sits above the last one: about $20 in January, $35 in April, $51 in August, $75 in September. That's a textbook staircase uptrend, and it hasn't broken once. 👀
From the January low to the late-September peak near $98, HYPE has run close to 5x.
Now it's at $93, pausing under that peak. The September push printed a secondary test near $98, a retest of the highs, then pulled back to about $84. That's a normal reset inside the latest range, not a trend break.
The long-term read stays the same: as long as the staircase keeps printing higher lows, each range is fuel for the next leg.
The levels.
A daily close above $98, then $100, opens the next step.
Lose $84, and the $75.5 to $80.5 demand zone, where September's pullback was bought, becomes the test that matters. The trend only truly breaks below that.
Trends like this reward patience more than prediction. Stick with the structure until the structure says otherwise.
$100 next, or one more range before the next leg? 🔥
Not financial advice. $HYPE
$RLC
$NEAR
1
633
·
--
Bullish
🚀 RLC's Rocket Just Fired Its Second Stage
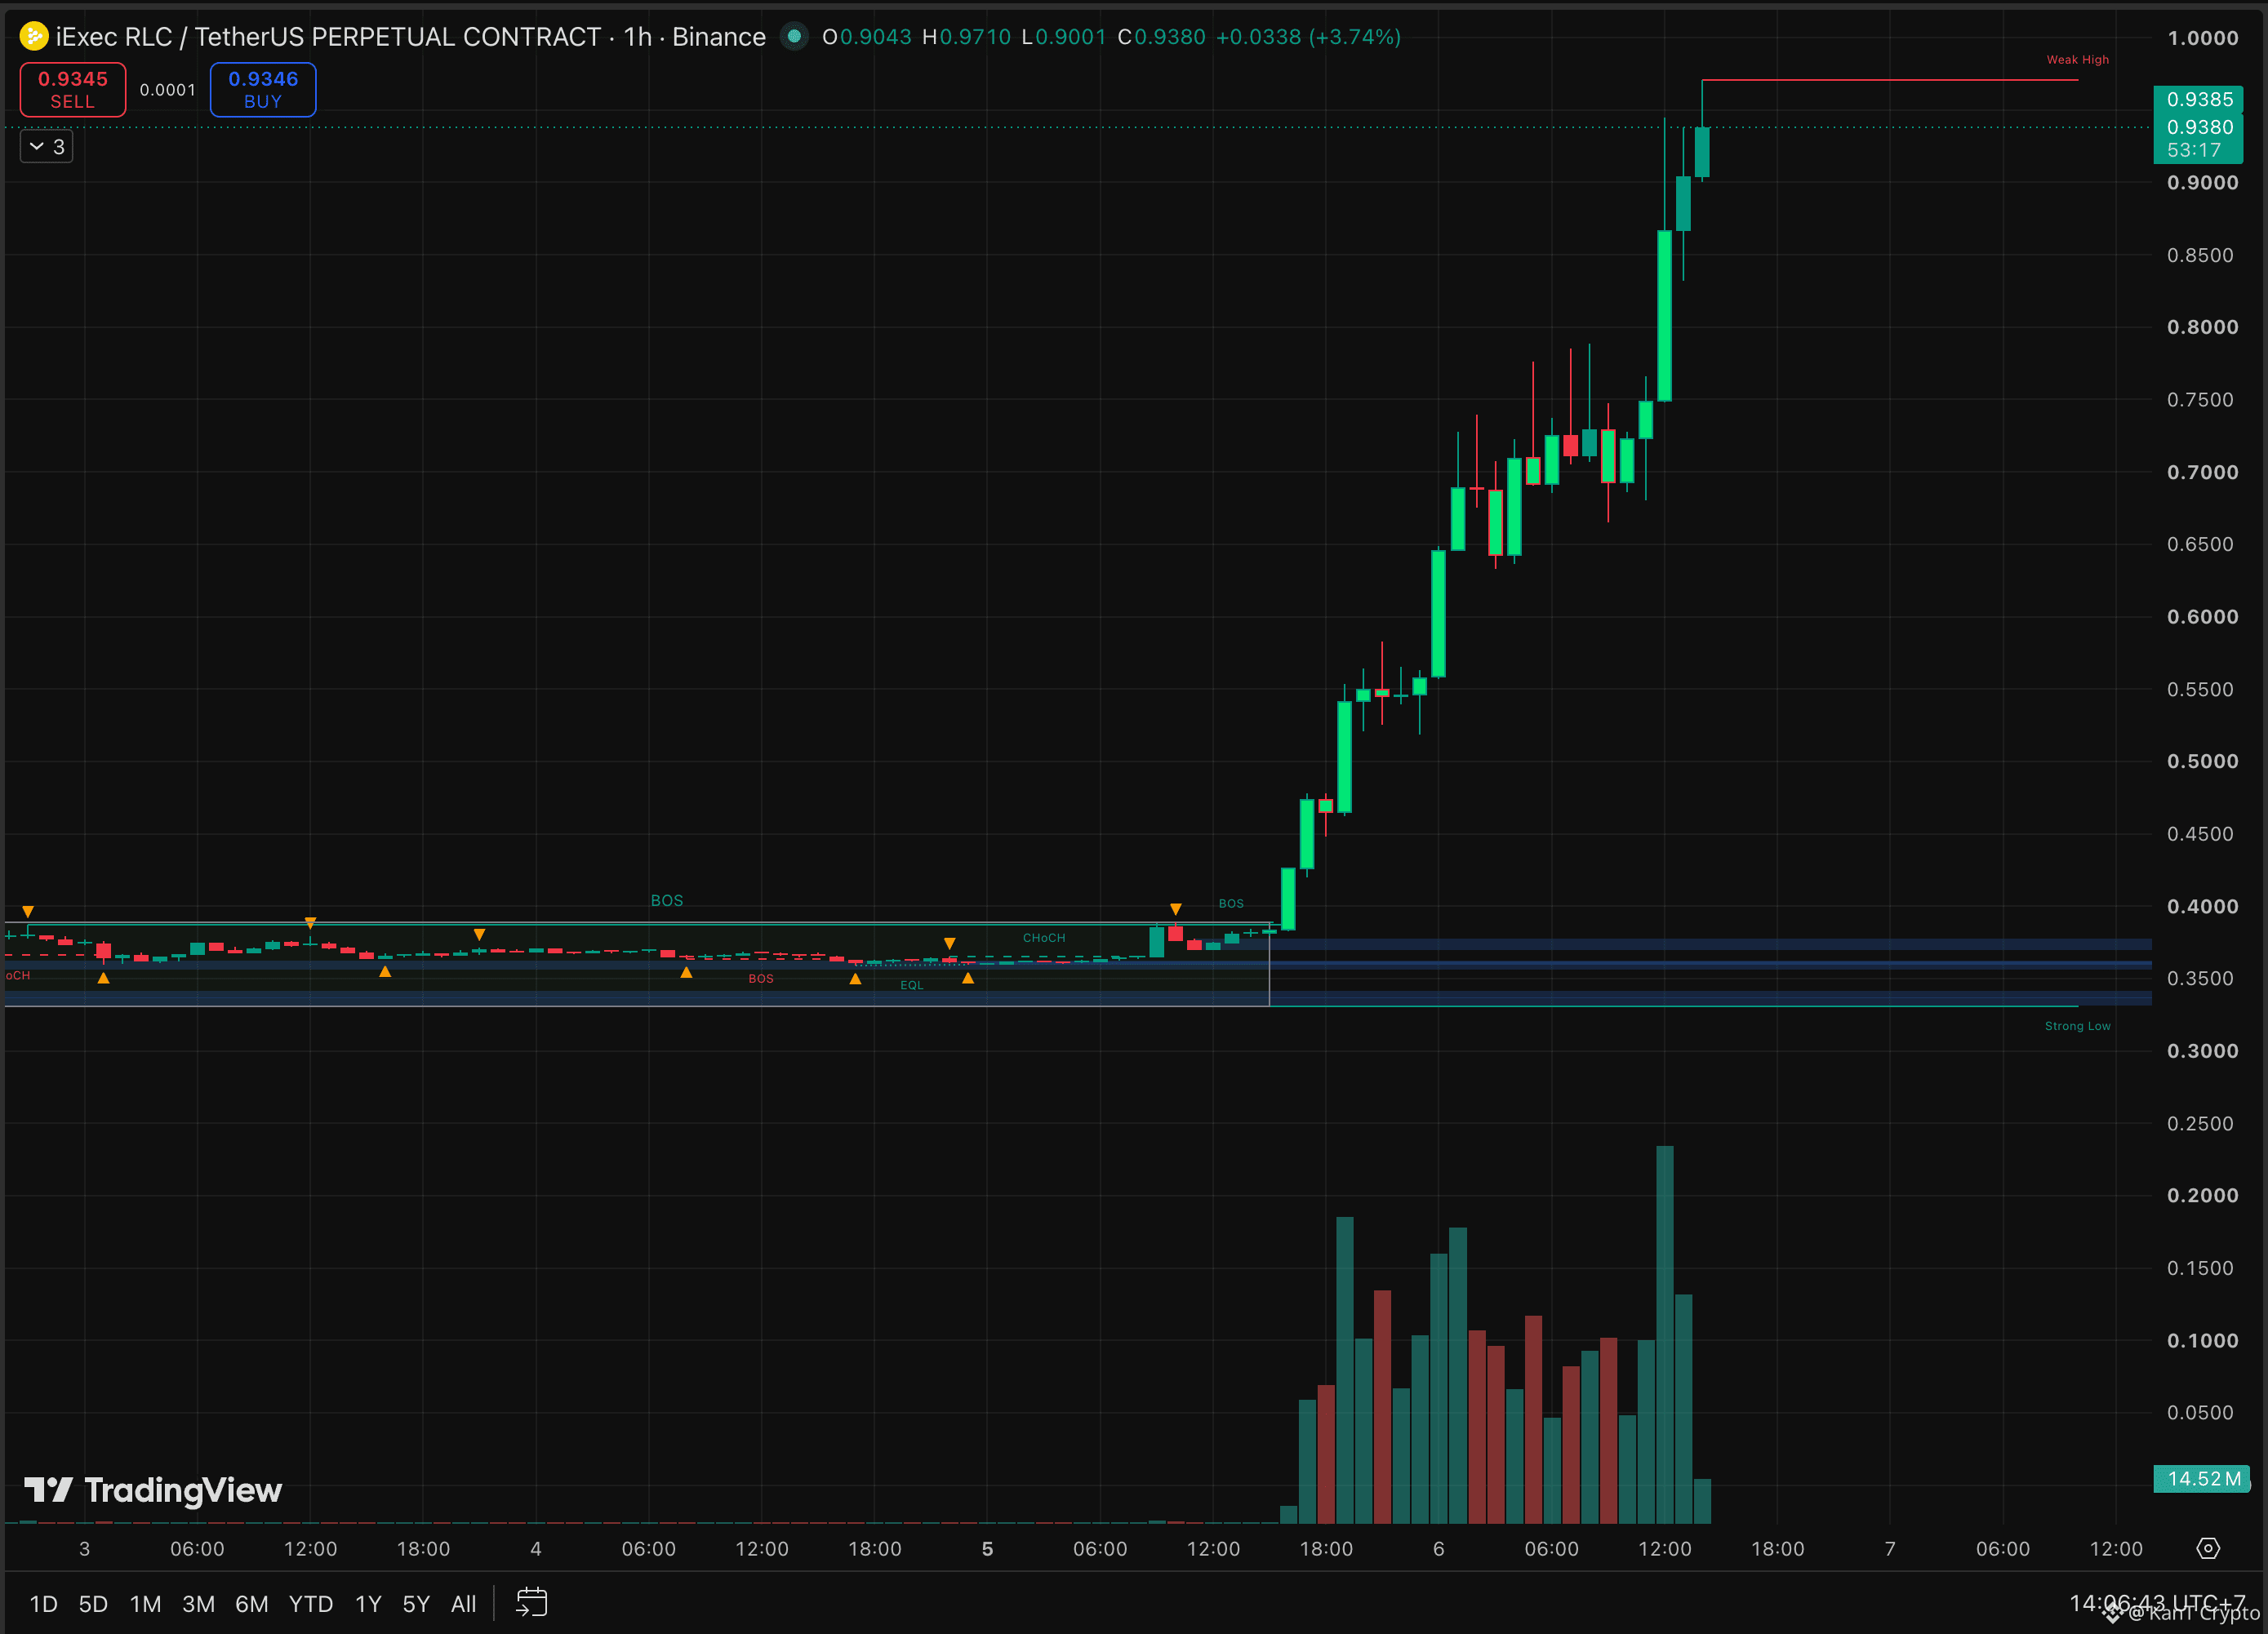
This morning it was stuck in a range. This afternoon it's knocking on $1.
For the record, the plan said a break above $0.79 would give the run its next leg. It broke on the heaviest hourly volume of the entire move and ran straight to $0.971. 👀
The scoreboard:
From the $0.39 breakout to $0.971, about 2.5x in under a day.
Up roughly 36% from this morning's chop alone.
Now $0.938, with $1.00 sitting just above.
The structure is still clean. The $0.665 to $0.79 range was a pause, not a top. Buyers absorbed the wicks, then broke out with size.
But a few things deserve respect up here.
$1.00 is a giant psychological magnet, and round numbers tend to stall rallies on first touch.
The move is nearly vertical again, with no news catalyst behind it.
And every leg from here trades against holders sitting on 2x gains.
The levels.
Hold $0.90, and the next push at $0.971, then $1.00, stays on.
Lose it, and $0.79, the old range top, should be the first real support.
Below that, $0.665 is the bottom of the range this stage launched from.
Riding a winner is fine. Chasing it at a round number with leverage is how winners turn into lessons.
Clean break through $1, or a pause below it first? 🔥
Not financial advice.
$RLC
{future}(RLCUSDT)
$HYPE
{future}(HYPEUSDT)
$NEAR
{future}(NEARUSDT)
🚀 RLC's Rocket Just Fired Its Second Stage
This morning it was stuck in a range. This afternoon it's knocking on $1.
For the record, the plan said a break above $0.79 would give the run its next leg. It broke on the heaviest hourly volume of the entire move and ran straight to $0.971. 👀
The scoreboard:
From the $0.39 breakout to $0.971, about 2.5x in under a day.
Up roughly 36% from this morning's chop alone.
Now $0.938, with $1.00 sitting just above.
The structure is still clean. The $0.665 to $0.79 range was a pause, not a top. Buyers absorbed the wicks, then broke out with size.
But a few things deserve respect up here.
$1.00 is a giant psychological magnet, and round numbers tend to stall rallies on first touch.
The move is nearly vertical again, with no news catalyst behind it.
And every leg from here trades against holders sitting on 2x gains.
The levels.
Hold $0.90, and the next push at $0.971, then $1.00, stays on.
Lose it, and $0.79, the old range top, should be the first real support.
Below that, $0.665 is the bottom of the range this stage launched from.
Riding a winner is fine. Chasing it at a round number with leverage is how winners turn into lessons.
Clean break through $1, or a pause below it first? 🔥
Not financial advice.
$RLC
$HYPE
$NEAR
This morning it was stuck in a range. This afternoon it's knocking on $1.
For the record, the plan said a break above $0.79 would give the run its next leg. It broke on the heaviest hourly volume of the entire move and ran straight to $0.971. 👀
The scoreboard:
From the $0.39 breakout to $0.971, about 2.5x in under a day.
Up roughly 36% from this morning's chop alone.
Now $0.938, with $1.00 sitting just above.
The structure is still clean. The $0.665 to $0.79 range was a pause, not a top. Buyers absorbed the wicks, then broke out with size.
But a few things deserve respect up here.
$1.00 is a giant psychological magnet, and round numbers tend to stall rallies on first touch.
The move is nearly vertical again, with no news catalyst behind it.
And every leg from here trades against holders sitting on 2x gains.
The levels.
Hold $0.90, and the next push at $0.971, then $1.00, stays on.
Lose it, and $0.79, the old range top, should be the first real support.
Below that, $0.665 is the bottom of the range this stage launched from.
Riding a winner is fine. Chasing it at a round number with leverage is how winners turn into lessons.
Clean break through $1, or a pause below it first? 🔥
Not financial advice.
$RLC
$HYPE
$NEAR
1
694
·
--
Bullish
🚀 RLC Doubled in Under a Day. Now It's Testing the Top
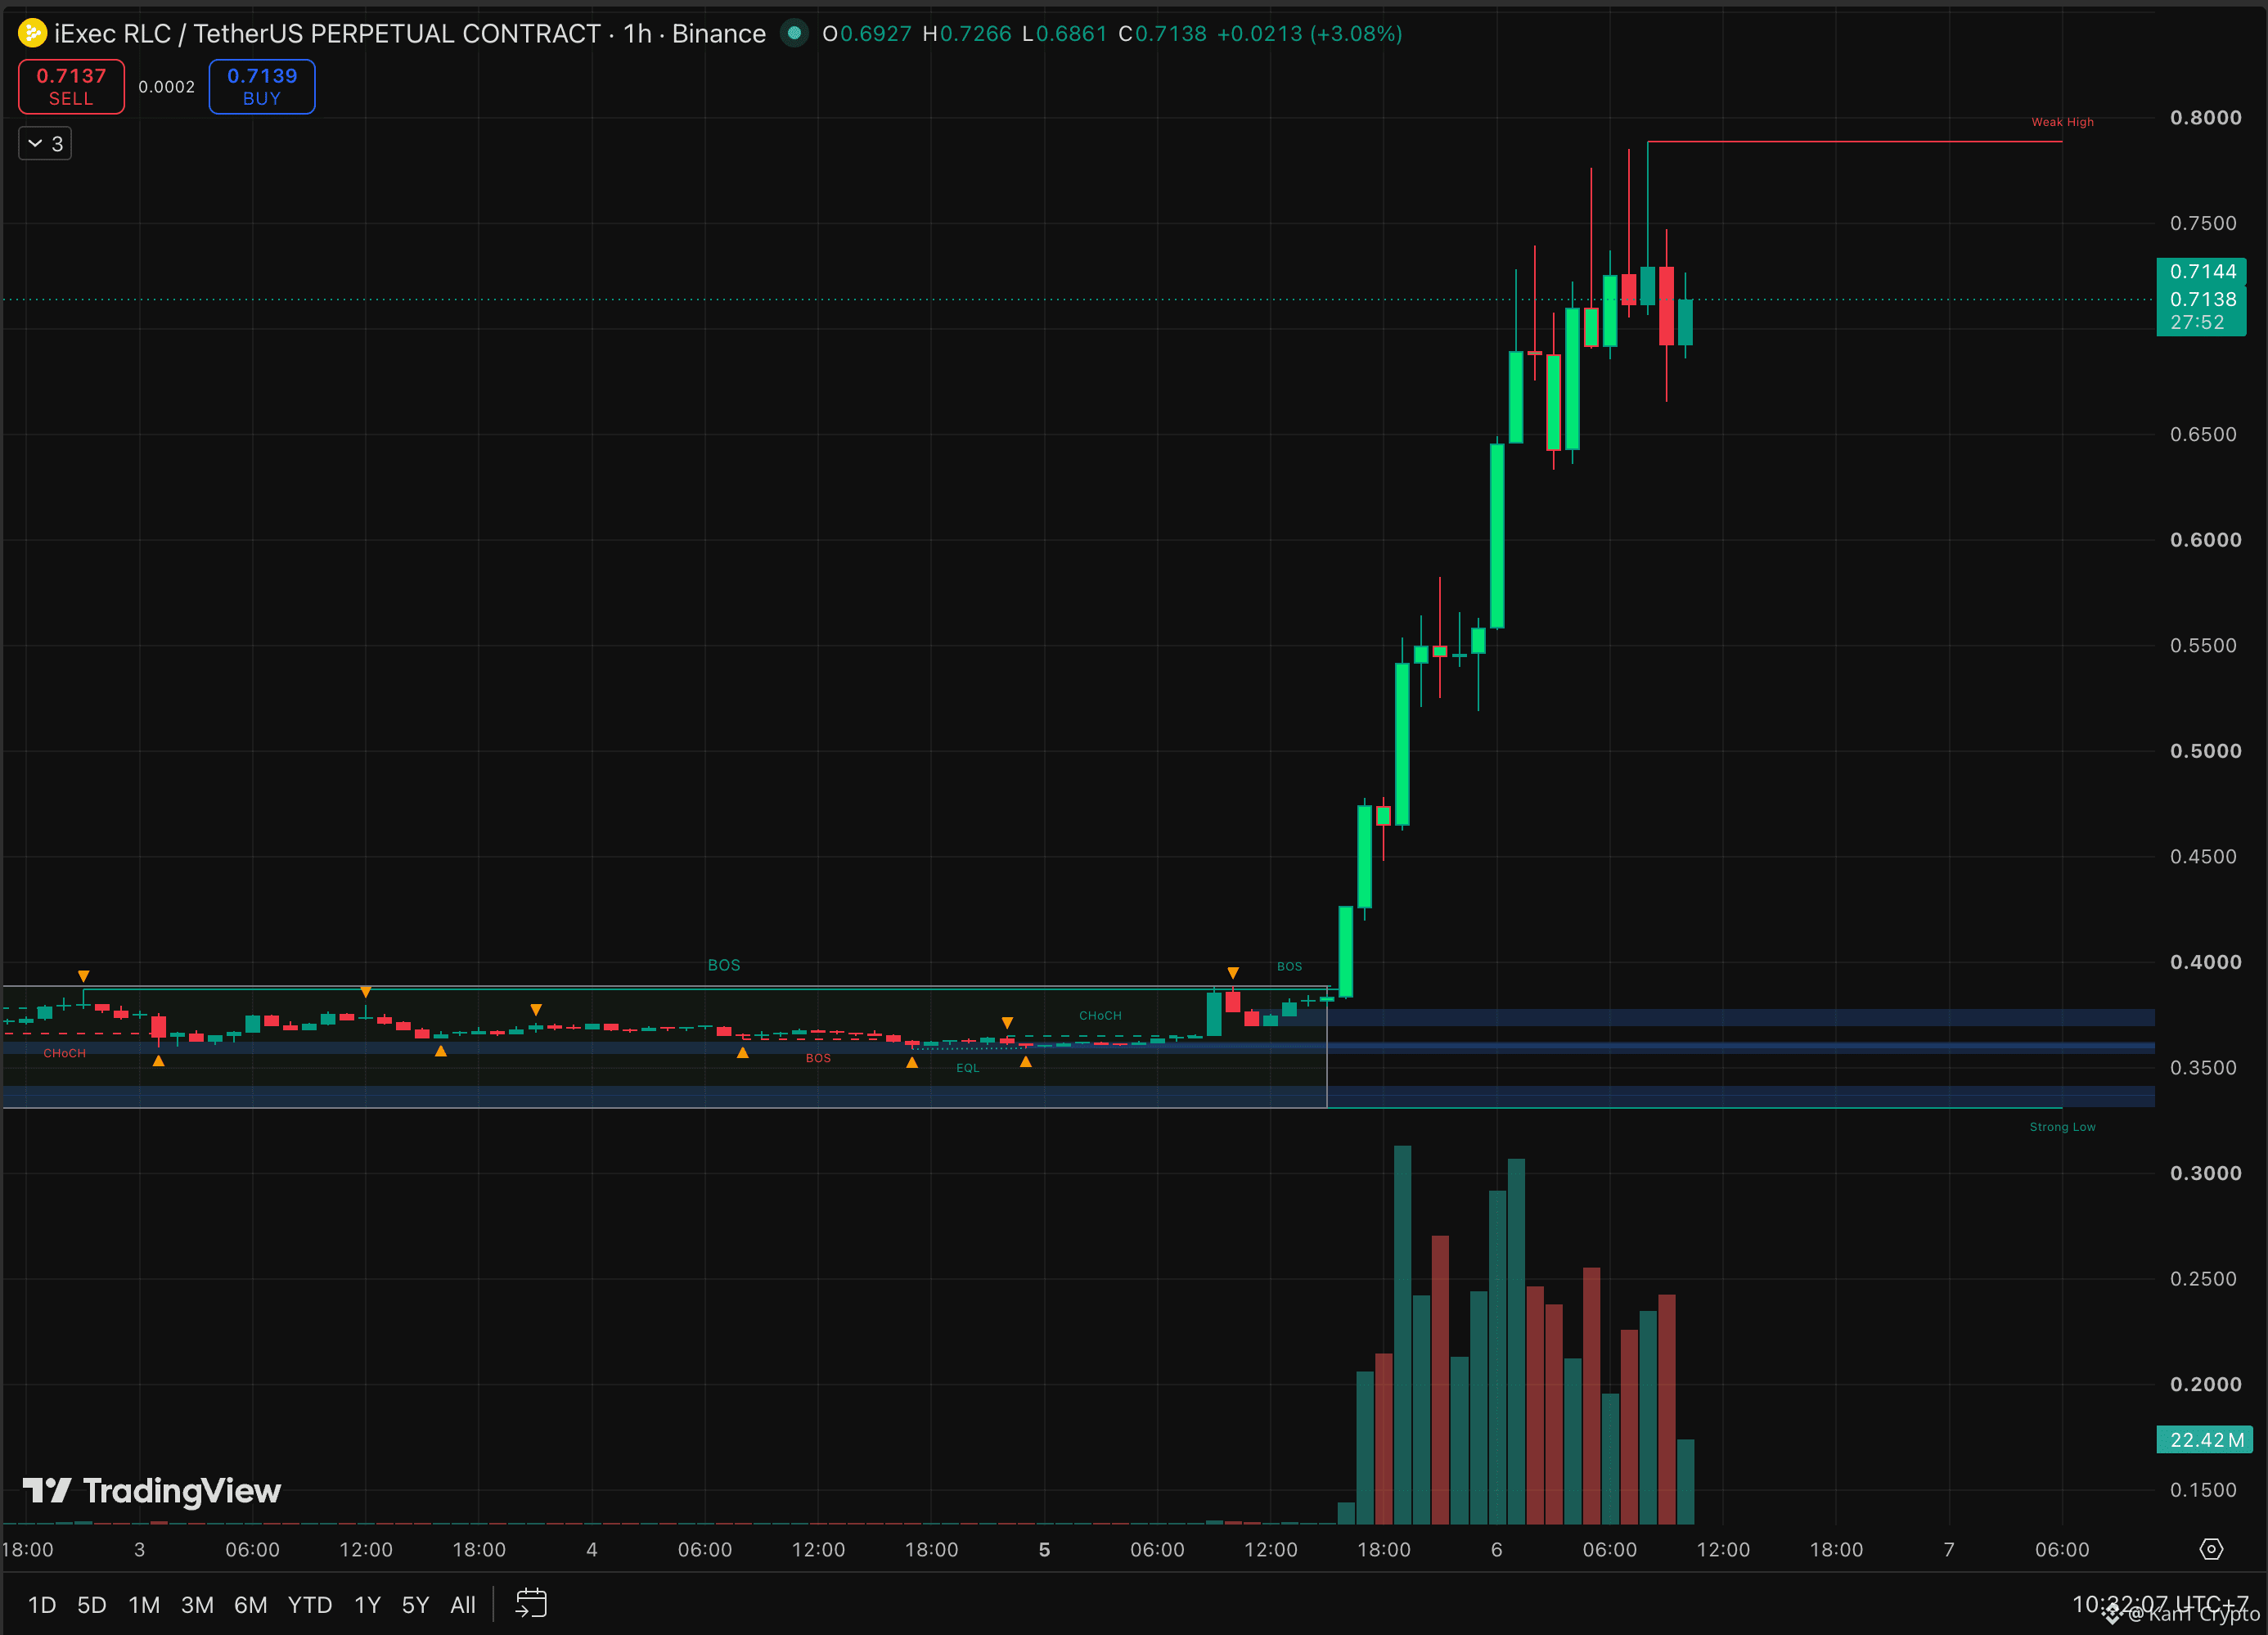
Three days flat. Then one straight line up.
The base: $0.34 to $0.39 from October 2 to 5, with equal lows, a change of character, and a clean break of structure on the way out.
The run: $0.39 to a high near $0.79 in about 16 hours. Roughly 2x, almost without a pause.
Now: $0.714, chopping between $0.665 and $0.79.
That last part matters. 👀
The top of this move is full of long wicks. Buyers pushed to $0.776, then $0.788, and both times got sold back down. A dip to $0.665 got bought just as fast. That's a market arguing with itself after a vertical run, and volume is fading while it argues.
One detail works in RLC's favor: 100% of its supply is already circulating, so there's no token unlock waiting to land on the rally. No clear news catalyst has surfaced either, though, so this move is running on flows.
The levels.
Break and hold above $0.79, and the run gets its next leg.
Lose $0.665, and the $0.55 shelf, the main pause on the way up, comes into play.
Below that, the $0.37 to $0.39 breakout zone is where the whole move started.
Vertical moves often build a range at the top before deciding. Let the range break first.
Next leg above $0.79, or a slide back to $0.55? 🔥
Not financial advice.
$RLC
{future}(RLCUSDT)
$MOVR
{future}(MOVRUSDT)
$FIL
{future}(FILUSDT)
🚀 RLC Doubled in Under a Day. Now It's Testing the Top
Three days flat. Then one straight line up.
The base: $0.34 to $0.39 from October 2 to 5, with equal lows, a change of character, and a clean break of structure on the way out.
The run: $0.39 to a high near $0.79 in about 16 hours. Roughly 2x, almost without a pause.
Now: $0.714, chopping between $0.665 and $0.79.
That last part matters. 👀
The top of this move is full of long wicks. Buyers pushed to $0.776, then $0.788, and both times got sold back down. A dip to $0.665 got bought just as fast. That's a market arguing with itself after a vertical run, and volume is fading while it argues.
One detail works in RLC's favor: 100% of its supply is already circulating, so there's no token unlock waiting to land on the rally. No clear news catalyst has surfaced either, though, so this move is running on flows.
The levels.
Break and hold above $0.79, and the run gets its next leg.
Lose $0.665, and the $0.55 shelf, the main pause on the way up, comes into play.
Below that, the $0.37 to $0.39 breakout zone is where the whole move started.
Vertical moves often build a range at the top before deciding. Let the range break first.
Next leg above $0.79, or a slide back to $0.55? 🔥
Not financial advice.
$RLC
$MOVR
$FIL
Three days flat. Then one straight line up.
The base: $0.34 to $0.39 from October 2 to 5, with equal lows, a change of character, and a clean break of structure on the way out.
The run: $0.39 to a high near $0.79 in about 16 hours. Roughly 2x, almost without a pause.
Now: $0.714, chopping between $0.665 and $0.79.
That last part matters. 👀
The top of this move is full of long wicks. Buyers pushed to $0.776, then $0.788, and both times got sold back down. A dip to $0.665 got bought just as fast. That's a market arguing with itself after a vertical run, and volume is fading while it argues.
One detail works in RLC's favor: 100% of its supply is already circulating, so there's no token unlock waiting to land on the rally. No clear news catalyst has surfaced either, though, so this move is running on flows.
The levels.
Break and hold above $0.79, and the run gets its next leg.
Lose $0.665, and the $0.55 shelf, the main pause on the way up, comes into play.
Below that, the $0.37 to $0.39 breakout zone is where the whole move started.
Vertical moves often build a range at the top before deciding. Let the range break first.
Next leg above $0.79, or a slide back to $0.55? 🔥
Not financial advice.
$RLC
$MOVR
$FIL
3
1.3k
·
--
Bullish
🚀 GTC Just Doubled Off Its Accumulation Base
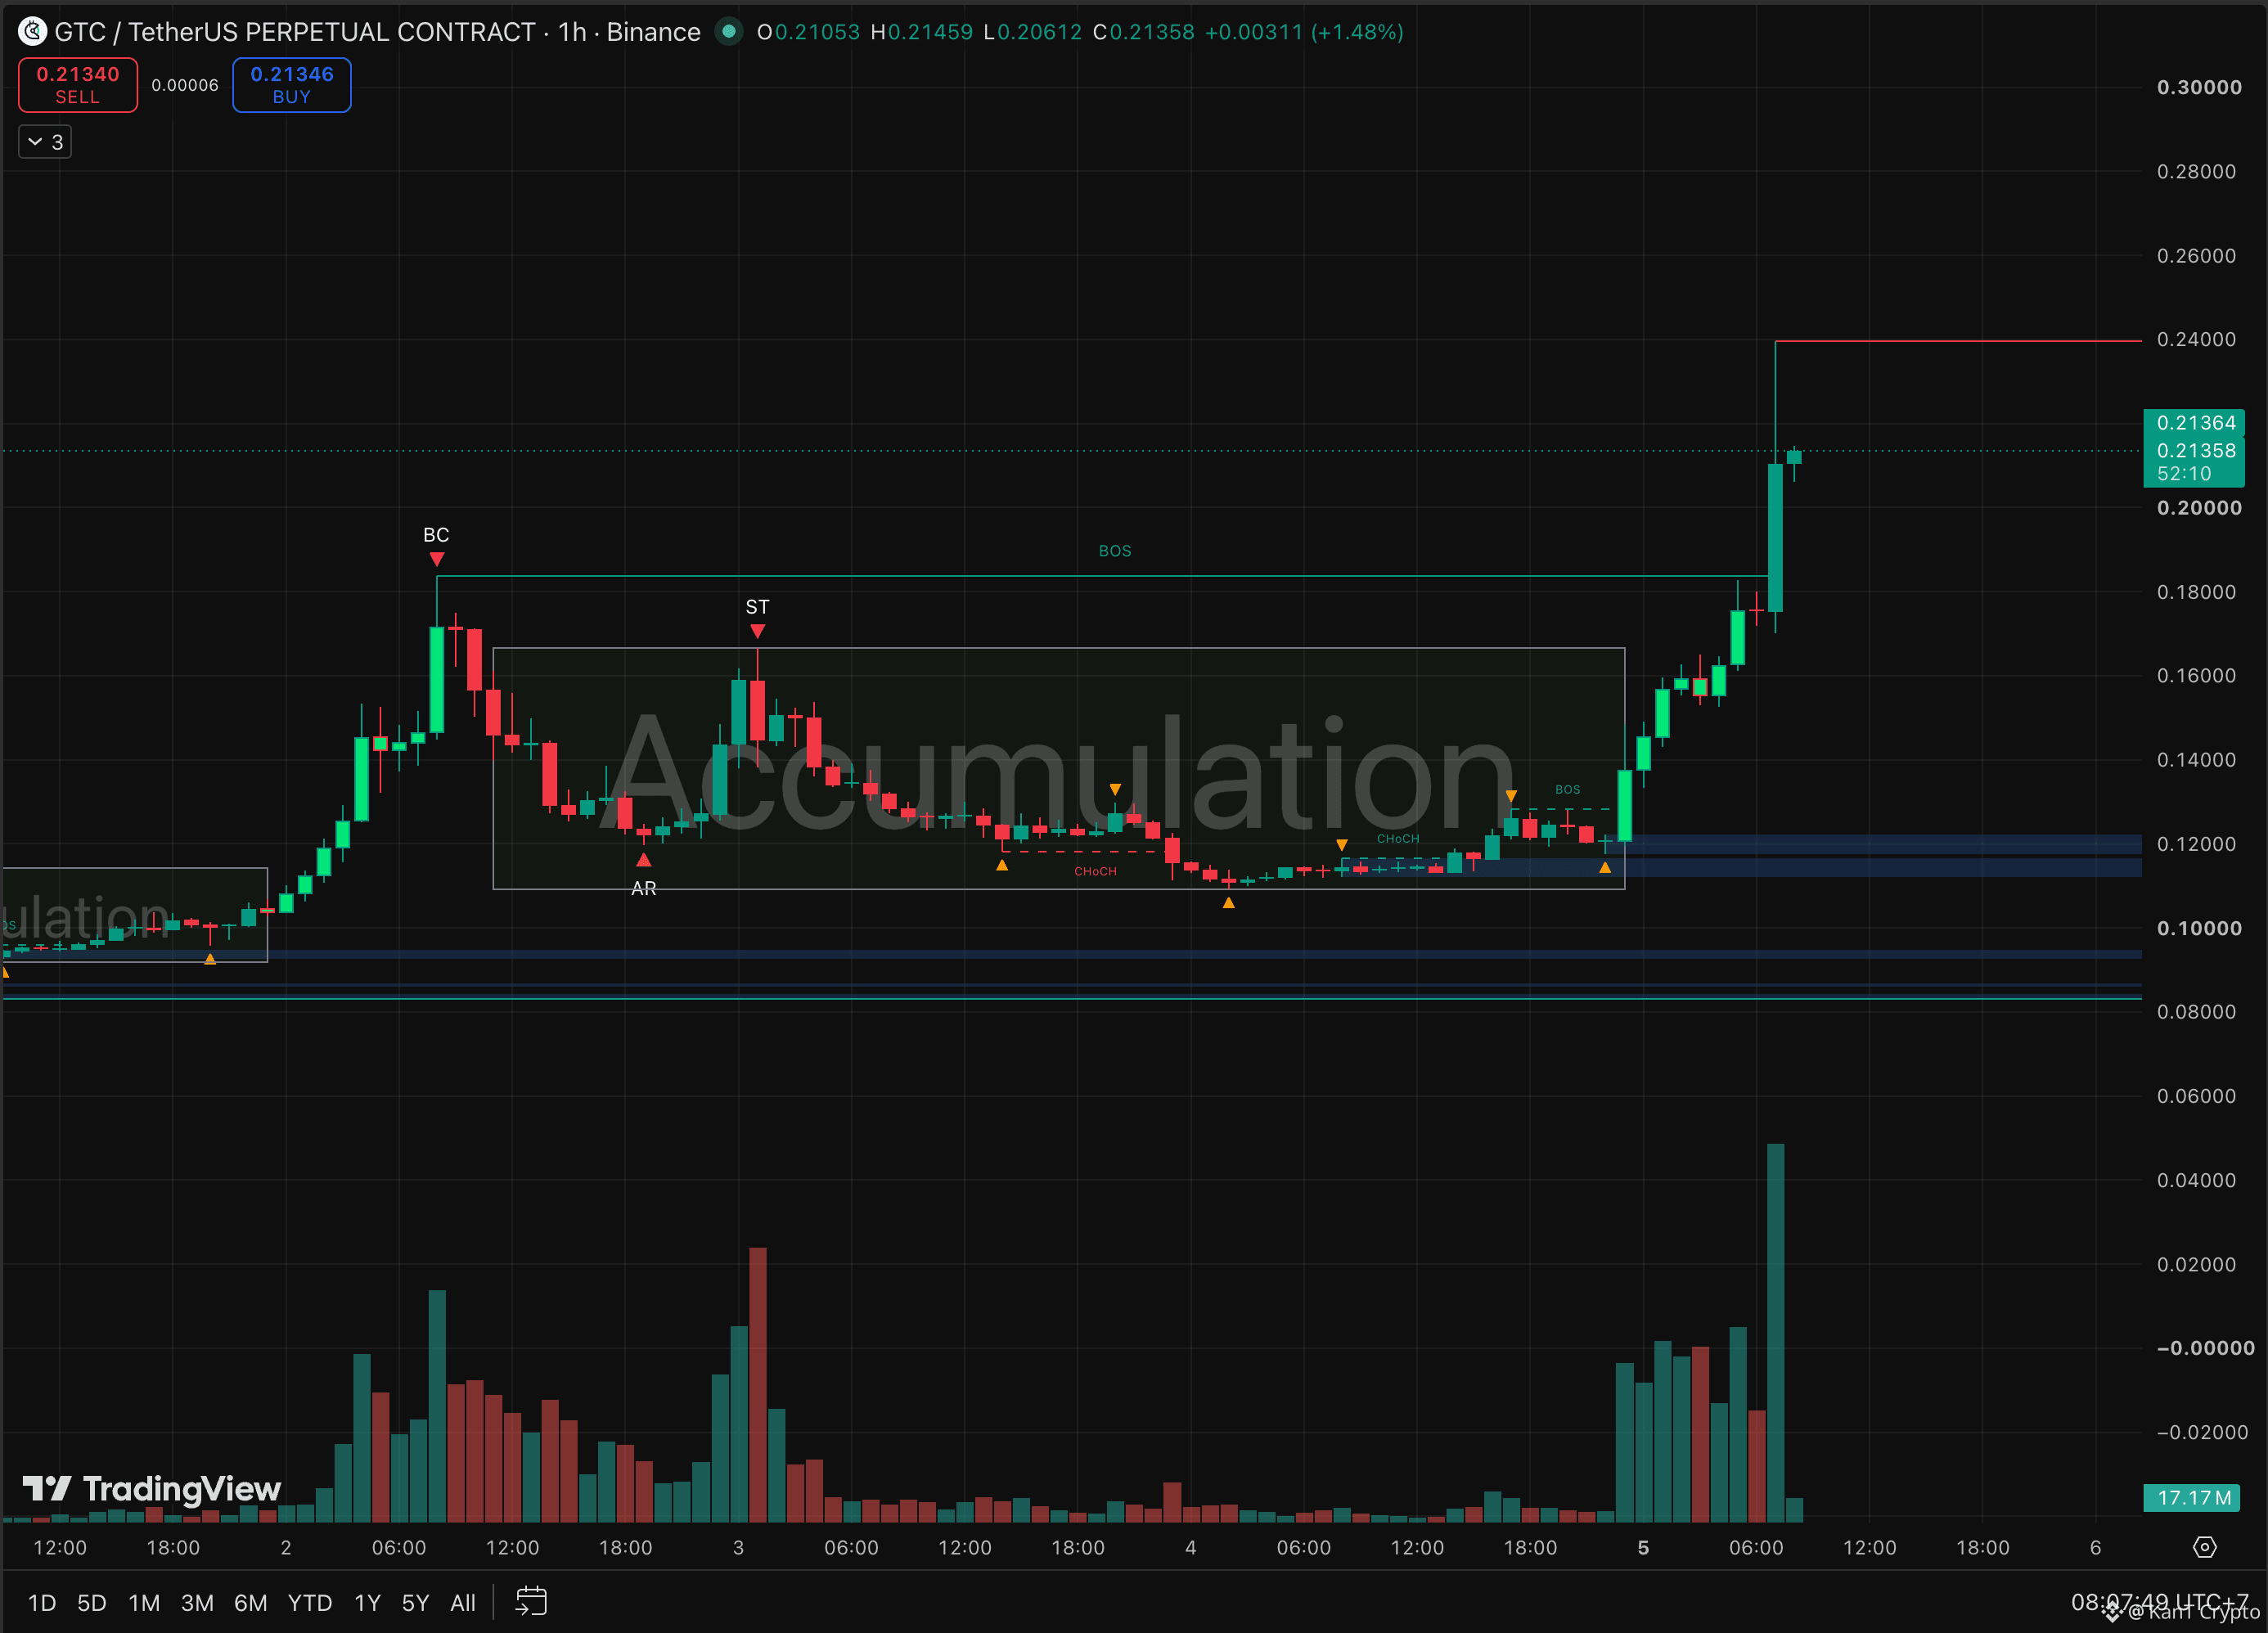
A textbook breakout, with a big wick attached.
The setup on the hourly:
A spike to about $0.184 on October 2, then three days of sideways grind between $0.109 and $0.166. Automatic rally, secondary test, a dip under the lows, then a change of character back up. That is what accumulation looks like.
Then the breakout: a staircase of green candles, and one big candle that cleared the $0.184 high on the heaviest volume of the move.
Price wicked to $0.24 before settling near $0.214, roughly double the box low.
For context, GTC traded near $0.086 on September 30. That's about 2.8x at the wick in under a week. 👀
But read the wick too. A spike to $0.24 that slips back to $0.21 means sellers met the move hard up there. No clear news catalyst has surfaced either, so this is a micro cap of roughly $19M running on flows and leverage.
The levels.
Hold $0.184, the old high and breakout level, and the markup can continue, with $0.24 the next test.
Lose it, and the $0.166 box top is the first real support, then the $0.113 to $0.122 demand zone.
Breakouts from clean bases are the best setups on a chart. Chasing the wick isn't one of them.
Retest $0.184 and reload, or does $0.24 mark the top? 🔥
Not financial advice.
$GTC
{future}(GTCUSDT)
$STRK
{future}(STRKUSDT)
$AIN
{future}(AINUSDT)
🚀 GTC Just Doubled Off Its Accumulation Base
A textbook breakout, with a big wick attached.
The setup on the hourly:
A spike to about $0.184 on October 2, then three days of sideways grind between $0.109 and $0.166. Automatic rally, secondary test, a dip under the lows, then a change of character back up. That is what accumulation looks like.
Then the breakout: a staircase of green candles, and one big candle that cleared the $0.184 high on the heaviest volume of the move.
Price wicked to $0.24 before settling near $0.214, roughly double the box low.
For context, GTC traded near $0.086 on September 30. That's about 2.8x at the wick in under a week. 👀
But read the wick too. A spike to $0.24 that slips back to $0.21 means sellers met the move hard up there. No clear news catalyst has surfaced either, so this is a micro cap of roughly $19M running on flows and leverage.
The levels.
Hold $0.184, the old high and breakout level, and the markup can continue, with $0.24 the next test.
Lose it, and the $0.166 box top is the first real support, then the $0.113 to $0.122 demand zone.
Breakouts from clean bases are the best setups on a chart. Chasing the wick isn't one of them.
Retest $0.184 and reload, or does $0.24 mark the top? 🔥
Not financial advice.
$GTC
$STRK
$AIN
A textbook breakout, with a big wick attached.
The setup on the hourly:
A spike to about $0.184 on October 2, then three days of sideways grind between $0.109 and $0.166. Automatic rally, secondary test, a dip under the lows, then a change of character back up. That is what accumulation looks like.
Then the breakout: a staircase of green candles, and one big candle that cleared the $0.184 high on the heaviest volume of the move.
Price wicked to $0.24 before settling near $0.214, roughly double the box low.
For context, GTC traded near $0.086 on September 30. That's about 2.8x at the wick in under a week. 👀
But read the wick too. A spike to $0.24 that slips back to $0.21 means sellers met the move hard up there. No clear news catalyst has surfaced either, so this is a micro cap of roughly $19M running on flows and leverage.
The levels.
Hold $0.184, the old high and breakout level, and the markup can continue, with $0.24 the next test.
Lose it, and the $0.166 box top is the first real support, then the $0.113 to $0.122 demand zone.
Breakouts from clean bases are the best setups on a chart. Chasing the wick isn't one of them.
Retest $0.184 and reload, or does $0.24 mark the top? 🔥
Not financial advice.
$GTC
$STRK
$AIN
1
1.4k
·
--
Bullish
📈 BREAKING: Bitcoin Just Printed Its Highest Weekly Close in Over 8 Months
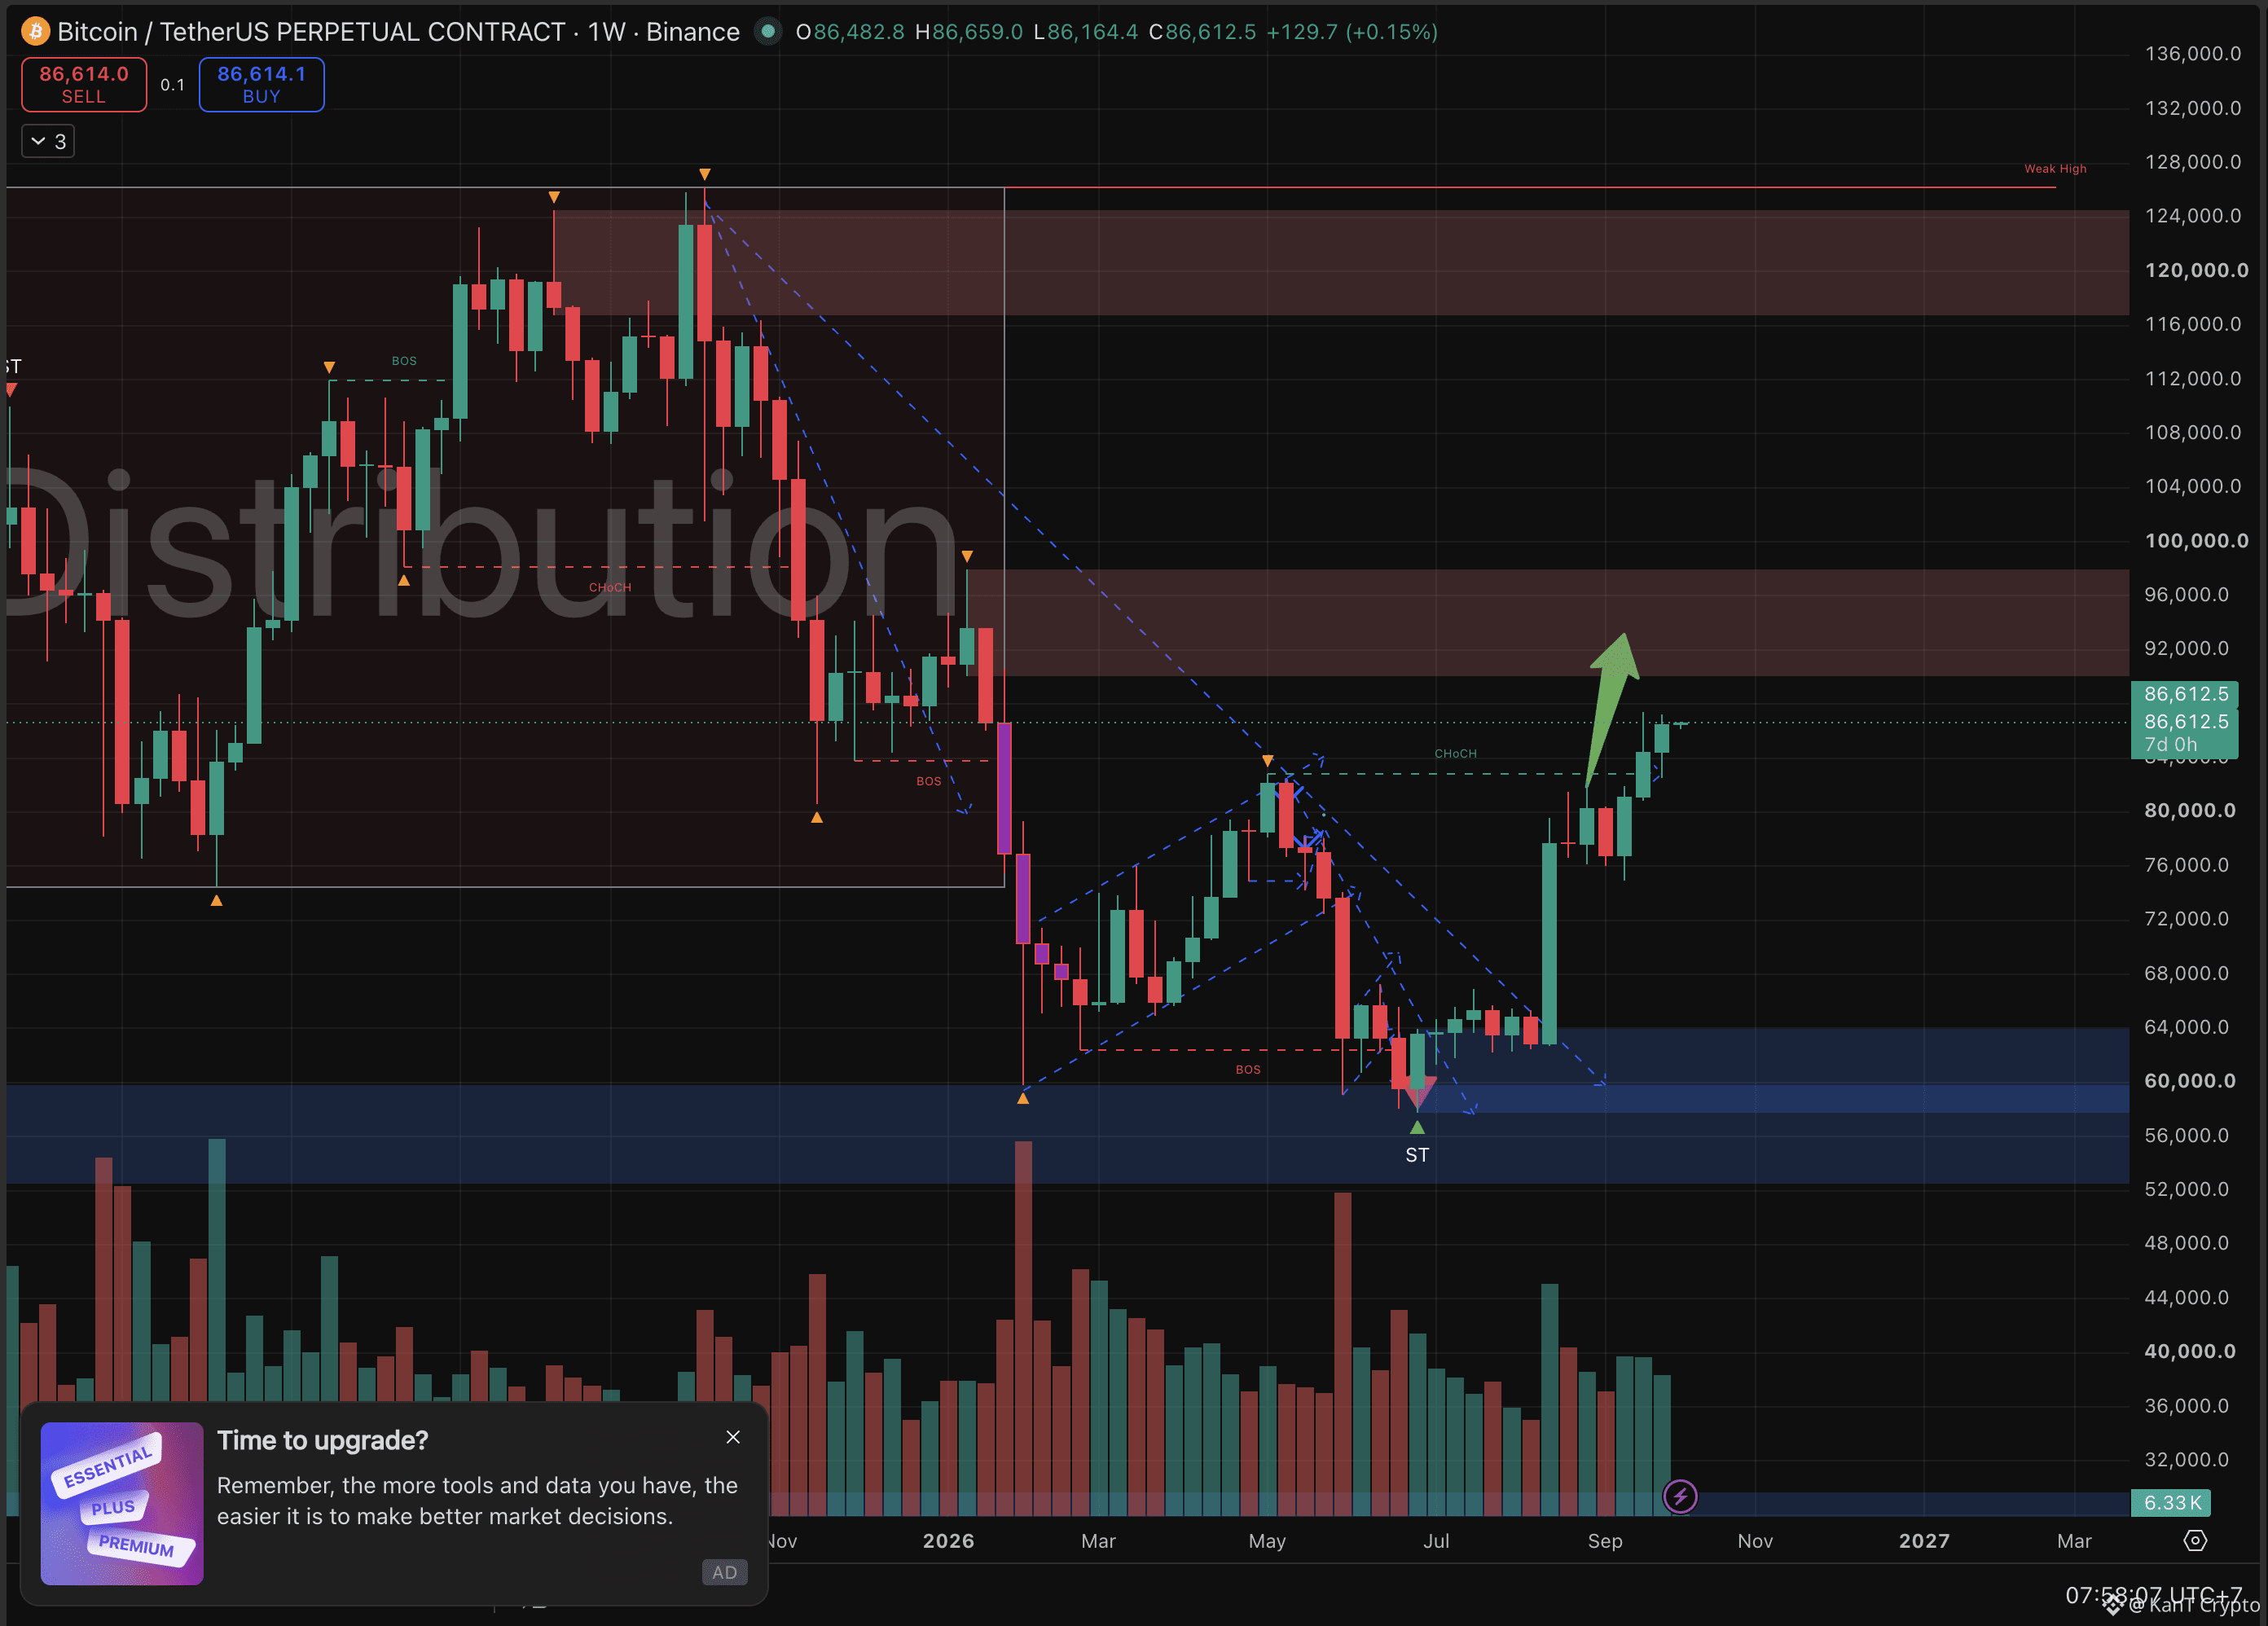
Last week closed near $86,480, the best weekly finish since January and a clear step above the prior week's $84,467.
The run behind it is big.
About 50% off the late-June low near $58K.
Q3 closed up nearly 43%, Bitcoin's best third quarter since 2017.
And it's the third straight weekly close above the 50-week moving average, now near $78K.
Zoom out and the weekly structure has flipped. 👀
Two lows near $58K to $60K, in February and June, held like a floor.
Then price broke above the May high around $82.8K, a weekly change of character, the first real sign the bear trend is losing control.
That doesn't mean the road is clear.
Glassnode flagged the next cluster of sell orders around $87K, right where price keeps stalling.
Above that, the $90K to $98K zone is heavy weekly supply, where January's breakdown began.
And the big ceiling, $116K to $124K, is where the 2025 top was distributed.
The levels.
Keep weekly closes above $82.8K, and the bull case stays intact, with $90K next.
Lose it, and this becomes another failed breakout inside a bigger range.
Weekly closes filter out noise. This one says buyers are in control, for now.
$90K next, or does $87K reject again first? 🔥
Not financial advice. $BTC
{future}(BTCUSDT)
$AIN
{future}(AINUSDT)
$GTC
{future}(GTCUSDT)
📈 BREAKING: Bitcoin Just Printed Its Highest Weekly Close in Over 8 Months
Last week closed near $86,480, the best weekly finish since January and a clear step above the prior week's $84,467.
The run behind it is big.
About 50% off the late-June low near $58K.
Q3 closed up nearly 43%, Bitcoin's best third quarter since 2017.
And it's the third straight weekly close above the 50-week moving average, now near $78K.
Zoom out and the weekly structure has flipped. 👀
Two lows near $58K to $60K, in February and June, held like a floor.
Then price broke above the May high around $82.8K, a weekly change of character, the first real sign the bear trend is losing control.
That doesn't mean the road is clear.
Glassnode flagged the next cluster of sell orders around $87K, right where price keeps stalling.
Above that, the $90K to $98K zone is heavy weekly supply, where January's breakdown began.
And the big ceiling, $116K to $124K, is where the 2025 top was distributed.
The levels.
Keep weekly closes above $82.8K, and the bull case stays intact, with $90K next.
Lose it, and this becomes another failed breakout inside a bigger range.
Weekly closes filter out noise. This one says buyers are in control, for now.
$90K next, or does $87K reject again first? 🔥
Not financial advice. $BTC
$AIN
$GTC
Last week closed near $86,480, the best weekly finish since January and a clear step above the prior week's $84,467.
The run behind it is big.
About 50% off the late-June low near $58K.
Q3 closed up nearly 43%, Bitcoin's best third quarter since 2017.
And it's the third straight weekly close above the 50-week moving average, now near $78K.
Zoom out and the weekly structure has flipped. 👀
Two lows near $58K to $60K, in February and June, held like a floor.
Then price broke above the May high around $82.8K, a weekly change of character, the first real sign the bear trend is losing control.
That doesn't mean the road is clear.
Glassnode flagged the next cluster of sell orders around $87K, right where price keeps stalling.
Above that, the $90K to $98K zone is heavy weekly supply, where January's breakdown began.
And the big ceiling, $116K to $124K, is where the 2025 top was distributed.
The levels.
Keep weekly closes above $82.8K, and the bull case stays intact, with $90K next.
Lose it, and this becomes another failed breakout inside a bigger range.
Weekly closes filter out noise. This one says buyers are in control, for now.
$90K next, or does $87K reject again first? 🔥
Not financial advice. $BTC
$AIN
$GTC
1
1k
·
--
Bullish
Verified
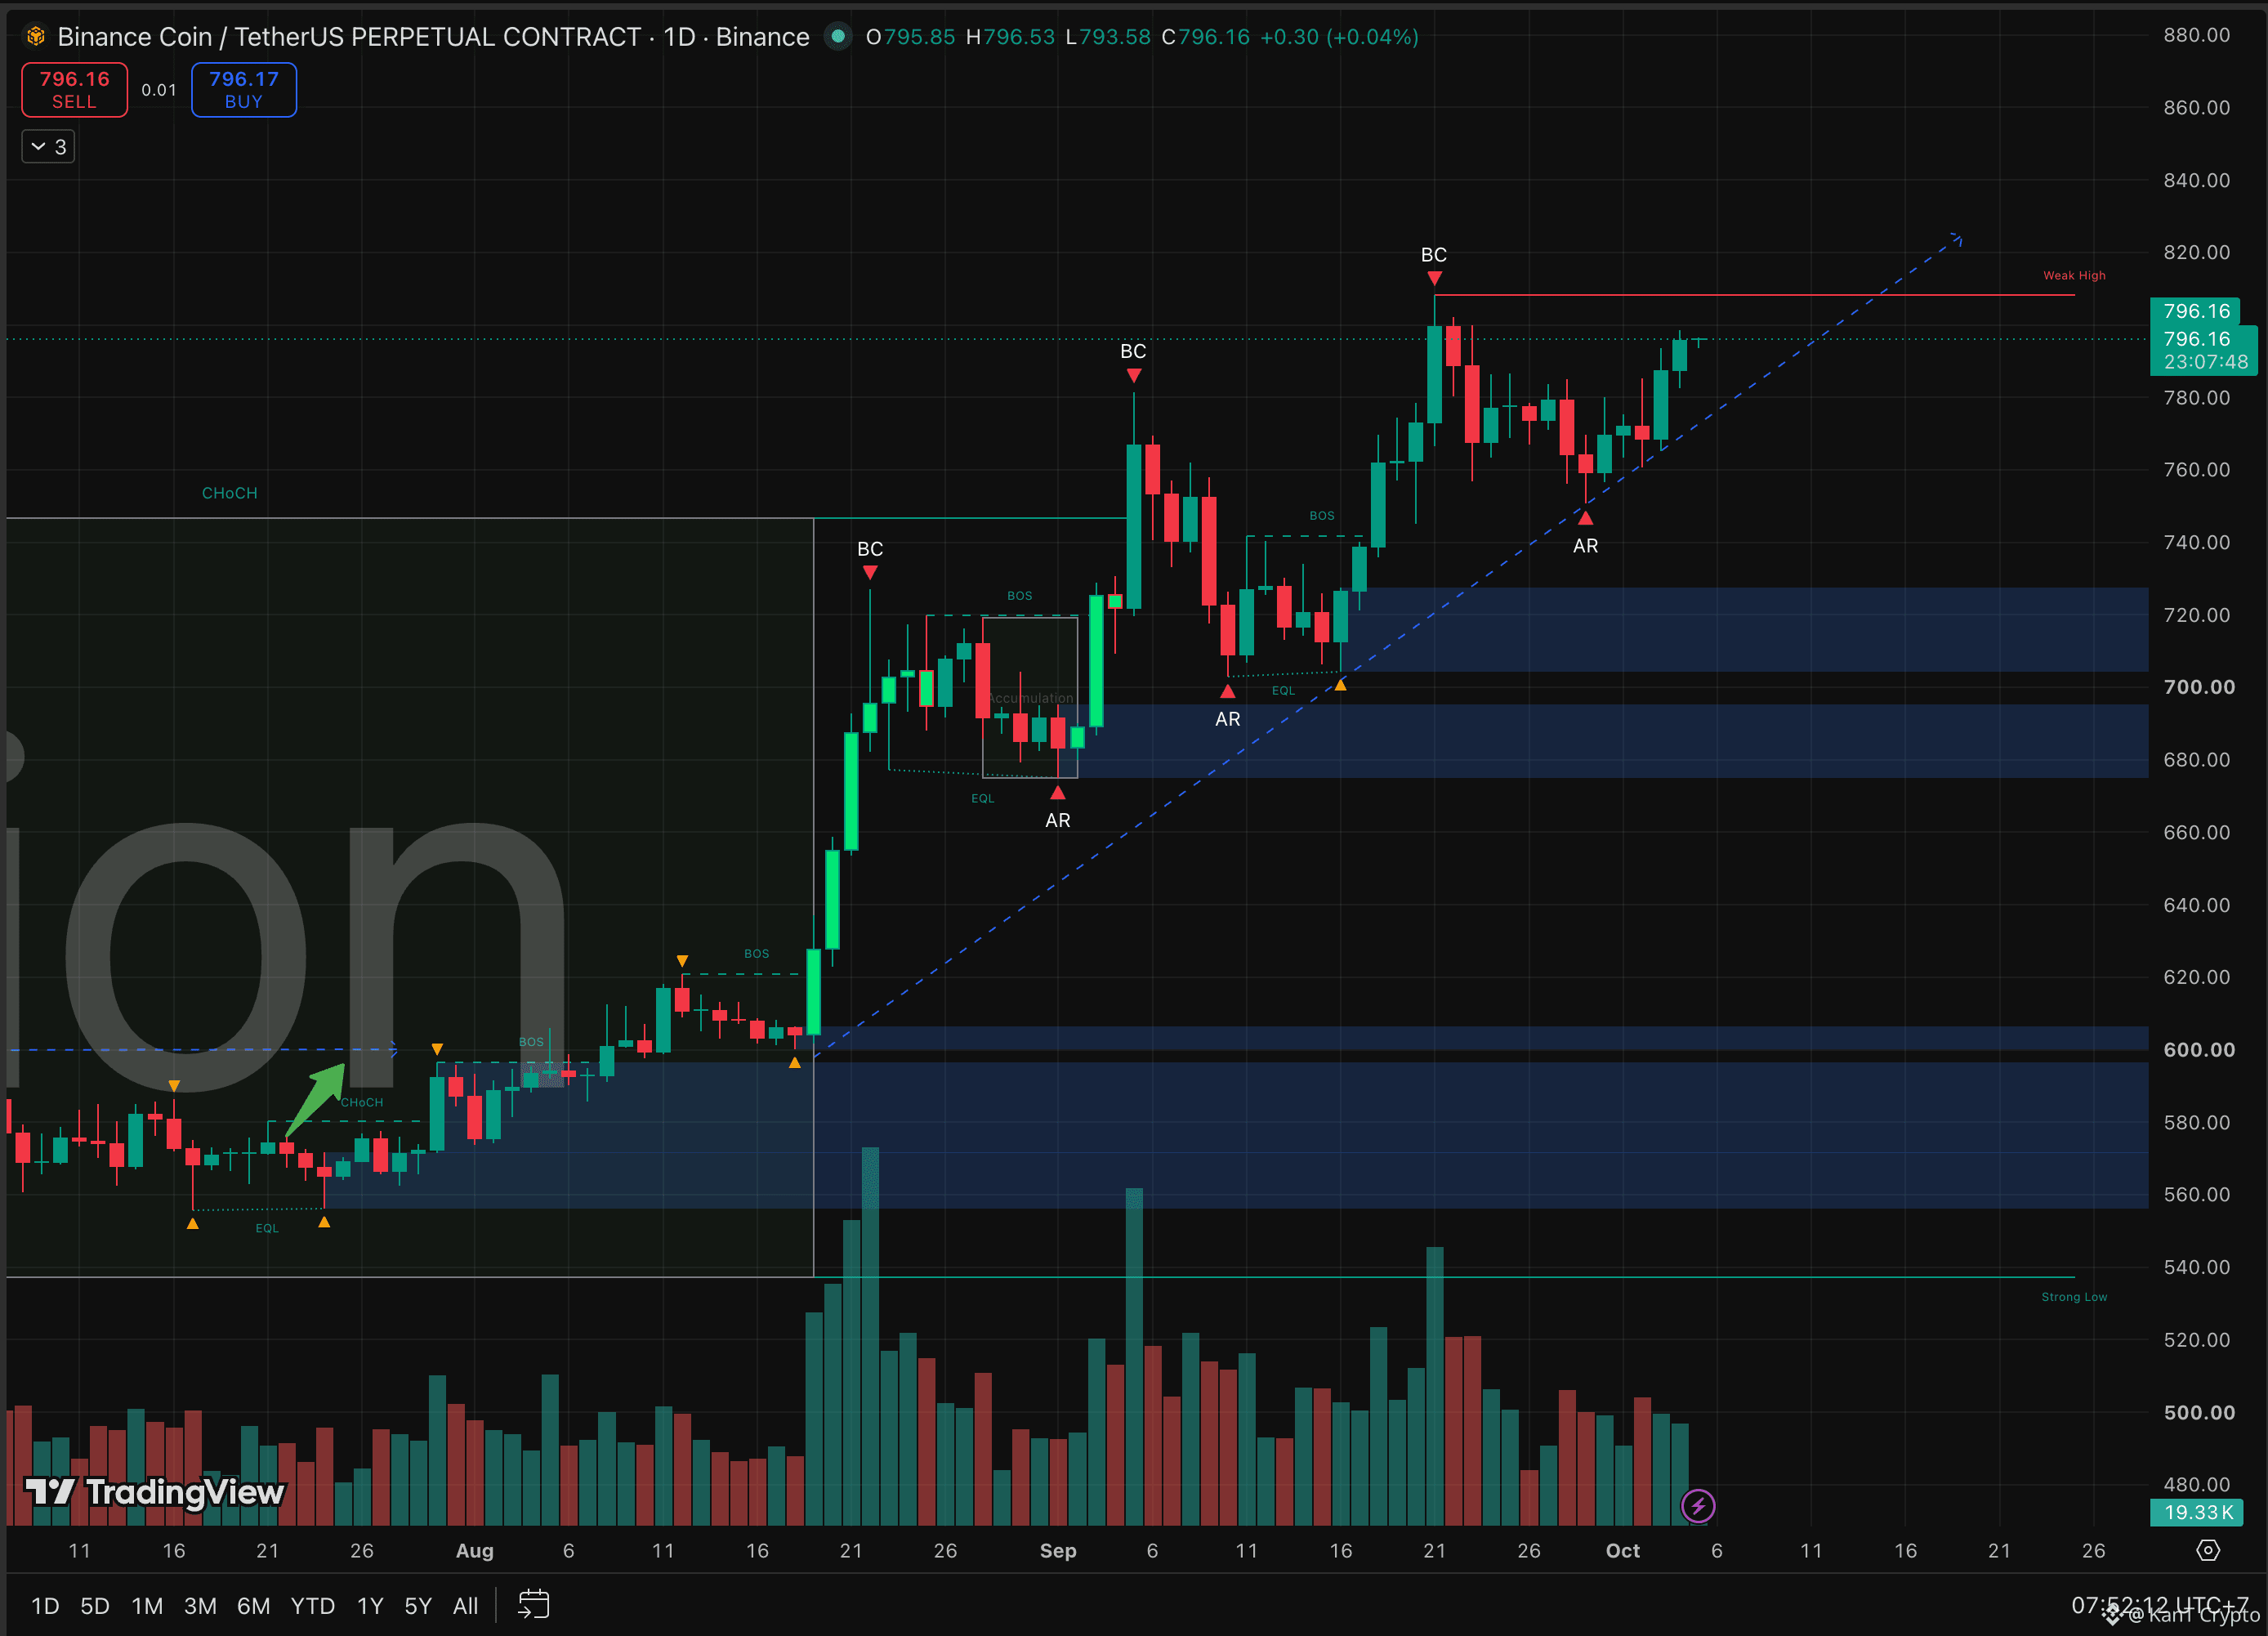
📈 BNB Is Riding the Rails Back to $800
Every dip since August has landed on the same rising trendline. The last one did too.
BNB is at $796 on the daily, right back under the $800 to $807 ceiling it tapped in late September.
For the record, last time we said BNB needed to hold $780 for another run at $807. It didn't. The pullback dipped to about $752, but it stopped right on the trendline, above the $720 to $740 zone, and buyers took it from there. 👀
That trendline is the whole story.
August: bounced near $600.
Mid-September: bounced near $702.
Late September: bounced near $752.
Higher lows, every time. The channel is intact.
The ceiling is just as clear. BNB has been boxed between roughly $746 and $807 for weeks, and a daily close above September's $807 high is what breaks the box.
There's a catalyst on the calendar too. The 37th quarterly BNB burn is expected around mid-October. The last one, in July, removed about 1.6 million BNB worth $932 million. Burns are known in advance, though, so they rarely surprise the market.
For perspective, even at $800, BNB sits about 42% below its $1,370 record from October 2025.
The levels.
Daily close above $807, and $820 then $850 come into view.
Lose the trendline near $770, and the $705 to $728 demand zone is next.
Trend traders buy the line, not the ceiling. Wait for the break or the bounce.
Box breaks at $807, or one more trip down the rails? 🔥
Not financial advice.
$BNB
{future}(BNBUSDT)
$AIN
{future}(AINUSDT)
$STRK
{future}(STRKUSDT)
📈 BNB Is Riding the Rails Back to $800
Every dip since August has landed on the same rising trendline. The last one did too.
BNB is at $796 on the daily, right back under the $800 to $807 ceiling it tapped in late September.
For the record, last time we said BNB needed to hold $780 for another run at $807. It didn't. The pullback dipped to about $752, but it stopped right on the trendline, above the $720 to $740 zone, and buyers took it from there. 👀
That trendline is the whole story.
August: bounced near $600.
Mid-September: bounced near $702.
Late September: bounced near $752.
Higher lows, every time. The channel is intact.
The ceiling is just as clear. BNB has been boxed between roughly $746 and $807 for weeks, and a daily close above September's $807 high is what breaks the box.
There's a catalyst on the calendar too. The 37th quarterly BNB burn is expected around mid-October. The last one, in July, removed about 1.6 million BNB worth $932 million. Burns are known in advance, though, so they rarely surprise the market.
For perspective, even at $800, BNB sits about 42% below its $1,370 record from October 2025.
The levels.
Daily close above $807, and $820 then $850 come into view.
Lose the trendline near $770, and the $705 to $728 demand zone is next.
Trend traders buy the line, not the ceiling. Wait for the break or the bounce.
Box breaks at $807, or one more trip down the rails? 🔥
Not financial advice.
$BNB
$AIN
$STRK
Every dip since August has landed on the same rising trendline. The last one did too.
BNB is at $796 on the daily, right back under the $800 to $807 ceiling it tapped in late September.
For the record, last time we said BNB needed to hold $780 for another run at $807. It didn't. The pullback dipped to about $752, but it stopped right on the trendline, above the $720 to $740 zone, and buyers took it from there. 👀
That trendline is the whole story.
August: bounced near $600.
Mid-September: bounced near $702.
Late September: bounced near $752.
Higher lows, every time. The channel is intact.
The ceiling is just as clear. BNB has been boxed between roughly $746 and $807 for weeks, and a daily close above September's $807 high is what breaks the box.
There's a catalyst on the calendar too. The 37th quarterly BNB burn is expected around mid-October. The last one, in July, removed about 1.6 million BNB worth $932 million. Burns are known in advance, though, so they rarely surprise the market.
For perspective, even at $800, BNB sits about 42% below its $1,370 record from October 2025.
The levels.
Daily close above $807, and $820 then $850 come into view.
Lose the trendline near $770, and the $705 to $728 demand zone is next.
Trend traders buy the line, not the ceiling. Wait for the break or the bounce.
Box breaks at $807, or one more trip down the rails? 🔥
Not financial advice.
$BNB
$AIN
$STRK
1
1.8k
·
--
Bullish
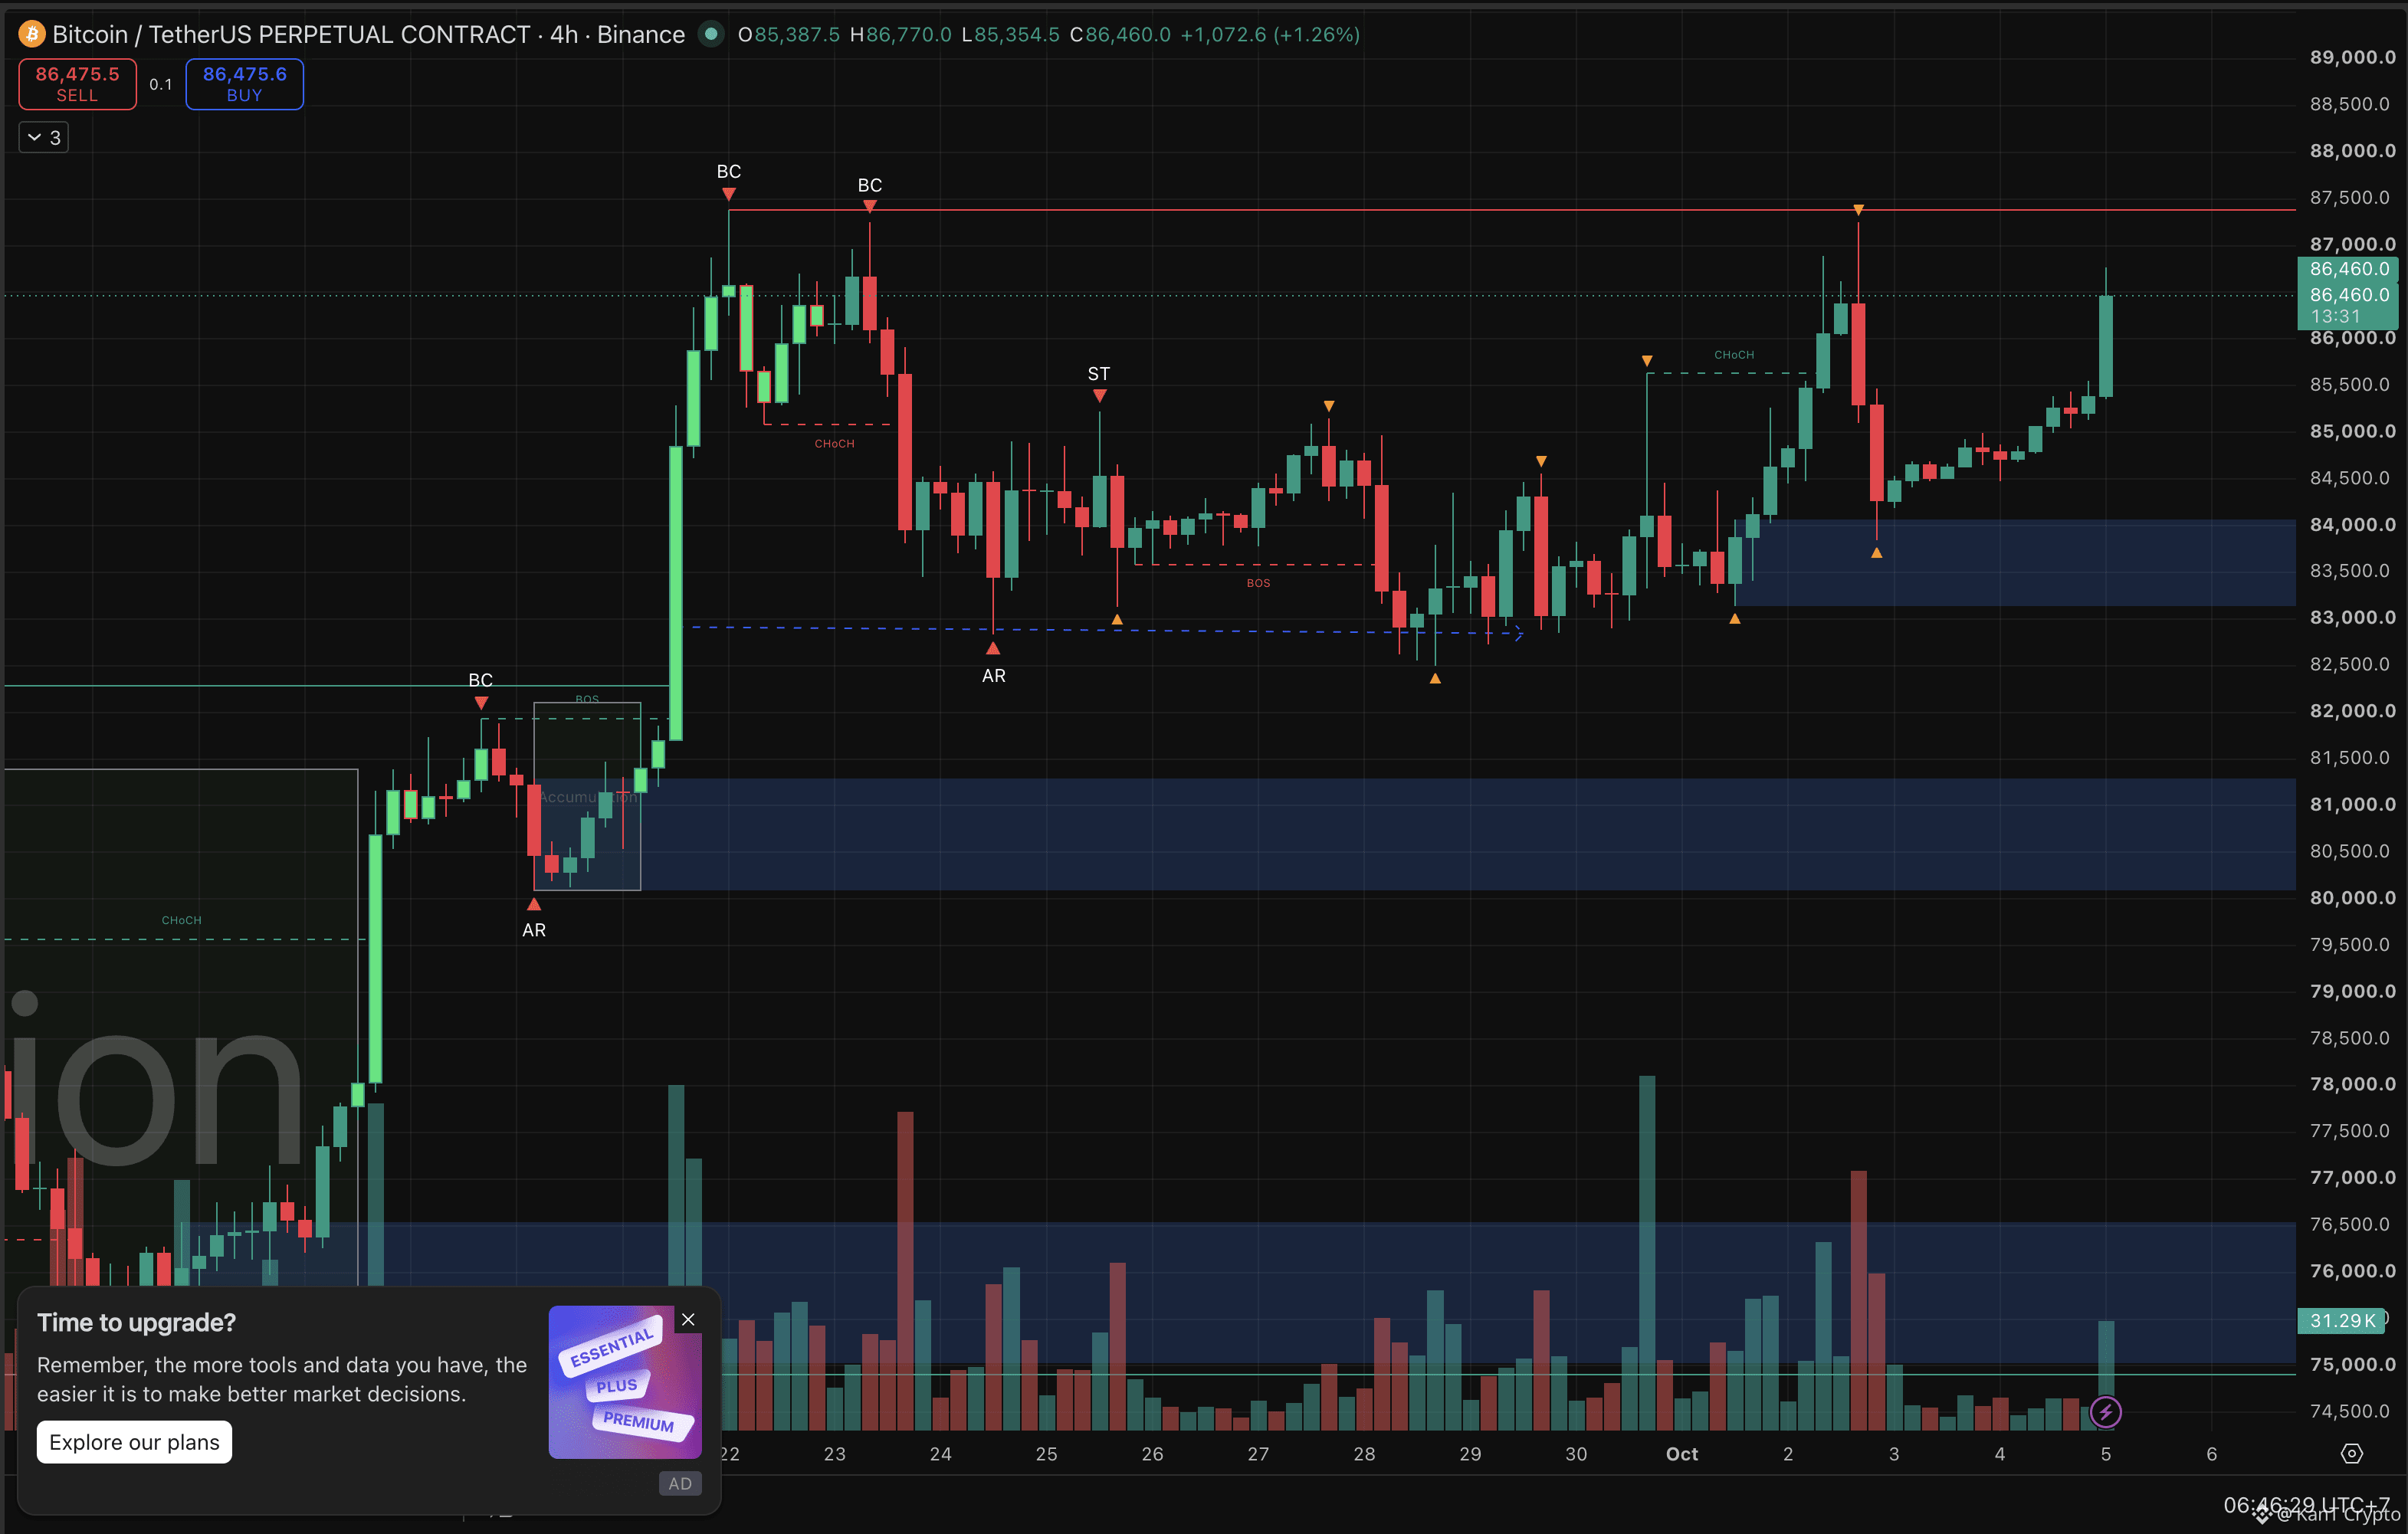
🥊 Round Three: Bitcoin vs. the $87K Ceiling
BTC is at $86,460 on the 4H, up 1.3%, wicking as high as $86,770. The same ceiling that capped September's double top and the October 2 spike is right back in front of it.
Round one: $87.4K in late September. Rejected.
Round two: $87.3K on October 2, around the jobs report. Rejected harder, all the way to $83.9K.
Round three: happening now.
What's different this time is the floor. 👀
The lows keep climbing: $82.4K on September 28, about $83K on October 1, and $83.9K after the jobs-report flush. A flat ceiling over rising lows is the shape of an ascending triangle, and those often resolve upward.
This 4H candle is also on track to close above $86K, the trigger we flagged last time for a real shot at $87.4K.
The macro backdrop helps too. Friday's weak jobs report pulled October hike odds sharply lower, easing the pressure on risk assets.
But ceilings tested three times are stubborn for a reason. Each rejection left sellers stacked between $86K and $87.4K, and part of this push came on thin weekend volume.
The levels.
Close above $87.4K, and the ceiling becomes the floor, with the September highs finally behind it.
Get rejected again, and $85K, then the $83.2K to $84.1K demand zone, are the first stops.
Third tests can break walls or break hearts. Let the close decide.
Ceiling breaks this time, or round three goes to the sellers? 🔥
Not financial advice. $BTC
{future}(BTCUSDT)
$STRK
{future}(STRKUSDT)
$AIN
{future}(AINUSDT)
🥊 Round Three: Bitcoin vs. the $87K Ceiling
BTC is at $86,460 on the 4H, up 1.3%, wicking as high as $86,770. The same ceiling that capped September's double top and the October 2 spike is right back in front of it.
Round one: $87.4K in late September. Rejected.
Round two: $87.3K on October 2, around the jobs report. Rejected harder, all the way to $83.9K.
Round three: happening now.
What's different this time is the floor. 👀
The lows keep climbing: $82.4K on September 28, about $83K on October 1, and $83.9K after the jobs-report flush. A flat ceiling over rising lows is the shape of an ascending triangle, and those often resolve upward.
This 4H candle is also on track to close above $86K, the trigger we flagged last time for a real shot at $87.4K.
The macro backdrop helps too. Friday's weak jobs report pulled October hike odds sharply lower, easing the pressure on risk assets.
But ceilings tested three times are stubborn for a reason. Each rejection left sellers stacked between $86K and $87.4K, and part of this push came on thin weekend volume.
The levels.
Close above $87.4K, and the ceiling becomes the floor, with the September highs finally behind it.
Get rejected again, and $85K, then the $83.2K to $84.1K demand zone, are the first stops.
Third tests can break walls or break hearts. Let the close decide.
Ceiling breaks this time, or round three goes to the sellers? 🔥
Not financial advice. $BTC
$STRK
$AIN
BTC is at $86,460 on the 4H, up 1.3%, wicking as high as $86,770. The same ceiling that capped September's double top and the October 2 spike is right back in front of it.
Round one: $87.4K in late September. Rejected.
Round two: $87.3K on October 2, around the jobs report. Rejected harder, all the way to $83.9K.
Round three: happening now.
What's different this time is the floor. 👀
The lows keep climbing: $82.4K on September 28, about $83K on October 1, and $83.9K after the jobs-report flush. A flat ceiling over rising lows is the shape of an ascending triangle, and those often resolve upward.
This 4H candle is also on track to close above $86K, the trigger we flagged last time for a real shot at $87.4K.
The macro backdrop helps too. Friday's weak jobs report pulled October hike odds sharply lower, easing the pressure on risk assets.
But ceilings tested three times are stubborn for a reason. Each rejection left sellers stacked between $86K and $87.4K, and part of this push came on thin weekend volume.
The levels.
Close above $87.4K, and the ceiling becomes the floor, with the September highs finally behind it.
Get rejected again, and $85K, then the $83.2K to $84.1K demand zone, are the first stops.
Third tests can break walls or break hearts. Let the close decide.
Ceiling breaks this time, or round three goes to the sellers? 🔥
Not financial advice. $BTC
$STRK
$AIN
2
3.3k
·
--
Bullish
Verified
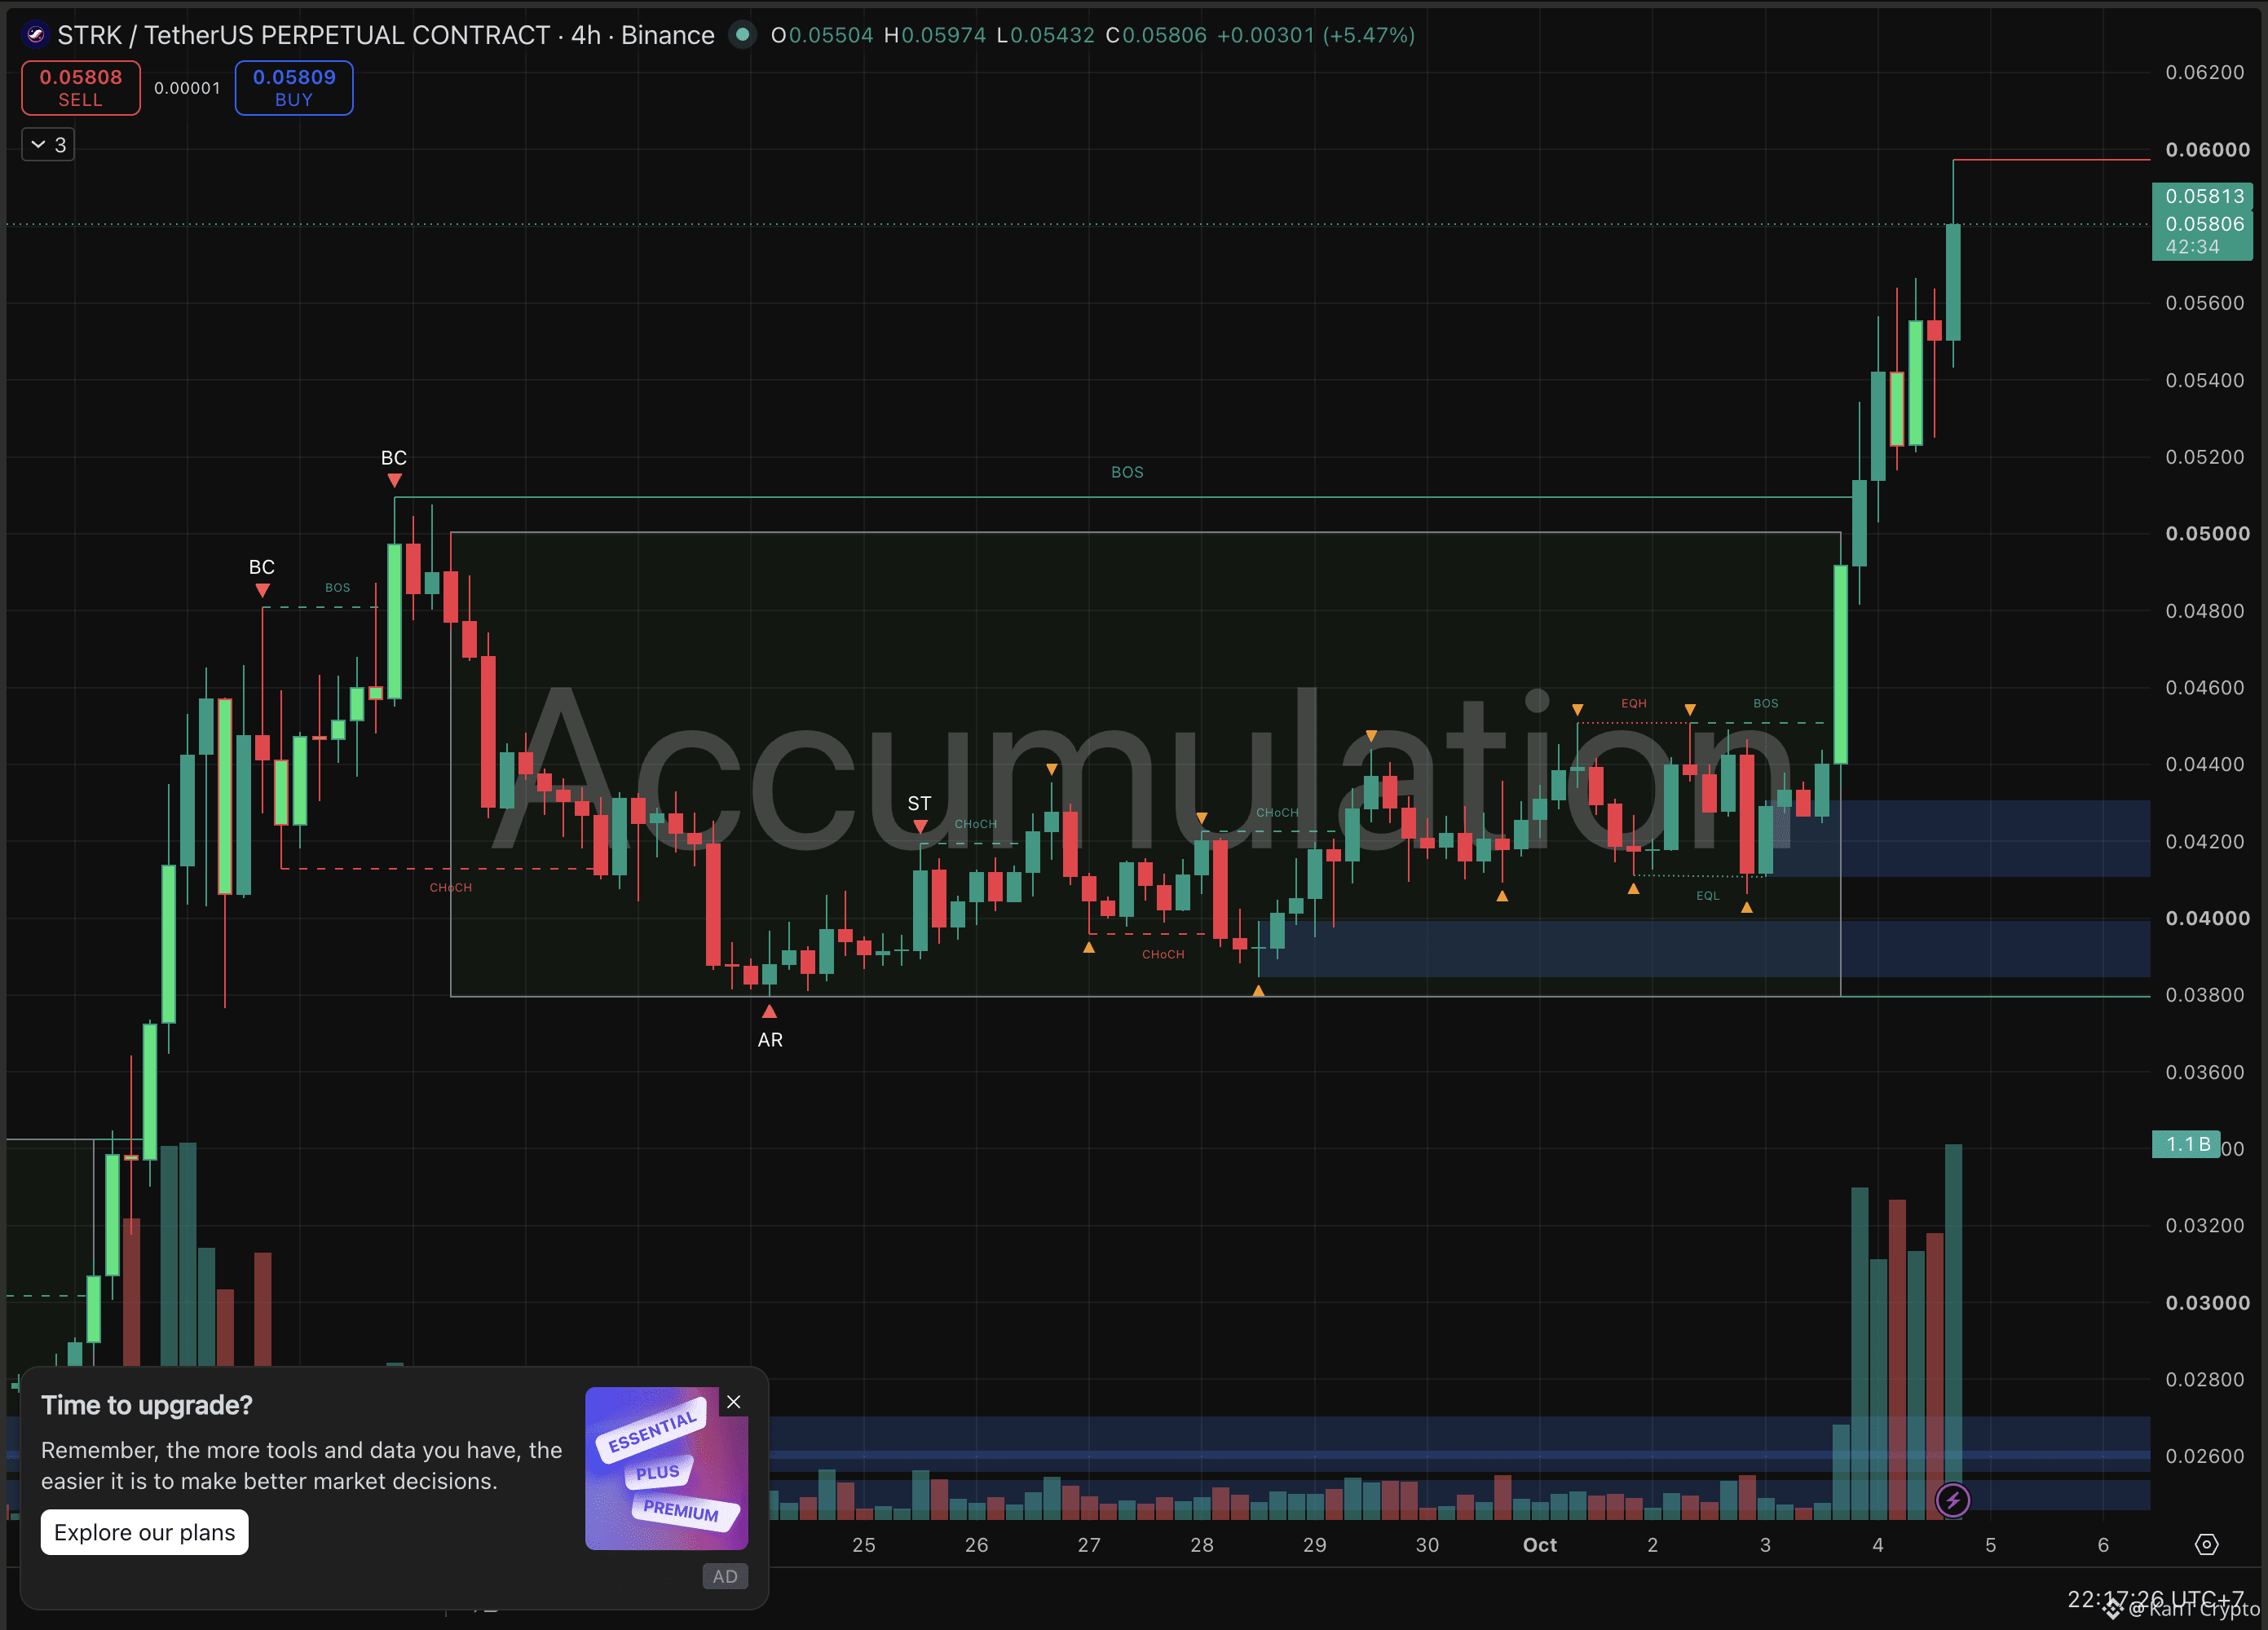
📦 STRK Just Broke Out of Its Box
Ten days grinding inside a range. Then one move blew the lid off.
The box: $0.038 to $0.050, from September 24 to October 3, with secondary tests, equal lows and equal highs along the way.
The breakout: price cleared the box, then took out September's $0.051 high, a fresh break of structure.
Now: $0.058, up 5.5% on this 4H candle after tagging $0.0597.
The fuel is real. 👀
On October 2, Starknet said it will cover bridge fees for the first 100 BTC moved onto the network through strkBTC, its Bitcoin-backed token, alongside staking rewards. A mainnet upgrade lands October 5.
But this is where it gets crowded.
$0.06 is the next big wall, and the 4H high stalled just under it.
Daily RSI sits above 74, overbought territory, after price closed above its upper Bollinger band.
And a 127 million STRK unlock hits on October 15. Fresh supply arriving into a rally is the classic test.
For perspective, STRK is still about 98% below its $2.75 all-time high.
The levels.
Clear and hold $0.06, and the breakout gets room to run.
Lose $0.054, where the latest push began, and a retest of the $0.050 box top becomes likely.
Below that, the $0.041 to $0.043 demand zone is where buyers built the base.
Breakouts from long ranges often get retested before they run. Patience pays more than FOMO.
Through $0.06, or back to retest the box? 🔥
Not financial advice.
$STRK
{future}(STRKUSDT)
$AIN
{future}(AINUSDT)
$BEAMX
{future}(BEAMXUSDT)
📦 STRK Just Broke Out of Its Box
Ten days grinding inside a range. Then one move blew the lid off.
The box: $0.038 to $0.050, from September 24 to October 3, with secondary tests, equal lows and equal highs along the way.
The breakout: price cleared the box, then took out September's $0.051 high, a fresh break of structure.
Now: $0.058, up 5.5% on this 4H candle after tagging $0.0597.
The fuel is real. 👀
On October 2, Starknet said it will cover bridge fees for the first 100 BTC moved onto the network through strkBTC, its Bitcoin-backed token, alongside staking rewards. A mainnet upgrade lands October 5.
But this is where it gets crowded.
$0.06 is the next big wall, and the 4H high stalled just under it.
Daily RSI sits above 74, overbought territory, after price closed above its upper Bollinger band.
And a 127 million STRK unlock hits on October 15. Fresh supply arriving into a rally is the classic test.
For perspective, STRK is still about 98% below its $2.75 all-time high.
The levels.
Clear and hold $0.06, and the breakout gets room to run.
Lose $0.054, where the latest push began, and a retest of the $0.050 box top becomes likely.
Below that, the $0.041 to $0.043 demand zone is where buyers built the base.
Breakouts from long ranges often get retested before they run. Patience pays more than FOMO.
Through $0.06, or back to retest the box? 🔥
Not financial advice.
$STRK
$AIN
$BEAMX
Ten days grinding inside a range. Then one move blew the lid off.
The box: $0.038 to $0.050, from September 24 to October 3, with secondary tests, equal lows and equal highs along the way.
The breakout: price cleared the box, then took out September's $0.051 high, a fresh break of structure.
Now: $0.058, up 5.5% on this 4H candle after tagging $0.0597.
The fuel is real. 👀
On October 2, Starknet said it will cover bridge fees for the first 100 BTC moved onto the network through strkBTC, its Bitcoin-backed token, alongside staking rewards. A mainnet upgrade lands October 5.
But this is where it gets crowded.
$0.06 is the next big wall, and the 4H high stalled just under it.
Daily RSI sits above 74, overbought territory, after price closed above its upper Bollinger band.
And a 127 million STRK unlock hits on October 15. Fresh supply arriving into a rally is the classic test.
For perspective, STRK is still about 98% below its $2.75 all-time high.
The levels.
Clear and hold $0.06, and the breakout gets room to run.
Lose $0.054, where the latest push began, and a retest of the $0.050 box top becomes likely.
Below that, the $0.041 to $0.043 demand zone is where buyers built the base.
Breakouts from long ranges often get retested before they run. Patience pays more than FOMO.
Through $0.06, or back to retest the box? 🔥
Not financial advice.
$STRK
$AIN
$BEAMX
1
902
·
--
Bearish
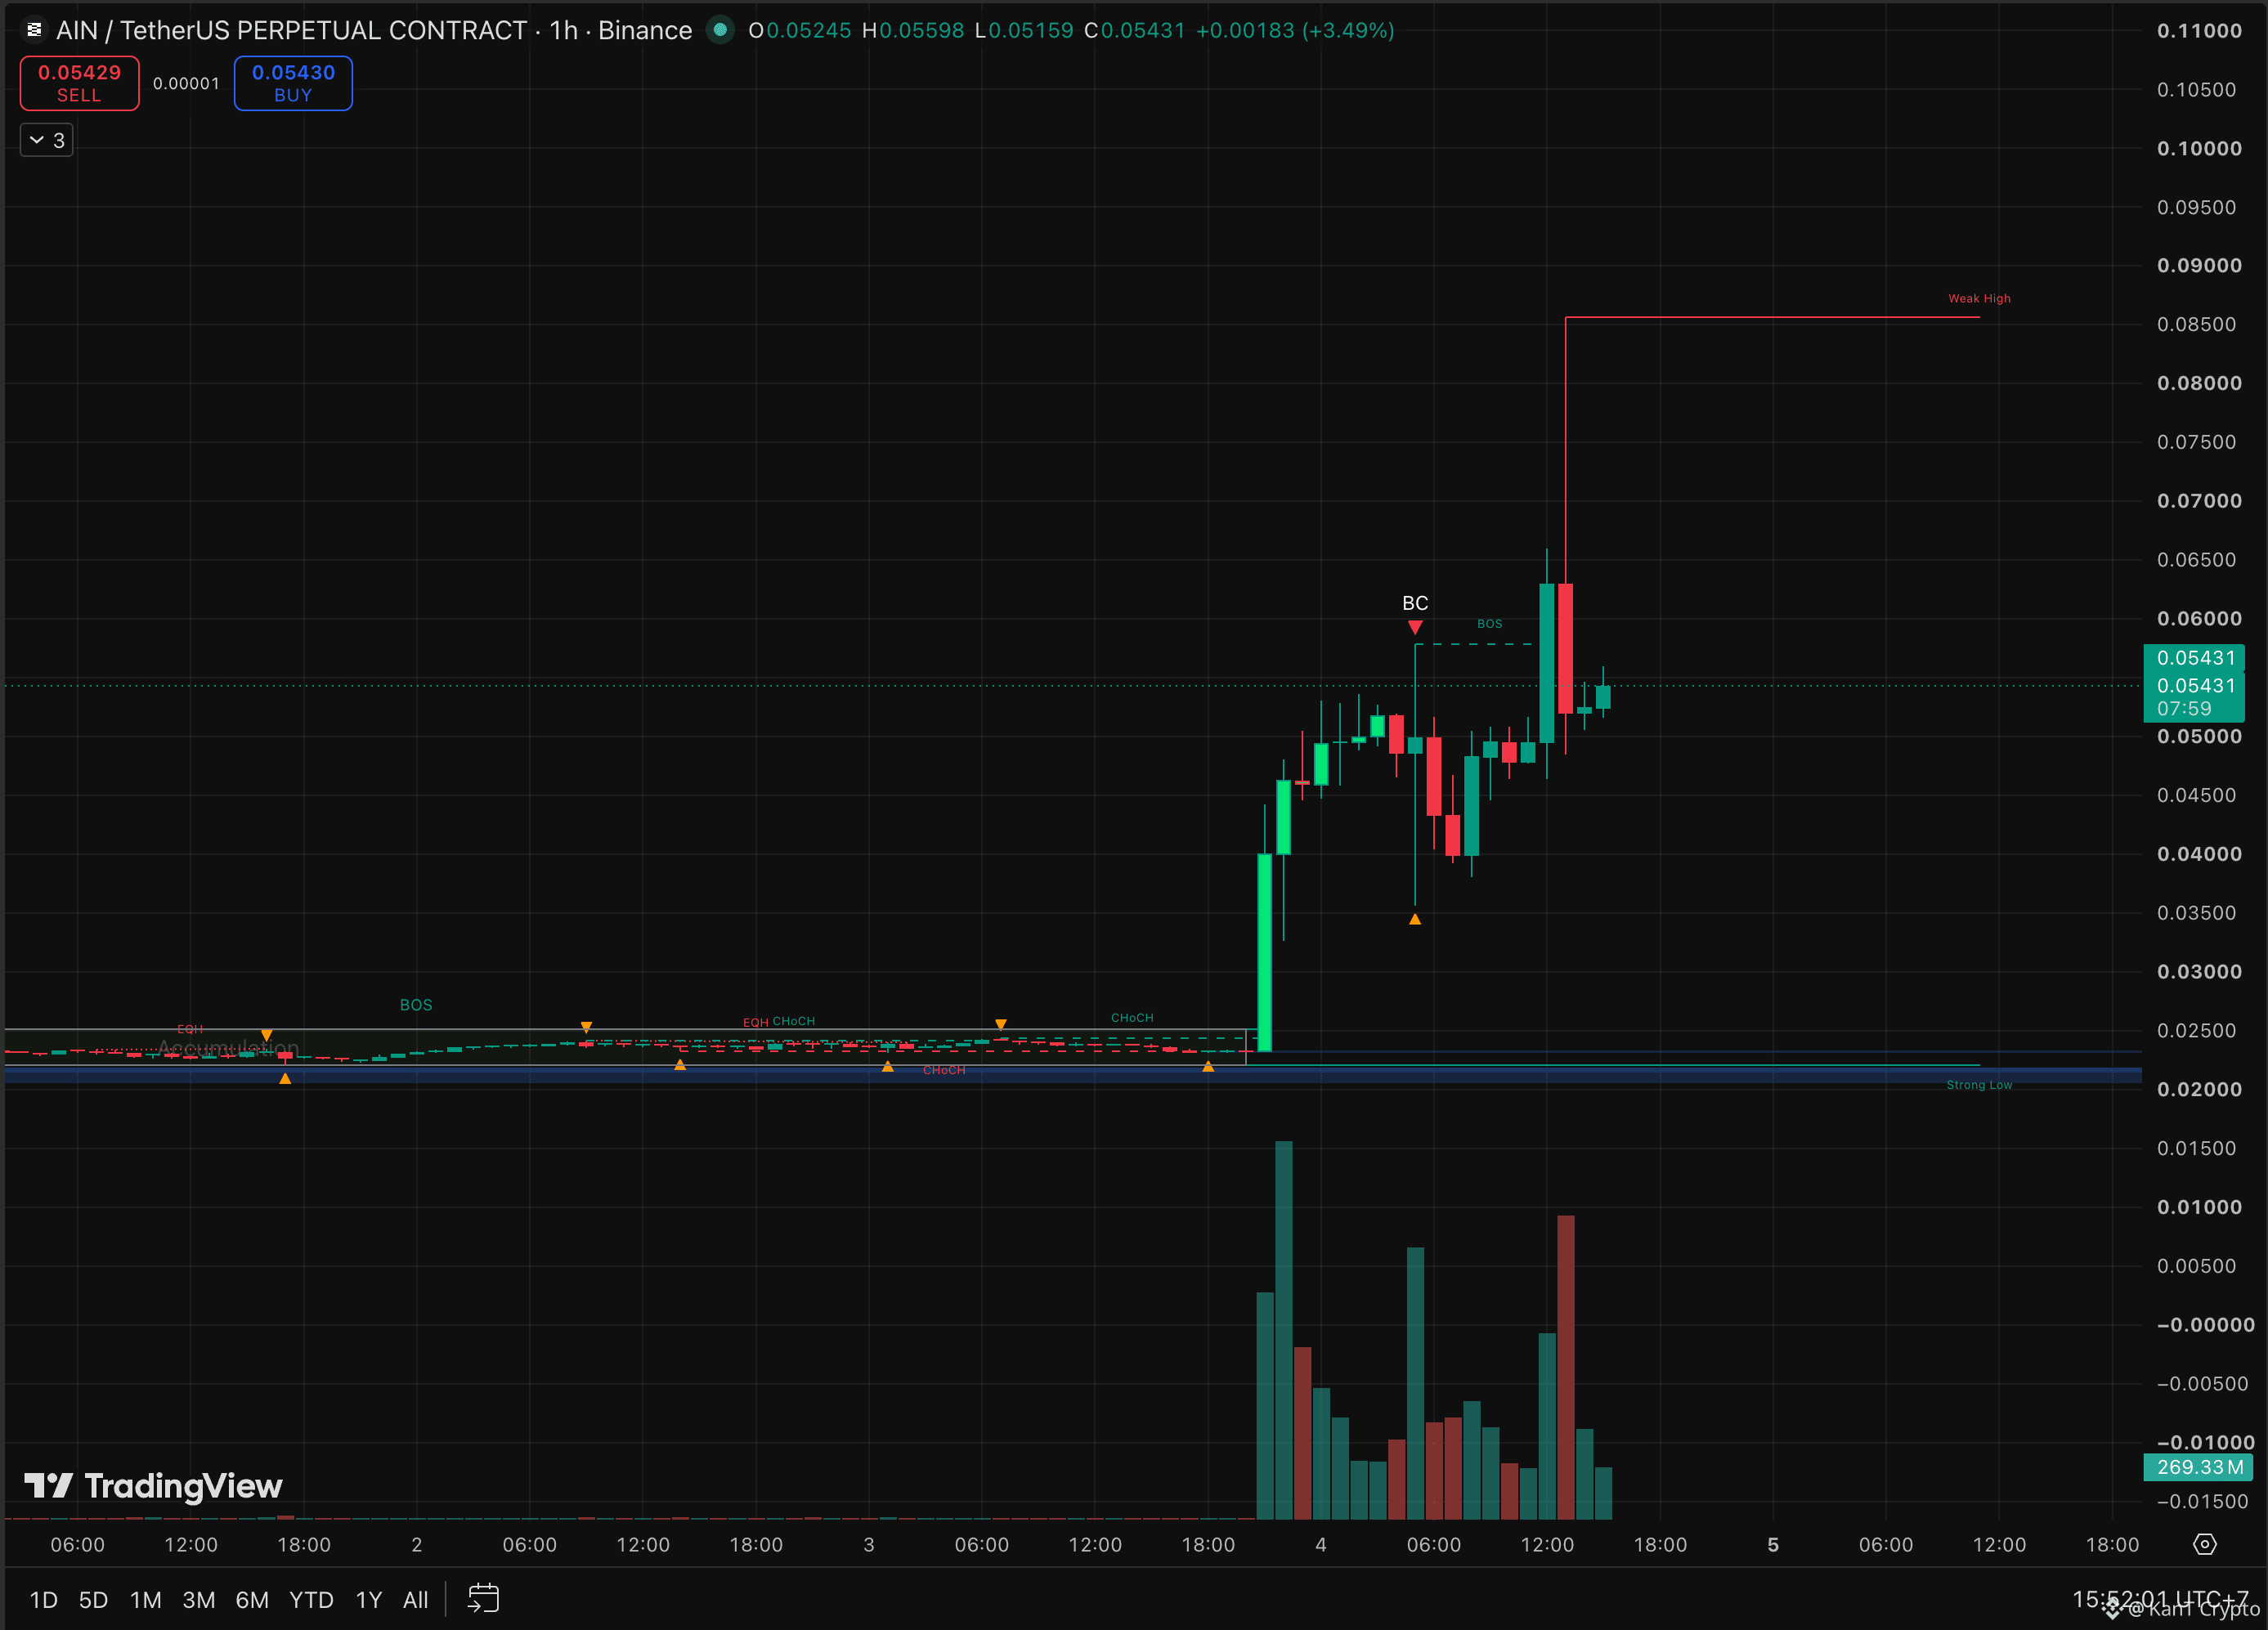
🕯️ AIN Just Printed One Monster Rejection Candle
One hourly candle told the whole story.
It opened near $0.063.
Spiked to $0.0856, up 36% within the hour.
Then closed near $0.052, about 17% below where it started.
That's a full rejection in a single hour. Every buyer who chased between $0.063 and $0.085 is now underwater, and the red volume bar underneath shows how much got sold into that spike. 👀
The run before it was wild too. AIN spent days flat around $0.022 to $0.025, not far above its $0.0158 all-time low from mid-September. Then it went vertical, roughly 3.6x from base to wick in under a day. An earlier buying climax near $0.058 had already flashed a warning, with a long wick down to $0.0355 in the same hour.
Keep the size in mind. AIN is a micro cap around $17M, with only about a third of max supply circulating and high-leverage perps trading on it. Thin books plus big leverage are exactly how candles like this get made.
The levels.
Hold $0.050, and AIN can try to base under the wick.
Lose it, and the $0.039 to $0.046 dip lows from earlier today come next.
Below that, the $0.0235 base is where this whole run began.
Bulls need to reclaim $0.063, the rejection candle's open, to cancel the signal.
Big wicks are maps of trapped buyers. Don't add your name to the list.
Base at $0.050, or does the wick mark the top? 🔥
Not financial advice.
$AIN
{future}(AINUSDT)
$STRK
{spot}(STRKUSDT)
$PUMP
{future}(PUMPUSDT)
🕯️ AIN Just Printed One Monster Rejection Candle
One hourly candle told the whole story.
It opened near $0.063.
Spiked to $0.0856, up 36% within the hour.
Then closed near $0.052, about 17% below where it started.
That's a full rejection in a single hour. Every buyer who chased between $0.063 and $0.085 is now underwater, and the red volume bar underneath shows how much got sold into that spike. 👀
The run before it was wild too. AIN spent days flat around $0.022 to $0.025, not far above its $0.0158 all-time low from mid-September. Then it went vertical, roughly 3.6x from base to wick in under a day. An earlier buying climax near $0.058 had already flashed a warning, with a long wick down to $0.0355 in the same hour.
Keep the size in mind. AIN is a micro cap around $17M, with only about a third of max supply circulating and high-leverage perps trading on it. Thin books plus big leverage are exactly how candles like this get made.
The levels.
Hold $0.050, and AIN can try to base under the wick.
Lose it, and the $0.039 to $0.046 dip lows from earlier today come next.
Below that, the $0.0235 base is where this whole run began.
Bulls need to reclaim $0.063, the rejection candle's open, to cancel the signal.
Big wicks are maps of trapped buyers. Don't add your name to the list.
Base at $0.050, or does the wick mark the top? 🔥
Not financial advice.
$AIN
$STRK
$PUMP
One hourly candle told the whole story.
It opened near $0.063.
Spiked to $0.0856, up 36% within the hour.
Then closed near $0.052, about 17% below where it started.
That's a full rejection in a single hour. Every buyer who chased between $0.063 and $0.085 is now underwater, and the red volume bar underneath shows how much got sold into that spike. 👀
The run before it was wild too. AIN spent days flat around $0.022 to $0.025, not far above its $0.0158 all-time low from mid-September. Then it went vertical, roughly 3.6x from base to wick in under a day. An earlier buying climax near $0.058 had already flashed a warning, with a long wick down to $0.0355 in the same hour.
Keep the size in mind. AIN is a micro cap around $17M, with only about a third of max supply circulating and high-leverage perps trading on it. Thin books plus big leverage are exactly how candles like this get made.
The levels.
Hold $0.050, and AIN can try to base under the wick.
Lose it, and the $0.039 to $0.046 dip lows from earlier today come next.
Below that, the $0.0235 base is where this whole run began.
Bulls need to reclaim $0.063, the rejection candle's open, to cancel the signal.
Big wicks are maps of trapped buyers. Don't add your name to the list.
Base at $0.050, or does the wick mark the top? 🔥
Not financial advice.
$AIN
$STRK
$PUMP
1
1.1k
·
--
Bullish
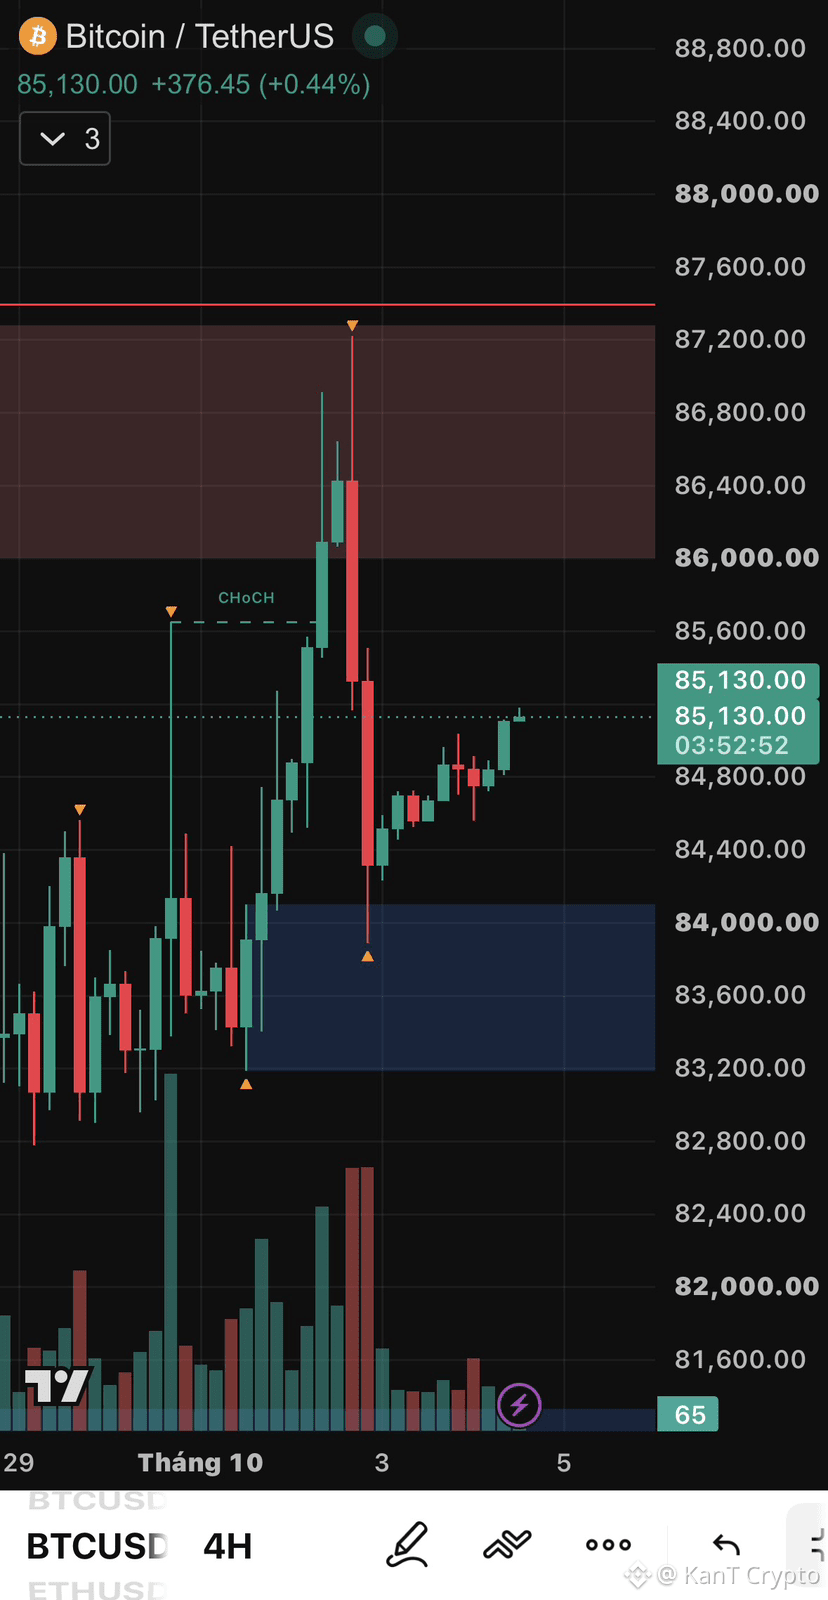
🛡️ Bitcoin Defended Its Floor and Climbed Back to $85K
Friday was a whipsaw. The weekend is a recovery.
Around Friday's jobs report, BTC spiked to about $87.2K, right into the $86K to $87.2K supply zone, then flushed to $83,900 within hours.
And the floor held. 👀
The wick dipped into the $83.2K to $84.1K demand zone and buyers snapped it right back. Since then, a steady climb to $85,130.
For the record, last time we said a rejection at supply would bring $84K back into focus. That's right where the flush stopped. The $83K floor never even got tested.
The bigger shift is macro. September payrolls came in at just 29,000 versus 84,000 expected, unemployment ticked up to 4.2%, and wage growth slowed to 3%, the lowest since 2021. Traders now see a high chance the Fed holds in October, a sharp turn from last week's hike fears.
But the ceiling hasn't moved. The $86K to $87.2K supply zone has rejected every push since the double top, and the $87.4K high sits right above it.
The levels.
Clear $86K with a 4H close, and a real shot at $87.4K opens up.
Lose $84K, and the $83.2K to $84.1K demand zone gets its next test.
Weekend volume is thin, so moves can overshoot both ways. Let Monday's volume confirm.
Fourth time lucky at $86K, or another rejection? 🔥
Not financial advice.
$BTC
{future}(BTCUSDT)
$ZEC
{future}(ZECUSDT)
$AIN
{future}(AINUSDT)
🛡️ Bitcoin Defended Its Floor and Climbed Back to $85K
Friday was a whipsaw. The weekend is a recovery.
Around Friday's jobs report, BTC spiked to about $87.2K, right into the $86K to $87.2K supply zone, then flushed to $83,900 within hours.
And the floor held. 👀
The wick dipped into the $83.2K to $84.1K demand zone and buyers snapped it right back. Since then, a steady climb to $85,130.
For the record, last time we said a rejection at supply would bring $84K back into focus. That's right where the flush stopped. The $83K floor never even got tested.
The bigger shift is macro. September payrolls came in at just 29,000 versus 84,000 expected, unemployment ticked up to 4.2%, and wage growth slowed to 3%, the lowest since 2021. Traders now see a high chance the Fed holds in October, a sharp turn from last week's hike fears.
But the ceiling hasn't moved. The $86K to $87.2K supply zone has rejected every push since the double top, and the $87.4K high sits right above it.
The levels.
Clear $86K with a 4H close, and a real shot at $87.4K opens up.
Lose $84K, and the $83.2K to $84.1K demand zone gets its next test.
Weekend volume is thin, so moves can overshoot both ways. Let Monday's volume confirm.
Fourth time lucky at $86K, or another rejection? 🔥
Not financial advice.
$BTC
$ZEC
$AIN
Friday was a whipsaw. The weekend is a recovery.
Around Friday's jobs report, BTC spiked to about $87.2K, right into the $86K to $87.2K supply zone, then flushed to $83,900 within hours.
And the floor held. 👀
The wick dipped into the $83.2K to $84.1K demand zone and buyers snapped it right back. Since then, a steady climb to $85,130.
For the record, last time we said a rejection at supply would bring $84K back into focus. That's right where the flush stopped. The $83K floor never even got tested.
The bigger shift is macro. September payrolls came in at just 29,000 versus 84,000 expected, unemployment ticked up to 4.2%, and wage growth slowed to 3%, the lowest since 2021. Traders now see a high chance the Fed holds in October, a sharp turn from last week's hike fears.
But the ceiling hasn't moved. The $86K to $87.2K supply zone has rejected every push since the double top, and the $87.4K high sits right above it.
The levels.
Clear $86K with a 4H close, and a real shot at $87.4K opens up.
Lose $84K, and the $83.2K to $84.1K demand zone gets its next test.
Weekend volume is thin, so moves can overshoot both ways. Let Monday's volume confirm.
Fourth time lucky at $86K, or another rejection? 🔥
Not financial advice.
$BTC
$ZEC
$AIN
2
518
·
--
Bearish
🎄 MOVR's Christmas Tree Is Starting to Come Down
The trunk grew taller first. Now the descent has begun.
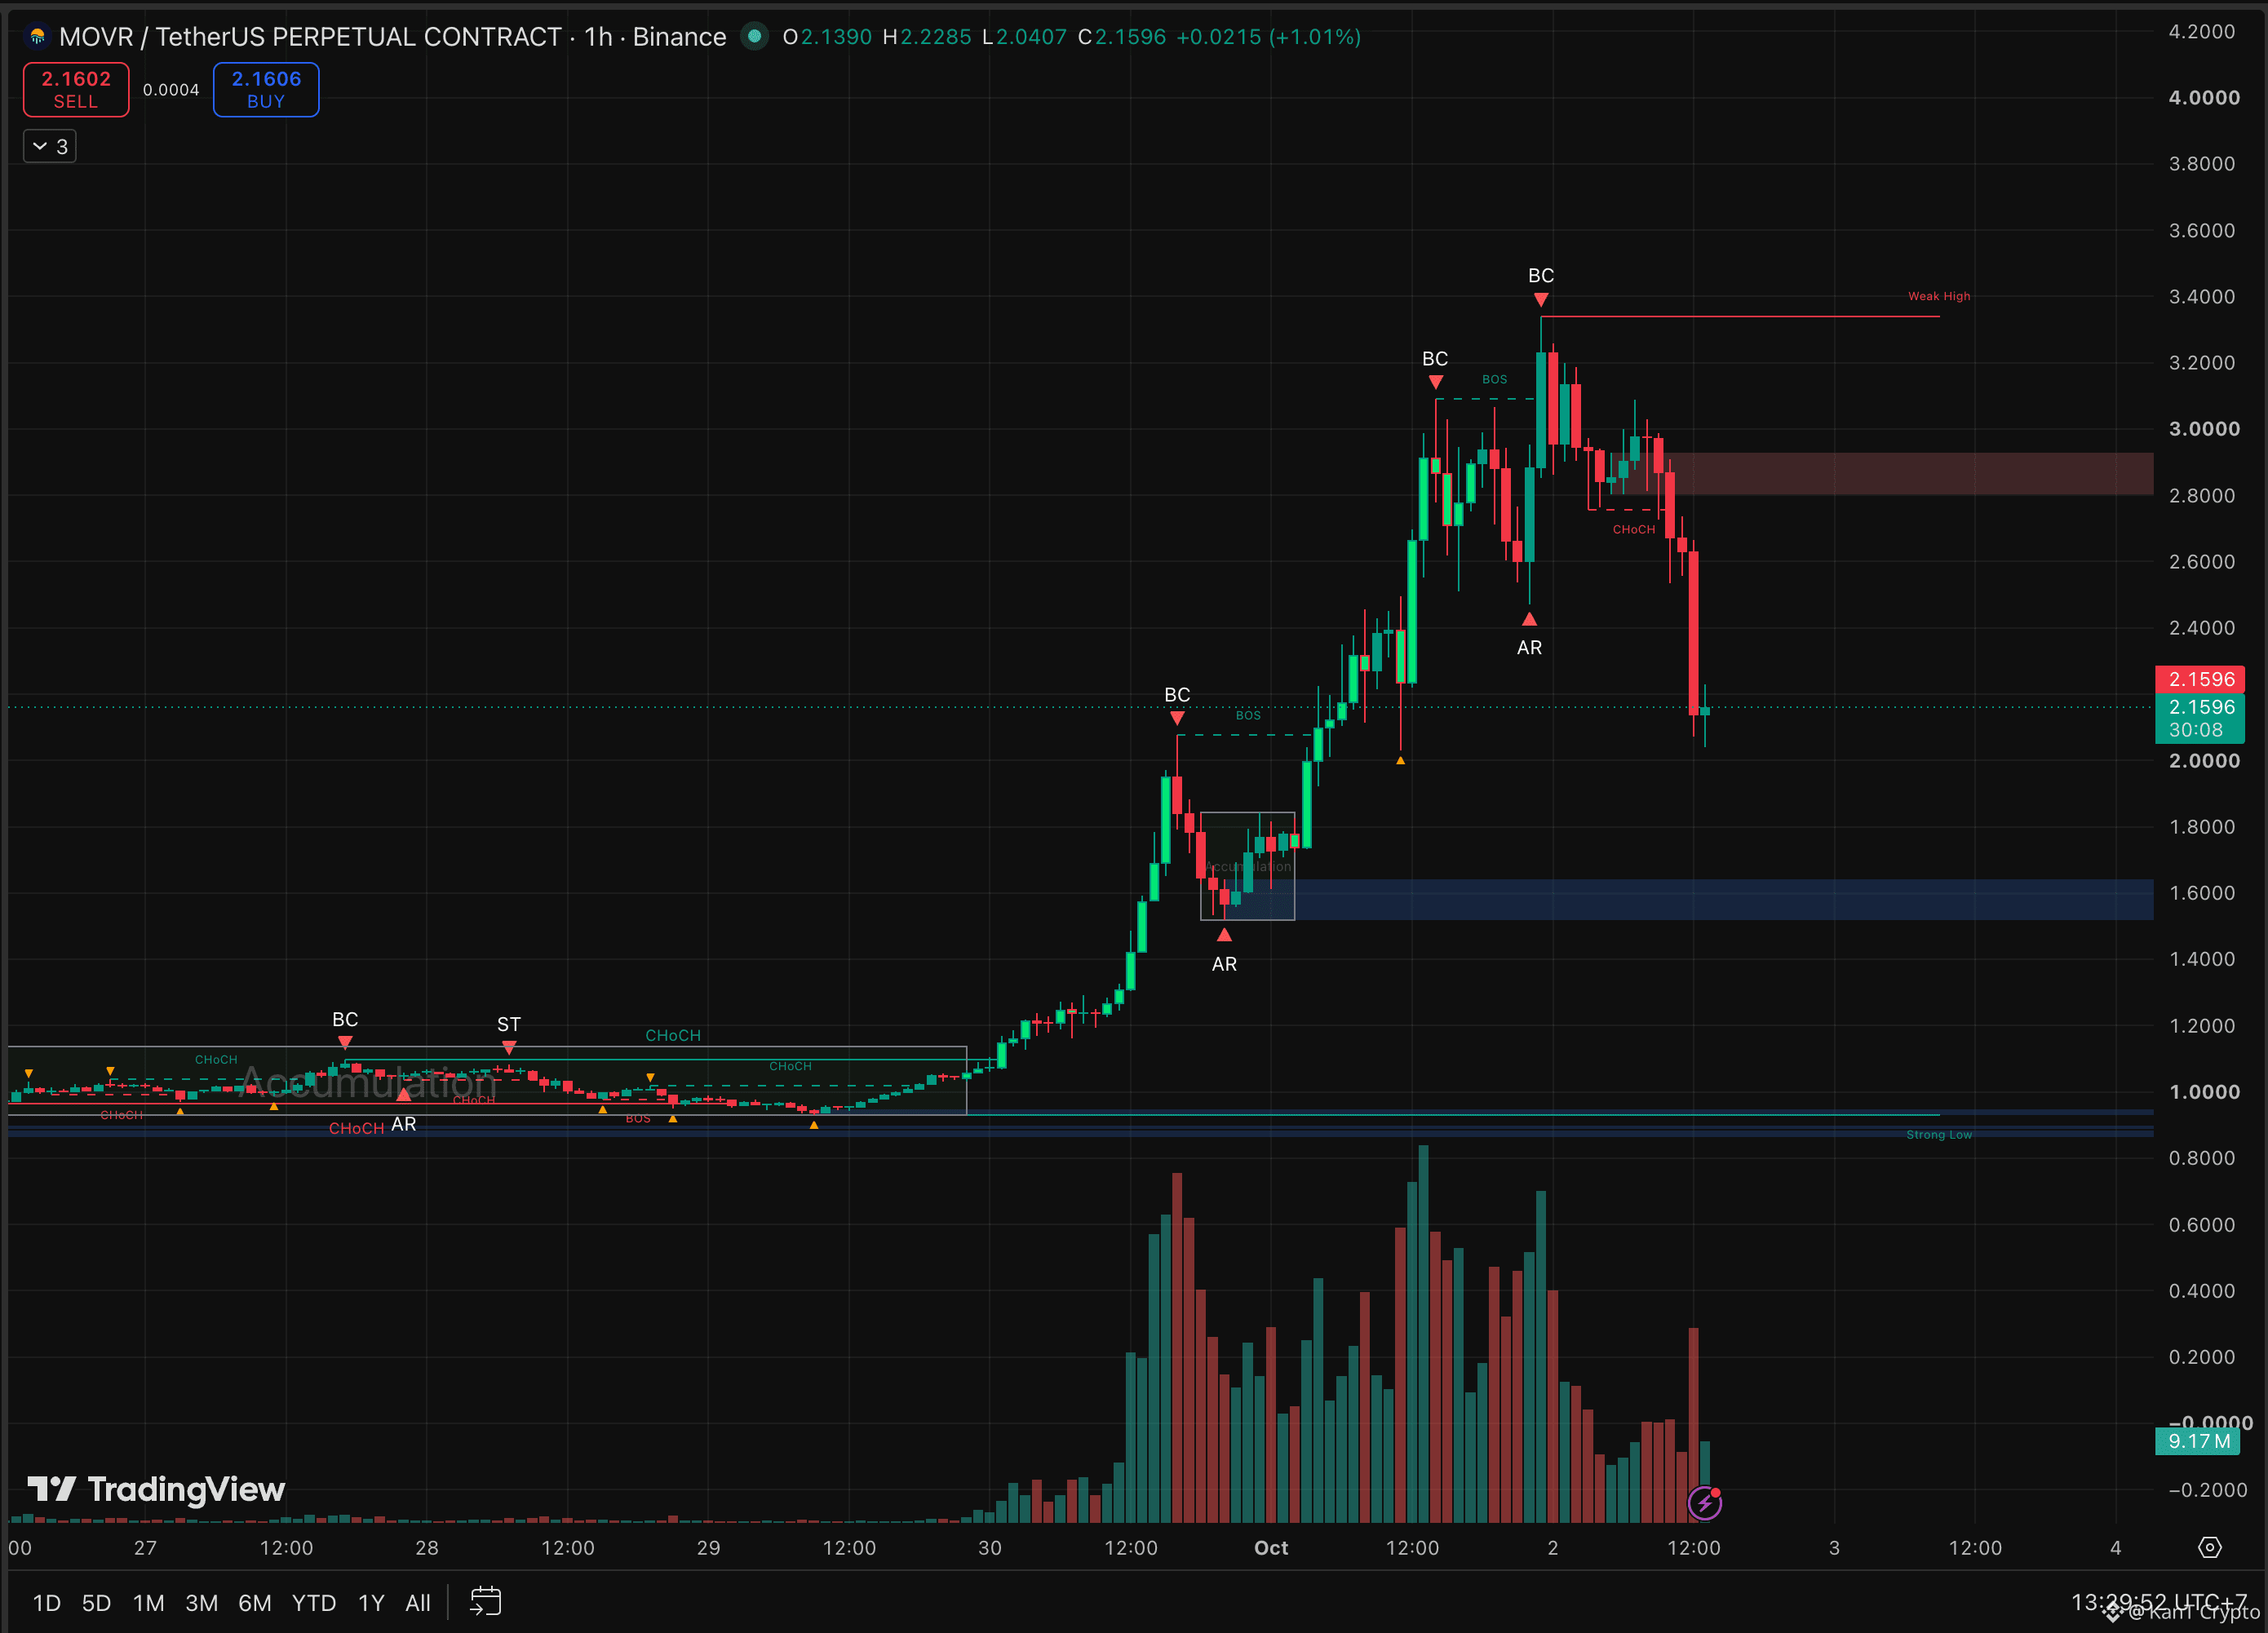
Since our last post at $2.25:
Price cleared $2.45 and kept climbing all the way to $3.34, another 48%.
Then it printed a buying climax at the top, flipped structure lower near $2.75, and slid to $2.04.
About 39% off the peak at the low. Now $2.16.
For the record, both halves of last time's plan played out. Clearing $2.45 kept the trunk growing. Then price dipped under $2.10, the line we said would put the next shelf in play. 👀
If bulls have good news, it's this: today's $2.04 low landed almost exactly on the $2.03 swing low from yesterday's pullback. That level is holding, for now.
The bad news: every bounce since the top has been sold. The $2.80 to $2.94 zone is now supply, and the hourly chart is a clean staircase of lower highs.
The levels.
Hold $2.03 and MOVR can try to base here.
Lose it, and the $1.52 to $1.85 shelf, where the last leg up launched, is next.
Below that, the $1.00 to $1.13 base is where this whole tree was planted.
The catalyst is also behind us. The Base migration deadline passed on September 30, so from here price has to stand on demand alone.
Base at $2.03, or does the tree fall back to the shelf? 🔥
Not financial advice.
$MOVR
{future}(MOVRUSDT)
$龙虾
{future}(龙虾USDT)
$QNT
{future}(QNTUSDT)
🎄 MOVR's Christmas Tree Is Starting to Come Down
The trunk grew taller first. Now the descent has begun.
Since our last post at $2.25:
Price cleared $2.45 and kept climbing all the way to $3.34, another 48%.
Then it printed a buying climax at the top, flipped structure lower near $2.75, and slid to $2.04.
About 39% off the peak at the low. Now $2.16.
For the record, both halves of last time's plan played out. Clearing $2.45 kept the trunk growing. Then price dipped under $2.10, the line we said would put the next shelf in play. 👀
If bulls have good news, it's this: today's $2.04 low landed almost exactly on the $2.03 swing low from yesterday's pullback. That level is holding, for now.
The bad news: every bounce since the top has been sold. The $2.80 to $2.94 zone is now supply, and the hourly chart is a clean staircase of lower highs.
The levels.
Hold $2.03 and MOVR can try to base here.
Lose it, and the $1.52 to $1.85 shelf, where the last leg up launched, is next.
Below that, the $1.00 to $1.13 base is where this whole tree was planted.
The catalyst is also behind us. The Base migration deadline passed on September 30, so from here price has to stand on demand alone.
Base at $2.03, or does the tree fall back to the shelf? 🔥
Not financial advice.
$MOVR
$龙虾
$QNT
The trunk grew taller first. Now the descent has begun.
Since our last post at $2.25:
Price cleared $2.45 and kept climbing all the way to $3.34, another 48%.
Then it printed a buying climax at the top, flipped structure lower near $2.75, and slid to $2.04.
About 39% off the peak at the low. Now $2.16.
For the record, both halves of last time's plan played out. Clearing $2.45 kept the trunk growing. Then price dipped under $2.10, the line we said would put the next shelf in play. 👀
If bulls have good news, it's this: today's $2.04 low landed almost exactly on the $2.03 swing low from yesterday's pullback. That level is holding, for now.
The bad news: every bounce since the top has been sold. The $2.80 to $2.94 zone is now supply, and the hourly chart is a clean staircase of lower highs.
The levels.
Hold $2.03 and MOVR can try to base here.
Lose it, and the $1.52 to $1.85 shelf, where the last leg up launched, is next.
Below that, the $1.00 to $1.13 base is where this whole tree was planted.
The catalyst is also behind us. The Base migration deadline passed on September 30, so from here price has to stand on demand alone.
Base at $2.03, or does the tree fall back to the shelf? 🔥
Not financial advice.
$MOVR
$龙虾
$QNT
1
3.8k
·
--
Bearish
📉 ZEC Just Fell Out of Its Channel. Is the Rally Over?
For six weeks, one rising channel guided every leg of this run. This week, price dropped out of it.
The damage:
A double peak near $1,700 in late September.
A slide to about $1,300, more than 20% off the top.
And a $30 million outflow from Grayscale's ZEC ETF after weeks of inflows.
For the record: last week we said a break of the channel floor would signal the trend cooling hard. That just happened. 👀
But cooling isn't the same as over. Today's daily candle is up 3.65% to $1,384, pushing right back toward the broken trendline near $1,400 to $1,420. When price breaks a trendline, it often returns to test it from below. A rejection there confirms the break. A reclaim turns it into a shakeout.
The case for a reset: daily momentum is dead neutral, not stretched. One whale reportedly pulled about 24,700 ZEC off exchanges this past month. And NU7 still has dates ahead: testnet October 6, mainnet go/no-go October 20, activation November 5.
The case for a top: the channel is broken, ETF money just left, and two peaks near $1,700 both failed.
The levels.
Reclaim $1,420 and close back inside the channel, and bulls are back in charge.
Fail there, and $1,300, then $1,250, are next.
Below that sits the $1,090 to $1,160 zone where the last breakout launched.
Trendline breaks are warnings, not verdicts. Let the retest speak.
Reclaim the channel, or confirm the break? 🔥
Not financial advice.
$ZEC
{future}(ZECUSDT)
$BTC
{future}(BTCUSDT)
$US
{future}(USUSDT)
📉 ZEC Just Fell Out of Its Channel. Is the Rally Over?
For six weeks, one rising channel guided every leg of this run. This week, price dropped out of it.
The damage:
A double peak near $1,700 in late September.
A slide to about $1,300, more than 20% off the top.
And a $30 million outflow from Grayscale's ZEC ETF after weeks of inflows.
For the record: last week we said a break of the channel floor would signal the trend cooling hard. That just happened. 👀
But cooling isn't the same as over. Today's daily candle is up 3.65% to $1,384, pushing right back toward the broken trendline near $1,400 to $1,420. When price breaks a trendline, it often returns to test it from below. A rejection there confirms the break. A reclaim turns it into a shakeout.
The case for a reset: daily momentum is dead neutral, not stretched. One whale reportedly pulled about 24,700 ZEC off exchanges this past month. And NU7 still has dates ahead: testnet October 6, mainnet go/no-go October 20, activation November 5.
The case for a top: the channel is broken, ETF money just left, and two peaks near $1,700 both failed.
The levels.
Reclaim $1,420 and close back inside the channel, and bulls are back in charge.
Fail there, and $1,300, then $1,250, are next.
Below that sits the $1,090 to $1,160 zone where the last breakout launched.
Trendline breaks are warnings, not verdicts. Let the retest speak.
Reclaim the channel, or confirm the break? 🔥
Not financial advice.
$ZEC
$BTC
$US
For six weeks, one rising channel guided every leg of this run. This week, price dropped out of it.
The damage:
A double peak near $1,700 in late September.
A slide to about $1,300, more than 20% off the top.
And a $30 million outflow from Grayscale's ZEC ETF after weeks of inflows.
For the record: last week we said a break of the channel floor would signal the trend cooling hard. That just happened. 👀
But cooling isn't the same as over. Today's daily candle is up 3.65% to $1,384, pushing right back toward the broken trendline near $1,400 to $1,420. When price breaks a trendline, it often returns to test it from below. A rejection there confirms the break. A reclaim turns it into a shakeout.
The case for a reset: daily momentum is dead neutral, not stretched. One whale reportedly pulled about 24,700 ZEC off exchanges this past month. And NU7 still has dates ahead: testnet October 6, mainnet go/no-go October 20, activation November 5.
The case for a top: the channel is broken, ETF money just left, and two peaks near $1,700 both failed.
The levels.
Reclaim $1,420 and close back inside the channel, and bulls are back in charge.
Fail there, and $1,300, then $1,250, are next.
Below that sits the $1,090 to $1,160 zone where the last breakout launched.
Trendline breaks are warnings, not verdicts. Let the retest speak.
Reclaim the channel, or confirm the break? 🔥
Not financial advice.
$ZEC
$BTC
$US
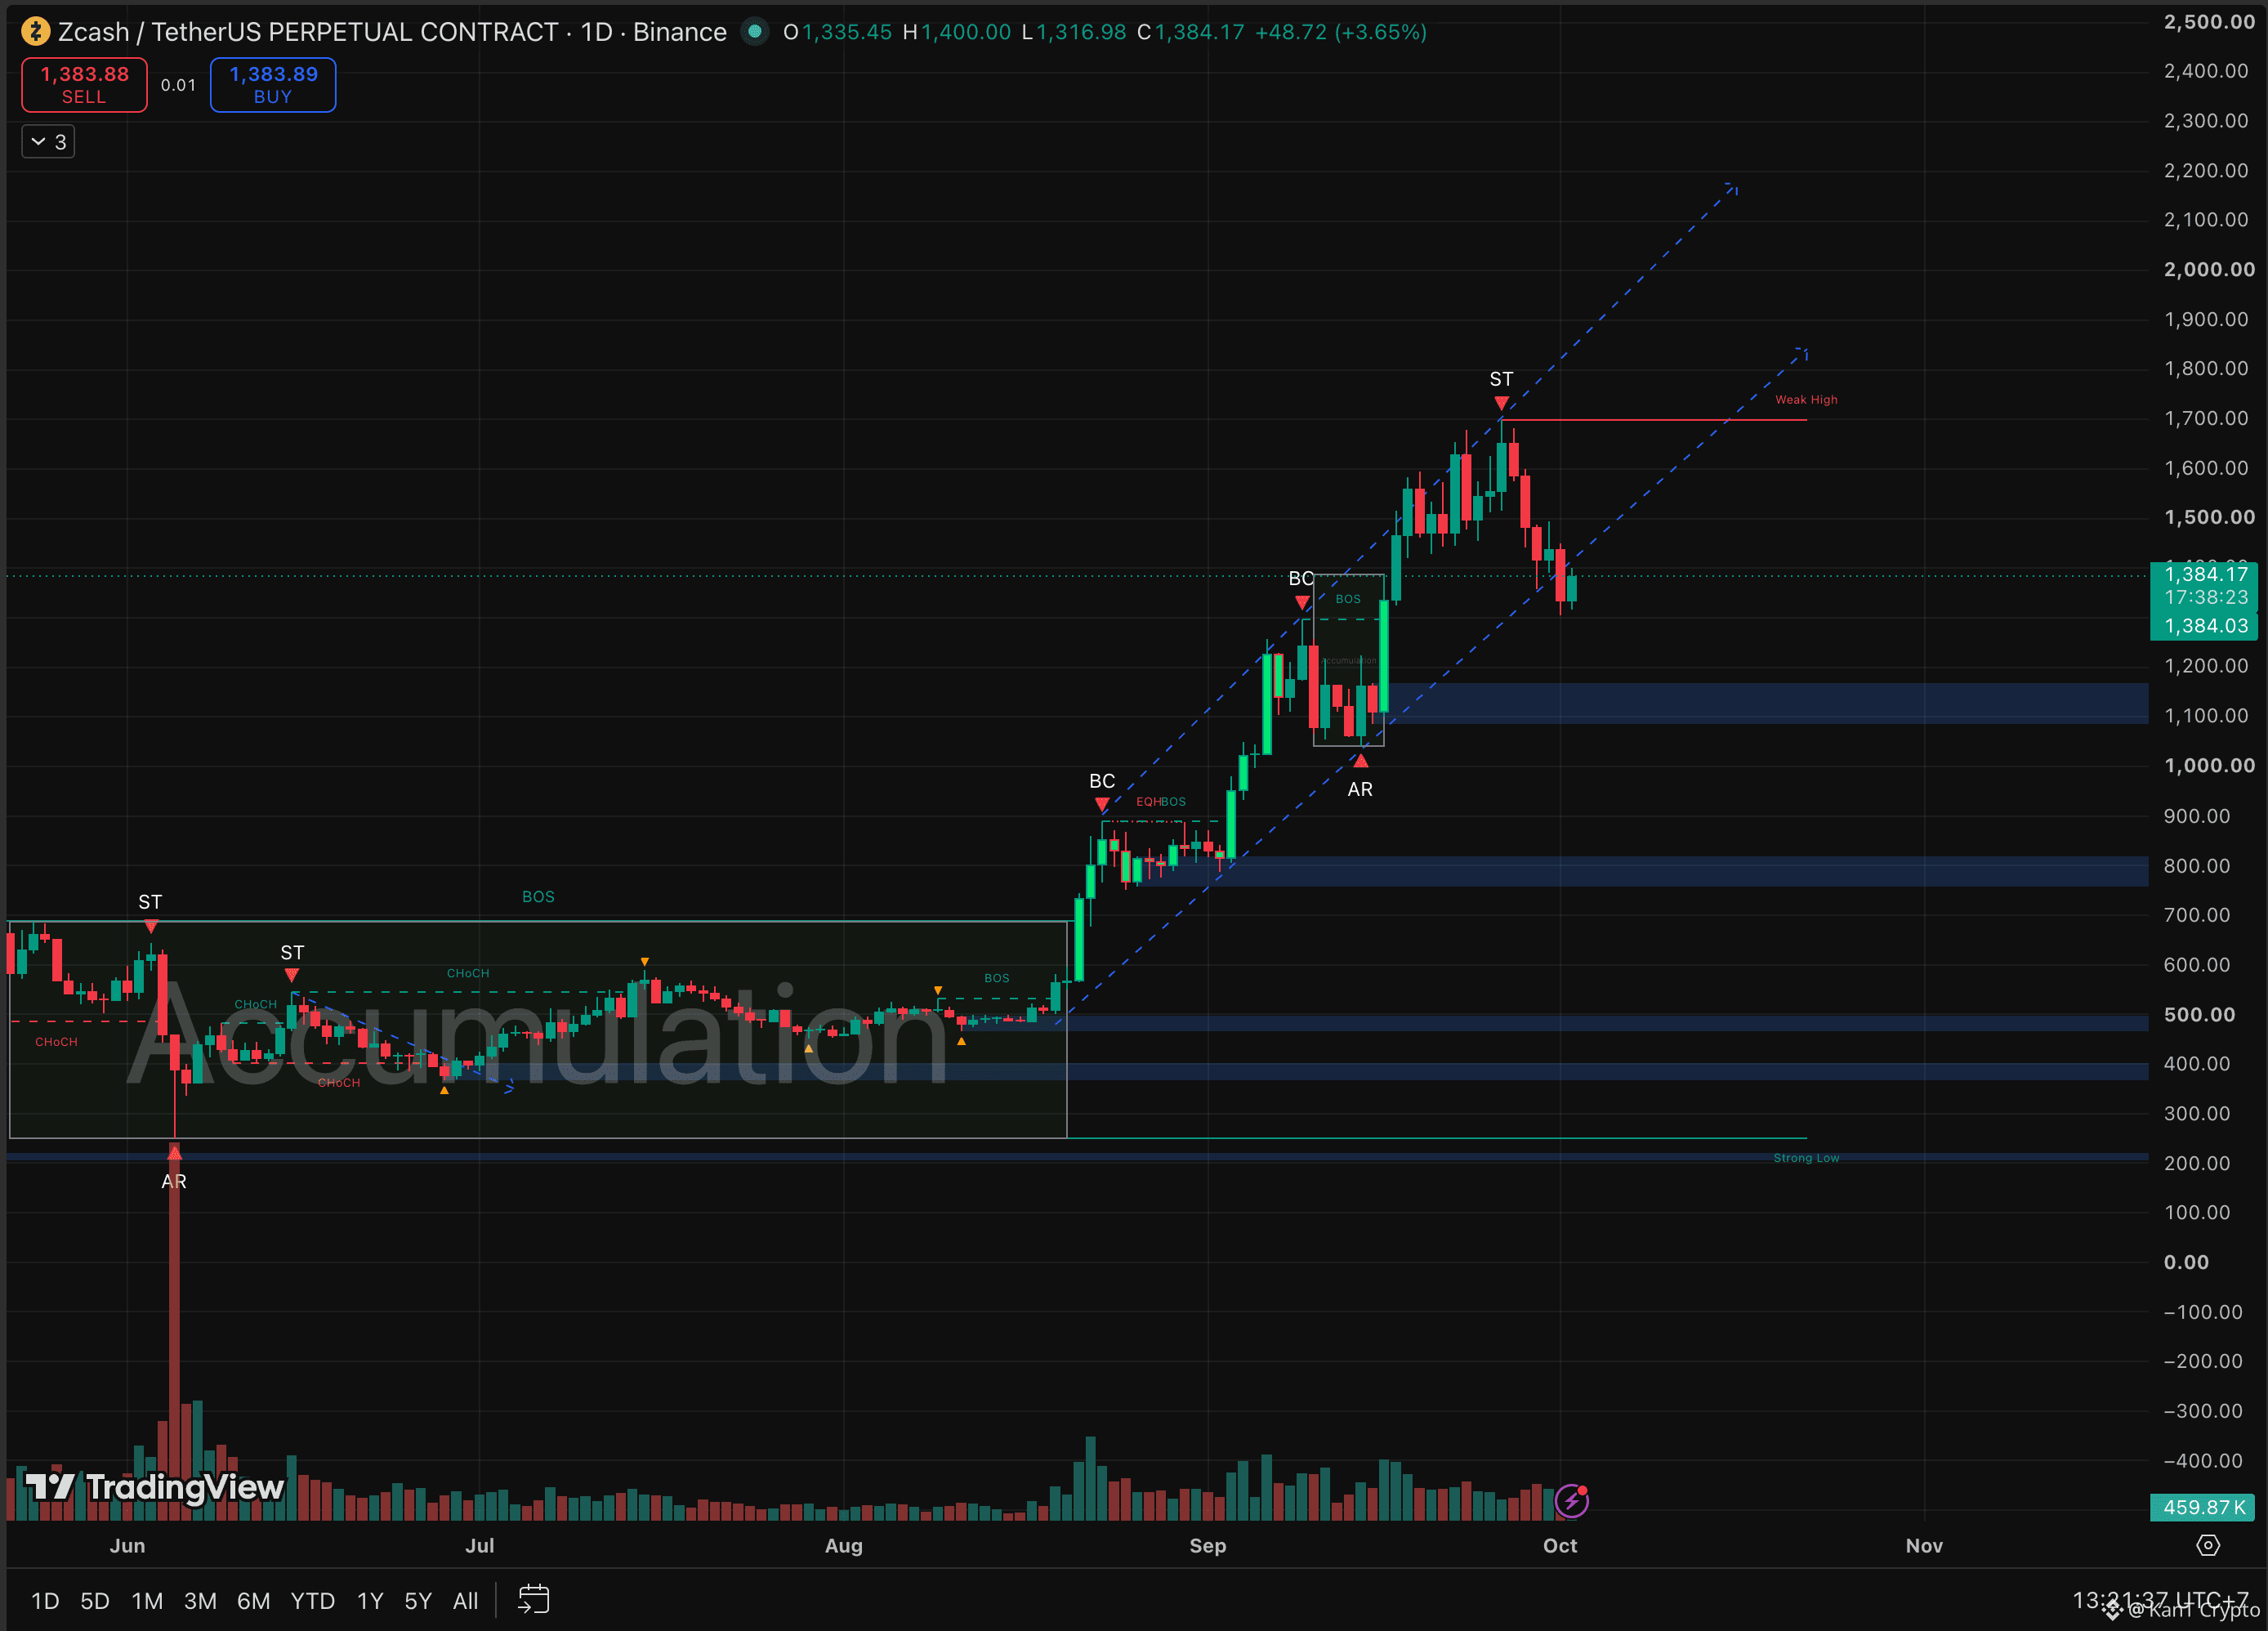
1
1.6k
·
--
Bullish
JUST IN: $110,000,000 worth of shorts liquidated from the crypto market in the past 10 minutes.
$BTC
{future}(BTCUSDT)
$ETH
{future}(ETHUSDT)
$龙虾
{future}(龙虾USDT)
JUST IN: $110,000,000 worth of shorts liquidated from the crypto market in the past 10 minutes.
$BTC
$ETH
$龙虾
$BTC
$ETH
$龙虾
1
1.7k
Log in to explore more content
Join global crypto users on Binance Square
⚡️ Get latest and useful information about crypto.
💬 Trusted by the world’s largest crypto exchange.
👍 Discover real insights from verified creators.
Email / Phone number
Trending Topics
FedMinutesFocusOnOctoberPause
212,442 views
1,439 Discussing
🚨 HIGH ALERT ‼️ PLEASE DON’T TRADE BLINDLY FOR THE NEXT HOUR 🚨
Guys, we have FOMC Minutes coming in less than 1 hour.
And after the kind of volatility we already saw today, I really don’t want anyone opening random high-leverage positions just before this release.
The biggest reaction I’m watching will be in Gold (XAU), Silver (XAG), BTC and ETH. Then coins like SOL and other highly leveraged mid/low-cap alts can exaggerate whatever move BTC makes.
Gold and Silver are especially sensitive tonight because the market is already reacting to the US dollar + Treasury yields, and both metals have been under heavy pressure ahead of the Fed minutes.
Briefly speaking
📉Hawkish Fed Minutes → Dollar/yields can push higher → pressure on BTC, crypto, Gold & silver
📈Dovish Fed Minutes → Dollar/yields can cool → BTC, Gold, Silver and risk assets can bounce hard.
And please remember the first candle can be a trap. We can get a pump, immediate dump, liquidations on both sides, and then the real direction.
So for now, protect your positions, reduce unnecessary leverage and don’t FOMO into the first move.
Tonight I’m watching $XAU , $XAG and $BTC first. These will tell us very quickly how the market is reading the Fed.
I will Update you guys on time
Follow @Panda Traders and Turn on Your notifications right now
#FedMinutesFocusOnOctoberPause
Panda Traders
·19 Likes
·4.3k views
BinanceLaunchesBinanceIntelligence
1.2M views
6,624 Discussing
EvernorthDelaysNasdaqDebutToOct12
19,401 views
337 Discussing