
WEB3韭菜小凯
439 Posts

WEB3韭菜小凯
Report
Block User
做韭菜就该认怂认怂,该跑路跑路
Occasional Trader
4.4 Years
30 Following
58 Followers
84 Liked
Posts
·
--

Article
A Three-Step Guide to Reading ETF Flows: November’s $3.47 Billion Outflow—What Does the Number Really Mean?In November, spot Bitcoin ETFs saw net outflows of $3.47 billion, with BlackRock’s IBIT alone accounting for $2.94 billion. But if you look only at the total, you might get the trend backwards. As a crypto veteran, I’m breaking down a three-step method for reading fund flows today, so you won’t be spooked by single-day figures again.
First, some background: U.S. spot Bitcoin ETF flows are reported after the market closes each day, and you can check free summaries on Farside and SoSoValue. Net inflows mean more money is going in through creations than coming out through redemptions, reflecting regulated flows from institutions and large investors.
Step one: look at the total, but pay even more attention to the number of days. In the first 14 trading days of November, there were outflows on 12 days, totaling $3.47 billion. The number of days shows this was sustained selling pressure, not a one-day flash crash.
A Three-Step Guide to Reading ETF Flows: November’s $3.47 Billion Outflow—What Does the Number Really Mean?
In November, spot Bitcoin ETFs saw net outflows of $3.47 billion, with BlackRock’s IBIT alone accounting for $2.94 billion. But if you look only at the total, you might get the trend backwards. As a crypto veteran, I’m breaking down a three-step method for reading fund flows today, so you won’t be spooked by single-day figures again.
First, some background: U.S. spot Bitcoin ETF flows are reported after the market closes each day, and you can check free summaries on Farside and SoSoValue. Net inflows mean more money is going in through creations than coming out through redemptions, reflecting regulated flows from institutions and large investors.
Step one: look at the total, but pay even more attention to the number of days. In the first 14 trading days of November, there were outflows on 12 days, totaling $3.47 billion. The number of days shows this was sustained selling pressure, not a one-day flash crash.
First, some background: U.S. spot Bitcoin ETF flows are reported after the market closes each day, and you can check free summaries on Farside and SoSoValue. Net inflows mean more money is going in through creations than coming out through redemptions, reflecting regulated flows from institutions and large investors.
Step one: look at the total, but pay even more attention to the number of days. In the first 14 trading days of November, there were outflows on 12 days, totaling $3.47 billion. The number of days shows this was sustained selling pressure, not a one-day flash crash.
1
·
--
USDT traded $69 billion in a single day—$17.6 billion more than Bitcoin’s $51.4 billion. Those numbers left me stunned.
While I was writing this, USDT’s 24-hour trading volume was $69.04 billion, and USDC’s was $19.25 billion. Together, that’s $88.3 billion—1.7 times Bitcoin’s trading volume. Put simply, people aren’t buying crypto; they’re lining up to switch into stablecoins and lie low. When panic sets in, even traders need to find a safe harbor first.
Do you hold more crypto or more U right now? Be honest.
—— Web3 retail investor Xiaokai
Disclaimer: The views above are personal and do not constitute investment advice. Investing involves risk; please exercise caution.
#USDT #Market Sentiment
USDT traded $69 billion in a single day—$17.6 billion more than Bitcoin’s $51.4 billion. Those numbers left me stunned.
While I was writing this, USDT’s 24-hour trading volume was $69.04 billion, and USDC’s was $19.25 billion. Together, that’s $88.3 billion—1.7 times Bitcoin’s trading volume. Put simply, people aren’t buying crypto; they’re lining up to switch into stablecoins and lie low. When panic sets in, even traders need to find a safe harbor first.
Do you hold more crypto or more U right now? Be honest.
—— Web3 retail investor Xiaokai
Disclaimer: The views above are personal and do not constitute investment advice. Investing involves risk; please exercise caution.
#USDT #Market Sentiment
While I was writing this, USDT’s 24-hour trading volume was $69.04 billion, and USDC’s was $19.25 billion. Together, that’s $88.3 billion—1.7 times Bitcoin’s trading volume. Put simply, people aren’t buying crypto; they’re lining up to switch into stablecoins and lie low. When panic sets in, even traders need to find a safe harbor first.
Do you hold more crypto or more U right now? Be honest.
—— Web3 retail investor Xiaokai
Disclaimer: The views above are personal and do not constitute investment advice. Investing involves risk; please exercise caution.
#USDT #Market Sentiment
448
·
--
UNI fell 13.4% in one day and 22.8% in seven days. Even the DEX leader couldn’t hold up.
At the time of writing, UNI was at $4.35. Uniswap is the decentralized exchange with the highest on-chain trading volume, yet its price has fallen nearly 8 percentage points more than Bitcoin’s over the past seven days. Put simply, high trading volume doesn’t mean a token’s price is resilient. Lots of users and a rising token price are two different things. I’ve already paid the price for learning that lesson, so you don’t have to.
If even the DEX leader has fallen this far, do you still believe application tokens are more resistant to downturns?
—— Web3 retail investor Xiao Kai
Disclaimer: The above content represents only personal opinions and does not constitute investment advice. Investing involves risks; proceed with caution.
#UNI #DeFi
UNI fell 13.4% in one day and 22.8% in seven days. Even the DEX leader couldn’t hold up.
At the time of writing, UNI was at $4.35. Uniswap is the decentralized exchange with the highest on-chain trading volume, yet its price has fallen nearly 8 percentage points more than Bitcoin’s over the past seven days. Put simply, high trading volume doesn’t mean a token’s price is resilient. Lots of users and a rising token price are two different things. I’ve already paid the price for learning that lesson, so you don’t have to.
If even the DEX leader has fallen this far, do you still believe application tokens are more resistant to downturns?
—— Web3 retail investor Xiao Kai
Disclaimer: The above content represents only personal opinions and does not constitute investment advice. Investing involves risks; proceed with caution.
#UNI #DeFi
At the time of writing, UNI was at $4.35. Uniswap is the decentralized exchange with the highest on-chain trading volume, yet its price has fallen nearly 8 percentage points more than Bitcoin’s over the past seven days. Put simply, high trading volume doesn’t mean a token’s price is resilient. Lots of users and a rising token price are two different things. I’ve already paid the price for learning that lesson, so you don’t have to.
If even the DEX leader has fallen this far, do you still believe application tokens are more resistant to downturns?
—— Web3 retail investor Xiao Kai
Disclaimer: The above content represents only personal opinions and does not constitute investment advice. Investing involves risks; proceed with caution.
#UNI #DeFi
149
·
--
NEAR fell 13.7% in one day. As a veteran crypto bagholder, I’ve realized that established public blockchains can fall just as hard as new coins.
As I write this, NEAR is at $2.82, down 18.1% over 7 days, with a market cap of $3.7 billion. NEAR launched back in 2020, and it has no shortage of tech or ecosystem—but its 7-day decline has exceeded Bitcoin’s 15.0% and SOL’s 13.6%. Put simply, there are no safe havens in a bear market: established projects can still play catch-up on the way down.
Between established public blockchains and new coins, which do you think will stop bleeding first this time around?
— Web3 Bagholder Xiao Kai
Disclaimer: The views expressed above are personal and do not constitute investment advice. Investing involves risk; please exercise caution.
#NEAR #Altcoins
NEAR fell 13.7% in one day. As a veteran crypto bagholder, I’ve realized that established public blockchains can fall just as hard as new coins.
As I write this, NEAR is at $2.82, down 18.1% over 7 days, with a market cap of $3.7 billion. NEAR launched back in 2020, and it has no shortage of tech or ecosystem—but its 7-day decline has exceeded Bitcoin’s 15.0% and SOL’s 13.6%. Put simply, there are no safe havens in a bear market: established projects can still play catch-up on the way down.
Between established public blockchains and new coins, which do you think will stop bleeding first this time around?
— Web3 Bagholder Xiao Kai
Disclaimer: The views expressed above are personal and do not constitute investment advice. Investing involves risk; please exercise caution.
#NEAR #Altcoins
As I write this, NEAR is at $2.82, down 18.1% over 7 days, with a market cap of $3.7 billion. NEAR launched back in 2020, and it has no shortage of tech or ecosystem—but its 7-day decline has exceeded Bitcoin’s 15.0% and SOL’s 13.6%. Put simply, there are no safe havens in a bear market: established projects can still play catch-up on the way down.
Between established public blockchains and new coins, which do you think will stop bleeding first this time around?
— Web3 Bagholder Xiao Kai
Disclaimer: The views expressed above are personal and do not constitute investment advice. Investing involves risk; please exercise caution.
#NEAR #Altcoins
90
·
--
AKE fell 38% in one day, and it’s now down 95.6% from its peak. I’ve paid this tuition for you before—I’ve chased coins like this myself.
While I was writing this, AKE was at $0.0064, with a market cap of $147 million and 24-hour trading volume of $197 million. That’s 34% more than its entire market cap in a single day. In plain English, it’s all short-term traders chopping each other up; nobody really plans to hold. Akedo is a project focused on AI game creation, and the product is still there—but the token price has already told the whole story.
Would you dare touch a coin whose daily trading volume exceeds its market cap, or would you just watch from the sidelines?
— Web3 Leek Xiao Kai
Disclaimer: The above content reflects only my personal views and does not constitute investment advice. Investing involves risks; please exercise caution.
#AKE #Altcoins
AKE fell 38% in one day, and it’s now down 95.6% from its peak. I’ve paid this tuition for you before—I’ve chased coins like this myself.
While I was writing this, AKE was at $0.0064, with a market cap of $147 million and 24-hour trading volume of $197 million. That’s 34% more than its entire market cap in a single day. In plain English, it’s all short-term traders chopping each other up; nobody really plans to hold. Akedo is a project focused on AI game creation, and the product is still there—but the token price has already told the whole story.
Would you dare touch a coin whose daily trading volume exceeds its market cap, or would you just watch from the sidelines?
— Web3 Leek Xiao Kai
Disclaimer: The above content reflects only my personal views and does not constitute investment advice. Investing involves risks; please exercise caution.
#AKE #Altcoins
While I was writing this, AKE was at $0.0064, with a market cap of $147 million and 24-hour trading volume of $197 million. That’s 34% more than its entire market cap in a single day. In plain English, it’s all short-term traders chopping each other up; nobody really plans to hold. Akedo is a project focused on AI game creation, and the product is still there—but the token price has already told the whole story.
Would you dare touch a coin whose daily trading volume exceeds its market cap, or would you just watch from the sidelines?
— Web3 Leek Xiao Kai
Disclaimer: The above content reflects only my personal views and does not constitute investment advice. Investing involves risks; please exercise caution.
#AKE #Altcoins
143
·
--
As a crypto veteran, I was watching ETH fall below $1,600 tonight, and my heart skipped a beat.
While writing this, ETH was at $1,594.56, down 10.2% in 24 hours and 16.2% over 7 days. Bitcoin was only down 15.0% over 7 days. The runner-up is falling harder than the top dog, with $17.48 billion in 24-hour trading volume and sellers showing no mercy. In plain English, this isn’t a rotation this time—the whole market is getting drained, and even the second-largest coin hasn’t been spared.
What do you think: will ETH hit $1,800 first, or break below $1,500?
— Web3 crypto veteran Xiao Kai
Disclaimer: The above content represents personal opinions only and does not constitute investment advice. Investing involves risk; please exercise caution.
#ETH #Ethereum
As a crypto veteran, I was watching ETH fall below $1,600 tonight, and my heart skipped a beat.
While writing this, ETH was at $1,594.56, down 10.2% in 24 hours and 16.2% over 7 days. Bitcoin was only down 15.0% over 7 days. The runner-up is falling harder than the top dog, with $17.48 billion in 24-hour trading volume and sellers showing no mercy. In plain English, this isn’t a rotation this time—the whole market is getting drained, and even the second-largest coin hasn’t been spared.
What do you think: will ETH hit $1,800 first, or break below $1,500?
— Web3 crypto veteran Xiao Kai
Disclaimer: The above content represents personal opinions only and does not constitute investment advice. Investing involves risk; please exercise caution.
#ETH #Ethereum
While writing this, ETH was at $1,594.56, down 10.2% in 24 hours and 16.2% over 7 days. Bitcoin was only down 15.0% over 7 days. The runner-up is falling harder than the top dog, with $17.48 billion in 24-hour trading volume and sellers showing no mercy. In plain English, this isn’t a rotation this time—the whole market is getting drained, and even the second-largest coin hasn’t been spared.
What do you think: will ETH hit $1,800 first, or break below $1,500?
— Web3 crypto veteran Xiao Kai
Disclaimer: The above content represents personal opinions only and does not constitute investment advice. Investing involves risk; please exercise caution.
#ETH #Ethereum
596
·
--

Article
After $60,000 breaks, what levels are left on the map? $57,717 is the next hurdle$60,000 is gone. The next level isn’t a guess—it’s marked right there on the map.
As a seasoned crypto trader, I used to panic whenever Bitcoin broke below a round-number level. Later, I realized that after a level breaks, what really matters are the lows left behind—places where people placed orders and lost money. Those memories hold firmer than round numbers.
As I write, Bitcoin is at $58,897, down 6.7% over the past 24 hours, with $48.6 billion in 24-hour trading volume. It dipped to a low of $58,678 during Friday’s session, breaking below the July 2 low of $59,520.
Count the levels on the map one by one. The first is $57,717, the low from July 1. It’s less than $1,200 away, and we could hit it tonight. The second is the round-number level of $55,000; you don’t need technical indicators to know there are buy orders waiting there. The resistance overhead is even clearer: mining costs are around $62,000, and the price has already fallen below that cost line. The 200-week moving average is around $68,000, and the price hasn’t climbed back above it since breaking below it the week of November 20.
After $60,000 breaks, what levels are left on the map? $57,717 is the next hurdle
$60,000 is gone. The next level isn’t a guess—it’s marked right there on the map.
As a seasoned crypto trader, I used to panic whenever Bitcoin broke below a round-number level. Later, I realized that after a level breaks, what really matters are the lows left behind—places where people placed orders and lost money. Those memories hold firmer than round numbers.
As I write, Bitcoin is at $58,897, down 6.7% over the past 24 hours, with $48.6 billion in 24-hour trading volume. It dipped to a low of $58,678 during Friday’s session, breaking below the July 2 low of $59,520.
Count the levels on the map one by one. The first is $57,717, the low from July 1. It’s less than $1,200 away, and we could hit it tonight. The second is the round-number level of $55,000; you don’t need technical indicators to know there are buy orders waiting there. The resistance overhead is even clearer: mining costs are around $62,000, and the price has already fallen below that cost line. The 200-week moving average is around $68,000, and the price hasn’t climbed back above it since breaking below it the week of November 20.
As a seasoned crypto trader, I used to panic whenever Bitcoin broke below a round-number level. Later, I realized that after a level breaks, what really matters are the lows left behind—places where people placed orders and lost money. Those memories hold firmer than round numbers.
As I write, Bitcoin is at $58,897, down 6.7% over the past 24 hours, with $48.6 billion in 24-hour trading volume. It dipped to a low of $58,678 during Friday’s session, breaking below the July 2 low of $59,520.
Count the levels on the map one by one. The first is $57,717, the low from July 1. It’s less than $1,200 away, and we could hit it tonight. The second is the round-number level of $55,000; you don’t need technical indicators to know there are buy orders waiting there. The resistance overhead is even clearer: mining costs are around $62,000, and the price has already fallen below that cost line. The 200-week moving average is around $68,000, and the price hasn’t climbed back above it since breaking below it the week of November 20.
606
·
--

Article
How to read on-chain data: three free places to check whether money is flowing in or outPrice is the result; on-chain data is the process. People who only look at price will always be half a step behind.
As an old crypto bagholder, I've already paid this tuition for you all. Before, I only watched price rises and falls—chasing when it went up, panicking when it went down. Later I realized the money on-chain had already moved, and price was just late to the party. Tonight's drop is an example: the data changed first, and price followed later.
First, look at exchange net inflows. Open CoinGlass or CryptoQuant and check the exchange net inflow number. When a large amount of coins flows into exchanges, it usually means people want to sell; when a large amount flows out of exchanges into their own wallets, it usually means they want to hold. Look at the direction, not a single number. A little bit in one day doesn't count; only several consecutive days in the same direction count as a signal.
How to read on-chain data: three free places to check whether money is flowing in or out
Price is the result; on-chain data is the process. People who only look at price will always be half a step behind.
As an old crypto bagholder, I've already paid this tuition for you all. Before, I only watched price rises and falls—chasing when it went up, panicking when it went down. Later I realized the money on-chain had already moved, and price was just late to the party. Tonight's drop is an example: the data changed first, and price followed later.
First, look at exchange net inflows. Open CoinGlass or CryptoQuant and check the exchange net inflow number. When a large amount of coins flows into exchanges, it usually means people want to sell; when a large amount flows out of exchanges into their own wallets, it usually means they want to hold. Look at the direction, not a single number. A little bit in one day doesn't count; only several consecutive days in the same direction count as a signal.
As an old crypto bagholder, I've already paid this tuition for you all. Before, I only watched price rises and falls—chasing when it went up, panicking when it went down. Later I realized the money on-chain had already moved, and price was just late to the party. Tonight's drop is an example: the data changed first, and price followed later.
First, look at exchange net inflows. Open CoinGlass or CryptoQuant and check the exchange net inflow number. When a large amount of coins flows into exchanges, it usually means people want to sell; when a large amount flows out of exchanges into their own wallets, it usually means they want to hold. Look at the direction, not a single number. A little bit in one day doesn't count; only several consecutive days in the same direction count as a signal.
7
·
--
$THE The project team went to find his sister-in-law.
$THE The project team went to find his sister-in-law.
101
·
--

Article
Anthropic fell 9.9% on its second day as a public company, and Bitcoin followed, dropping below $60,000: This sell-off started in U.S. stocksThe source of this sell-off isn't in crypto itself—it's over in the U.S. stock market.
As a seasoned crypto investor, I used to think that when crypto fell, it was always due to something within crypto: leveraged positions getting liquidated, projects fleeing, or good news already being priced in. This time is different—the blame lies with the neighbors.
Anthropic listed on the Nasdaq on Thursday at an offering price of $83. It surged to an intraday high of $111.50 on its first day, up 34%, and closed at $97.17. On Friday, it fell 9.92%, closing at $87.54. That same day, the Nasdaq 100 fell 1.58%. In the first few minutes of U.S. trading, about $500 billion in market value evaporated. SanDisk fell 8.07%, Arm fell 6.41%, AMD fell 6.32%, and Micron fell 6.06%.
Anthropic fell 9.9% on its second day as a public company, and Bitcoin followed, dropping below $60,000: This sell-off started in U.S. stocks
The source of this sell-off isn't in crypto itself—it's over in the U.S. stock market.
As a seasoned crypto investor, I used to think that when crypto fell, it was always due to something within crypto: leveraged positions getting liquidated, projects fleeing, or good news already being priced in. This time is different—the blame lies with the neighbors.
Anthropic listed on the Nasdaq on Thursday at an offering price of $83. It surged to an intraday high of $111.50 on its first day, up 34%, and closed at $97.17. On Friday, it fell 9.92%, closing at $87.54. That same day, the Nasdaq 100 fell 1.58%. In the first few minutes of U.S. trading, about $500 billion in market value evaporated. SanDisk fell 8.07%, Arm fell 6.41%, AMD fell 6.32%, and Micron fell 6.06%.
As a seasoned crypto investor, I used to think that when crypto fell, it was always due to something within crypto: leveraged positions getting liquidated, projects fleeing, or good news already being priced in. This time is different—the blame lies with the neighbors.
Anthropic listed on the Nasdaq on Thursday at an offering price of $83. It surged to an intraday high of $111.50 on its first day, up 34%, and closed at $97.17. On Friday, it fell 9.92%, closing at $87.54. That same day, the Nasdaq 100 fell 1.58%. In the first few minutes of U.S. trading, about $500 billion in market value evaporated. SanDisk fell 8.07%, Arm fell 6.41%, AMD fell 6.32%, and Micron fell 6.06%.
473
·
--

Article
Altcoin Losses Tonight: ZEC Down 18%, TRX Just 2.5%The short version: tonight, it wasn’t just one coin that fell—it was the ones with the most leverage.
At the time of writing, Bitcoin was at $59,187, down 6.3% in 24 hours. Here’s the biggest-loss leaderboard: ZEC at $753, down 18.4% in a day and 43.4% in 30 days; HYPE at $61, down 11.1%; DOGE down 8.6%; XMR down 8.3%; ETH down 8.2%; BNB down 7.6%; XRP down 7.3%; SOL down 6.5%. TRX held up best, down just 2.5%, while LEO fell 1.4%.
The losses are clearly tiered. The ranking isn’t about whose fundamentals have deteriorated, but who had the most leverage. ZEC saw $14.07 million in liquidations in a day, 93% of them long positions. The biggest drops were where long positions were most crowded. HYPE fell 15.6% in a week; after Hong Kong’s warning, traders’ nerve went first. TRX and LEO had no major leverage story, so their losses were smaller. I’ve paid this tuition for you before: on big down days, the biggest-loss leaderboard is the leverage leaderboard.
Altcoin Losses Tonight: ZEC Down 18%, TRX Just 2.5%
The short version: tonight, it wasn’t just one coin that fell—it was the ones with the most leverage.
At the time of writing, Bitcoin was at $59,187, down 6.3% in 24 hours. Here’s the biggest-loss leaderboard: ZEC at $753, down 18.4% in a day and 43.4% in 30 days; HYPE at $61, down 11.1%; DOGE down 8.6%; XMR down 8.3%; ETH down 8.2%; BNB down 7.6%; XRP down 7.3%; SOL down 6.5%. TRX held up best, down just 2.5%, while LEO fell 1.4%.
The losses are clearly tiered. The ranking isn’t about whose fundamentals have deteriorated, but who had the most leverage. ZEC saw $14.07 million in liquidations in a day, 93% of them long positions. The biggest drops were where long positions were most crowded. HYPE fell 15.6% in a week; after Hong Kong’s warning, traders’ nerve went first. TRX and LEO had no major leverage story, so their losses were smaller. I’ve paid this tuition for you before: on big down days, the biggest-loss leaderboard is the leverage leaderboard.
At the time of writing, Bitcoin was at $59,187, down 6.3% in 24 hours. Here’s the biggest-loss leaderboard: ZEC at $753, down 18.4% in a day and 43.4% in 30 days; HYPE at $61, down 11.1%; DOGE down 8.6%; XMR down 8.3%; ETH down 8.2%; BNB down 7.6%; XRP down 7.3%; SOL down 6.5%. TRX held up best, down just 2.5%, while LEO fell 1.4%.
The losses are clearly tiered. The ranking isn’t about whose fundamentals have deteriorated, but who had the most leverage. ZEC saw $14.07 million in liquidations in a day, 93% of them long positions. The biggest drops were where long positions were most crowded. HYPE fell 15.6% in a week; after Hong Kong’s warning, traders’ nerve went first. TRX and LEO had no major leverage story, so their losses were smaller. I’ve paid this tuition for you before: on big down days, the biggest-loss leaderboard is the leverage leaderboard.
555
·
--

Article
Fear and Greed at 12: Day 8 of Extreme Fear—What Has This Number Meant Historically?Here’s the takeaway: the number 12 doesn’t tell you whether prices will rise or fall tomorrow. It just means that everyone in the market would rather sit tight.
The Fear and Greed Index is at 12 today: extreme fear. Yesterday it was 10, its lowest reading in 90 days. Last week it was 20, and a month ago it was 63. It has stayed in the extreme fear zone for 8 consecutive days. At the time of writing, Bitcoin is at $59,187, down 6.3% in 24 hours.
This index is published daily by alternative.me. It combines volatility, trading volume, social media, and search interest into a single score from 0 to 100.
As a seasoned crypto investor, the most counterintuitive thing is this figure: over the past year, the market was in extreme fear 44% of the time. Datawallet’s stats are even more direct: historically, when the index is in the extreme fear zone, it rises by an average of 1.7% after 30 days, but falls by an average of 4.4% after 90 days. The odds of it being up after 90 days are just 46%. In plain English, extreme fear isn’t a signal to buy. A lot of pessimism may already be priced in—but things can still get more pessimistic.
Fear and Greed at 12: Day 8 of Extreme Fear—What Has This Number Meant Historically?
Here’s the takeaway: the number 12 doesn’t tell you whether prices will rise or fall tomorrow. It just means that everyone in the market would rather sit tight.
The Fear and Greed Index is at 12 today: extreme fear. Yesterday it was 10, its lowest reading in 90 days. Last week it was 20, and a month ago it was 63. It has stayed in the extreme fear zone for 8 consecutive days. At the time of writing, Bitcoin is at $59,187, down 6.3% in 24 hours.
This index is published daily by alternative.me. It combines volatility, trading volume, social media, and search interest into a single score from 0 to 100.
As a seasoned crypto investor, the most counterintuitive thing is this figure: over the past year, the market was in extreme fear 44% of the time. Datawallet’s stats are even more direct: historically, when the index is in the extreme fear zone, it rises by an average of 1.7% after 30 days, but falls by an average of 4.4% after 90 days. The odds of it being up after 90 days are just 46%. In plain English, extreme fear isn’t a signal to buy. A lot of pessimism may already be priced in—but things can still get more pessimistic.
The Fear and Greed Index is at 12 today: extreme fear. Yesterday it was 10, its lowest reading in 90 days. Last week it was 20, and a month ago it was 63. It has stayed in the extreme fear zone for 8 consecutive days. At the time of writing, Bitcoin is at $59,187, down 6.3% in 24 hours.
This index is published daily by alternative.me. It combines volatility, trading volume, social media, and search interest into a single score from 0 to 100.
As a seasoned crypto investor, the most counterintuitive thing is this figure: over the past year, the market was in extreme fear 44% of the time. Datawallet’s stats are even more direct: historically, when the index is in the extreme fear zone, it rises by an average of 1.7% after 30 days, but falls by an average of 4.4% after 90 days. The odds of it being up after 90 days are just 46%. In plain English, extreme fear isn’t a signal to buy. A lot of pessimism may already be priced in—but things can still get more pessimistic.
465
·
--

Article
XMR1 Plunges 99% Overnight: A Wrapped Token’s Weak Spot Isn’t the Chain—it’s the DeployerWhen wrapped tokens run into trouble, it’s often not because the chain was compromised, but because the person holding the keys was.
On Friday, November 20, Wagyu’s wrapped Monero, XMR1, plunged from about $494 to $0.65 in 35 minutes—a drop of more than 99%. The attacker took 5.2 million XMR1 from the deployer’s wallet, dumped them on Hyperliquid, and cashed out about $13.22 million, then converted it into 7,467 ETH.
As a seasoned crypto trader, my first instinct was to see where the money went. Bitquery traced three transfers: between 04:46 and 05:16, two of 100,000 tokens each and one of 5 million. The receiving wallets had been created that same day, and the tokens were sold as soon as they arrived. The 363,800 tokens sold fetched about $13.5 million, with 388 accounts on the other side of the trades.
XMR1 Plunges 99% Overnight: A Wrapped Token’s Weak Spot Isn’t the Chain—it’s the Deployer
When wrapped tokens run into trouble, it’s often not because the chain was compromised, but because the person holding the keys was.
On Friday, November 20, Wagyu’s wrapped Monero, XMR1, plunged from about $494 to $0.65 in 35 minutes—a drop of more than 99%. The attacker took 5.2 million XMR1 from the deployer’s wallet, dumped them on Hyperliquid, and cashed out about $13.22 million, then converted it into 7,467 ETH.
As a seasoned crypto trader, my first instinct was to see where the money went. Bitquery traced three transfers: between 04:46 and 05:16, two of 100,000 tokens each and one of 5 million. The receiving wallets had been created that same day, and the tokens were sold as soon as they arrived. The 363,800 tokens sold fetched about $13.5 million, with 388 accounts on the other side of the trades.
On Friday, November 20, Wagyu’s wrapped Monero, XMR1, plunged from about $494 to $0.65 in 35 minutes—a drop of more than 99%. The attacker took 5.2 million XMR1 from the deployer’s wallet, dumped them on Hyperliquid, and cashed out about $13.22 million, then converted it into 7,467 ETH.
As a seasoned crypto trader, my first instinct was to see where the money went. Bitquery traced three transfers: between 04:46 and 05:16, two of 100,000 tokens each and one of 5 million. The receiving wallets had been created that same day, and the tokens were sold as soon as they arrived. The 363,800 tokens sold fetched about $13.5 million, with 388 accounts on the other side of the trades.
364
·
--

Article
Dollar Hits 19-Month High as Gold Falls 10% in a Week: Are Safe-Haven Assets Giving Way?Even safe-haven assets are giving way. This time, the sell-off isn’t driven by fear of risk—it’s a shortage of cash.
I’ve already paid the price for you: the easiest mistake to make in a bear market is thinking gold will always be a safe haven. This week’s data shattered that idea.
First, the dollar: the dollar index hit 103.97 on Thursday, a 19-month high, before retreating to around 103.75 on Friday. It rose because markets are almost certain the Fed will raise rates in December. At its October 28 meeting, the Fed held rates at 3.75% to 4%, with a 10–2 vote. Minutes from the November 18 meeting showed that almost all participants thought further rate hikes would be needed. Futures markets put the probability of a 25-basis-point hike in December at over 90%. The confirmation will come at the rate-setting meeting on December 8–9.
Dollar Hits 19-Month High as Gold Falls 10% in a Week: Are Safe-Haven Assets Giving Way?
Even safe-haven assets are giving way. This time, the sell-off isn’t driven by fear of risk—it’s a shortage of cash.
I’ve already paid the price for you: the easiest mistake to make in a bear market is thinking gold will always be a safe haven. This week’s data shattered that idea.
First, the dollar: the dollar index hit 103.97 on Thursday, a 19-month high, before retreating to around 103.75 on Friday. It rose because markets are almost certain the Fed will raise rates in December. At its October 28 meeting, the Fed held rates at 3.75% to 4%, with a 10–2 vote. Minutes from the November 18 meeting showed that almost all participants thought further rate hikes would be needed. Futures markets put the probability of a 25-basis-point hike in December at over 90%. The confirmation will come at the rate-setting meeting on December 8–9.
I’ve already paid the price for you: the easiest mistake to make in a bear market is thinking gold will always be a safe haven. This week’s data shattered that idea.
First, the dollar: the dollar index hit 103.97 on Thursday, a 19-month high, before retreating to around 103.75 on Friday. It rose because markets are almost certain the Fed will raise rates in December. At its October 28 meeting, the Fed held rates at 3.75% to 4%, with a 10–2 vote. Minutes from the November 18 meeting showed that almost all participants thought further rate hikes would be needed. Futures markets put the probability of a 25-basis-point hike in December at over 90%. The confirmation will come at the rate-setting meeting on December 8–9.
118
·
--

Article
HYPE Falls 8.8% in a Day: What’s Going On After Hong Kong’s Warning?HYPE fell 8.8% in a day. The regulatory hammer hasn’t fallen yet, but leverage has already pulled the trigger.
As a seasoned crypto trader, let’s start with the numbers: HYPE is currently at $61.69, down 8.8% in 24 hours and 16.6% over seven days. It’s down 37% from its September 23 high of $97.96—worse than Bitcoin’s 6% and Ethereum’s 7.9% drops today.
Background: On November 18, Hong Kong’s Securities and Futures Commission added Hyperliquid’s trading website to its alert list of suspicious platforms, citing its lack of a license. This was only a warning, not a shutdown order. After the news broke, HYPE fell just about 4%, then bounced back to around $69. It’s only today that it has dropped along with the broader market.
HYPE Falls 8.8% in a Day: What’s Going On After Hong Kong’s Warning?
HYPE fell 8.8% in a day. The regulatory hammer hasn’t fallen yet, but leverage has already pulled the trigger.
As a seasoned crypto trader, let’s start with the numbers: HYPE is currently at $61.69, down 8.8% in 24 hours and 16.6% over seven days. It’s down 37% from its September 23 high of $97.96—worse than Bitcoin’s 6% and Ethereum’s 7.9% drops today.
Background: On November 18, Hong Kong’s Securities and Futures Commission added Hyperliquid’s trading website to its alert list of suspicious platforms, citing its lack of a license. This was only a warning, not a shutdown order. After the news broke, HYPE fell just about 4%, then bounced back to around $69. It’s only today that it has dropped along with the broader market.
As a seasoned crypto trader, let’s start with the numbers: HYPE is currently at $61.69, down 8.8% in 24 hours and 16.6% over seven days. It’s down 37% from its September 23 high of $97.96—worse than Bitcoin’s 6% and Ethereum’s 7.9% drops today.
Background: On November 18, Hong Kong’s Securities and Futures Commission added Hyperliquid’s trading website to its alert list of suspicious platforms, citing its lack of a license. This was only a warning, not a shutdown order. After the news broke, HYPE fell just about 4%, then bounced back to around $69. It’s only today that it has dropped along with the broader market.
243
·
--

Article
How to Read the Unlock Calendar: Check These Three Numbers Before the Next UnlockDon’t just focus on the price. Start with the unlock calendar: before the next unlock, check these three numbers.
Put simply, the unlock itself isn’t scary; what’s scary is not understanding it. Just this week, more than $113 million worth of tokens are lined up to be unlocked, with about $64 million worth today alone.
The first number: how much is being unlocked? Today, TA, ARIA, PLUME, and AKE are set to unlock a combined total of about $64 million. Yesterday, LayerZero unlocked 23.28 million ZRO, worth about $30 million.
The second number: what share of the market cap does the unlock represent? This is the easiest thing to overlook. From November 24 to 25, Monad is set to unlock 16.61 billion MON, worth about $225.5 million at the current price—equivalent to 1.4 times its entire market cap. The tokens released in a single unlock are 40% more than the entire market cap.
How to Read the Unlock Calendar: Check These Three Numbers Before the Next Unlock
Don’t just focus on the price. Start with the unlock calendar: before the next unlock, check these three numbers.
Put simply, the unlock itself isn’t scary; what’s scary is not understanding it. Just this week, more than $113 million worth of tokens are lined up to be unlocked, with about $64 million worth today alone.
The first number: how much is being unlocked? Today, TA, ARIA, PLUME, and AKE are set to unlock a combined total of about $64 million. Yesterday, LayerZero unlocked 23.28 million ZRO, worth about $30 million.
The second number: what share of the market cap does the unlock represent? This is the easiest thing to overlook. From November 24 to 25, Monad is set to unlock 16.61 billion MON, worth about $225.5 million at the current price—equivalent to 1.4 times its entire market cap. The tokens released in a single unlock are 40% more than the entire market cap.
Put simply, the unlock itself isn’t scary; what’s scary is not understanding it. Just this week, more than $113 million worth of tokens are lined up to be unlocked, with about $64 million worth today alone.
The first number: how much is being unlocked? Today, TA, ARIA, PLUME, and AKE are set to unlock a combined total of about $64 million. Yesterday, LayerZero unlocked 23.28 million ZRO, worth about $30 million.
The second number: what share of the market cap does the unlock represent? This is the easiest thing to overlook. From November 24 to 25, Monad is set to unlock 16.61 billion MON, worth about $225.5 million at the current price—equivalent to 1.4 times its entire market cap. The tokens released in a single unlock are 40% more than the entire market cap.
175
·
--

Article
A Beginner’s First Crash: How Do Liquidations Happen?Tonight, $1.7 billion worth of positions were liquidated, 80% of them longs. Behind that figure is one thing: liquidations don’t happen all at once overnight—they cascade, one link setting off the next.
Put simply, liquidations are contagious.
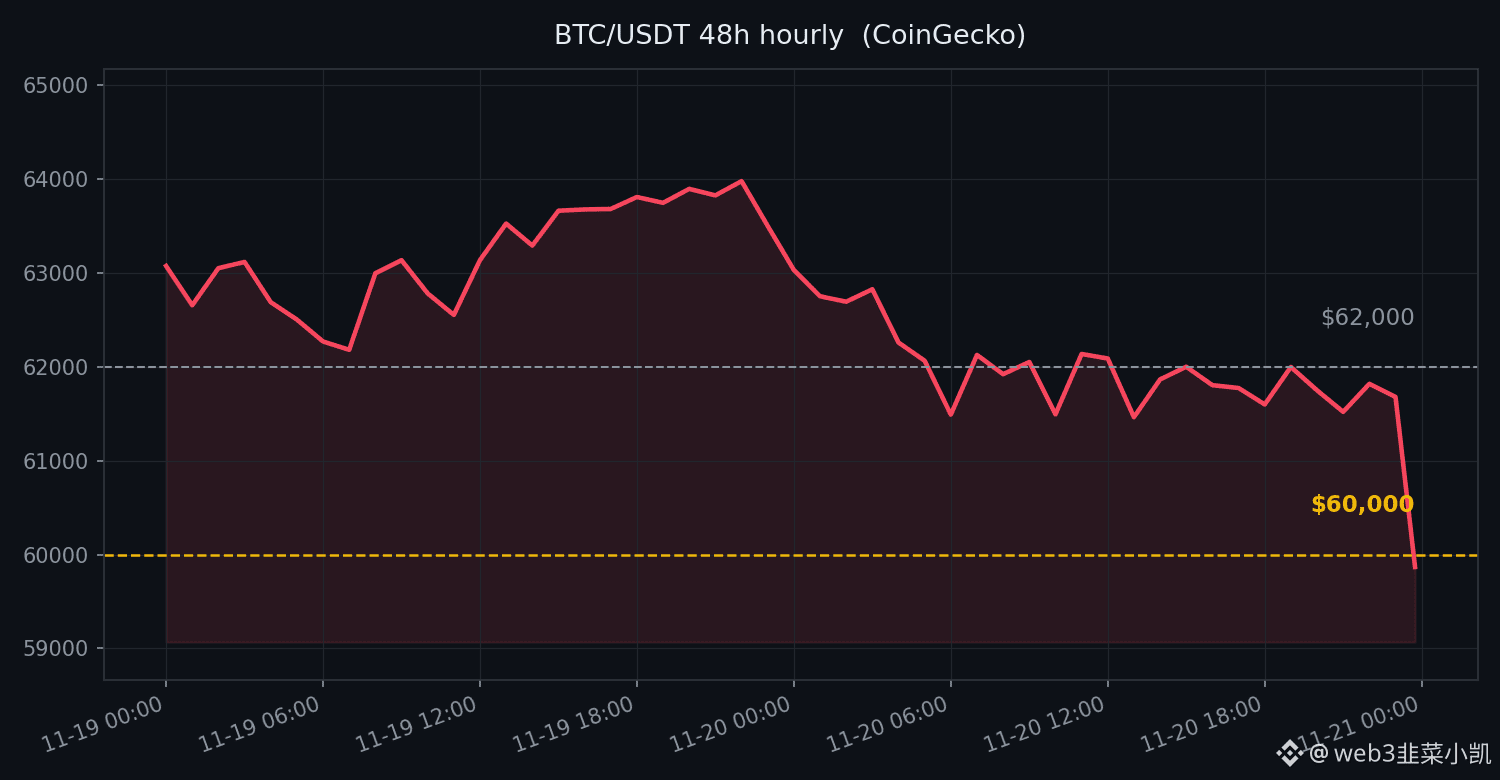
First link: Someone used leverage to go long, thinking the price had fallen enough and had hit bottom. Second link: The price kept falling, and they ran out of margin. The exchange forcibly closed their position, selling at market price. Third link: That sale pushed the price down a little further, reaching the liquidation price of the next trader. Fourth link: The next trader was liquidated too, triggering more selling. And so it went, link after link, pushing Bitcoin from $62,000 to below $60,000 tonight.
A Beginner’s First Crash: How Do Liquidations Happen?
Tonight, $1.7 billion worth of positions were liquidated, 80% of them longs. Behind that figure is one thing: liquidations don’t happen all at once overnight—they cascade, one link setting off the next.
Put simply, liquidations are contagious.
First link: Someone used leverage to go long, thinking the price had fallen enough and had hit bottom. Second link: The price kept falling, and they ran out of margin. The exchange forcibly closed their position, selling at market price. Third link: That sale pushed the price down a little further, reaching the liquidation price of the next trader. Fourth link: The next trader was liquidated too, triggering more selling. And so it went, link after link, pushing Bitcoin from $62,000 to below $60,000 tonight.
Put simply, liquidations are contagious.
First link: Someone used leverage to go long, thinking the price had fallen enough and had hit bottom. Second link: The price kept falling, and they ran out of margin. The exchange forcibly closed their position, selling at market price. Third link: That sale pushed the price down a little further, reaching the liquidation price of the next trader. Fourth link: The next trader was liquidated too, triggering more selling. And so it went, link after link, pushing Bitcoin from $62,000 to below $60,000 tonight.
604
·
--

Article
A Night of Plunging Prices: Three Options for Retail Investors—Which One Did You Choose?Tonight, retail investors really have only three options—there is no fourth.
As a seasoned bagholder, I’ll go first: I choose the first option—sit tight and do nothing. Hold my spot assets, close the market app, and wait for a signal. It’s not because I’m especially calm; it’s because I know that decisions I make when I’m terrified are ones I’ll probably regret halfway by the next morning.
The second option: reduce your position and lower your leverage. First, bring your risk down and keep your cash on hand while you wait for an opportunity. This option is for people with large positions, high leverage, and no chance of sleeping tonight. Survive first; think about making money later.
A Night of Plunging Prices: Three Options for Retail Investors—Which One Did You Choose?
Tonight, retail investors really have only three options—there is no fourth.
As a seasoned bagholder, I’ll go first: I choose the first option—sit tight and do nothing. Hold my spot assets, close the market app, and wait for a signal. It’s not because I’m especially calm; it’s because I know that decisions I make when I’m terrified are ones I’ll probably regret halfway by the next morning.
The second option: reduce your position and lower your leverage. First, bring your risk down and keep your cash on hand while you wait for an opportunity. This option is for people with large positions, high leverage, and no chance of sleeping tonight. Survive first; think about making money later.
As a seasoned bagholder, I’ll go first: I choose the first option—sit tight and do nothing. Hold my spot assets, close the market app, and wait for a signal. It’s not because I’m especially calm; it’s because I know that decisions I make when I’m terrified are ones I’ll probably regret halfway by the next morning.
The second option: reduce your position and lower your leverage. First, bring your risk down and keep your cash on hand while you wait for an opportunity. This option is for people with large positions, high leverage, and no chance of sleeping tonight. Survive first; think about making money later.
353
·
--
Article
Crash-Night Checklist: 5 Numbers to Review Before Deciding Whether to ActDon't make a move just yet. First, look at these 5 numbers, then decide whether to act tonight.
As a seasoned crypto trader, I've paid this tuition for you: the easiest way to lose money on a crash night is to react to every price move before your brain catches up.
The first number: $59,332. At the time of writing, Bitcoin is down 5.8% over 24 hours, has fallen below $60,000, and is still sliding. Ethereum is at $1,650, down 7.1%; Solana is at $68.27, down 7.1%; and BNB is at $546, down 6.8%. Not a single coin across the market is up.
The second number: 12. The Fear and Greed Index is in the extreme fear zone. A month ago, it was at 63, in the greed zone. Sentiment shifts even faster than prices, and decisions made when emotions are running highest are the ones most likely to be regretted.
Crash-Night Checklist: 5 Numbers to Review Before Deciding Whether to Act
Don't make a move just yet. First, look at these 5 numbers, then decide whether to act tonight.
As a seasoned crypto trader, I've paid this tuition for you: the easiest way to lose money on a crash night is to react to every price move before your brain catches up.
The first number: $59,332. At the time of writing, Bitcoin is down 5.8% over 24 hours, has fallen below $60,000, and is still sliding. Ethereum is at $1,650, down 7.1%; Solana is at $68.27, down 7.1%; and BNB is at $546, down 6.8%. Not a single coin across the market is up.
The second number: 12. The Fear and Greed Index is in the extreme fear zone. A month ago, it was at 63, in the greed zone. Sentiment shifts even faster than prices, and decisions made when emotions are running highest are the ones most likely to be regretted.
As a seasoned crypto trader, I've paid this tuition for you: the easiest way to lose money on a crash night is to react to every price move before your brain catches up.
The first number: $59,332. At the time of writing, Bitcoin is down 5.8% over 24 hours, has fallen below $60,000, and is still sliding. Ethereum is at $1,650, down 7.1%; Solana is at $68.27, down 7.1%; and BNB is at $546, down 6.8%. Not a single coin across the market is up.
The second number: 12. The Fear and Greed Index is in the extreme fear zone. A month ago, it was at 63, in the greed zone. Sentiment shifts even faster than prices, and decisions made when emotions are running highest are the ones most likely to be regretted.
595
·
--
Article
Is the Decline Over? Three Signals to Watch NextLet me start with the bottom line: I don’t know, and I’m not going to guess. People asking whether the decline is over—nine out of ten of them probably want to hear tonight that we’ve hit bottom. But I don’t have that answer, and neither does anyone else.
As a seasoned retail investor, I focus on signals, not on guessing the bottom. These three signals to watch next are more practical than any forecast.
The first signal: when will ETF fund flows turn positive? Since November, outflows have totaled nearly $3.5 billion. Talk of a reversal is just wishful thinking until institutional money comes back. Checking net inflows or outflows each day is more useful than looking at a hundred candlesticks.
The second signal: the Fed meeting on December 9. One of the main drivers of this downturn is expectations of rate hikes. The Dollar Index is at 103.9, its highest level in nineteen months, and the probability of a 25-basis-point hike in December is above 90%. How the market prices things in before and after the meeting matters more than the meeting itself.
Is the Decline Over? Three Signals to Watch Next
Let me start with the bottom line: I don’t know, and I’m not going to guess. People asking whether the decline is over—nine out of ten of them probably want to hear tonight that we’ve hit bottom. But I don’t have that answer, and neither does anyone else.
As a seasoned retail investor, I focus on signals, not on guessing the bottom. These three signals to watch next are more practical than any forecast.
The first signal: when will ETF fund flows turn positive? Since November, outflows have totaled nearly $3.5 billion. Talk of a reversal is just wishful thinking until institutional money comes back. Checking net inflows or outflows each day is more useful than looking at a hundred candlesticks.
The second signal: the Fed meeting on December 9. One of the main drivers of this downturn is expectations of rate hikes. The Dollar Index is at 103.9, its highest level in nineteen months, and the probability of a 25-basis-point hike in December is above 90%. How the market prices things in before and after the meeting matters more than the meeting itself.
As a seasoned retail investor, I focus on signals, not on guessing the bottom. These three signals to watch next are more practical than any forecast.
The first signal: when will ETF fund flows turn positive? Since November, outflows have totaled nearly $3.5 billion. Talk of a reversal is just wishful thinking until institutional money comes back. Checking net inflows or outflows each day is more useful than looking at a hundred candlesticks.
The second signal: the Fed meeting on December 9. One of the main drivers of this downturn is expectations of rate hikes. The Dollar Index is at 103.9, its highest level in nineteen months, and the probability of a 25-basis-point hike in December is above 90%. How the market prices things in before and after the meeting matters more than the meeting itself.
706
Log in to explore more content
Join global crypto users on Binance Square
⚡️ Get latest and useful information about crypto.
💬 Trusted by the world’s largest crypto exchange.
👍 Discover real insights from verified creators.
Email / Phone number
Trending Topics
CanBTCReboundAfterFallingBelow60K?
0 views
336 Discussing
Bitcoin News | Bitcoin Falls Below $60,000 for the First Time Since July as IBIT Posts Record $541 Million Outflow
Binance News
·30 Likes
·45.4k views
GlobalStocksFaceLongestLosingStreakSince2023
0 views
399 Discussing
AnthropicPlungesTowardIPOPriceonDay2
0 views
120 Discussing