
jubanong
259 Posts

jubanong
Report
Block User
Lead Trader in other platforms.
Open Trade

SHELL Holder
High-Frequency Trader
8.9 Years
100 Following
28 Followers
7 Liked
Posts
Portfolio
·
--
Bearish
Gold is supposed to be a safe haven. Looks like it’s losing its shine?
$XAU
{future}(XAUUSDT)
Gold is supposed to be a safe haven. Looks like it’s losing its shine?
$XAU
$XAU
272
·
--
Would you buy Anthropic on IPO day?
$ANT
{future}(ANTUSDT)
Would you buy Anthropic on IPO day?
$ANT
$ANT
295
·
--
Anthropic's IPO price is $83 per share.
IPO price: $83
Original expected range: $70–$78
Company valuation: Approximately $1.5 trillion
Total IPO proceeds: $81.3 billion
Nasdaq ticker: ANT
Expected first trading day: November 19, 2026
Anthropic priced above its original range due to strong investor demand. 
Important: $83 is the IPO offering price, not necessarily the price retail investors will pay once public trading begins
$ANT
{future}(ANTUSDT)
Anthropic's IPO price is $83 per share.
IPO price: $83
Original expected range: $70–$78
Company valuation: Approximately $1.5 trillion
Total IPO proceeds: $81.3 billion
Nasdaq ticker: ANT
Expected first trading day: November 19, 2026
Anthropic priced above its original range due to strong investor demand. 
Important: $83 is the IPO offering price, not necessarily the price retail investors will pay once public trading begins
$ANT
IPO price: $83
Original expected range: $70–$78
Company valuation: Approximately $1.5 trillion
Total IPO proceeds: $81.3 billion
Nasdaq ticker: ANT
Expected first trading day: November 19, 2026
Anthropic priced above its original range due to strong investor demand. 
Important: $83 is the IPO offering price, not necessarily the price retail investors will pay once public trading begins
$ANT
119
·
--
🚨 IRYSUSDT Market Watch
🟢 Price: $0.01767 (+21.61%)
📈 24H High: $0.01844
📉 24H Low: $0.01447
🔥 24H Volume: 31.86M IRYS
Key Levels to Watch:
* Resistance: $0.01844–$0.01914
* Support: $0.01680
* Major Support: $0.01447
Market Outlook: Bulls are pushing, but can IRYS break resistance and continue higher, or are we about to see a pullback?
👀 What’s your move?
A) Long 🚀
B) Short 🐻
C) Wait for confirmation 🎯
#IRYS #IRYSUSDT #CryptoTrading #Altcoins #CryptoMarket $IRYS
{future}(IRYSUSDT)
🚨 IRYSUSDT Market Watch
🟢 Price: $0.01767 (+21.61%)
📈 24H High: $0.01844
📉 24H Low: $0.01447
🔥 24H Volume: 31.86M IRYS
Key Levels to Watch:
* Resistance: $0.01844–$0.01914
* Support: $0.01680
* Major Support: $0.01447
Market Outlook: Bulls are pushing, but can IRYS break resistance and continue higher, or are we about to see a pullback?
👀 What’s your move?
A) Long 🚀
B) Short 🐻
C) Wait for confirmation 🎯
#IRYS #IRYSUSDT #CryptoTrading #Altcoins #CryptoMarket $IRYS
🟢 Price: $0.01767 (+21.61%)
📈 24H High: $0.01844
📉 24H Low: $0.01447
🔥 24H Volume: 31.86M IRYS
Key Levels to Watch:
* Resistance: $0.01844–$0.01914
* Support: $0.01680
* Major Support: $0.01447
Market Outlook: Bulls are pushing, but can IRYS break resistance and continue higher, or are we about to see a pullback?
👀 What’s your move?
A) Long 🚀
B) Short 🐻
C) Wait for confirmation 🎯
#IRYS #IRYSUSDT #CryptoTrading #Altcoins #CryptoMarket $IRYS
430
·
--
All in on SHELL. Spot bag loaded. 🐚😂
No liquidation price, no leverage, no funding fees. Just waiting for the market to decide whether I’m a genius or just really good at holding bags.
$SHELL please don’t disappoint me. 🤣
All in on SHELL. Spot bag loaded. 🐚😂
No liquidation price, no leverage, no funding fees. Just waiting for the market to decide whether I’m a genius or just really good at holding bags.
$SHELL please don’t disappoint me. 🤣
No liquidation price, no leverage, no funding fees. Just waiting for the market to decide whether I’m a genius or just really good at holding bags.
$SHELL please don’t disappoint me. 🤣
1
484
·
--
INITUSDT is up 70%! 🚀
A possible short squeeze is fueling the rally, with futures activity and short liquidations surging. However, high leverage and recent network concerns make this a risky move.
Can INIT sustain the pump, or are traders about to face another sharp reversal?
High momentum, but chasing green candles can be dangerous.
$INIT
INITUSDT is up 70%! 🚀
A possible short squeeze is fueling the rally, with futures activity and short liquidations surging. However, high leverage and recent network concerns make this a risky move.
Can INIT sustain the pump, or are traders about to face another sharp reversal?
High momentum, but chasing green candles can be dangerous.
$INIT
A possible short squeeze is fueling the rally, with futures activity and short liquidations surging. However, high leverage and recent network concerns make this a risky move.
Can INIT sustain the pump, or are traders about to face another sharp reversal?
High momentum, but chasing green candles can be dangerous.
$INIT
343
·
--
Can Nvidia recover back to an all-time high?
Yes. I think Nvidia (NVDA) can recover and potentially reach a new all-time high. But I wouldn't assume the recovery will happen immediately.
Why I remain optimistic
AI demand remains strong: Nvidia's August guidance projected approximately 70% revenue growth for its next fiscal year. 
Market dominance: Nvidia remains a major supplier of AI computing infrastructure.
Analyst sentiment: Yahoo Finance reports an average analyst price target around $327, although targets aren't guarantees. 
The current controversy may be temporary: The board investigation creates uncertainty, but doesn't automatically invalidate Nvidia's business fundamentals. 
What I'd watch
$170: Recent intraday support area.
$180–190: Initial recovery zone to watch.
$200: Important psychological level.
Previous all-time high: The longer-term recovery target.
Mr Outlook
The November 17 earnings report could be a major catalyst. 
I would avoid rushing all-in just because the stock has dropped. Scaling in and keeping cash available makes more sense than trying to catch the exact bottom.
One important question: Is Nvidia a stock you're considering buying for a long-term hold, or are you looking for a short-term recovery trade?
$NVDA
Can Nvidia recover back to an all-time high?
Yes. I think Nvidia (NVDA) can recover and potentially reach a new all-time high. But I wouldn't assume the recovery will happen immediately.
Why I remain optimistic
AI demand remains strong: Nvidia's August guidance projected approximately 70% revenue growth for its next fiscal year. 
Market dominance: Nvidia remains a major supplier of AI computing infrastructure.
Analyst sentiment: Yahoo Finance reports an average analyst price target around $327, although targets aren't guarantees. 
The current controversy may be temporary: The board investigation creates uncertainty, but doesn't automatically invalidate Nvidia's business fundamentals. 
What I'd watch
$170: Recent intraday support area.
$180–190: Initial recovery zone to watch.
$200: Important psychological level.
Previous all-time high: The longer-term recovery target.
Mr Outlook
The November 17 earnings report could be a major catalyst. 
I would avoid rushing all-in just because the stock has dropped. Scaling in and keeping cash available makes more sense than trying to catch the exact bottom.
One important question: Is Nvidia a stock you're considering buying for a long-term hold, or are you looking for a short-term recovery trade?
$NVDA
Yes. I think Nvidia (NVDA) can recover and potentially reach a new all-time high. But I wouldn't assume the recovery will happen immediately.
Why I remain optimistic
AI demand remains strong: Nvidia's August guidance projected approximately 70% revenue growth for its next fiscal year. 
Market dominance: Nvidia remains a major supplier of AI computing infrastructure.
Analyst sentiment: Yahoo Finance reports an average analyst price target around $327, although targets aren't guarantees. 
The current controversy may be temporary: The board investigation creates uncertainty, but doesn't automatically invalidate Nvidia's business fundamentals. 
What I'd watch
$170: Recent intraday support area.
$180–190: Initial recovery zone to watch.
$200: Important psychological level.
Previous all-time high: The longer-term recovery target.
Mr Outlook
The November 17 earnings report could be a major catalyst. 
I would avoid rushing all-in just because the stock has dropped. Scaling in and keeping cash available makes more sense than trying to catch the exact bottom.
One important question: Is Nvidia a stock you're considering buying for a long-term hold, or are you looking for a short-term recovery trade?
$NVDA
125
·
--
Bullish
ONUSDT is up 80%! 🚀
Strong upside momentum has pushed ONUSDT sharply higher. But after such a quick move, volatility and profit-taking risks increase. Watch for a possible pullback or consolidation before assuming the rally has more room to run.
Is this the start of another leg up, or are we looking at a short-term pump?
Not financial advice. Always do your own research.
$ON
{future}(ONUSDT)
ONUSDT is up 80%! 🚀
Strong upside momentum has pushed ONUSDT sharply higher. But after such a quick move, volatility and profit-taking risks increase. Watch for a possible pullback or consolidation before assuming the rally has more room to run.
Is this the start of another leg up, or are we looking at a short-term pump?
Not financial advice. Always do your own research.
$ON
Strong upside momentum has pushed ONUSDT sharply higher. But after such a quick move, volatility and profit-taking risks increase. Watch for a possible pullback or consolidation before assuming the rally has more room to run.
Is this the start of another leg up, or are we looking at a short-term pump?
Not financial advice. Always do your own research.
$ON
1
1
252
·
--
How’s your portfolio doing?
Mine is doing great! Zero losses, zero gains, and absolutely no liquidation risk. 😂
Must be nice being a portfolio with no money in it.
That is after possible liquidation. 😂
How’s your portfolio doing?
Mine is doing great! Zero losses, zero gains, and absolutely no liquidation risk. 😂
Must be nice being a portfolio with no money in it.
That is after possible liquidation. 😂
Mine is doing great! Zero losses, zero gains, and absolutely no liquidation risk. 😂
Must be nice being a portfolio with no money in it.
That is after possible liquidation. 😂
93
·
--
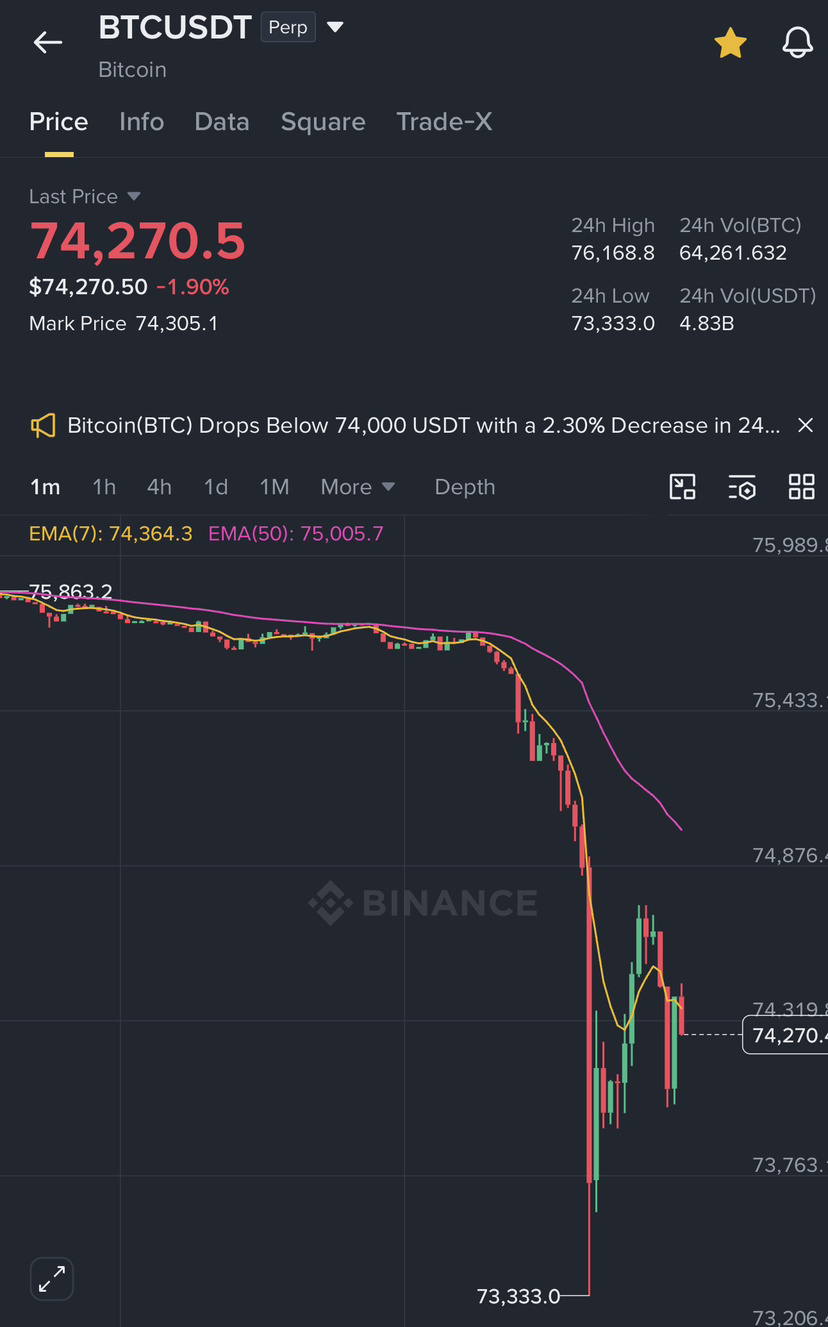
Bitcoin: Should you buy now?
My preference would be gradual accumulation rather than going all-in.
I'd consider three scenarios:
Aggressive: Start a small spot position around $73K–$75K, accepting that it could fall further.
Conservative: Wait for BTC to reclaim $76.5K–$77K and hold that area.
Cheaper entry: If $73K breaks, watch $69K–$70K for another potential buying opportunity.
These are planning zones, not guaranteed entry signals.
What I would personally avoid:
Given how difficult futures trading can be, I wouldn't use leverage to catch this falling market. A spot position with cash reserved for further declines gives you more flexibility.
My verdict: Bitcoin may be approaching an attractive accumulation zone, but I don't see enough confirmation to declare the bottom.
One question: Are you planning to buy BTC for long-term holding or trade a futures bounce?
Bitcoin: Should you buy now?
My preference would be gradual accumulation rather than going all-in.
I'd consider three scenarios:
Aggressive: Start a small spot position around $73K–$75K, accepting that it could fall further.
Conservative: Wait for BTC to reclaim $76.5K–$77K and hold that area.
Cheaper entry: If $73K breaks, watch $69K–$70K for another potential buying opportunity.
These are planning zones, not guaranteed entry signals.
What I would personally avoid:
Given how difficult futures trading can be, I wouldn't use leverage to catch this falling market. A spot position with cash reserved for further declines gives you more flexibility.
My verdict: Bitcoin may be approaching an attractive accumulation zone, but I don't see enough confirmation to declare the bottom.
One question: Are you planning to buy BTC for long-term holding or trade a futures bounce?
My preference would be gradual accumulation rather than going all-in.
I'd consider three scenarios:
Aggressive: Start a small spot position around $73K–$75K, accepting that it could fall further.
Conservative: Wait for BTC to reclaim $76.5K–$77K and hold that area.
Cheaper entry: If $73K breaks, watch $69K–$70K for another potential buying opportunity.
These are planning zones, not guaranteed entry signals.
What I would personally avoid:
Given how difficult futures trading can be, I wouldn't use leverage to catch this falling market. A spot position with cash reserved for further declines gives you more flexibility.
My verdict: Bitcoin may be approaching an attractive accumulation zone, but I don't see enough confirmation to declare the bottom.
One question: Are you planning to buy BTC for long-term holding or trade a futures bounce?
102
·
--
4
·
--
They are not losses. They are donation to the market. Giving back to the market that built us. 📈🤝 $BTC $2Z
They are not losses. They are donation to the market. Giving back to the market that built us. 📈🤝 $BTC $2Z
367
·
--
Bullish
$JCT
JCTUSDT up 230%. 🚀
Another coin decided to have the time of its life while the rest of my portfolio is still fighting for survival. 😂
Crypto never runs out of surprises.
Did you catch this move or just watch it happen? 👀
{future}(JCTUSDT)
$JCT
JCTUSDT up 230%. 🚀
Another coin decided to have the time of its life while the rest of my portfolio is still fighting for survival. 😂
Crypto never runs out of surprises.
Did you catch this move or just watch it happen? 👀
JCTUSDT up 230%. 🚀
Another coin decided to have the time of its life while the rest of my portfolio is still fighting for survival. 😂
Crypto never runs out of surprises.
Did you catch this move or just watch it happen? 👀
309
·
--
Bullish
Peter Thiel: "I do think Bitcoin is the first encrypted money that has the potential to do something like change the world."
$BTC
{spot}(BTCUSDT)
Peter Thiel: "I do think Bitcoin is the first encrypted money that has the potential to do something like change the world."
$BTC
$BTC
4
·
--
Thinking of shorting UAIUSDT? The token is in a steep downtrend below $0.20 with bearish moving averages. However, shorting carries high risk—a sudden market shift could trigger a short squeeze. Always do your own research.
$UAI
{future}(UAIUSDT)
Thinking of shorting UAIUSDT? The token is in a steep downtrend below $0.20 with bearish moving averages. However, shorting carries high risk—a sudden market shift could trigger a short squeeze. Always do your own research.
$UAI
$UAI
348
·
--
Bullish
$KOMA Quick Take 🚀 📈 Price: ~$0.016 - $0.020 📊 24h Vol: ~$1.5M 📉 7-Day: -5.6% (Cooling off)
💡 The Setup: Watching the 0.128 - 0.142 resistance zone. A break above with volume could trigger the next leg up.
{future}(KOMAUSDT)
$KOMA Quick Take 🚀 📈 Price: ~$0.016 - $0.020 📊 24h Vol: ~$1.5M 📉 7-Day: -5.6% (Cooling off)
💡 The Setup: Watching the 0.128 - 0.142 resistance zone. A break above with volume could trigger the next leg up.
💡 The Setup: Watching the 0.128 - 0.142 resistance zone. A break above with volume could trigger the next leg up.
366
·
--
A dead cat bounce is a brief, often misleading, rise in the price of a stock or asset that has been falling sharply.
It looks like the asset is starting to recover, but the upward movement quickly runs out of steam, and the price continues to drop.
It gets its name from the grim idea that even a dead cat will bounce if it falls fast enough, meaning the "bounce" isn't a sign of life—it's just a temporary reaction.
Tag a crypto with a dead cat bounce.
$BTC
$ETH
$SOL
A dead cat bounce is a brief, often misleading, rise in the price of a stock or asset that has been falling sharply.
It looks like the asset is starting to recover, but the upward movement quickly runs out of steam, and the price continues to drop.
It gets its name from the grim idea that even a dead cat will bounce if it falls fast enough, meaning the "bounce" isn't a sign of life—it's just a temporary reaction.
Tag a crypto with a dead cat bounce.
$BTC
$ETH
$SOL
It looks like the asset is starting to recover, but the upward movement quickly runs out of steam, and the price continues to drop.
It gets its name from the grim idea that even a dead cat will bounce if it falls fast enough, meaning the "bounce" isn't a sign of life—it's just a temporary reaction.
Tag a crypto with a dead cat bounce.
$BTC
$ETH
$SOL
61
·
--
Bullish
#WillAnthropicListOnTime the question is, for how much?$ANTHROPIC
{future}(ANTHROPICUSDT)
#WillAnthropicListOnTime the question is, for how much?$ANTHROPIC
179
·
--
Technical analysis for 2Z/TetherUS (DoubleZero) currently indicates a prevailing bearish trend. The token is trading below $0.030 to $0.034, facing downward pressure from a broader altcoin sell-off and recent large-scale token unlocks.
TECHNICAL INDICATORS
Moving Averages: The short-term moving averages (MA50 and EMA50) are currently above the trading price, which typically signals a "sell" market trend.
Momentum: The Relative Strength Index (RSI) is hovering near oversold territory, suggesting that while downward momentum is strong, the asset may be approaching a consolidation phase.
Support and Resistance: Key support is currently being tested near the psychological $0.030 level. If the price breaks below this, it could retest yearly lows near $0.025. Resistance is established between $0.035 and $0.036.
MARKET FACTORS
The recent decline in 2Z is largely attributed to sector-wide de-risking rather than isolated project news. Additionally, the unlocking of new tokens has introduced short-term selling pressure as supply enters the market.
$2Z
Technical analysis for 2Z/TetherUS (DoubleZero) currently indicates a prevailing bearish trend. The token is trading below $0.030 to $0.034, facing downward pressure from a broader altcoin sell-off and recent large-scale token unlocks.
TECHNICAL INDICATORS
Moving Averages: The short-term moving averages (MA50 and EMA50) are currently above the trading price, which typically signals a "sell" market trend.
Momentum: The Relative Strength Index (RSI) is hovering near oversold territory, suggesting that while downward momentum is strong, the asset may be approaching a consolidation phase.
Support and Resistance: Key support is currently being tested near the psychological $0.030 level. If the price breaks below this, it could retest yearly lows near $0.025. Resistance is established between $0.035 and $0.036.
MARKET FACTORS
The recent decline in 2Z is largely attributed to sector-wide de-risking rather than isolated project news. Additionally, the unlocking of new tokens has introduced short-term selling pressure as supply enters the market.
$2Z
TECHNICAL INDICATORS
Moving Averages: The short-term moving averages (MA50 and EMA50) are currently above the trading price, which typically signals a "sell" market trend.
Momentum: The Relative Strength Index (RSI) is hovering near oversold territory, suggesting that while downward momentum is strong, the asset may be approaching a consolidation phase.
Support and Resistance: Key support is currently being tested near the psychological $0.030 level. If the price breaks below this, it could retest yearly lows near $0.025. Resistance is established between $0.035 and $0.036.
MARKET FACTORS
The recent decline in 2Z is largely attributed to sector-wide de-risking rather than isolated project news. Additionally, the unlocking of new tokens has introduced short-term selling pressure as supply enters the market.
$2Z
1
533
Log in to explore more content
Join global crypto users on Binance Square
⚡️ Get latest and useful information about crypto.
💬 Trusted by the world’s largest crypto exchange.
👍 Discover real insights from verified creators.
Email / Phone number
Trending Topics
BTCReboundsAbove$60KAmidWhaleDipBuying
74,830 views
355 Discussing
Abraxas Capital, Other Whales Buy the BTC Dip as Bitcoin Briefly Reclaims $60,000
Binance News
·35 Likes
·77.8k views
SolanaSets2027RoadmapToDoubleComputeCapacity
59,204 views
1,028 Discussing
CaliforniaNvidiaProbeExaminesPotentialCriminalViolations
15,851 views
141 Discussing