
Oleg542
1.5k Posts

Oleg542
Привіт 👋 я ентузіаст в сфері крипти, активно вивчаю ринок, тому якщо щось потрібно, я на зв'язку 🤝
Open Trade
Frequent Trader
4.4 Years
98 Following
400 Followers
735 Liked
Posts
Portfolio
All
Quotes
Live

Andrii Obolon
·
--
The Fed Rebellion
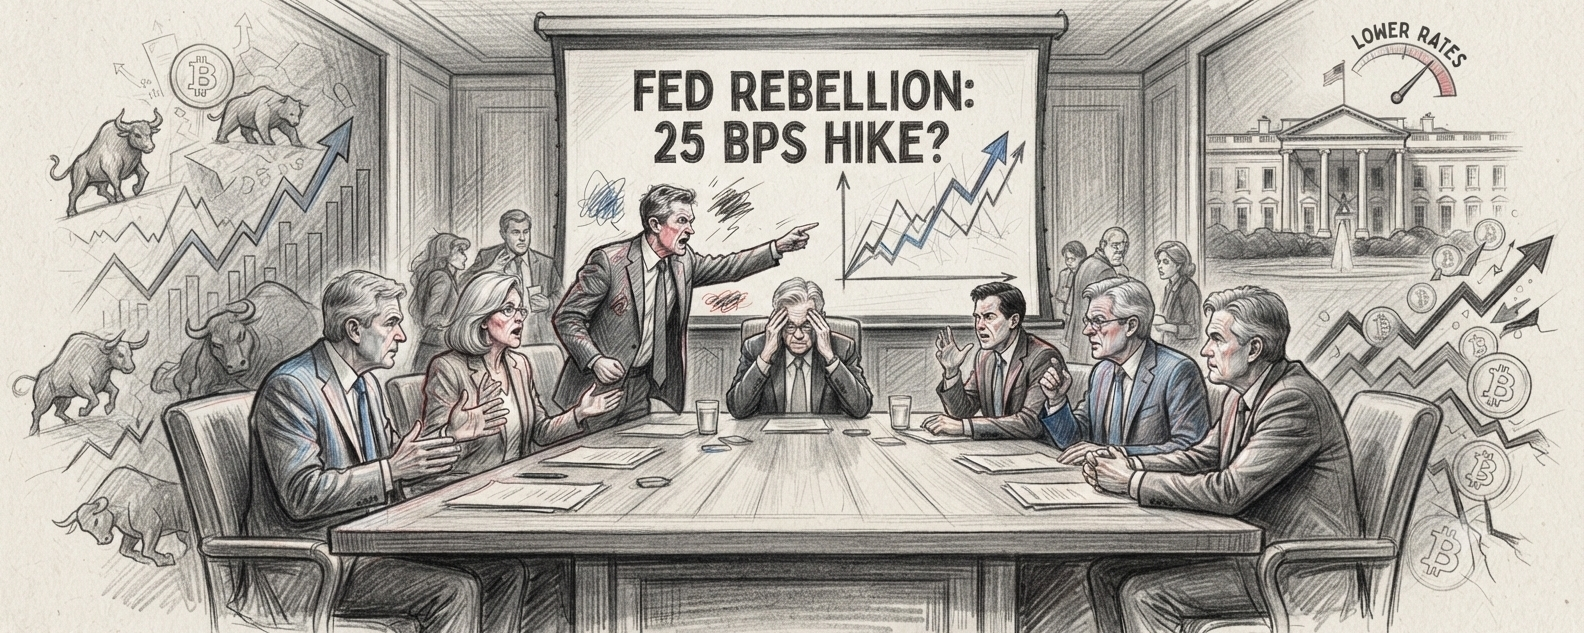
The Fed Rebellion: Why Today's Meeting Could Break the Markets
The world is holding its breath in anticipation of the most dramatic Federal Reserve decision in recent years. Amid a new energy shock, inflation spikes, and intense political pressure from the White House demanding lower rates, the Fed faces an existential choice.
The futures market has priced in the probability of a sharp pivot and a 25-basis-point rate hike (to the 3.75%–4.00% range). This would mark the first tightening of monetary policy since 2023, flying in the face of the administration's wishes. The main intrigue is whether the central bank will dare to take this step after the July split, when three committee members voted against holding rates for the first time in a long while.
Experts warn that if the Fed yields to political pressure and keeps rates unchanged, it will deal a final blow to the regulator's perceived independence. Yet, a rate hike amid global tensions could trigger a powerful storm across stock and crypto markets, pushing Treasury yields to new multi-year highs. The ultimate question now: will this be a one-off move, or the start of a harsh new era?$BTC
The world is holding its breath in anticipation of the most dramatic Federal Reserve decision in recent years. Amid a new energy shock, inflation spikes, and intense political pressure from the White House demanding lower rates, the Fed faces an existential choice.
The futures market has priced in the probability of a sharp pivot and a 25-basis-point rate hike (to the 3.75%–4.00% range). This would mark the first tightening of monetary policy since 2023, flying in the face of the administration's wishes. The main intrigue is whether the central bank will dare to take this step after the July split, when three committee members voted against holding rates for the first time in a long while.
Experts warn that if the Fed yields to political pressure and keeps rates unchanged, it will deal a final blow to the regulator's perceived independence. Yet, a rate hike amid global tensions could trigger a powerful storm across stock and crypto markets, pushing Treasury yields to new multi-year highs. The ultimate question now: will this be a one-off move, or the start of a harsh new era?$BTC
Andrii Obolon
·
--
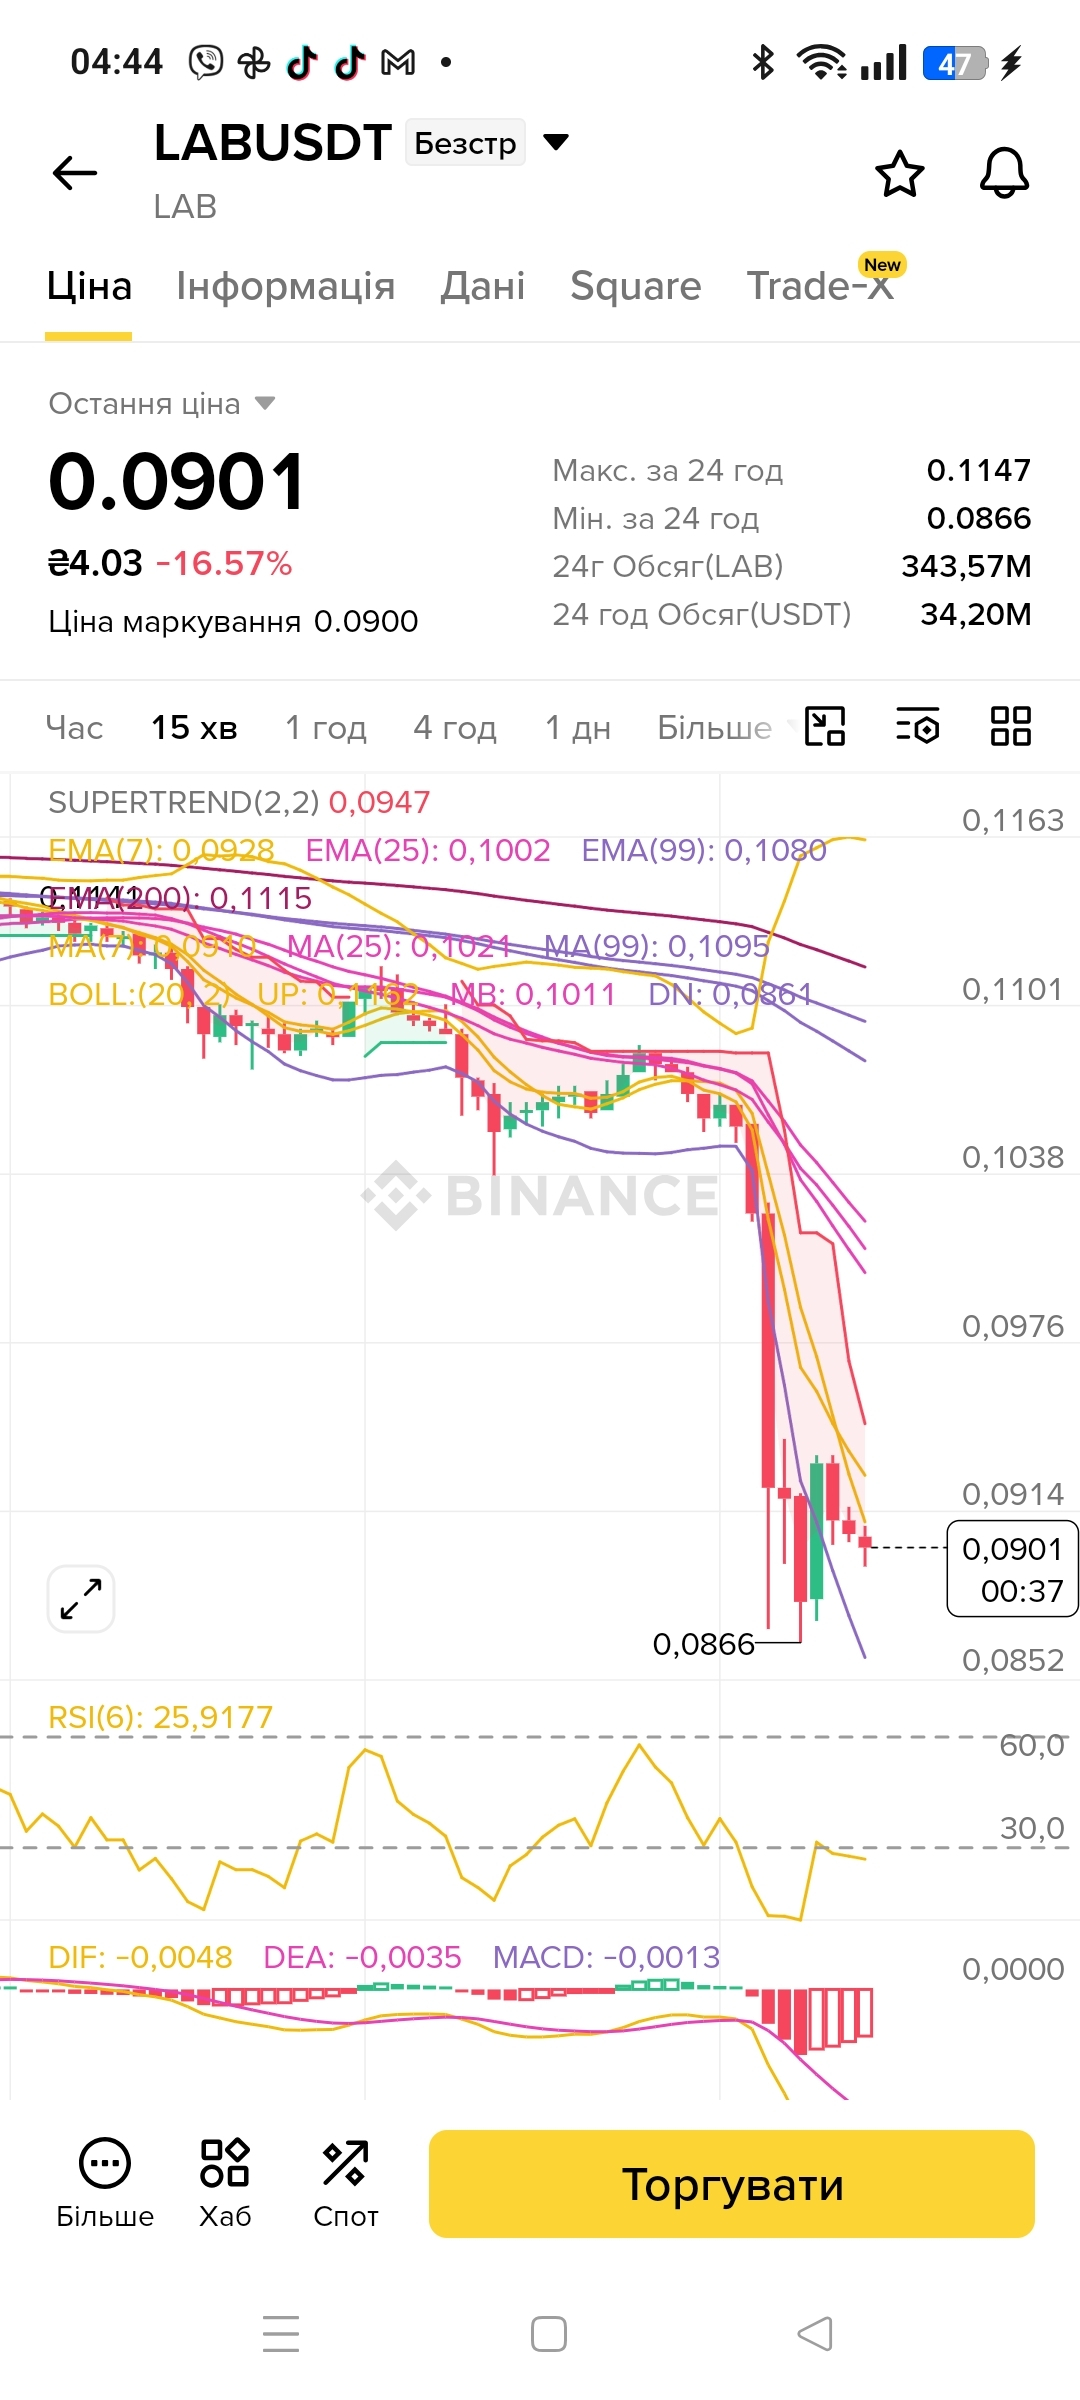
🪙 ASSET: $LAB /USDT (Binance)
🔴 DIRECTION: SHORT (Short position)
📉 TREND: Pronounced downtrend. Price collapsed from 0.1115 (chart peak / EMA(200)) to the current 0.0901 — a correction of ~19.2%. Price is trading below all key EMAs: EMA(7) 0.0928, EMA(25) 0.1002, EMA(99) 0.1080, EMA(200) 0.1115 — full bearish setup. RSI(6) is at 25.92 — approaching oversold levels but has not yet reached the 20 zone, leaving room for further decline. MACD is negative (DIF -0.0048, DEA -0.0035, MACD -0.0013) — confirming bearish momentum. Supertrend 0.0947 is red and above the price — an additional signal of weakness. Volume of $34.20M confirms seller activity.
🎯 Trading Setup
🎯 Entry: 0.0900 – 0.0925
🛑 Stop-Loss: 0.0955 (above Supertrend 0.0947 + buffer)
📉 Take-Profits:
🔴 TP1: 0.0865 — below 24h low 0.0866 / local bottom
🔴 TP2: 0.0830 — below BOLL DN 0.0861 / intermediate support
🔴 TP3: 0.0800 — extended target, approaching the psychological level
🔑 Key Levels
🔵 Bottom (0.0866): 24-hour low / bounce level
🔴 Resistance (0.1115): EMA(200) / local peak / drop start level
🟢 Support (0.0866): 24-hour low / BOLL DN 0.0861
🎯 Entry Zone (0.0900–0.0925): Current zone / retest of EMA(7) 0.0928 from below
🛑 Stop-Loss (0.0955): Above Supertrend with a buffer
⚠️ Disclaimer: This analysis is not financial advice. Trade at your own risk.
$LAB
🔴 DIRECTION: SHORT (Short position)
📉 TREND: Pronounced downtrend. Price collapsed from 0.1115 (chart peak / EMA(200)) to the current 0.0901 — a correction of ~19.2%. Price is trading below all key EMAs: EMA(7) 0.0928, EMA(25) 0.1002, EMA(99) 0.1080, EMA(200) 0.1115 — full bearish setup. RSI(6) is at 25.92 — approaching oversold levels but has not yet reached the 20 zone, leaving room for further decline. MACD is negative (DIF -0.0048, DEA -0.0035, MACD -0.0013) — confirming bearish momentum. Supertrend 0.0947 is red and above the price — an additional signal of weakness. Volume of $34.20M confirms seller activity.
🎯 Trading Setup
🎯 Entry: 0.0900 – 0.0925
🛑 Stop-Loss: 0.0955 (above Supertrend 0.0947 + buffer)
📉 Take-Profits:
🔴 TP1: 0.0865 — below 24h low 0.0866 / local bottom
🔴 TP2: 0.0830 — below BOLL DN 0.0861 / intermediate support
🔴 TP3: 0.0800 — extended target, approaching the psychological level
🔑 Key Levels
🔵 Bottom (0.0866): 24-hour low / bounce level
🔴 Resistance (0.1115): EMA(200) / local peak / drop start level
🟢 Support (0.0866): 24-hour low / BOLL DN 0.0861
🎯 Entry Zone (0.0900–0.0925): Current zone / retest of EMA(7) 0.0928 from below
🛑 Stop-Loss (0.0955): Above Supertrend with a buffer
⚠️ Disclaimer: This analysis is not financial advice. Trade at your own risk.
$LAB
Andrii Obolon
·
--
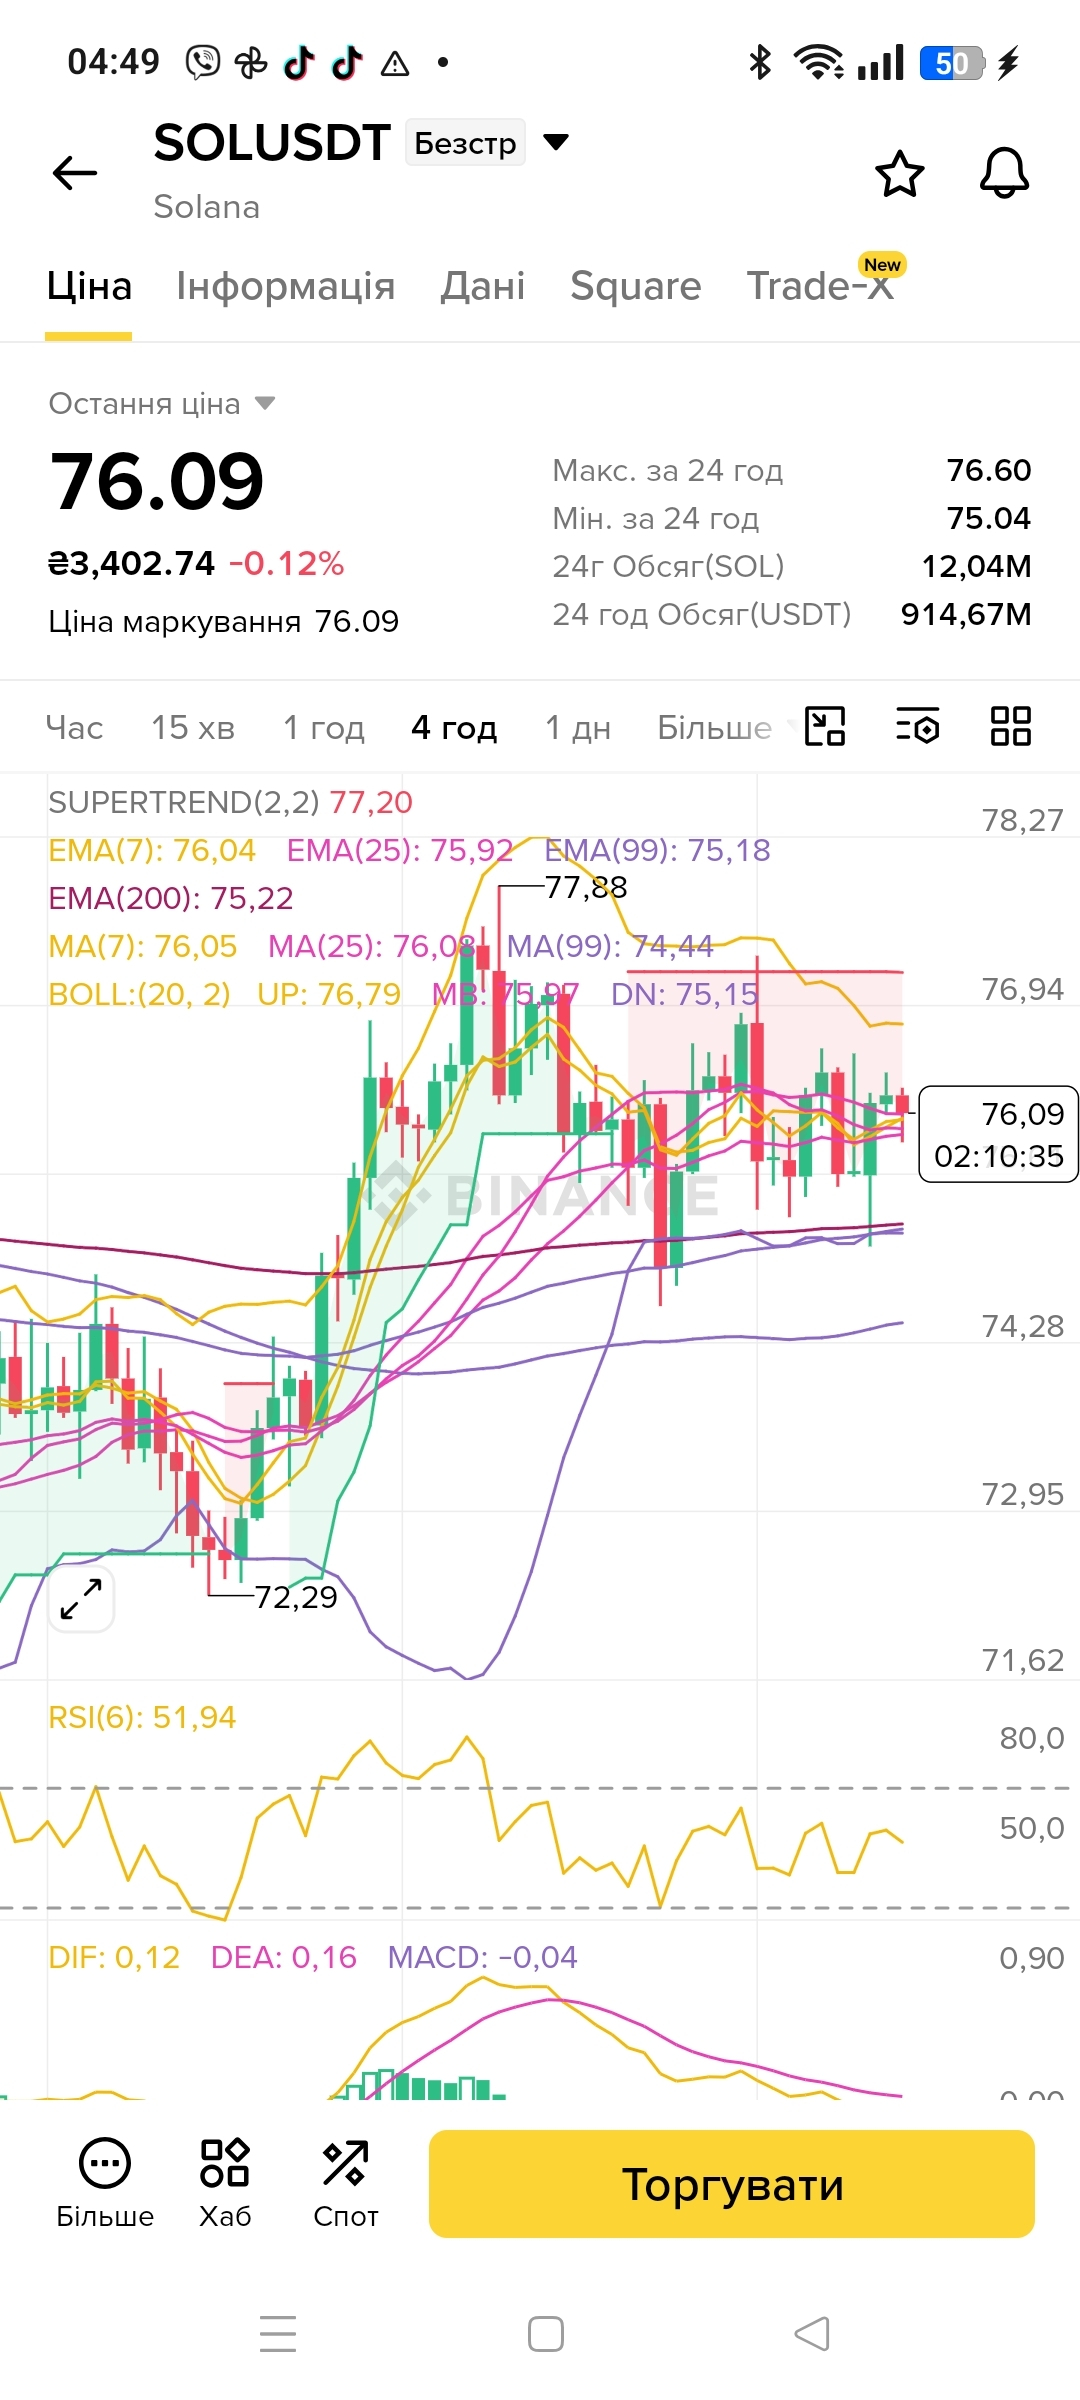
🪙 ASSET: $SOL /USDT (Binance)
🔴 DIRECTION: SHORT (Short position)
📉 TREND: Corrective downtrend. Price pulled back from 77.88 (chart peak) to the current 76.09 — a correction of ~2.3%. Price is trading above EMA(7) 76.04, EMA(25) 75.92, EMA(99) 75.18, and EMA(200) 75.22, but below Supertrend 77.20 — a mixed picture with a short-term bearish bias. RSI(6) is at 51.94 — neutral zone with no oversold signs, leaving room for further decline. MACD is negative (DIF 0.12, DEA 0.16, MACD -0.04) — a bearish crossover in positive territory, confirming weakness. Supertrend 77.20 is red and above the price — an additional signal of weakness. Volume of $914.67M confirms high activity.
🎯 Trading Setup
🎯 Entry: 76.00 – 76.50
🛑 Stop-Loss: 78.00 (above Supertrend 77.20 / local peak 77.88 + buffer)
📉 Take-Profits:
🔴 TP1: 75.00 — below 24h low 75.04 / BOLL DN 75.15
🔴 TP2: 74.00 — below EMA(99) 75.18 / EMA(200) 75.22
🔴 TP3: 72.50 — approaching local bottom 72.29
🔑 Key Levels
🔵 Bottom (72.29): Local minimum / growth start level
🔴 Resistance (77.88): Local peak / drop start level
🟢 Support (75.15): BOLL DN / near dynamic level
🎯 Entry Zone (76.00–76.50): Current zone / retest of EMA(7) 76.04 from below
🛑 Stop-Loss (78.00): Above Supertrend and local peak with a buffer
⚠️ Disclaimer: This analysis is not financial advice. Trade at your own risk.
$SOL
🔴 DIRECTION: SHORT (Short position)
📉 TREND: Corrective downtrend. Price pulled back from 77.88 (chart peak) to the current 76.09 — a correction of ~2.3%. Price is trading above EMA(7) 76.04, EMA(25) 75.92, EMA(99) 75.18, and EMA(200) 75.22, but below Supertrend 77.20 — a mixed picture with a short-term bearish bias. RSI(6) is at 51.94 — neutral zone with no oversold signs, leaving room for further decline. MACD is negative (DIF 0.12, DEA 0.16, MACD -0.04) — a bearish crossover in positive territory, confirming weakness. Supertrend 77.20 is red and above the price — an additional signal of weakness. Volume of $914.67M confirms high activity.
🎯 Trading Setup
🎯 Entry: 76.00 – 76.50
🛑 Stop-Loss: 78.00 (above Supertrend 77.20 / local peak 77.88 + buffer)
📉 Take-Profits:
🔴 TP1: 75.00 — below 24h low 75.04 / BOLL DN 75.15
🔴 TP2: 74.00 — below EMA(99) 75.18 / EMA(200) 75.22
🔴 TP3: 72.50 — approaching local bottom 72.29
🔑 Key Levels
🔵 Bottom (72.29): Local minimum / growth start level
🔴 Resistance (77.88): Local peak / drop start level
🟢 Support (75.15): BOLL DN / near dynamic level
🎯 Entry Zone (76.00–76.50): Current zone / retest of EMA(7) 76.04 from below
🛑 Stop-Loss (78.00): Above Supertrend and local peak with a buffer
⚠️ Disclaimer: This analysis is not financial advice. Trade at your own risk.
$SOL

Holding $BNB 0.2 USDT
Andrii Obolon
·
--
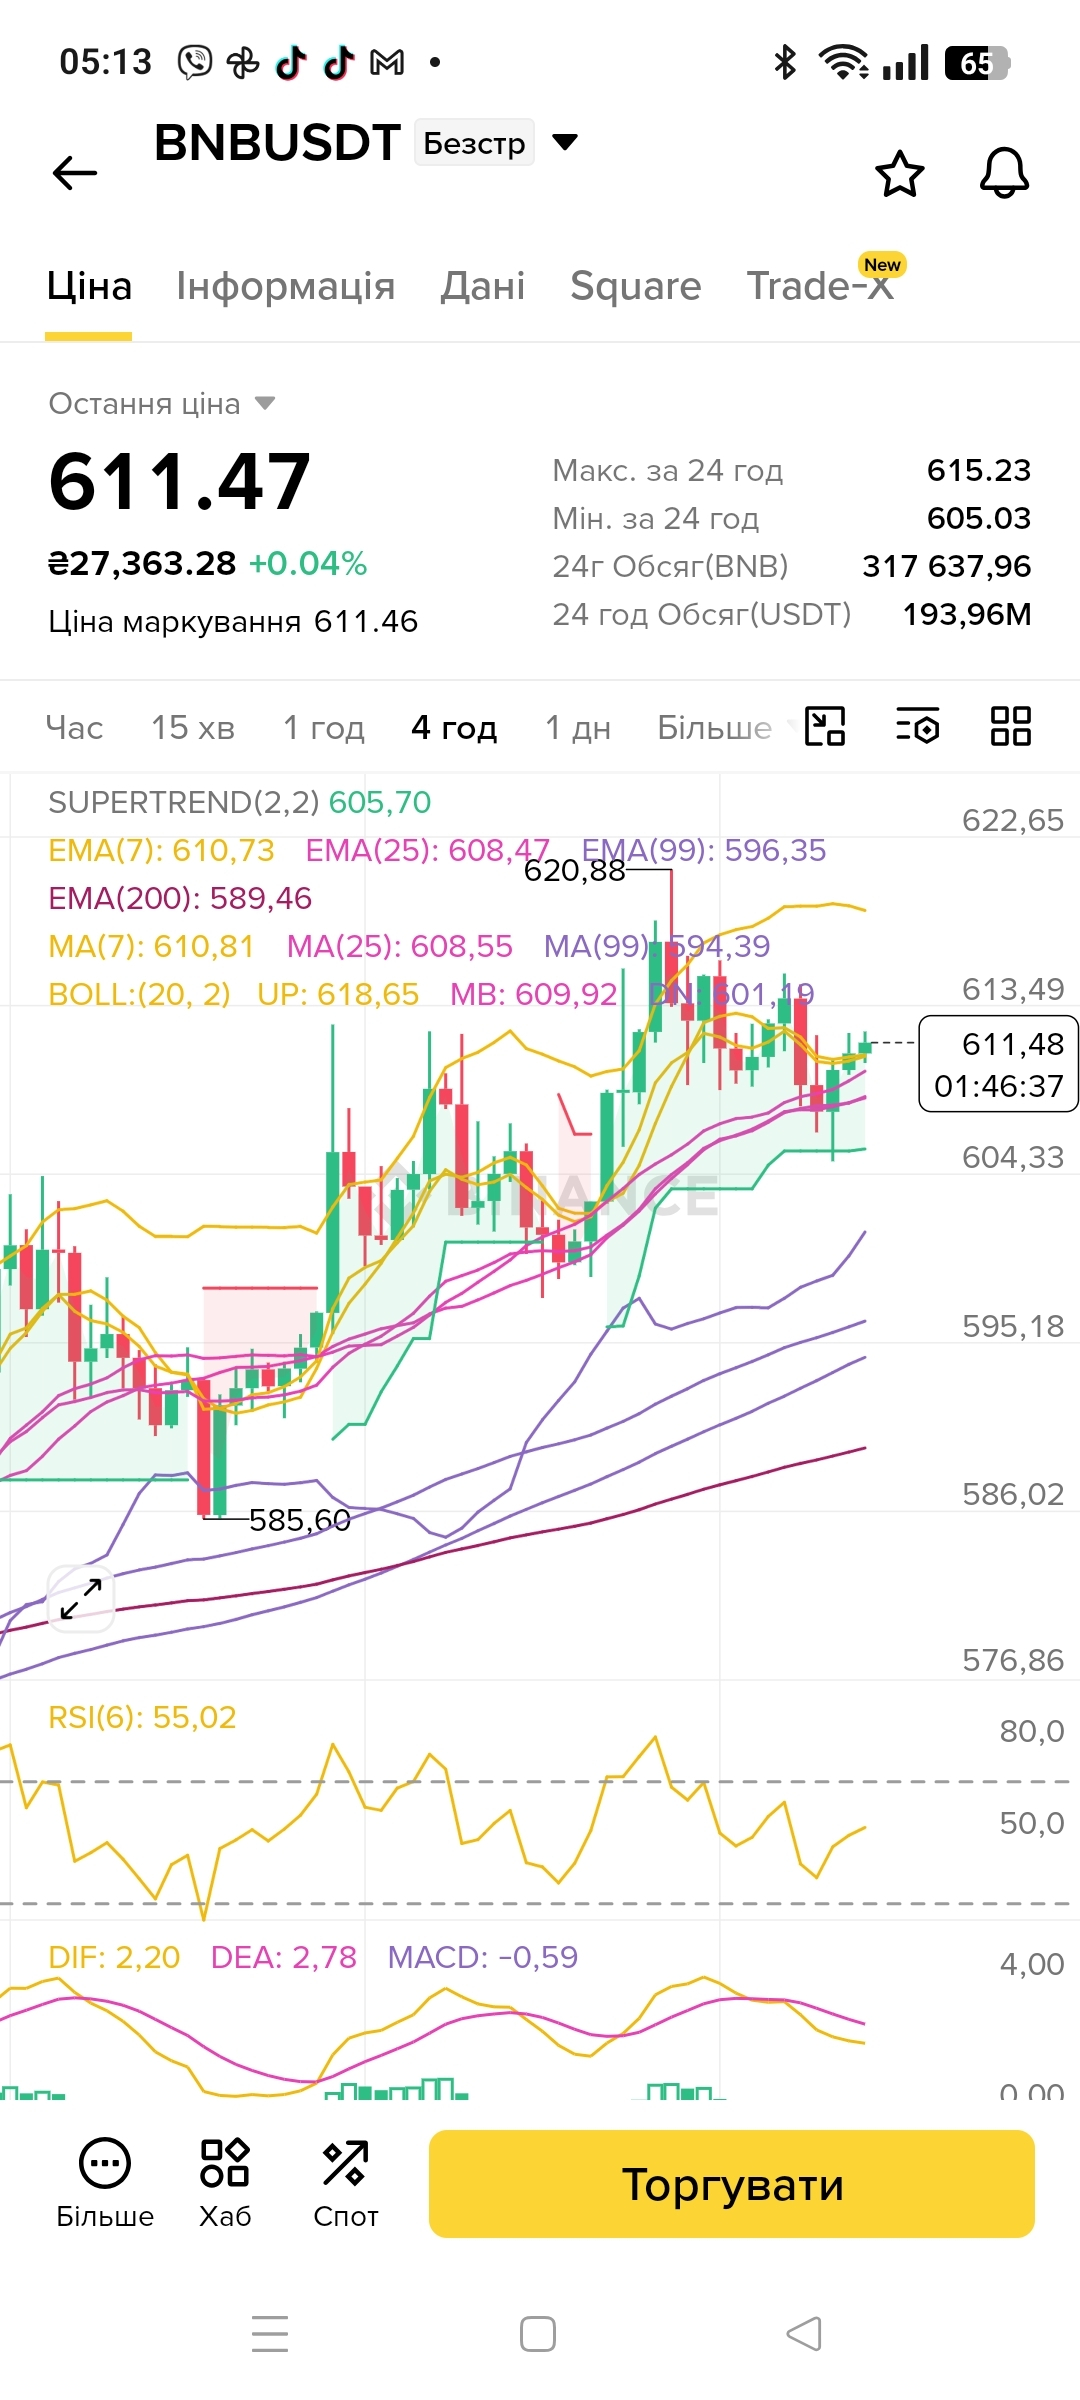
🪙 ASSET: $BNB /USDT (Binance)
🟢 DIRECTION: LONG (Long position)
📈 TREND: Pronounced uptrend. Price surged from 585.60 (chart bottom) to the current 611.47 — a growth of ~4.4%. Price is trading above all key EMAs: EMA(7) 610.73, EMA(25) 608.47, EMA(99) 596.35, EMA(200) 589.46 — full bullish setup. RSI(6) is at 55.02 — neutral-bullish zone with room for further growth. MACD is in positive territory (DIF 2.20, DEA 2.78, MACD -0.59) — a weak bearish crossover, representing short-term consolidation before continuing the growth. Supertrend 605.70 is green and below the price — an additional signal of strength. Volume of $193.96M confirms buyer activity.
🎯 Trading Setup
🎯 Entry: 610.00 – 611.50
🛑 Stop-Loss: 602.00 (below Supertrend 605.70 / 24h low 605.03 + buffer)
📈 Take-Profits:
🟢 TP1: 615.50 — breaking 24h high 615.23
🟢 TP2: 620.00 — local peak 620.88
🟢 TP3: 625.00 — extended target, approaching the 630 zone
🔑 Key Levels
🔵 Bottom (585.60): Local minimum / growth start level
🔴 Resistance (620.88): Local peak / correction start level
🟢 Support (605.70): Supertrend / 24-hour low 605.03
🎯 Entry Zone (610.00–611.50): Current zone / retest of EMA(7) 610.73 from above
🛑 Stop-Loss (602.00): Below Supertrend and 24h low with a buffer
⚠️ Disclaimer: This analysis is not financial advice. Trade at your own risk.
$BNB
🟢 DIRECTION: LONG (Long position)
📈 TREND: Pronounced uptrend. Price surged from 585.60 (chart bottom) to the current 611.47 — a growth of ~4.4%. Price is trading above all key EMAs: EMA(7) 610.73, EMA(25) 608.47, EMA(99) 596.35, EMA(200) 589.46 — full bullish setup. RSI(6) is at 55.02 — neutral-bullish zone with room for further growth. MACD is in positive territory (DIF 2.20, DEA 2.78, MACD -0.59) — a weak bearish crossover, representing short-term consolidation before continuing the growth. Supertrend 605.70 is green and below the price — an additional signal of strength. Volume of $193.96M confirms buyer activity.
🎯 Trading Setup
🎯 Entry: 610.00 – 611.50
🛑 Stop-Loss: 602.00 (below Supertrend 605.70 / 24h low 605.03 + buffer)
📈 Take-Profits:
🟢 TP1: 615.50 — breaking 24h high 615.23
🟢 TP2: 620.00 — local peak 620.88
🟢 TP3: 625.00 — extended target, approaching the 630 zone
🔑 Key Levels
🔵 Bottom (585.60): Local minimum / growth start level
🔴 Resistance (620.88): Local peak / correction start level
🟢 Support (605.70): Supertrend / 24-hour low 605.03
🎯 Entry Zone (610.00–611.50): Current zone / retest of EMA(7) 610.73 from above
🛑 Stop-Loss (602.00): Below Supertrend and 24h low with a buffer
⚠️ Disclaimer: This analysis is not financial advice. Trade at your own risk.
$BNB
Andrii Obolon
·
--
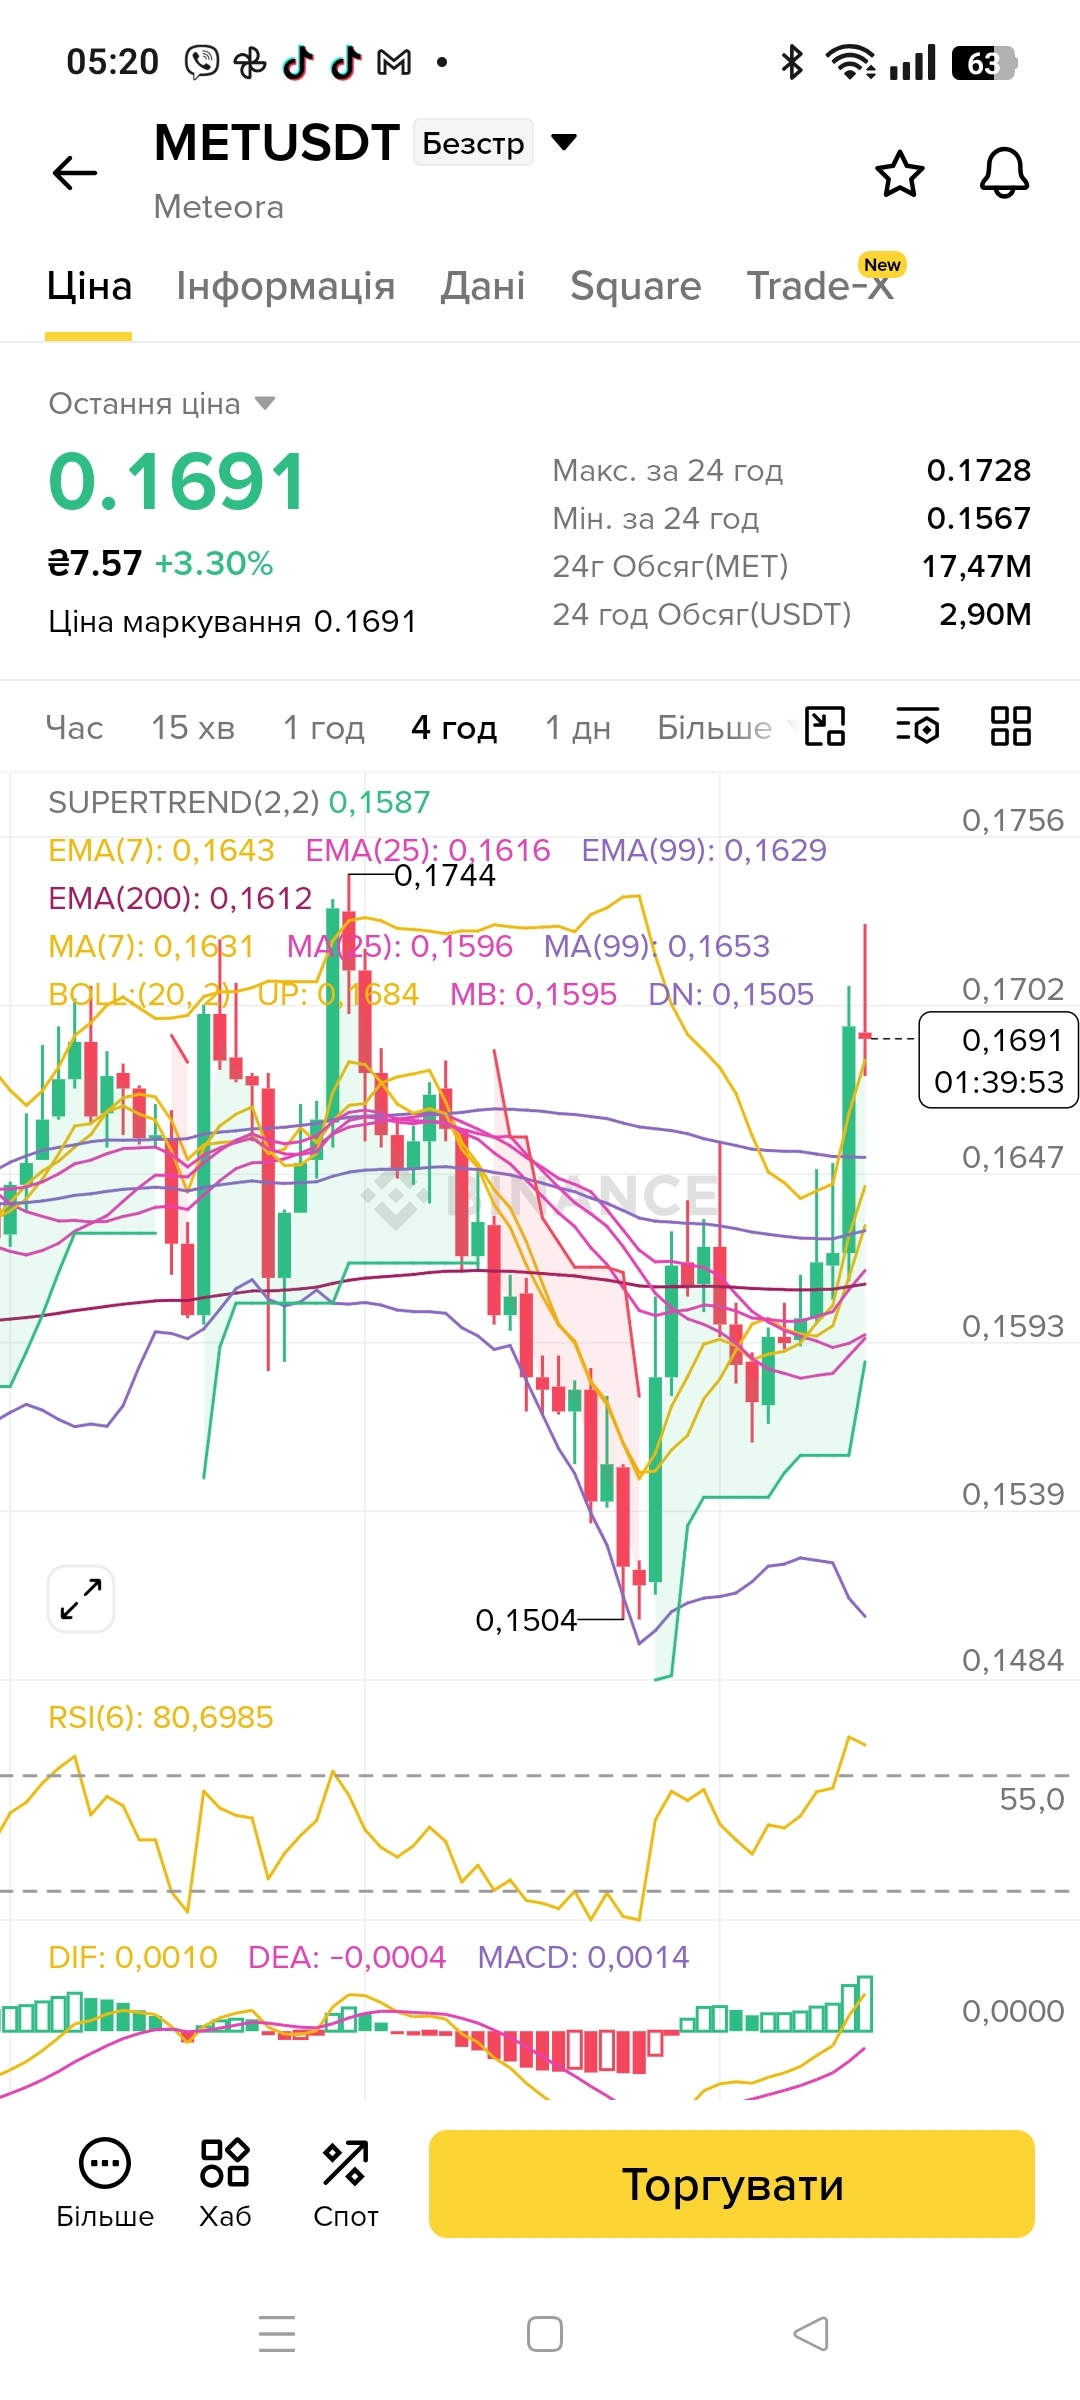
🪙 ASSET: $MET /USDT (Binance)
🟢 DIRECTION: LONG (Long position)
📈 TREND: Pronounced uptrend. Price surged from 0.1504 (chart bottom) to the current 0.1691 — a growth of ~12.4%. Price is trading above all key EMAs: EMA(7) 0.1643, EMA(25) 0.1616, EMA(99) 0.1629, EMA(200) 0.1612 — full bullish setup. RSI(6) is at 80.70 — close to overbought, which may indicate short-term consolidation, but the trend remains strong. MACD is positive (DIF 0.0010, DEA -0.0004, MACD 0.0014) — confirming bullish momentum. Supertrend 0.1587 is green and below the price — an additional signal of strength. Volume of $2.90M confirms buyer activity.
🎯 Trading Setup
🎯 Entry: 0.1680 – 0.1700
🛑 Stop-Loss: 0.1600 (below Supertrend 0.1587 / EMA(200) 0.1612 + buffer)
📈 Take-Profits:
🟢 TP1: 0.1725 — breaking 24h high 0.1728
🟢 TP2: 0.1780 — above local peak 0.1744
🟢 TP3: 0.1850 — extended target, approaching the 0.1900 zone
🔑 Key Levels
🔵 Bottom (0.1504): Local minimum / growth start level
🔴 Resistance (0.1744): Local peak / correction start level
🟢 Support (0.1587): Supertrend / dynamic support level
🎯 Entry Zone (0.1680–0.1700): Current zone / retest of EMA(7) 0.1643 from above
🛑 Stop-Loss (0.1600): Below Supertrend and EMA(200) with a buffer
⚠️ Disclaimer: This analysis is not financial advice. Trade at your own risk.
$MET
🟢 DIRECTION: LONG (Long position)
📈 TREND: Pronounced uptrend. Price surged from 0.1504 (chart bottom) to the current 0.1691 — a growth of ~12.4%. Price is trading above all key EMAs: EMA(7) 0.1643, EMA(25) 0.1616, EMA(99) 0.1629, EMA(200) 0.1612 — full bullish setup. RSI(6) is at 80.70 — close to overbought, which may indicate short-term consolidation, but the trend remains strong. MACD is positive (DIF 0.0010, DEA -0.0004, MACD 0.0014) — confirming bullish momentum. Supertrend 0.1587 is green and below the price — an additional signal of strength. Volume of $2.90M confirms buyer activity.
🎯 Trading Setup
🎯 Entry: 0.1680 – 0.1700
🛑 Stop-Loss: 0.1600 (below Supertrend 0.1587 / EMA(200) 0.1612 + buffer)
📈 Take-Profits:
🟢 TP1: 0.1725 — breaking 24h high 0.1728
🟢 TP2: 0.1780 — above local peak 0.1744
🟢 TP3: 0.1850 — extended target, approaching the 0.1900 zone
🔑 Key Levels
🔵 Bottom (0.1504): Local minimum / growth start level
🔴 Resistance (0.1744): Local peak / correction start level
🟢 Support (0.1587): Supertrend / dynamic support level
🎯 Entry Zone (0.1680–0.1700): Current zone / retest of EMA(7) 0.1643 from above
🛑 Stop-Loss (0.1600): Below Supertrend and EMA(200) with a buffer
⚠️ Disclaimer: This analysis is not financial advice. Trade at your own risk.
$MET
Andrii Obolon
·
--
#dusk $DUSK Analyzing transactions on the Dusk network, I encountered an unusual experience. The transaction had a "settled" status, yet the expected volume of accompanying data was missing. Initially, I chalked it up to explorer latency, but later I realized a deeper truth.
Working with public blockchains, we are used to building trust on complete transparency and the detailing of every operation. However, infrastructure with a focus on privacy offers a different paradigm: knowing that a transaction is valid and knowing all its details are not the same thing.
In such systems, trust is based not on the disclosure of every detail, but on cryptographic tools for verifying the validity of the result. This fundamentally changes the approach to security and the concept of transparency as a whole.
#dusk @Dusk $DUSK
Working with public blockchains, we are used to building trust on complete transparency and the detailing of every operation. However, infrastructure with a focus on privacy offers a different paradigm: knowing that a transaction is valid and knowing all its details are not the same thing.
In such systems, trust is based not on the disclosure of every detail, but on cryptographic tools for verifying the validity of the result. This fundamentally changes the approach to security and the concept of transparency as a whole.
#dusk @Dusk $DUSK


Andrii Obolon
·
--
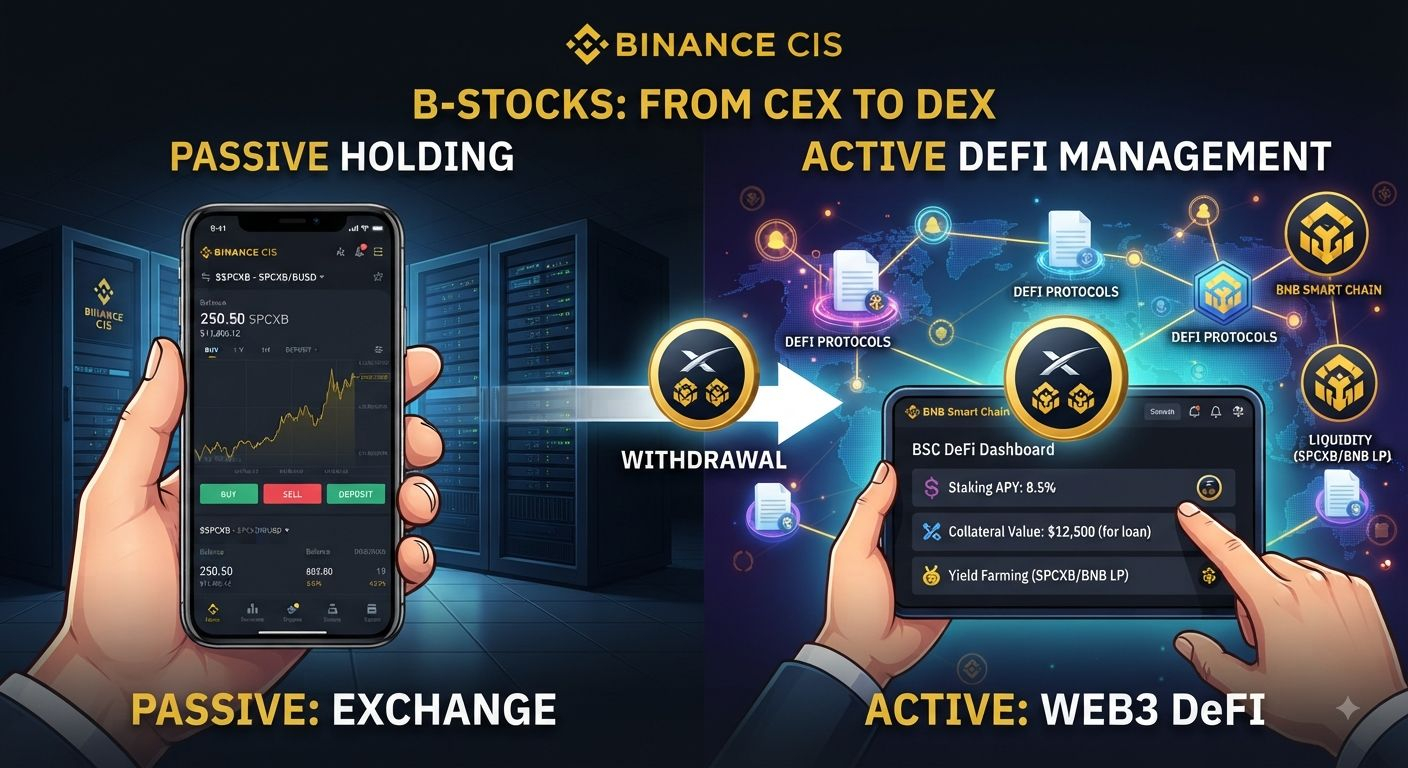
#bstockscis What changes when you withdraw #bstocksсis into a Web3 wallet? It’s not just a change of storage location. In practice, with $SPCXB (a tokenized SpaceX asset), I saw a completely different logic: instead of passively watching a position on an exchange, you gain mobility within the BNB Smart Chain ecosystem.
Since #bstocksсis function as BEP-20 tokens, they go beyond the standard interface. Integration into DeFi scenarios $BNB Chain allows you to use assets not only for ownership, but also as liquidity or collateral. This transforms the classic “buy and hold” strategy into active capital management.
And what about you: do you keep $SPCXB on the exchange or integrate it into the Web3 ecosystem?@BinanceCIS
Since #bstocksсis function as BEP-20 tokens, they go beyond the standard interface. Integration into DeFi scenarios $BNB Chain allows you to use assets not only for ownership, but also as liquidity or collateral. This transforms the classic “buy and hold” strategy into active capital management.
And what about you: do you keep $SPCXB on the exchange or integrate it into the Web3 ecosystem?@BinanceCIS
Andrii Obolon
·
--
#bstockscis Evolution of Access: Why Tokenization of Stocks Changes the Game
At first, I was skeptical about stock tokenization. If the underlying asset remains unchanged, why alter the classic wrapper? However, a closer look at the project #bstockscic helped me shift my focus.
The main value lies not in the change of the asset’s form itself, but in the radical simplification of the path to it. Previously, investors had to adapt to an archaic system:
Rigid trading hours of traditional exchanges.
Chains of intermediaries.
High entry thresholds and minimum amounts.
Tokenization removes these infrastructure barriers. The market turns from a regulated platform into a flexible ecosystem, available at the right moment.
The Psychological Aspect and the Entry Threshold
The ability to buy fractional shares and objectively lower the minimum capital threshold reduces the number of obstacles to getting started. However, technology solves the accessibility issue but does not eliminate the investor’s internal hesitation. Building financial discipline remains a personal task .@BinanceCIS .$SPCXB $NVDAB
At first, I was skeptical about stock tokenization. If the underlying asset remains unchanged, why alter the classic wrapper? However, a closer look at the project #bstockscic helped me shift my focus.
The main value lies not in the change of the asset’s form itself, but in the radical simplification of the path to it. Previously, investors had to adapt to an archaic system:
Rigid trading hours of traditional exchanges.
Chains of intermediaries.
High entry thresholds and minimum amounts.
Tokenization removes these infrastructure barriers. The market turns from a regulated platform into a flexible ecosystem, available at the right moment.
The Psychological Aspect and the Entry Threshold
The ability to buy fractional shares and objectively lower the minimum capital threshold reduces the number of obstacles to getting started. However, technology solves the accessibility issue but does not eliminate the investor’s internal hesitation. Building financial discipline remains a personal task .@BinanceCIS .$SPCXB $NVDAB
Andrii Obolon
·
--
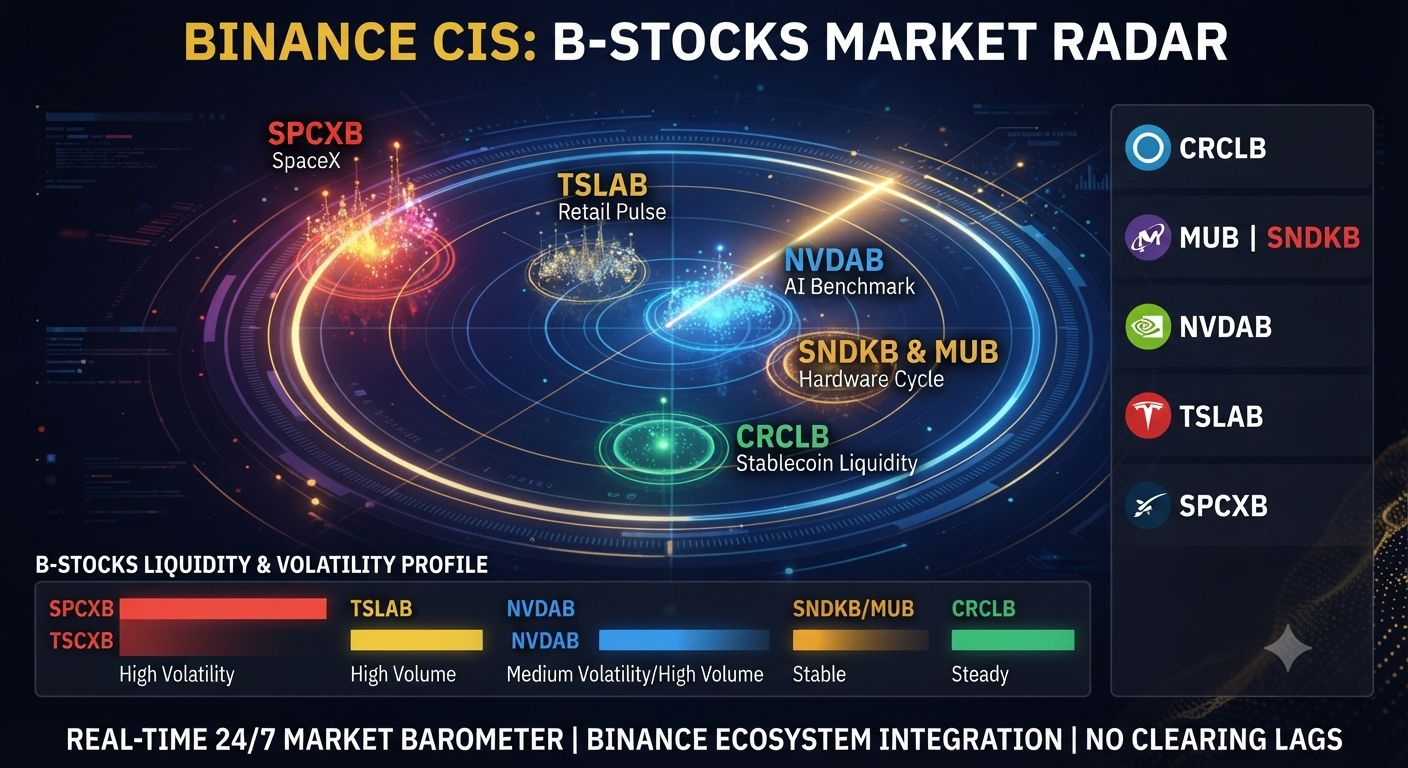
#bstockscis Tokenized Assets (bStocks) as a Market Indicator
bStocks is an operational gauge of market sentiment and trading 24/7 without the delays of traditional clearing systems.
Key signals:
🚀 $SPCXB B (SpaceX): Speculative appetite and appetite for private assets.
⚡ TSLAB (Tesla): Retail’s pulse and reaction to overnight macro news.
🤖 $NVDAB (NVIDIA): A benchmark for interest in the artificial intelligence sector.
💾 $SNDKB & MUB: Rotation indicators into the hardware base.
🪙 CRCLB (Circle): A macro indicator of the stablecoin economy.
Conclusion: Analyzing the bStocks order book lets you see, in real time, the concentration of real capital.
Follow along with updates together with @BinanceCIS
bStocks is an operational gauge of market sentiment and trading 24/7 without the delays of traditional clearing systems.
Key signals:
🚀 $SPCXB B (SpaceX): Speculative appetite and appetite for private assets.
⚡ TSLAB (Tesla): Retail’s pulse and reaction to overnight macro news.
🤖 $NVDAB (NVIDIA): A benchmark for interest in the artificial intelligence sector.
💾 $SNDKB & MUB: Rotation indicators into the hardware base.
🪙 CRCLB (Circle): A macro indicator of the stablecoin economy.
Conclusion: Analyzing the bStocks order book lets you see, in real time, the concentration of real capital.
Follow along with updates together with @BinanceCIS
Andrii Obolon
·
--
#bstockscis 🚀 Algorithmic Cash-Flow: Compound interest made complex in @BinanceCIS #bStockCis
For professional trading, it’s critical to minimize operational risks and eliminate manual routine. The Multiplier smart contract in the @BinanceCIS ecosystem automates reinvestment 24/7, maximizing the CAGR metric through a continuous compound effect.
⚙️ Payout architecture
The protocol automatically withholds 30% tax from dividends, and the remaining net amount is instantly directed to market buybacks of shares.
Unit Economics: A base of 100 tokens generates $200 in dividends. After tax ($60), the net flow of $140 is reinvested, increasing the position to 100.85 tokens. The next cycle runs already on the expanded base (Snowball Effect).
📊 Portfolio matrix @BinanceCIS
Cash-Flow (2–4%): Nokia (NOKB), IBM (IBMB), Goldman Sachs (GSB) — generating stable liquidity.
Blue-Chips (<1.5%): Microsoft (MSFTB), Nvidia (NVDAB), Apple (AAPLB) — fundamental stability.
Growth (R&D): Meta (METAB), SpaceX (SPCXB) — reinvesting profits for a capital upside.
Discussion for the community: Which strategy dominates in your portfolio—steady cash-flow or aggressive growth upside? Share your thoughts in the comments.$SPCXB $METAB $NVDAB
For professional trading, it’s critical to minimize operational risks and eliminate manual routine. The Multiplier smart contract in the @BinanceCIS ecosystem automates reinvestment 24/7, maximizing the CAGR metric through a continuous compound effect.
⚙️ Payout architecture
The protocol automatically withholds 30% tax from dividends, and the remaining net amount is instantly directed to market buybacks of shares.
Unit Economics: A base of 100 tokens generates $200 in dividends. After tax ($60), the net flow of $140 is reinvested, increasing the position to 100.85 tokens. The next cycle runs already on the expanded base (Snowball Effect).
📊 Portfolio matrix @BinanceCIS
Cash-Flow (2–4%): Nokia (NOKB), IBM (IBMB), Goldman Sachs (GSB) — generating stable liquidity.
Blue-Chips (<1.5%): Microsoft (MSFTB), Nvidia (NVDAB), Apple (AAPLB) — fundamental stability.
Growth (R&D): Meta (METAB), SpaceX (SPCXB) — reinvesting profits for a capital upside.
Discussion for the community: Which strategy dominates in your portfolio—steady cash-flow or aggressive growth upside? Share your thoughts in the comments.$SPCXB $METAB $NVDAB

Andrii Obolon
·
--
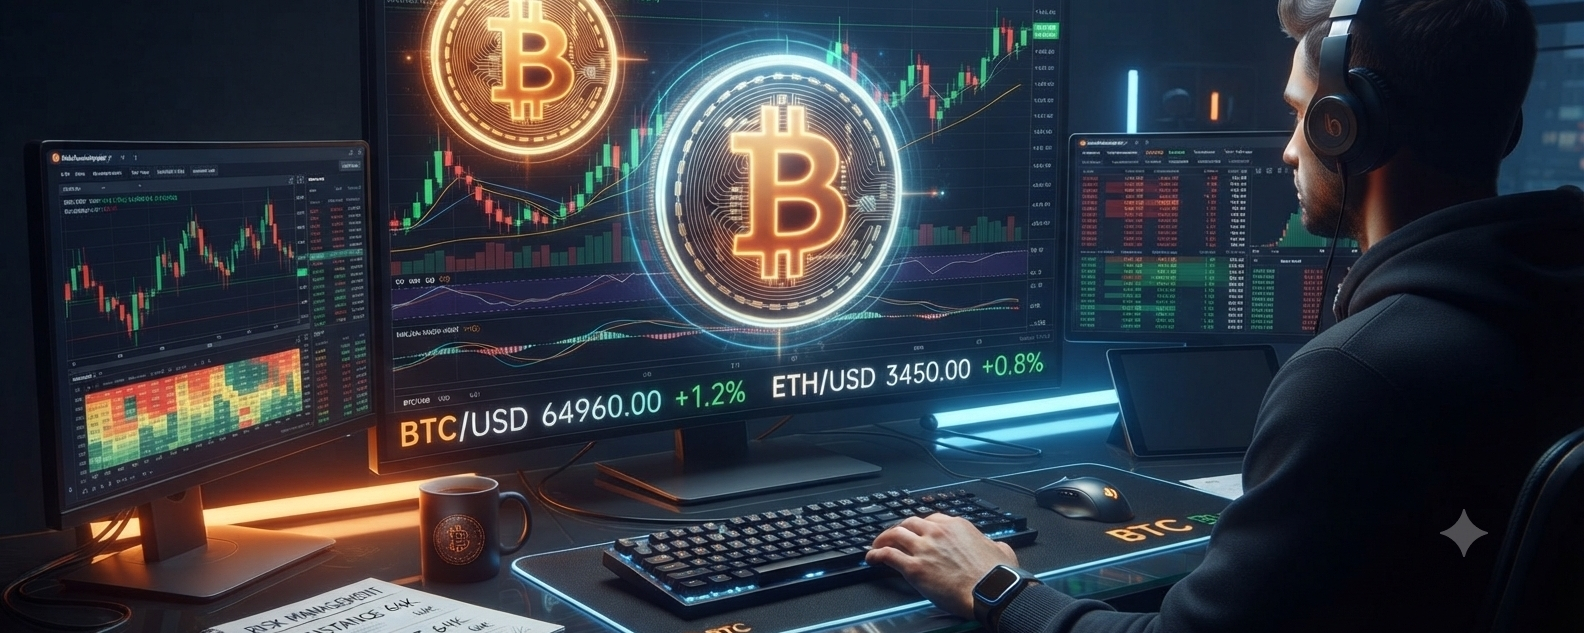
BTC .Please share, comment, and support! Thank you!🤝
🎯 3-Day Price Range Forecast (August 8–11)
Since the weekend is ahead—typically characterized by lower volatility and reduced trading volume on spot markets—the most likely scenario is consolidation within the following corridor:
Expected Range: $63,800 – $66,400
Bull Scenario (Growth): If buyers manage to sustain momentum and consolidate above $65,000 on the daily timeframe, the price will attempt to test the $66,200 – $66,400 range.
Bear Scenario (Correction): In the event of profit-taking by short-term traders, a pullback to the strong support zone of $64,000 – $64,200 is possible. However, a sharp drop below $63,000 is unlikely absent negative macroeconomic news over the weekend.
💡 Trading Recommendations (Futures/Spot)
Weekend Sideways Market: Avoid aggressive leverage over the weekend, as the market may whipsaw positions in both directions within the narrow $64,200 – $65,800 range.
Trading from Levels: The best strategy remains limit-buying near the lower support boundary ($63,900 – $64,200) with a tight stop-loss and taking partial profits closer to $66,000.
👍 Please share, comment, and support the post! Thank you.$BTC $DODOX $ETH
Since the weekend is ahead—typically characterized by lower volatility and reduced trading volume on spot markets—the most likely scenario is consolidation within the following corridor:
Expected Range: $63,800 – $66,400
Bull Scenario (Growth): If buyers manage to sustain momentum and consolidate above $65,000 on the daily timeframe, the price will attempt to test the $66,200 – $66,400 range.
Bear Scenario (Correction): In the event of profit-taking by short-term traders, a pullback to the strong support zone of $64,000 – $64,200 is possible. However, a sharp drop below $63,000 is unlikely absent negative macroeconomic news over the weekend.
💡 Trading Recommendations (Futures/Spot)
Weekend Sideways Market: Avoid aggressive leverage over the weekend, as the market may whipsaw positions in both directions within the narrow $64,200 – $65,800 range.
Trading from Levels: The best strategy remains limit-buying near the lower support boundary ($63,900 – $64,200) with a tight stop-loss and taking partial profits closer to $66,000.
👍 Please share, comment, and support the post! Thank you.$BTC $DODOX $ETH
Andrii Obolon
·
--
BNB . Please share, comment, and support! Thank you!
BNB (Binance Coin) Price Range Analysis and Forecast for the Next 3 Days
As of August 8, 2026, BNB is trading around $592.50, demonstrating steady performance and maintaining its position above the key psychological $580-$590 support zone backed by ongoing ecosystem utility.
Below is a technical overview and the forecasted trading corridor for BNB for the next 3 days (until August 11).
📊 Key Support and Resistance Levels
Resistance 2: $615.00 – $625.00 (major upper target and previous breakout zone).
Resistance 1: $602.00 – $605.00 (immediate hurdle for buyers).
Current Price: ~$592.50
Support 1: $580.00 – $583.00 (recent accumulation base and local pivot level).
Support 2: $565.00 – $570.00 (strong structural floor in case of broader market pullbacks).
🎯 3-Day Price Range Forecast (August 8–11)
With the weekend approaching and overall spot liquidity typically easing, BNB is expected to trade within a relatively contained band while respecting its local moving averages:
Expected Range: $580.00 – $605.00
Bull Scenario (Growth): If buyers sustain momentum above $590 and Bitcoin remains stable, BNB could test the psychological $602 – $605 resistance area. A breakout there opens the path toward $615.
Bear Scenario (Correction): If short-term profit-taking increases, expect a mild dip toward the $580 – $583 support level, where buyers are likely to step back in.
💡 Trading Recommendations (Futures/Spot)
Weekend Range Trading: Given the weekend market conditions, avoid chasing breakouts. Look for smooth bounces between the $583 support and $602 resistance levels.
Spot Accumulation: Gradual scaling near the $580 mark with proper risk management remains a favorable approach for mid-term positioning.
👍 Please share, comment, and support! Thank you!$BNB $SOL $ETH
As of August 8, 2026, BNB is trading around $592.50, demonstrating steady performance and maintaining its position above the key psychological $580-$590 support zone backed by ongoing ecosystem utility.
Below is a technical overview and the forecasted trading corridor for BNB for the next 3 days (until August 11).
📊 Key Support and Resistance Levels
Resistance 2: $615.00 – $625.00 (major upper target and previous breakout zone).
Resistance 1: $602.00 – $605.00 (immediate hurdle for buyers).
Current Price: ~$592.50
Support 1: $580.00 – $583.00 (recent accumulation base and local pivot level).
Support 2: $565.00 – $570.00 (strong structural floor in case of broader market pullbacks).
🎯 3-Day Price Range Forecast (August 8–11)
With the weekend approaching and overall spot liquidity typically easing, BNB is expected to trade within a relatively contained band while respecting its local moving averages:
Expected Range: $580.00 – $605.00
Bull Scenario (Growth): If buyers sustain momentum above $590 and Bitcoin remains stable, BNB could test the psychological $602 – $605 resistance area. A breakout there opens the path toward $615.
Bear Scenario (Correction): If short-term profit-taking increases, expect a mild dip toward the $580 – $583 support level, where buyers are likely to step back in.
💡 Trading Recommendations (Futures/Spot)
Weekend Range Trading: Given the weekend market conditions, avoid chasing breakouts. Look for smooth bounces between the $583 support and $602 resistance levels.
Spot Accumulation: Gradual scaling near the $580 mark with proper risk management remains a favorable approach for mid-term positioning.
👍 Please share, comment, and support! Thank you!$BNB $SOL $ETH

Andrii Obolon
·
--
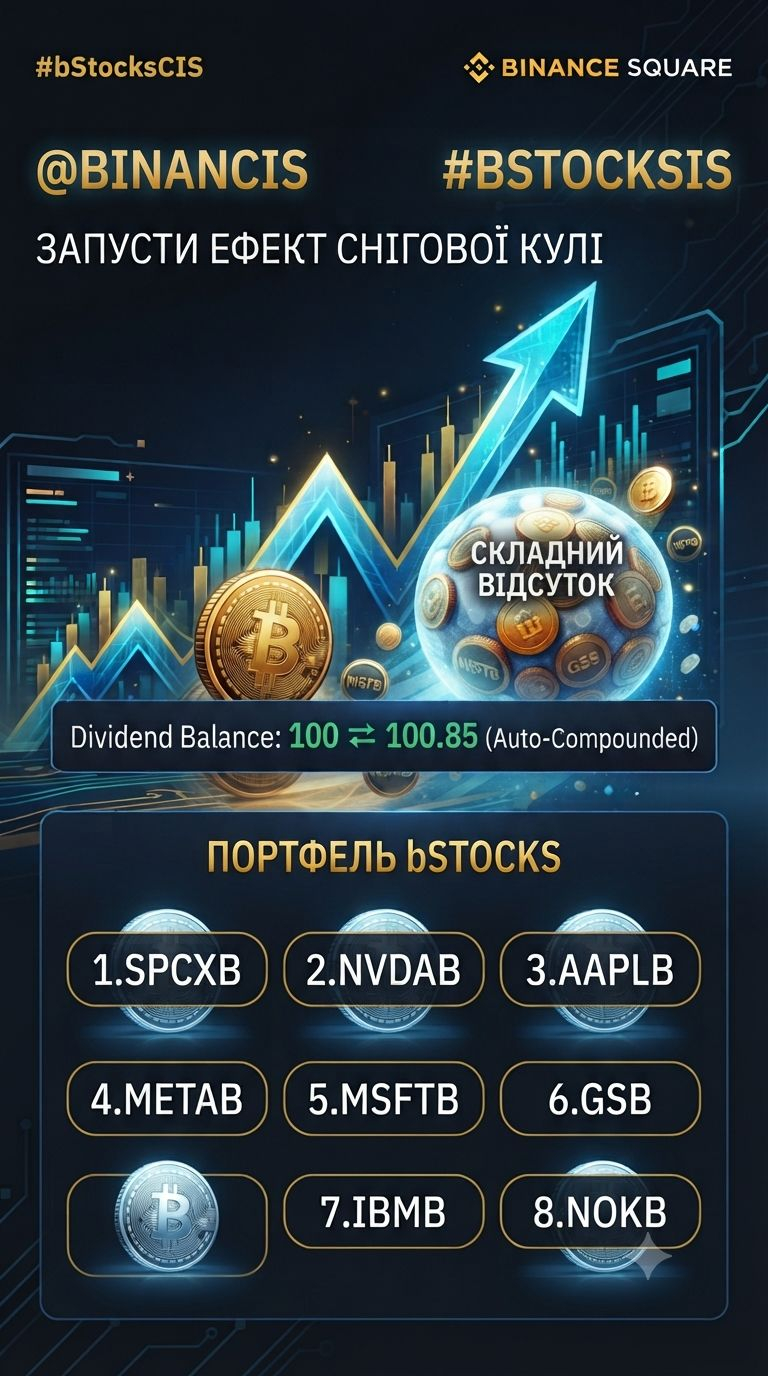
#bstockscis #bstockscis 🚀 The magic of compound interest in @BinanceCIS bStocks: Dividends on autopilot 24/7!
Forget about manual collection of payouts! The Multiplier smart contract from @BinanceCIS does everything for you: after the automatic 30% tax, the net cash flow is instantly reinvested into new shares.
🧮 On your fingertips:
You have 100 tokens → you receive $200 in dividends → after tax you have $140 left → the smart contract buys more shares, and your balance becomes 100.85 tokens. The next payout is already flying on the increased base! The snowball effect is in motion.
📊 Benchmarks for returns from @BinanceCIS :
💸 Flow (2–4%): Nokia (NOKB), IBM (IBMB), Goldman Sachs (GSB).
⚖️ Blue chips (≤1.5%): Microsoft (MSFTB), Nvidia (NVDAB), Apple (AAPLB).
🚀 Dividend growth (%): Meta (METAB), SpaceX (SPCXB) — companies that reinvest all profits into technology, infrastructure expansion, and R&D to maximize future capital.
💬 Which strategy is closer to you—steady cash or aggressive growth? Share in the comments.$SPCXB $NVDAB
Forget about manual collection of payouts! The Multiplier smart contract from @BinanceCIS does everything for you: after the automatic 30% tax, the net cash flow is instantly reinvested into new shares.
🧮 On your fingertips:
You have 100 tokens → you receive $200 in dividends → after tax you have $140 left → the smart contract buys more shares, and your balance becomes 100.85 tokens. The next payout is already flying on the increased base! The snowball effect is in motion.
📊 Benchmarks for returns from @BinanceCIS :
💸 Flow (2–4%): Nokia (NOKB), IBM (IBMB), Goldman Sachs (GSB).
⚖️ Blue chips (≤1.5%): Microsoft (MSFTB), Nvidia (NVDAB), Apple (AAPLB).
🚀 Dividend growth (%): Meta (METAB), SpaceX (SPCXB) — companies that reinvest all profits into technology, infrastructure expansion, and R&D to maximize future capital.
💬 Which strategy is closer to you—steady cash or aggressive growth? Share in the comments.$SPCXB $NVDAB

S E R g g U A
·
--
#bstockscis I couldn’t understand for a long time why you would tokenize shares. It seemed like just pouring water into another bottle. The contents are the same; only the label changes.
But after a few tests, I changed my mind.
It turns out it’s not about the shares themselves. It’s about how people gain access to them.
#bStocks don’t change the stock market. They make it less tied to old rules. You don’t need to wait for the exchange to open in order to react to events. This is a completely different approach to interacting with assets.
Another thing I noted for myself is the ability to buy in parts. You don’t have to invest a large amount right away. You can start small, see how everything works, and only then increase your position.
I’m interested in watching these kinds of changes. Because they show how financial instruments are becoming closer to everyday users.
And now I more and more often think: maybe the biggest barrier to investing isn’t the price of the asset, but the habit of postponing the start “for later.”
@BinanceCIS $SPCXB
#bStocksCis
But after a few tests, I changed my mind.
It turns out it’s not about the shares themselves. It’s about how people gain access to them.
#bStocks don’t change the stock market. They make it less tied to old rules. You don’t need to wait for the exchange to open in order to react to events. This is a completely different approach to interacting with assets.
Another thing I noted for myself is the ability to buy in parts. You don’t have to invest a large amount right away. You can start small, see how everything works, and only then increase your position.
I’m interested in watching these kinds of changes. Because they show how financial instruments are becoming closer to everyday users.
And now I more and more often think: maybe the biggest barrier to investing isn’t the price of the asset, but the habit of postponing the start “for later.”
@BinanceCIS $SPCXB
#bStocksCis


MS Aira
·
--
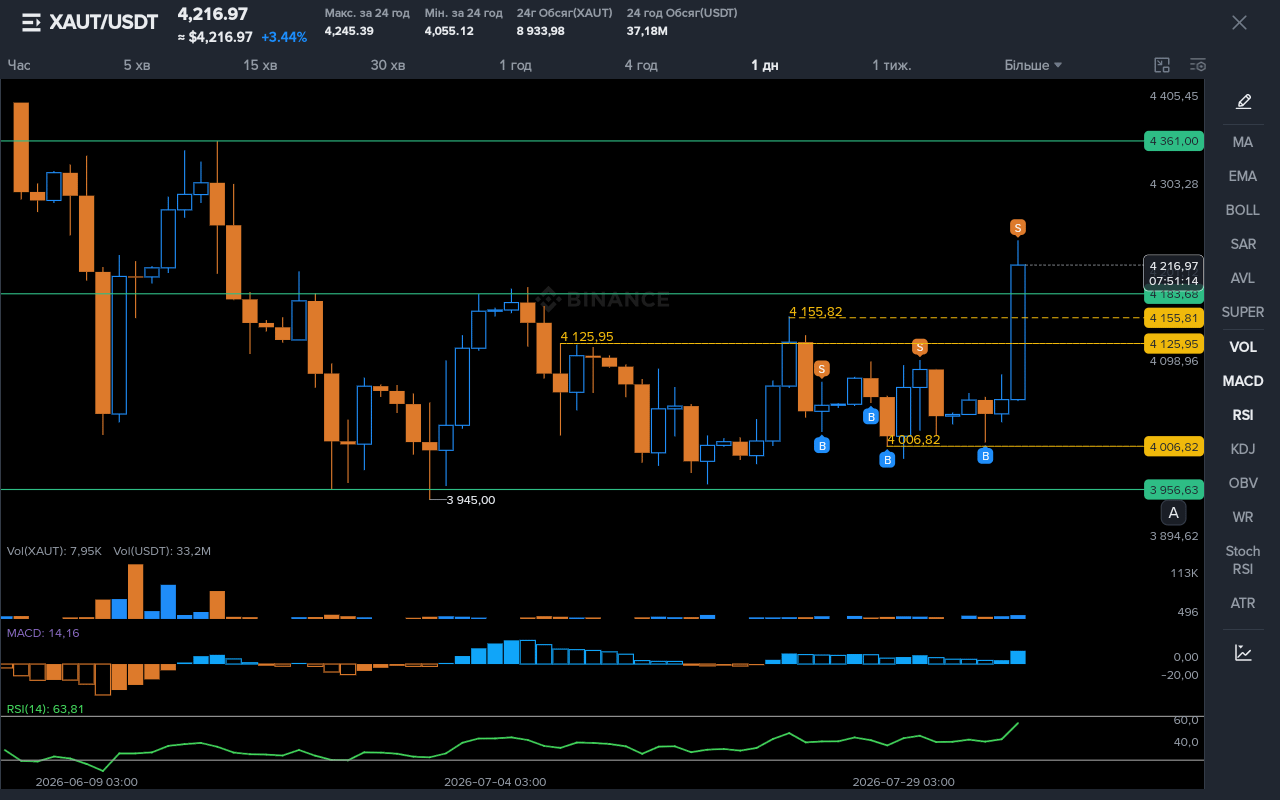
Bullish🟢 $XAUT - demonstrated a powerful bull impulse (+3.44% per day) 💲💰
#XAUT #GOLD #CryptoAnalysis #TechnicalAnalysis #BinanceSquare
#XAUT #GOLD #CryptoAnalysis #TechnicalAnalysis #BinanceSquare
MS Aira
·
--
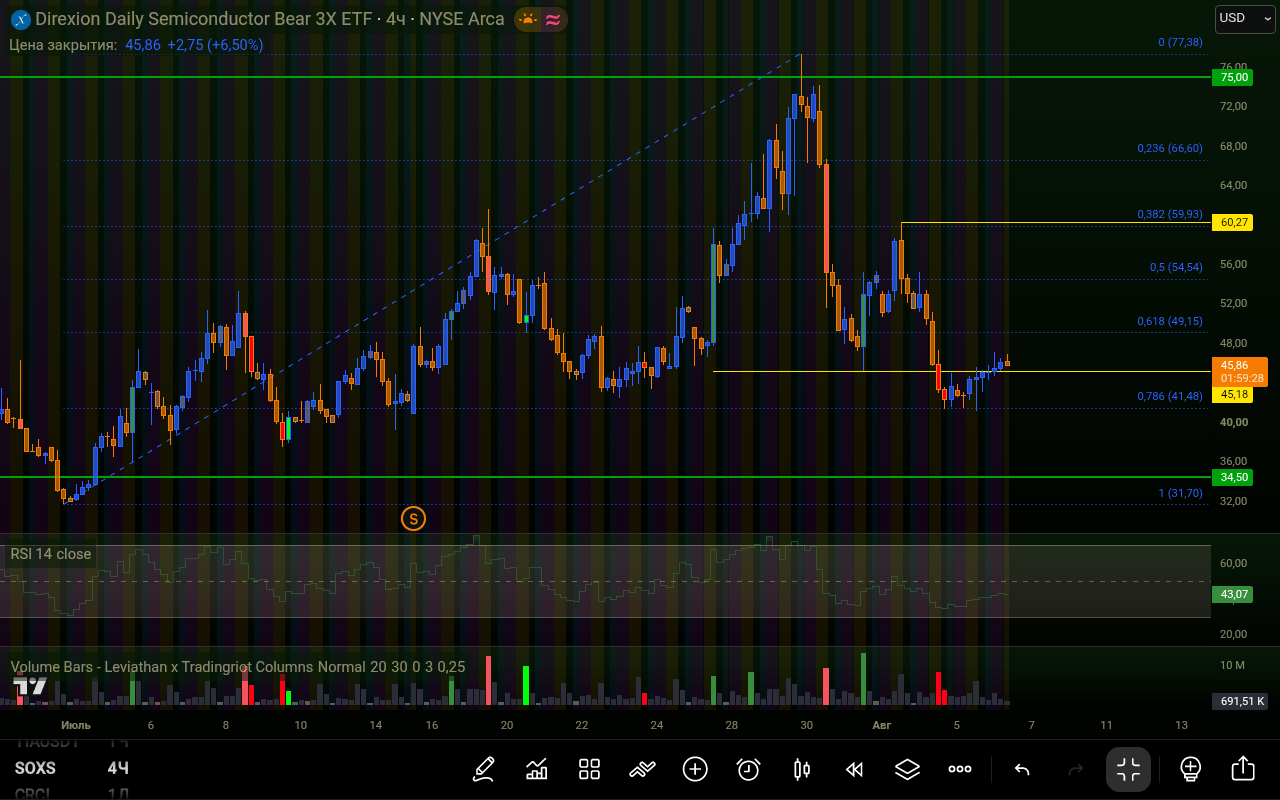
BullishAre you interested in the dynamics of the semiconductor sector and looking for flexible trading tools? A tokenized analogue of SOXS (Direxion Daily Semiconductor Bear 3X Shares) lets you work with the chip market and hedge risks directly on a crypto exchange! 📊
How to get started with bStocks:
• Search: Find bStocks in the Binance Spot Market section (enter the ticker, e.g. $SOXSB /USDT) or in the dedicated bStocks section.
• First trade: Buy with USDT like a regular spot pair, or convert an existing position via direct action 1:1 completely free of charge.
• Availability: No account minimums—only a fractional threshold of just $5!
Thanks @BinanceCIS s for the opportunity to conveniently combine crypto and the stock market! 🚀
#BinanceSquare #crypto #TradingSignal #Investments #bstockscis
How to get started with bStocks:
• Search: Find bStocks in the Binance Spot Market section (enter the ticker, e.g. $SOXSB /USDT) or in the dedicated bStocks section.
• First trade: Buy with USDT like a regular spot pair, or convert an existing position via direct action 1:1 completely free of charge.
• Availability: No account minimums—only a fractional threshold of just $5!
Thanks @BinanceCIS s for the opportunity to conveniently combine crypto and the stock market! 🚀
#BinanceSquare #crypto #TradingSignal #Investments #bstockscis
MS Aira
·
--
Buying SpaceX on the dip. Why are funds panicking, and retail is buying SPCX?
🚀 After the first report, SpaceX shares fell by 13.6% (to $108). A split emerged in the market:
• Funds sell: They were frightened by the enormous costs of artificial intelligence and data centers—more than $18 billion per quarter. Big players fear this will eat into Starlink’s profit. 📉
• Individuals (and I) buy: Only in the first hour after the drop, retail investors snapped up shares worth $22.7 million. We see no losses in investing in II—only the future dominance of the company. Also, the price is now 20% lower than the IPO ($135).📈
• Funds sell: They were frightened by the enormous costs of artificial intelligence and data centers—more than $18 billion per quarter. Big players fear this will eat into Starlink’s profit. 📉
• Individuals (and I) buy: Only in the first hour after the drop, retail investors snapped up shares worth $22.7 million. We see no losses in investing in II—only the future dominance of the company. Also, the price is now 20% lower than the IPO ($135).📈

Andrii Obolon
·
--
HEI.""Please share my posts, thank you!"🤝
🔥 HEI/USDT: Trading Plan and Price Range for 3 Days!
The HEI asset is currently trading around $0.084, sitting in an accumulation phase. To effectively trade this movement and not miss key moments, let's break down a step-by-step plan for the next three days.
📅 Day 1: Accumulation and Testing the First Barriers
On the first day, the main focus is on holding current positions and testing the strength of buyers. The market is forming a base after recent volatility.
Expected Range: $0.080 – $0.090
Main Goal of the Day: Hold the support zone at $0.078 – $0.080 and attempt to test the first resistance at $0.090. If buyers activate here, it will signal the continuation of the local uptrend.
📅 Day 2: Decisive Phase and Breakout Attempt
The second day usually determines the further vector of the short-term trend. During this period, an increase in volatility and approach to key technical barriers are possible.
Expected Range: $0.085 – $0.098
Main Goal of the Day: Aim for an assault on the main resistance at $0.095 – $0.098. A confident breakout of this level on volume will clear the path to higher targets, while a bounce back will return the price to a flat range.
📅 Day 3: Result Fixation and Reaching Peaks
The final day of the three-day cycle, when traders lock in profits on short trades and the market tests the maximum boundaries of the current momentum.
Expected Range: $0.090 – $0.105
Main Goal of the Day: Reach the upper boundary of the range at $0.105 – $0.108 provided the previous days' breakouts are successful. In case of buyer weakness, a transition into stable consolidation is expected.
⚠️ Trading Verdict:
Monitor price reactions at each stage and do not forget about risk management. Control stop-losses below the critical support ($0.074).
Wishing you successful trades and great entries! 📊
💬 Comment, share the post, and leave a tip if this analysis was helpful to you! Your support inspires me to create even more quality content.$HEI $RONIN $BANK
The HEI asset is currently trading around $0.084, sitting in an accumulation phase. To effectively trade this movement and not miss key moments, let's break down a step-by-step plan for the next three days.
📅 Day 1: Accumulation and Testing the First Barriers
On the first day, the main focus is on holding current positions and testing the strength of buyers. The market is forming a base after recent volatility.
Expected Range: $0.080 – $0.090
Main Goal of the Day: Hold the support zone at $0.078 – $0.080 and attempt to test the first resistance at $0.090. If buyers activate here, it will signal the continuation of the local uptrend.
📅 Day 2: Decisive Phase and Breakout Attempt
The second day usually determines the further vector of the short-term trend. During this period, an increase in volatility and approach to key technical barriers are possible.
Expected Range: $0.085 – $0.098
Main Goal of the Day: Aim for an assault on the main resistance at $0.095 – $0.098. A confident breakout of this level on volume will clear the path to higher targets, while a bounce back will return the price to a flat range.
📅 Day 3: Result Fixation and Reaching Peaks
The final day of the three-day cycle, when traders lock in profits on short trades and the market tests the maximum boundaries of the current momentum.
Expected Range: $0.090 – $0.105
Main Goal of the Day: Reach the upper boundary of the range at $0.105 – $0.108 provided the previous days' breakouts are successful. In case of buyer weakness, a transition into stable consolidation is expected.
⚠️ Trading Verdict:
Monitor price reactions at each stage and do not forget about risk management. Control stop-losses below the critical support ($0.074).
Wishing you successful trades and great entries! 📊
💬 Comment, share the post, and leave a tip if this analysis was helpful to you! Your support inspires me to create even more quality content.$HEI $RONIN $BANK

Log in to explore more content