
Web3-良轩Mr蒋
2.3k Posts

Web3-良轩Mr蒋
 Square Verified
14年第一次参与蒂克币DKC挖矿;17年正式钻研投研区块链近7年,二级市场全职分析交易员;经历2轮牛熊,运用裸KK线图,结合西方指标、趋势结构、谐波形态分析当下行情。只有持续不断学习才能提高认知赚到认知内的财富!X:@Mr57814170,专业专注聚焦区块链,我就是下一个Surprise

Traders League Badge Expert
Open Trade

BNB Holder
Frequent Trader
5 Years
22 Following
2.5K+ Followers
18.8K+ Liked
1 Badges
Posts
Portfolio
All
Quotes
Videos
Live
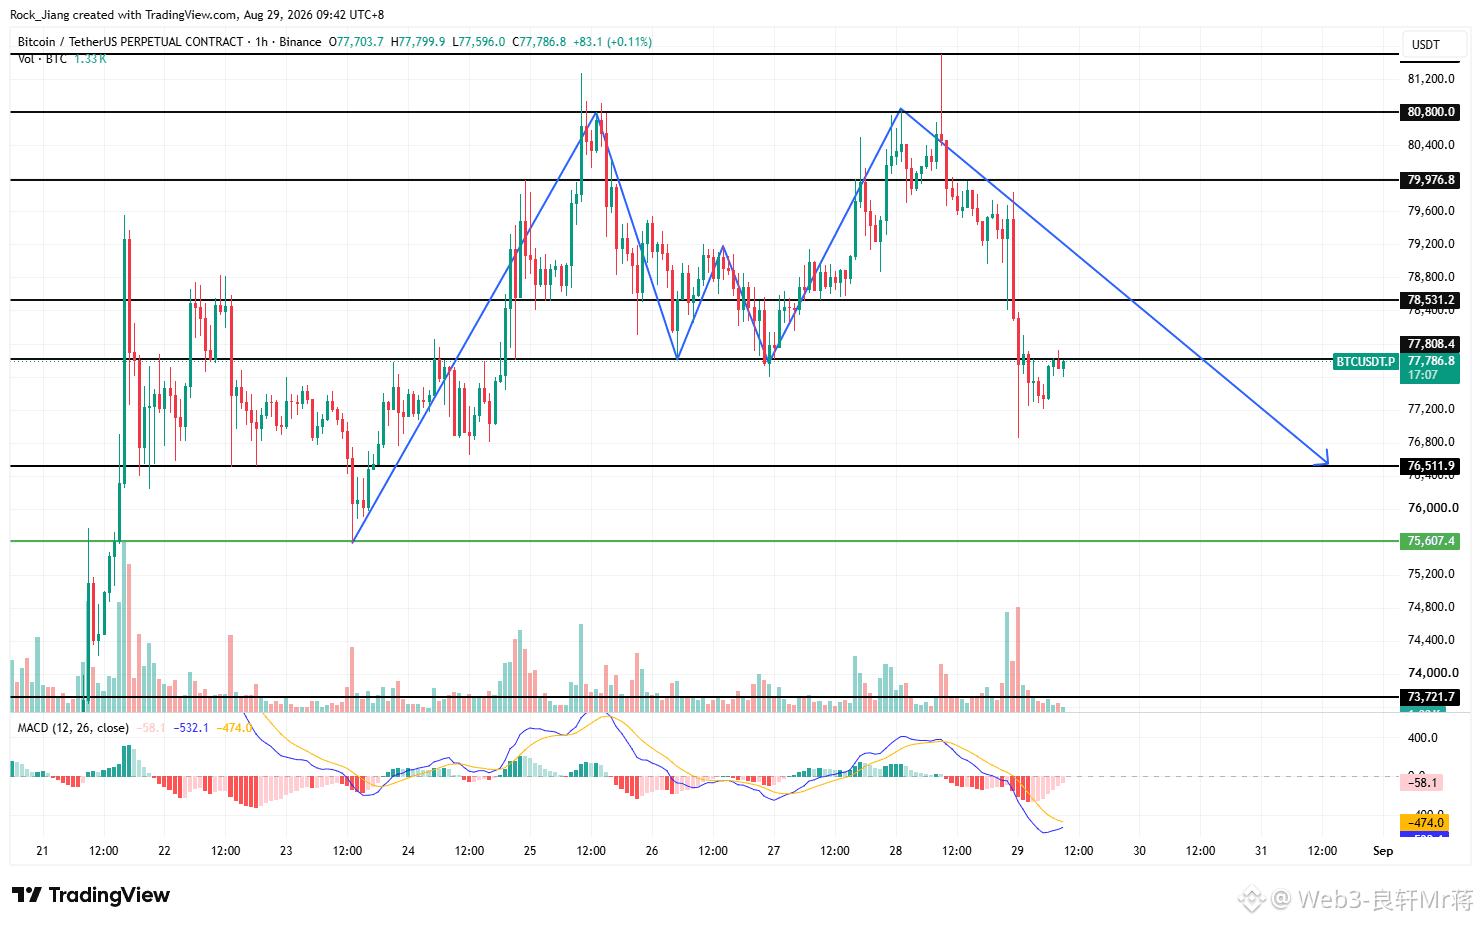
Weekend Morning Market Overview (8.29): The chart is both a W bottom and an M top—WM keeps alternating; can you keep up with it for a few rounds?
This morning, BTC closed with an upper/lower shadow and a large bearish candle. Together with yesterday’s bullish candle, it forms a bearish engulfing pattern (a bearish engulfing that covers the prior bullish candle).
Last night, at a presentation, the Fed/SEC (as mentioned in the text) attended the event where he delivered a hawkish speech at Worsh. He said that high inflation is unfavorable for economic prosperity, and that efforts to find solutions to the inflation problem are still needed.
I also said earlier: if Worsh’s speech turns more hawkish, both the US stock market and crypto could be impacted significantly.
As expected, as of today’s close, the three major US indices all fell: the Dow -0.03%, the Nasdaq -0.47%, and the S&P 500 -0.13%. BTC also pulled back by 2,200 points.
Looking back at the chart: BTC rebounded from the low at 7.56, but met resistance and dropped again at 8.08. Then it completed a W-bottom rebound structure at 7.78. It rebounded once more, but again hit resistance at 8.08, formed an M-top pullback structure, and is now consolidating around 7.78 and repairing.
This continuous setup—rebounding from the W bottom to the M-top pullback—means that if you’ve been following my pace, you’ve basically already taken a few swings back and forth on both sides. Tell me: does it feel comfortable?
From the daily candle close: a bearish engulfing pattern. In the daytime, there may be sideways-to-downward movement. Since weekend liquidity is relatively scarce, MACD has formed a golden cross below the zero line. It may be best to sit tight and watch, or choose a right-side entry.
After a right-side breakout and stabilization above 7.78, go long following the trend; defense at 7.68. Targets: around 7.88 and 7.96, near the tail position around 8.06.
If there is a right-side breakout above 7.78 and then it breaks below support again, follow the trend to go short; defense at 7.85. Targets: around 7.71 and 7.65.
If you happen to pass by, please give a quick follow, like, and comment—it’s the biggest support I can get. Thank you and appreciate it! The above information is only for chart analysis and not for executing trades.
Follow me so you won’t get lost. Every day I’ll bring you the latest information, latest updates, and level/price-point analysis—and if you want your wealth password, remember to follow and like! #沃什称通胀是美联储首要关注 $BTC
This morning, BTC closed with an upper/lower shadow and a large bearish candle. Together with yesterday’s bullish candle, it forms a bearish engulfing pattern (a bearish engulfing that covers the prior bullish candle).
Last night, at a presentation, the Fed/SEC (as mentioned in the text) attended the event where he delivered a hawkish speech at Worsh. He said that high inflation is unfavorable for economic prosperity, and that efforts to find solutions to the inflation problem are still needed.
I also said earlier: if Worsh’s speech turns more hawkish, both the US stock market and crypto could be impacted significantly.
As expected, as of today’s close, the three major US indices all fell: the Dow -0.03%, the Nasdaq -0.47%, and the S&P 500 -0.13%. BTC also pulled back by 2,200 points.
Looking back at the chart: BTC rebounded from the low at 7.56, but met resistance and dropped again at 8.08. Then it completed a W-bottom rebound structure at 7.78. It rebounded once more, but again hit resistance at 8.08, formed an M-top pullback structure, and is now consolidating around 7.78 and repairing.
This continuous setup—rebounding from the W bottom to the M-top pullback—means that if you’ve been following my pace, you’ve basically already taken a few swings back and forth on both sides. Tell me: does it feel comfortable?
From the daily candle close: a bearish engulfing pattern. In the daytime, there may be sideways-to-downward movement. Since weekend liquidity is relatively scarce, MACD has formed a golden cross below the zero line. It may be best to sit tight and watch, or choose a right-side entry.
After a right-side breakout and stabilization above 7.78, go long following the trend; defense at 7.68. Targets: around 7.88 and 7.96, near the tail position around 8.06.
If there is a right-side breakout above 7.78 and then it breaks below support again, follow the trend to go short; defense at 7.85. Targets: around 7.71 and 7.65.
If you happen to pass by, please give a quick follow, like, and comment—it’s the biggest support I can get. Thank you and appreciate it! The above information is only for chart analysis and not for executing trades.
Follow me so you won’t get lost. Every day I’ll bring you the latest information, latest updates, and level/price-point analysis—and if you want your wealth password, remember to follow and like! #沃什称通胀是美联储首要关注 $BTC
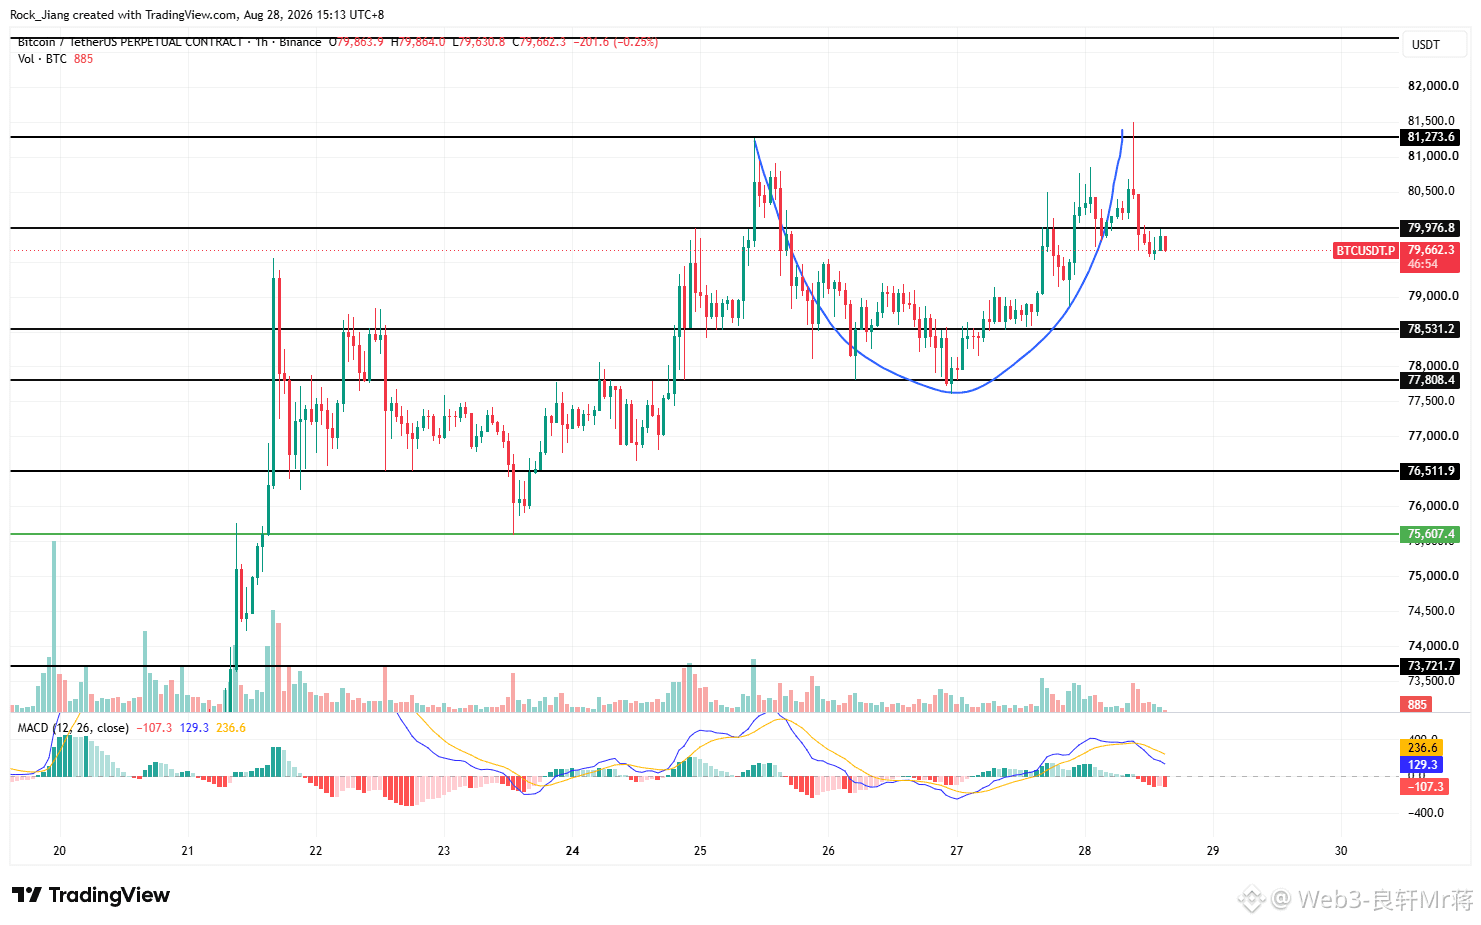
8.28 Market Overview: #BTC long positions closed for a profit of 1,700 points; shorts were stopped out
In the morning, BTC formed an upward-bodied candle with long upper and lower shadows, with bulls and bears repeatedly trading and pulling against each other
Long from 7.78 was laid out in advance. Yesterday morning at 7.88 they reduced exposure, and by the evening at 7.95 they fully exited, taking a profit of 1,700 points; the short positions were stopped out
From the chart, BTC completed a U-shaped bottom rebound at 7.78. The violent morning spike was also to liquidate the short side on high leverage, and then both sides got “blown up” during the subsequent pullback
7.99 has turned from support into resistance—can price manage to reclaim and stand above 80,000 again?
Fed Chair Powell will speak tonight. If the news is positive and BTC holds above 80,000, but if it’s ambiguous and slightly more hawkish, it could be a significant blow to both traditional stocks and crypto
On the 4H timeframe, both the highs and lows are rising. It’s reasonable to wait for a retracement to enter. As for shorting, the idea is to short at high levels after rebounds for a pullback—never short blindly
On the left side, lightly go long at 7.78. Defend at 7.68. Targets are around 7.88 and 7.95. Risk-reward ratio: 1.79 $BTC
If you pass by, please feel free to hit follow, like, and leave a comment—it’s my biggest support. Thank you and I appreciate it! The above information is only for market analysis and not execution advice;
Follow me so you won’t get lost—every day I’ll bring you the latest news, latest updates, and price-level analysis, plus the wealth codes you want. Remember to follow and like and comment! #台股TAIEX受芯片股带动重返46500点 $BTC
In the morning, BTC formed an upward-bodied candle with long upper and lower shadows, with bulls and bears repeatedly trading and pulling against each other
Long from 7.78 was laid out in advance. Yesterday morning at 7.88 they reduced exposure, and by the evening at 7.95 they fully exited, taking a profit of 1,700 points; the short positions were stopped out
From the chart, BTC completed a U-shaped bottom rebound at 7.78. The violent morning spike was also to liquidate the short side on high leverage, and then both sides got “blown up” during the subsequent pullback
7.99 has turned from support into resistance—can price manage to reclaim and stand above 80,000 again?
Fed Chair Powell will speak tonight. If the news is positive and BTC holds above 80,000, but if it’s ambiguous and slightly more hawkish, it could be a significant blow to both traditional stocks and crypto
On the 4H timeframe, both the highs and lows are rising. It’s reasonable to wait for a retracement to enter. As for shorting, the idea is to short at high levels after rebounds for a pullback—never short blindly
On the left side, lightly go long at 7.78. Defend at 7.68. Targets are around 7.88 and 7.95. Risk-reward ratio: 1.79 $BTC
If you pass by, please feel free to hit follow, like, and leave a comment—it’s my biggest support. Thank you and I appreciate it! The above information is only for market analysis and not execution advice;
Follow me so you won’t get lost—every day I’ll bring you the latest news, latest updates, and price-level analysis, plus the wealth codes you want. Remember to follow and like and comment! #台股TAIEX受芯片股带动重返46500点 $BTC
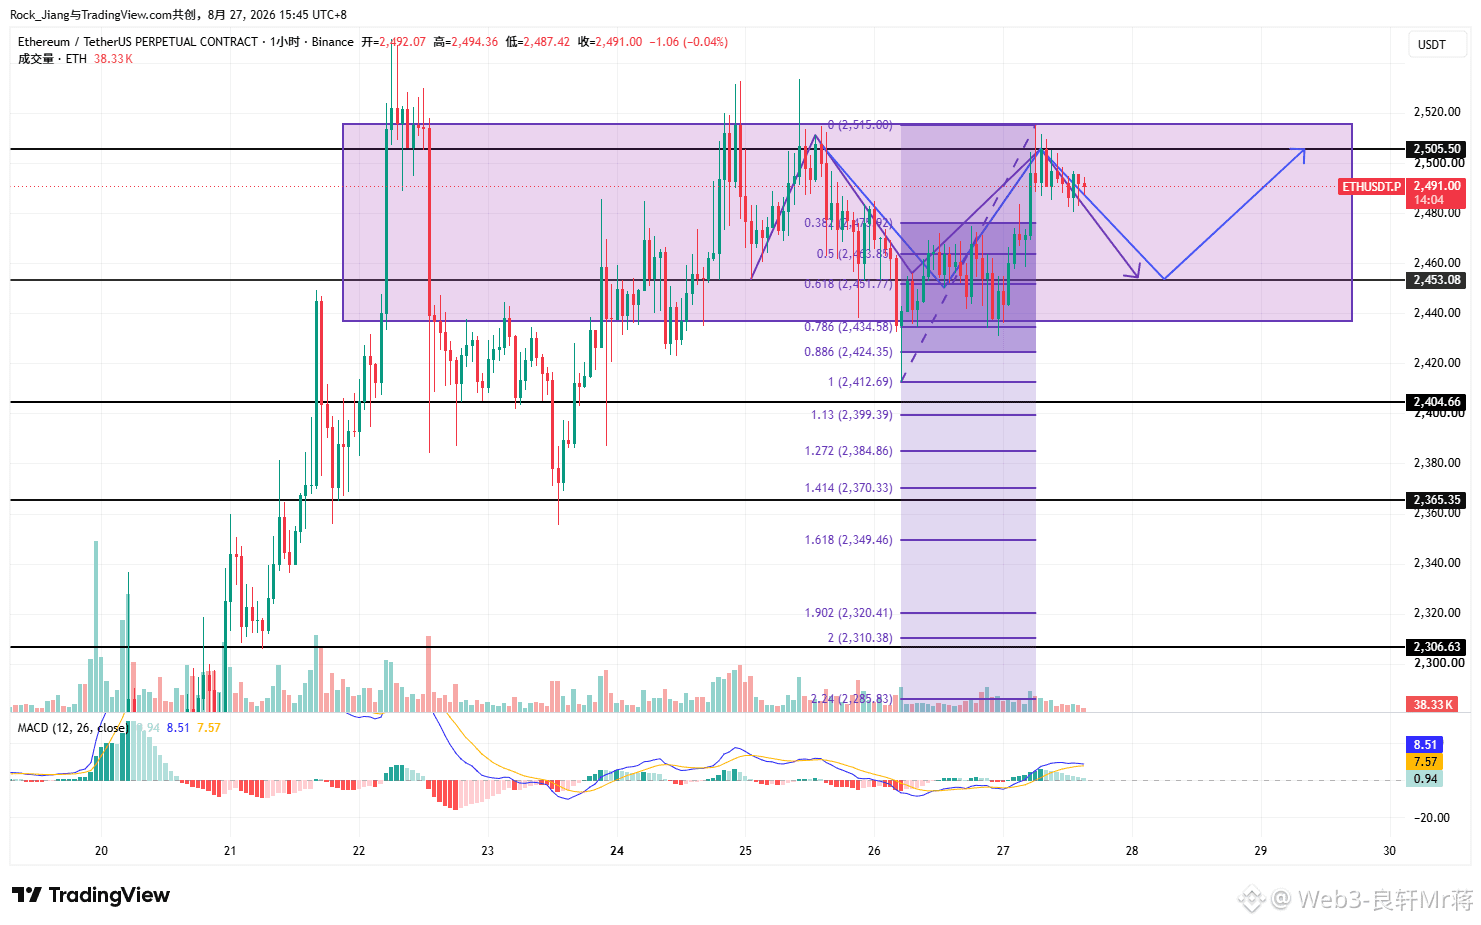
8.27 Market Overview: ETH short positions are in profit; patiently hold and wait for the market to run
ETH yesterday’s left-side 2505 was used to set up a short. It is currently slightly in profit, so keep holding patiently and wait for the market to move.
Reviewing the chart, does ETH have an M-top pullback at 2505, and then subsequently see a rebound from the W-bottom at 2453?
In other words, the M-top and W-bottom keep alternating, forming a typical range-bound box—this is also a familiar range-trading scenario for both long and short traders.
2505 has been touched multiple times but has not produced a valid breakout. With no existing short positions, you can lightly pre-position here. Defense level: 2550 (prior high). Targets: around 2460 and 2410.
From the low to the high, the Fibonacci 0.618 retracement aligns with the 2453 support level, creating a resonance. Repeated retests have not resulted in an effective breakdown.
On the left side, lightly pre-position for a long at 2453. Defense: 2403. Targets: around 2503 and 2532.
If you pass by, please take a moment to follow, like, and comment—it’s the biggest support for me. Thank you and I truly appreciate it! The above information is for market analysis only and does not constitute trade execution;
Follow me so you won’t get lost—every day I’ll bring you the latest information, the newest updates, and level analyses, plus the wealth codes you want. Remember to follow and like! #美元创近四周最大涨幅 $ETH
ETH yesterday’s left-side 2505 was used to set up a short. It is currently slightly in profit, so keep holding patiently and wait for the market to move.
Reviewing the chart, does ETH have an M-top pullback at 2505, and then subsequently see a rebound from the W-bottom at 2453?
In other words, the M-top and W-bottom keep alternating, forming a typical range-bound box—this is also a familiar range-trading scenario for both long and short traders.
2505 has been touched multiple times but has not produced a valid breakout. With no existing short positions, you can lightly pre-position here. Defense level: 2550 (prior high). Targets: around 2460 and 2410.
From the low to the high, the Fibonacci 0.618 retracement aligns with the 2453 support level, creating a resonance. Repeated retests have not resulted in an effective breakdown.
On the left side, lightly pre-position for a long at 2453. Defense: 2403. Targets: around 2503 and 2532.
If you pass by, please take a moment to follow, like, and comment—it’s the biggest support for me. Thank you and I truly appreciate it! The above information is for market analysis only and does not constitute trade execution;
Follow me so you won’t get lost—every day I’ll bring you the latest information, the newest updates, and level analyses, plus the wealth codes you want. Remember to follow and like! #美元创近四周最大涨幅 $ETH
8.27 Morning Market Overview: BTC long T1 took profit 1000 points, break-even loss protection then hold longs to look at T2
BTC this morning closed with a lower shadow and a bullish candle body; the market is ranging upward, forming a long-biased structure
Yesterday morning we mentioned that the pullback from the low to the high at 0.618 and the support at 7.78 formed a resonance point—going long on the pullback is a valid move. The long entry was also a precise “needle” insertion: T1 took profit by 1000 points and exited; with break-even protection, looking at T2 is no problem!
Today is the first day of the Web3 Hong Kong conference. The “every conference brings a drop” curse hasn’t been broken yet. Of course, the market is mainly guided by the chart information; any off-the-track rumors are just for reference.
Price-volume divergence with decreasing volume and rising price indicates that the price-volume supply-demand relationship isn’t成立. The market is slowly rising, still showing a ranging upward structure. For remaining long positions at the tail end, just hold for break-even on T1/T2—keep it as is.
7.99 still has selling pressure. The final exit zone for the longs is also the place to set up a contrarian short.
The 7.78 support has been validated as effective. If there are no longs yet, there’s still an opportunity to pull back and consider entering a long position.
For the left-side setup: go long at 7.78, defense 7.68, targets around 7.88 and 7.95; risk-reward ratio 1.79
For the left-side setup: go short at 7.99, defense at the previous high 8.12, targets around 7.88 and 7.80; risk-reward ratio 1.48
If you’ve stopped by, please quickly like/follow/comment—it’s the biggest support for me. Thank you and I appreciate it! The above information is for chart analysis only and not for trade execution;
Follow me so you won’t get lost—every day I’ll bring you the latest updates, latest developments, and level analysis, plus the wealth code you want. Remember to follow and like, okay! #比特币64亿美元期权将到期 $BTC
BTC this morning closed with a lower shadow and a bullish candle body; the market is ranging upward, forming a long-biased structure
Yesterday morning we mentioned that the pullback from the low to the high at 0.618 and the support at 7.78 formed a resonance point—going long on the pullback is a valid move. The long entry was also a precise “needle” insertion: T1 took profit by 1000 points and exited; with break-even protection, looking at T2 is no problem!
Today is the first day of the Web3 Hong Kong conference. The “every conference brings a drop” curse hasn’t been broken yet. Of course, the market is mainly guided by the chart information; any off-the-track rumors are just for reference.
Price-volume divergence with decreasing volume and rising price indicates that the price-volume supply-demand relationship isn’t成立. The market is slowly rising, still showing a ranging upward structure. For remaining long positions at the tail end, just hold for break-even on T1/T2—keep it as is.
7.99 still has selling pressure. The final exit zone for the longs is also the place to set up a contrarian short.
The 7.78 support has been validated as effective. If there are no longs yet, there’s still an opportunity to pull back and consider entering a long position.
For the left-side setup: go long at 7.78, defense 7.68, targets around 7.88 and 7.95; risk-reward ratio 1.79
For the left-side setup: go short at 7.99, defense at the previous high 8.12, targets around 7.88 and 7.80; risk-reward ratio 1.48
If you’ve stopped by, please quickly like/follow/comment—it’s the biggest support for me. Thank you and I appreciate it! The above information is for chart analysis only and not for trade execution;
Follow me so you won’t get lost—every day I’ll bring you the latest updates, latest developments, and level analysis, plus the wealth code you want. Remember to follow and like, okay! #比特币64亿美元期权将到期 $BTC
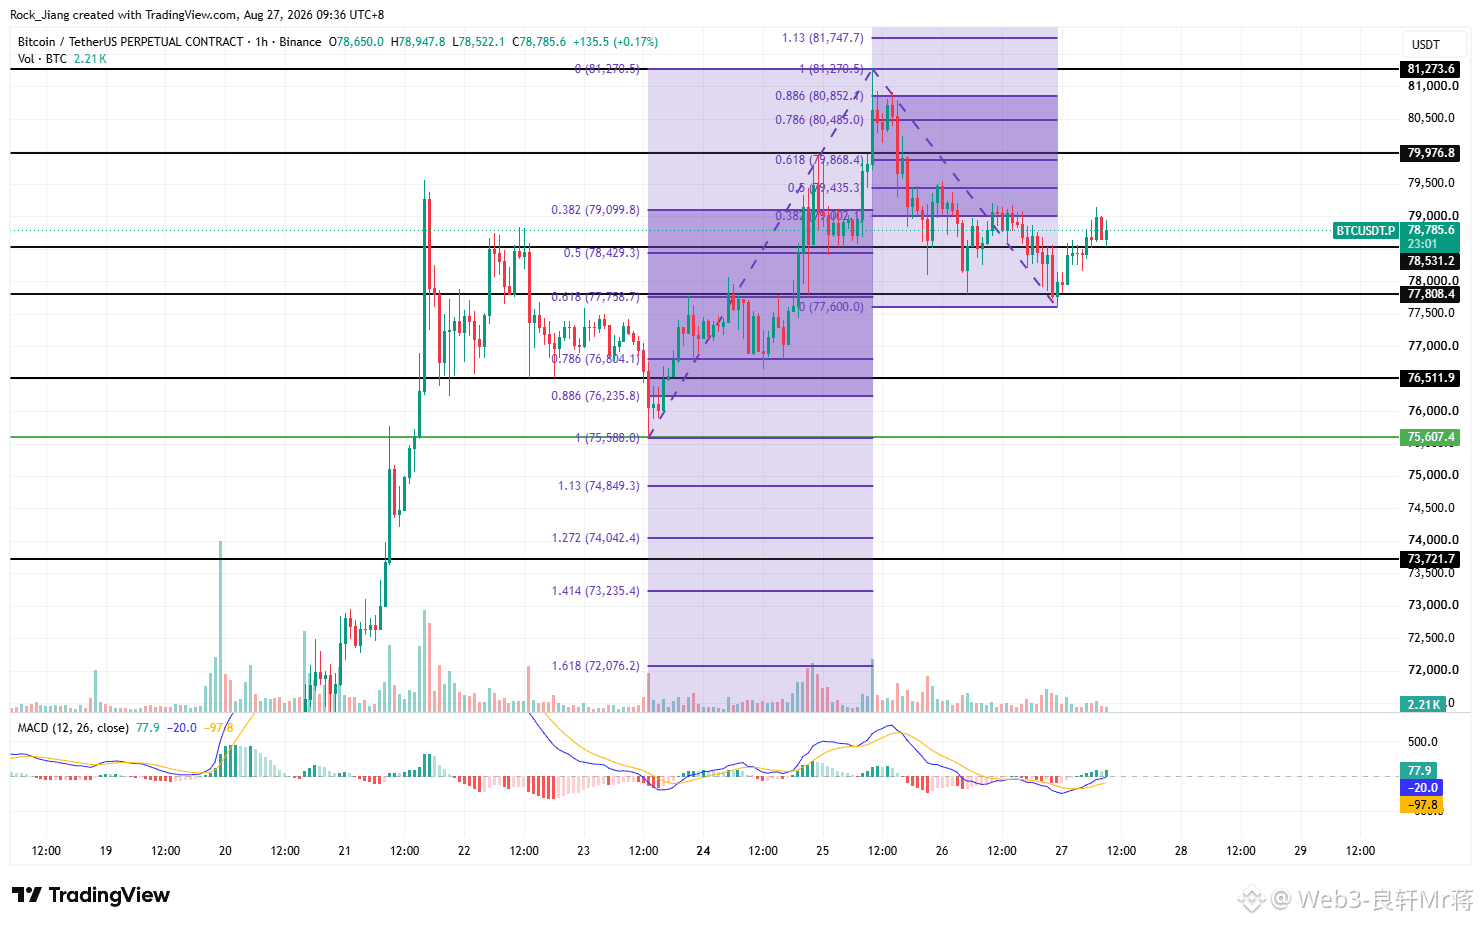
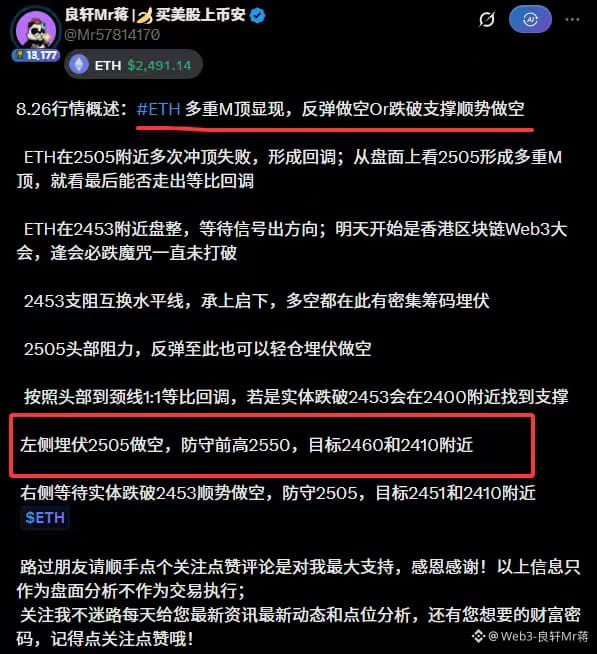
8.26 Market Overview: ETH shows multiple M-top patterns; consider shorting on the rebound or shorting if it breaks below support
ETH repeatedly failed to break through the 2505 area, forming a pullback; from the order book, 2505 has formed multiple M-top patterns—what remains is whether it can print a proportional (ratio-based) retracement
ETH has been consolidating around 2453, waiting for a signal to determine direction; tomorrow marks the start of the Hong Kong Blockchain Web3 conference—every time there’s an event, a “crash curse” seems to hit, and it hasn’t been broken yet
The 2453 line is the key support–resistance swap level; it acts as a pivot—both bulls and bears have dense positions laid there
The 2505 area is the head-side resistance; if the rebound reaches here, you can also place a small short position
According to a 1:1 ratio retracement from the head to the neckline: if the candle body breaks below 2453, support should be found around the 2400 area
Left-side setup: short from around 2505, defend above the recent high at 2550, targets around 2460 and 2410
Right-side setup: wait for the candle body to break below 2453, then short with the trend; defend above 2505, targets around 2451 and 2410
If you’re passing by, please help by giving a follow, like, and comment—it’s my biggest support. Thank you and appreciate it! The information above is for market analysis only and not for executing trades;
Follow me so you won’t get lost—I’ll bring you the latest updates and level analyses every day, plus the wealth “password” you want. Remember to follow and like! #美国财政部设量子就绪工作组 $ETH
ETH repeatedly failed to break through the 2505 area, forming a pullback; from the order book, 2505 has formed multiple M-top patterns—what remains is whether it can print a proportional (ratio-based) retracement
ETH has been consolidating around 2453, waiting for a signal to determine direction; tomorrow marks the start of the Hong Kong Blockchain Web3 conference—every time there’s an event, a “crash curse” seems to hit, and it hasn’t been broken yet
The 2453 line is the key support–resistance swap level; it acts as a pivot—both bulls and bears have dense positions laid there
The 2505 area is the head-side resistance; if the rebound reaches here, you can also place a small short position
According to a 1:1 ratio retracement from the head to the neckline: if the candle body breaks below 2453, support should be found around the 2400 area
Left-side setup: short from around 2505, defend above the recent high at 2550, targets around 2460 and 2410
Right-side setup: wait for the candle body to break below 2453, then short with the trend; defend above 2505, targets around 2451 and 2410
If you’re passing by, please help by giving a follow, like, and comment—it’s my biggest support. Thank you and appreciate it! The information above is for market analysis only and not for executing trades;
Follow me so you won’t get lost—I’ll bring you the latest updates and level analyses every day, plus the wealth “password” you want. Remember to follow and like! #美国财政部设量子就绪工作组 $ETH
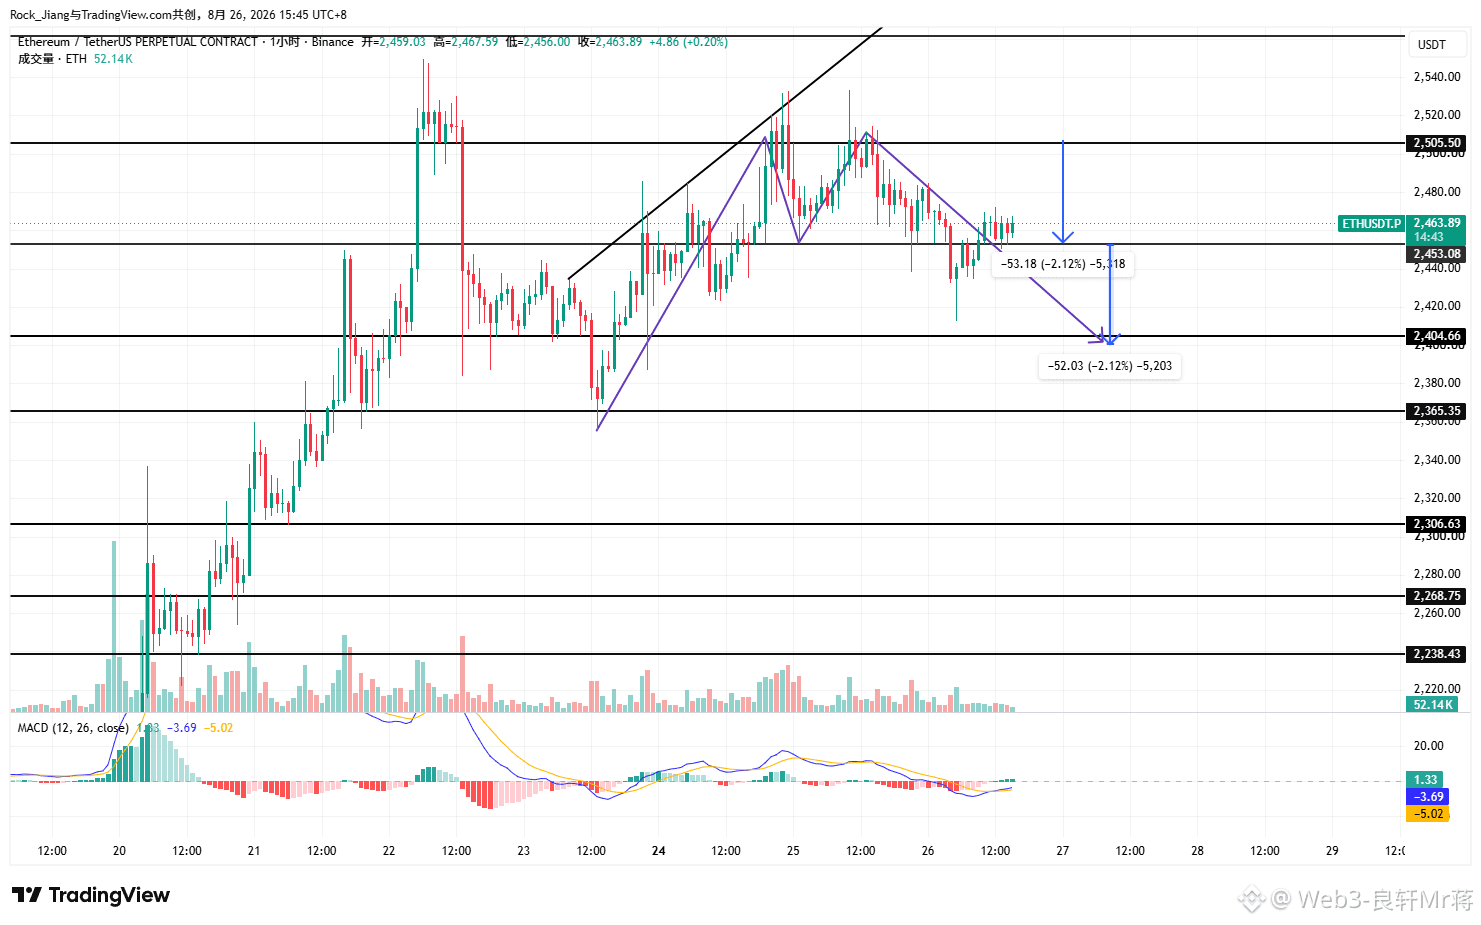
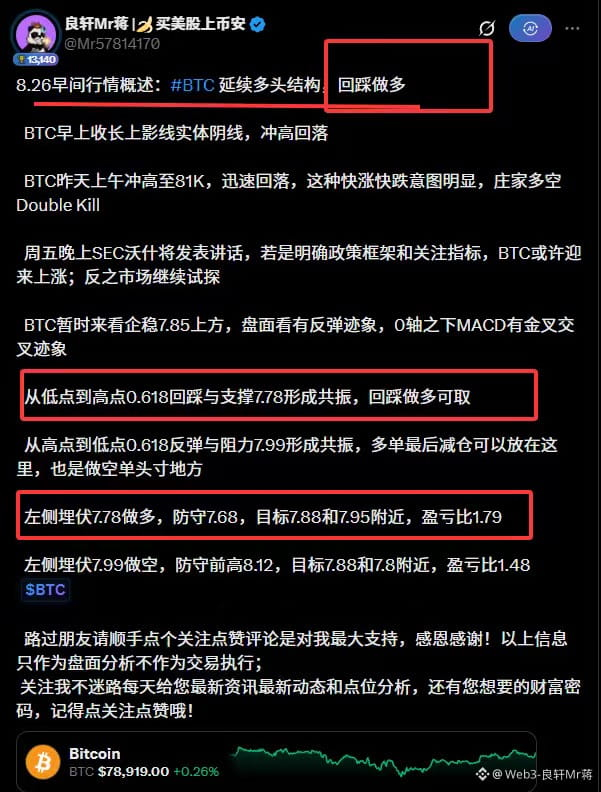
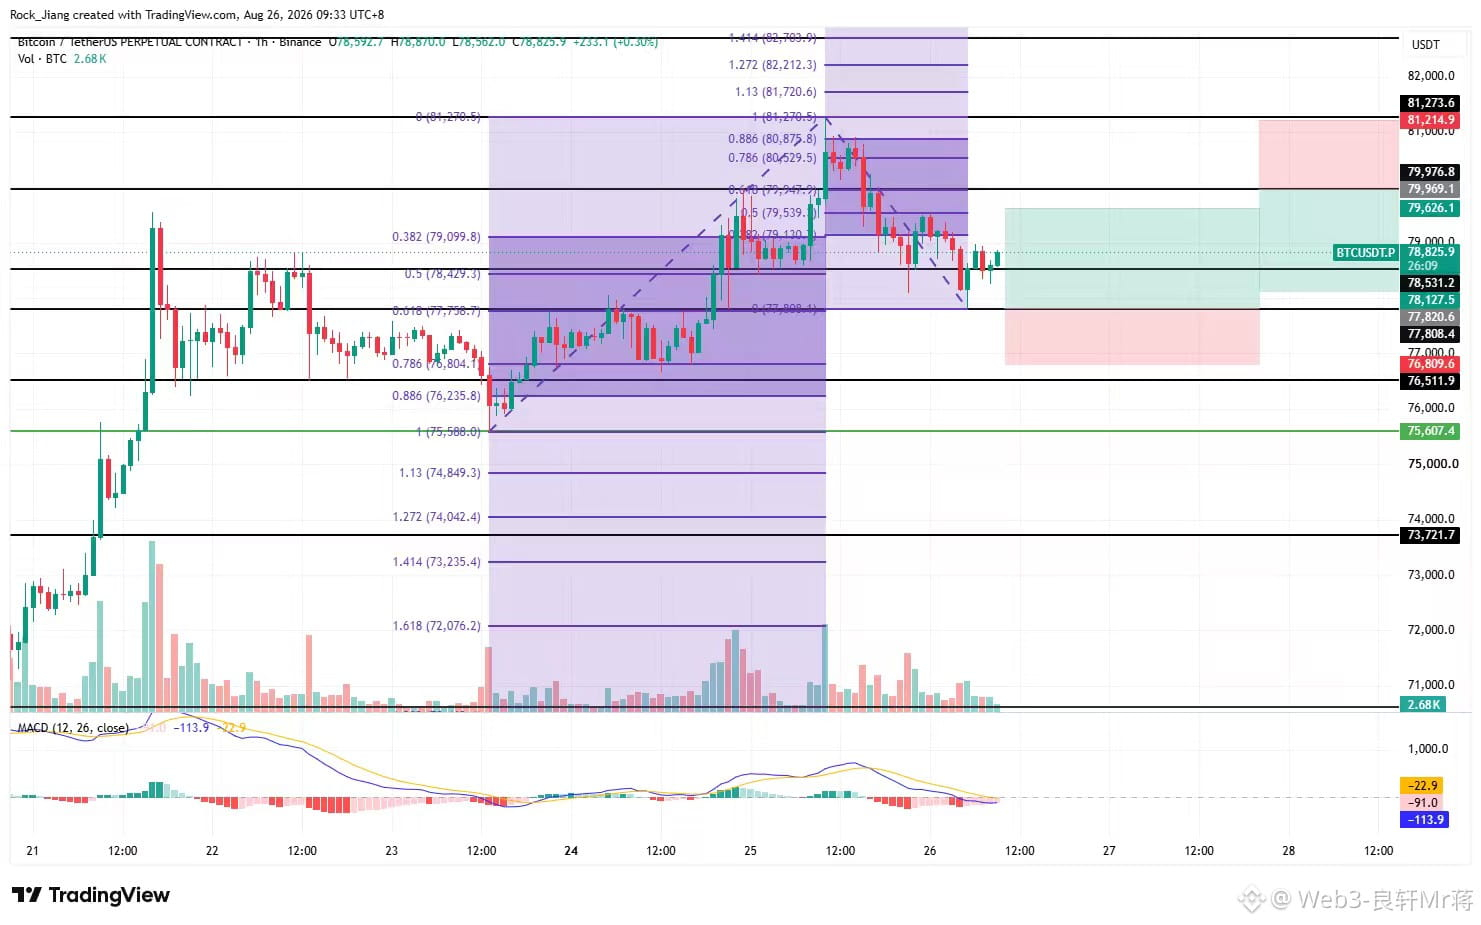
8.26 Morning Market Overview: BTC continues a long-biased structure; buy the pullback
This morning, BTC formed a long upper shadow with a bearish body after rising and then falling back
Yesterday morning BTC surged up to 81K, then quickly pulled back—this kind of fast rally followed by a sharp drop is clearly intent-driven, with a “Double Kill” between longs and shorts by the big player
On Friday night, SEC Chair Gary Gensler will speak. If he clearly states the policy framework and key metrics to watch, BTC may see an upside move; otherwise, the market will continue to probe
For now, BTC appears to have stabilized above 7.85. The chart shows signs of a rebound. Below the zero line, the MACD shows signs of a golden cross
The 0.618 retracement from the low to the high aligns with support at 7.78—this confluence supports buying on the pullback
The 0.618 rebound from the high to the low aligns with resistance at 7.99—this confluence suggests the final reduction of long positions can be placed here; it’s also a good spot to open short positions
Place a long order from the left side at 7.78, with a stop loss at 7.68. Targets are around 7.88 and 7.95. Risk-reward ratio: 1.79
Place a short order from the left side at 7.99, with a stop loss at the prior high at 8.12. Targets are around 7.88 and 7.8. Risk-reward ratio: 1.48
If you’re passing by, please take a moment to follow, like, and comment—it’s the biggest support I can receive. Thank you and much appreciated! The information above is only for chart analysis and is not meant as trading instructions;
Follow me so you won’t get lost. I’ll bring you the latest news, latest developments, and level analysis every day. And also, the wealth code you want—remember to tap follow and like! #比特币受阻于81000美元50周均线 $BTC
This morning, BTC formed a long upper shadow with a bearish body after rising and then falling back
Yesterday morning BTC surged up to 81K, then quickly pulled back—this kind of fast rally followed by a sharp drop is clearly intent-driven, with a “Double Kill” between longs and shorts by the big player
On Friday night, SEC Chair Gary Gensler will speak. If he clearly states the policy framework and key metrics to watch, BTC may see an upside move; otherwise, the market will continue to probe
For now, BTC appears to have stabilized above 7.85. The chart shows signs of a rebound. Below the zero line, the MACD shows signs of a golden cross
The 0.618 retracement from the low to the high aligns with support at 7.78—this confluence supports buying on the pullback
The 0.618 rebound from the high to the low aligns with resistance at 7.99—this confluence suggests the final reduction of long positions can be placed here; it’s also a good spot to open short positions
Place a long order from the left side at 7.78, with a stop loss at 7.68. Targets are around 7.88 and 7.95. Risk-reward ratio: 1.79
Place a short order from the left side at 7.99, with a stop loss at the prior high at 8.12. Targets are around 7.88 and 7.8. Risk-reward ratio: 1.48
If you’re passing by, please take a moment to follow, like, and comment—it’s the biggest support I can receive. Thank you and much appreciated! The information above is only for chart analysis and is not meant as trading instructions;
Follow me so you won’t get lost. I’ll bring you the latest news, latest developments, and level analysis every day. And also, the wealth code you want—remember to tap follow and like! #比特币受阻于81000美元50周均线 $BTC
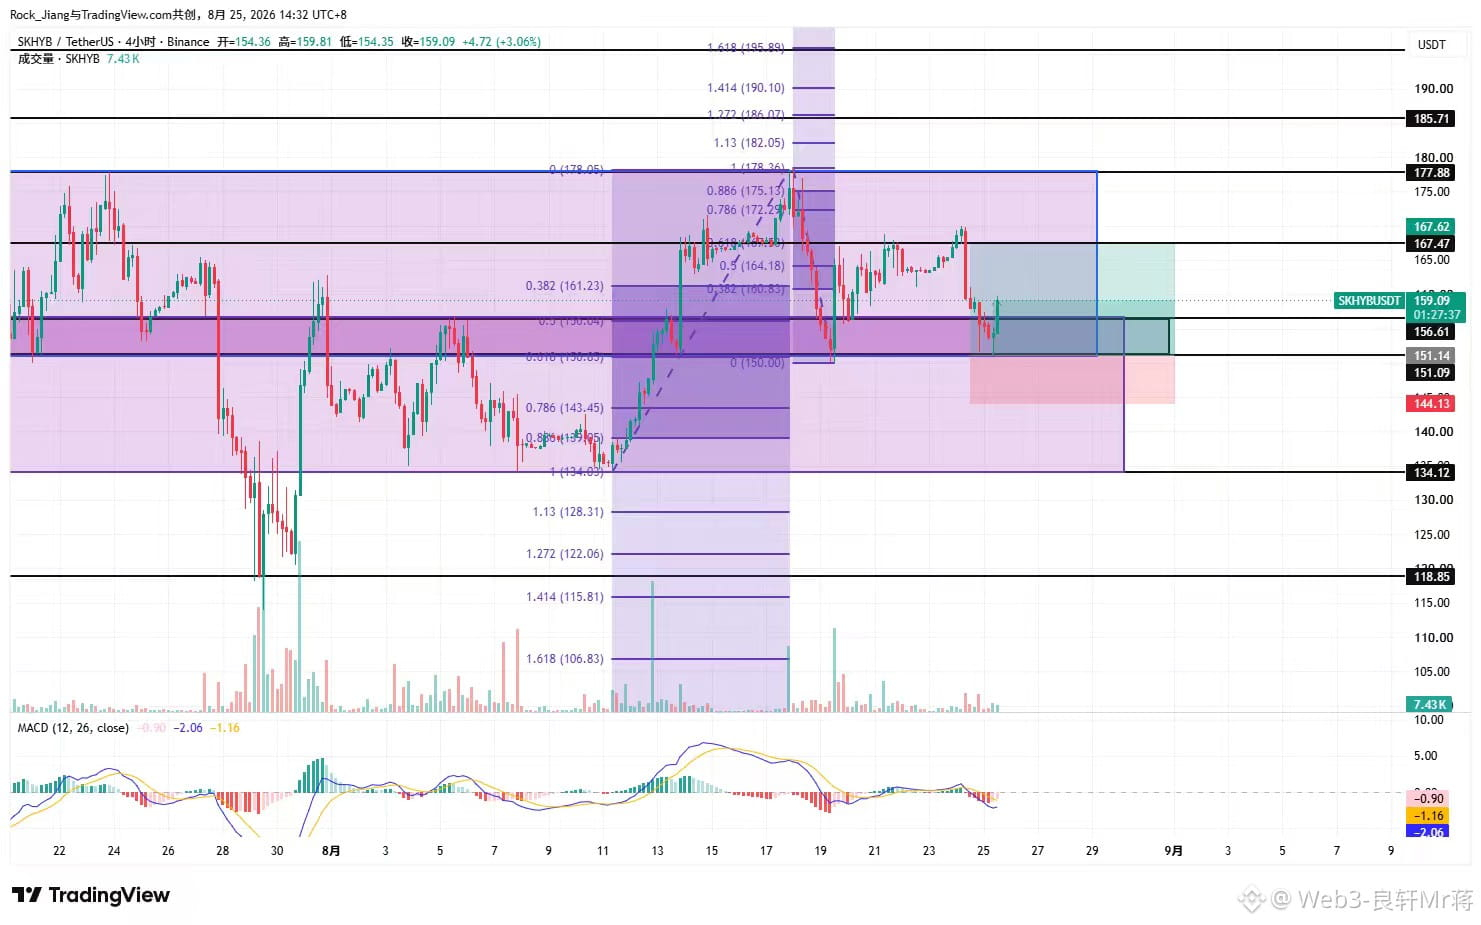
8.25 Market Overview: SKHY Hynix long on T1 captured 7 points, break-even stop loss and watch T2
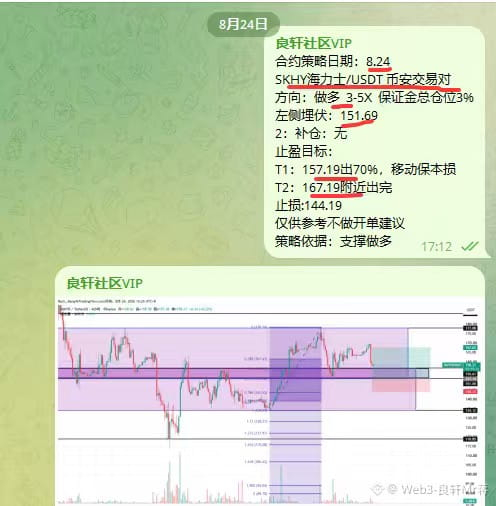
Yesterday, Hynix SKHY set up a long position at support 151.69. The lowest wick dipped to 151.09—entered precisely; now T1 is up by 7 points and we’ve exited. We’re watching T2 with a break-even stop loss.
Hynix has been offering quite a few opportunities lately. When it reaches a key support level, entering decisively on the long side—this is exactly knowing and doing as one.
As I shared in my AMA last night, execution matters most. At key levels, dare to place the trade. Even if you’re wrong, you still need to enter.
I also explained yesterday why we entered long and staged the setup at 151.69: because drawing a Fibonacci retracement of 0.618 from the low to the high lines up perfectly with a two-point resonance at support 151.
So why did we take T2 and exit at 167.19? Also because drawing a Fibonacci rebound of 0.618 from the high to the low meets resistance right at 167.
Of course, 167 can be used as the T2 exit level, or you can set T2 to keep a break-even stop loss here, and then take T3 to the final profit near the 177 high—learn to move your take-profit/stop-profit.
Manage position sizing well, set the trailing/moving take-profit correctly. The rest is simply to let time run the trade slowly. Trading can be that simple: when there’s an opportunity, enter decisively.
If you’re passing by, please hit follow, like, and comment—those are my biggest support. Thank you and I’m grateful! The information above is for chart analysis only and not for trade execution;
Follow me so you don’t get lost—every day I’ll bring you the latest updates, new developments, and price-level analysis. And if you want the wealth codes you’re looking for, remember to follow and like! #BTC触及80000美元 $SKHYB
Yesterday, Hynix SKHY set up a long position at support 151.69. The lowest wick dipped to 151.09—entered precisely; now T1 is up by 7 points and we’ve exited. We’re watching T2 with a break-even stop loss.
Hynix has been offering quite a few opportunities lately. When it reaches a key support level, entering decisively on the long side—this is exactly knowing and doing as one.
As I shared in my AMA last night, execution matters most. At key levels, dare to place the trade. Even if you’re wrong, you still need to enter.
I also explained yesterday why we entered long and staged the setup at 151.69: because drawing a Fibonacci retracement of 0.618 from the low to the high lines up perfectly with a two-point resonance at support 151.
So why did we take T2 and exit at 167.19? Also because drawing a Fibonacci rebound of 0.618 from the high to the low meets resistance right at 167.
Of course, 167 can be used as the T2 exit level, or you can set T2 to keep a break-even stop loss here, and then take T3 to the final profit near the 177 high—learn to move your take-profit/stop-profit.
Manage position sizing well, set the trailing/moving take-profit correctly. The rest is simply to let time run the trade slowly. Trading can be that simple: when there’s an opportunity, enter decisively.
If you’re passing by, please hit follow, like, and comment—those are my biggest support. Thank you and I’m grateful! The information above is for chart analysis only and not for trade execution;
Follow me so you don’t get lost—every day I’ll bring you the latest updates, new developments, and price-level analysis. And if you want the wealth codes you’re looking for, remember to follow and like! #BTC触及80000美元 $SKHYB
8.25 Morning Market Overview: BTC Pullback to Go Long, Follow the Trend
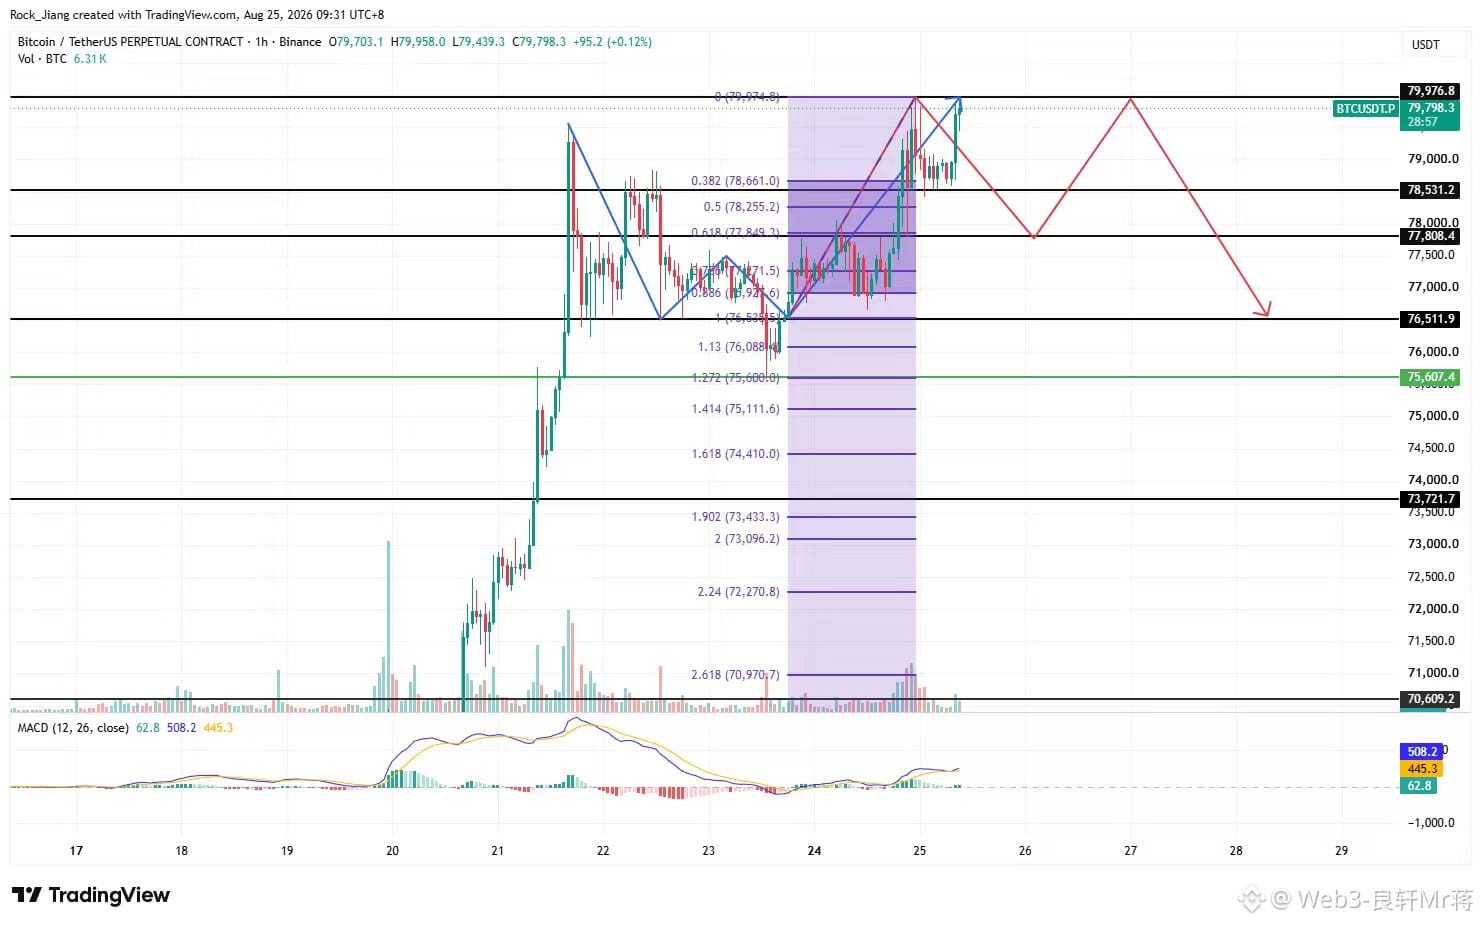
This morning, BTC closed with a long lower wick and an upward-bodied candle; bulls and bears have been battling around the 80k (8W) level.
BTC formed a W double-bottom structure at 7.65, completing a rebound; however, after multiple failed touches of the 80k (8W) level, will it form an M double-top pullback structure at the 7.99 high?
The Fibonacci 0.618 point from the low to the high aligns perfectly with support at 7.78, creating a two-point resonance and confirming the support is valid.
If the price indeed forms the M-top structure, the market will pull back to 7.78, then rebound up to the high at 7.99.
Of course, all of this is based on the assumption that BTC will not break above 80k; it will top out, pull back, and then bounce again from support. If it breaks through, then everything changes.
Actually, right now neither chasing longs nor taking shorts is suitable. If you can’t read the market, the best option is to stay in cash and wait. I choose to stay sidelined/observe for now, either for BTC or by switching to a different channel—I'll make a decision after looking at a trading pair that I'm familiar with.
If you pass by, please like, comment, and follow—it's my biggest support. Thank you and I appreciate it. The information above is for chart analysis only and not for executing trades;
Follow me so you won’t get lost—every day I’ll bring you the latest information, newest developments, and price-level analysis. And for the wealth code you want—remember to follow, like, and tap the heart! #BTC触及80000美元 $BTC
This morning, BTC closed with a long lower wick and an upward-bodied candle; bulls and bears have been battling around the 80k (8W) level.
BTC formed a W double-bottom structure at 7.65, completing a rebound; however, after multiple failed touches of the 80k (8W) level, will it form an M double-top pullback structure at the 7.99 high?
The Fibonacci 0.618 point from the low to the high aligns perfectly with support at 7.78, creating a two-point resonance and confirming the support is valid.
If the price indeed forms the M-top structure, the market will pull back to 7.78, then rebound up to the high at 7.99.
Of course, all of this is based on the assumption that BTC will not break above 80k; it will top out, pull back, and then bounce again from support. If it breaks through, then everything changes.
Actually, right now neither chasing longs nor taking shorts is suitable. If you can’t read the market, the best option is to stay in cash and wait. I choose to stay sidelined/observe for now, either for BTC or by switching to a different channel—I'll make a decision after looking at a trading pair that I'm familiar with.
If you pass by, please like, comment, and follow—it's my biggest support. Thank you and I appreciate it. The information above is for chart analysis only and not for executing trades;
Follow me so you won’t get lost—every day I’ll bring you the latest information, newest developments, and price-level analysis. And for the wealth code you want—remember to follow, like, and tap the heart! #BTC触及80000美元 $BTC
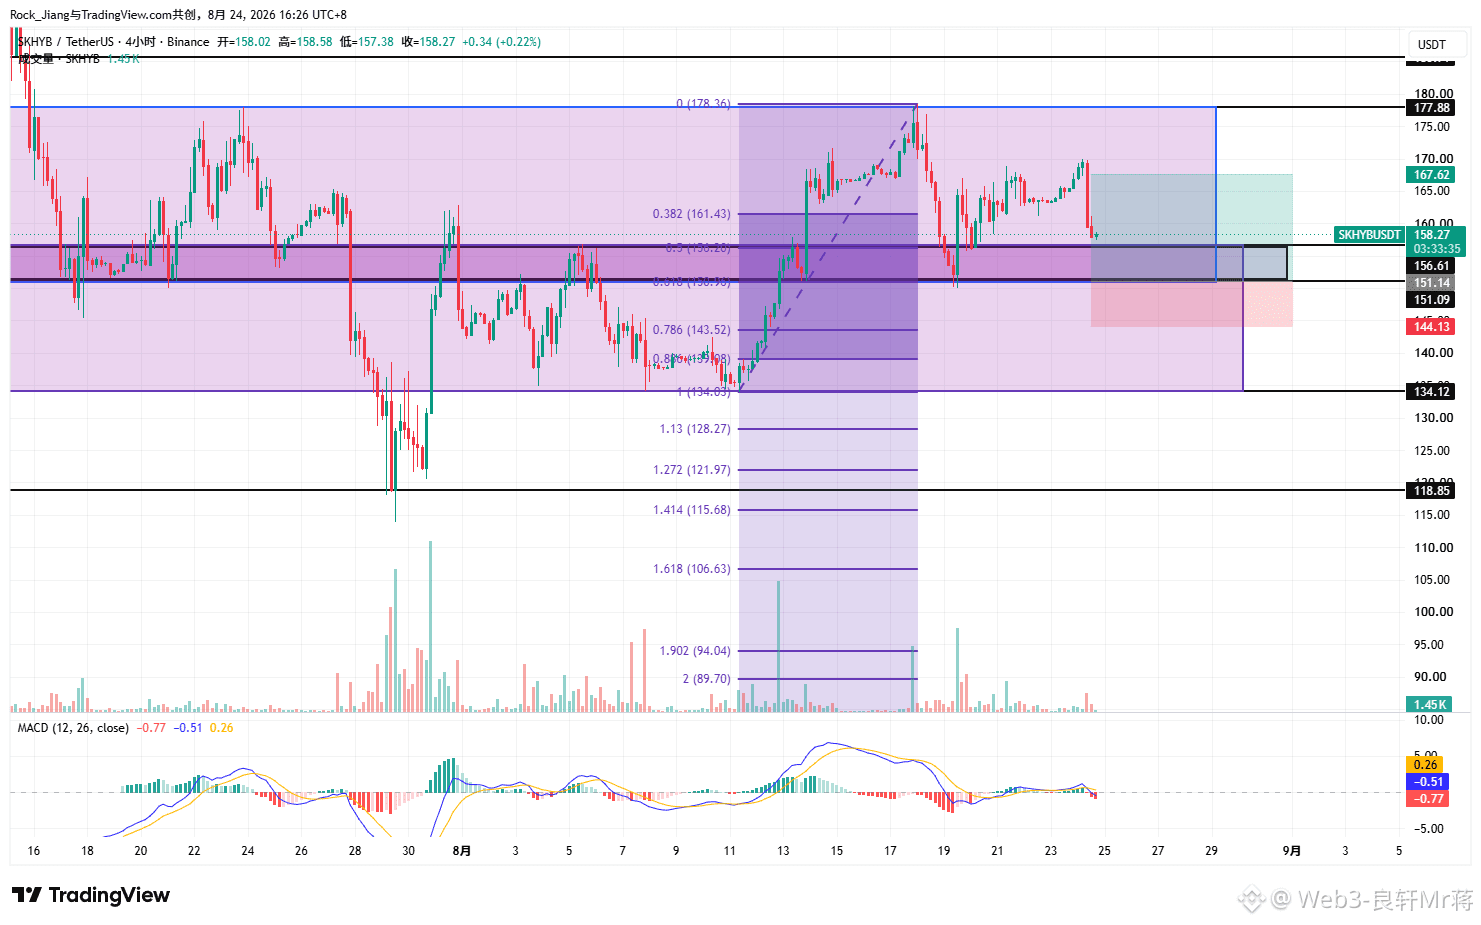
8.24 Monday Market Overview: Hynix SK H Y is moving in a range; buy on pullbacks from the bottom support
Before the open, Hynix is down 3.5%. After the U.S. stock market opens, we’ll see what direction Hynix gives
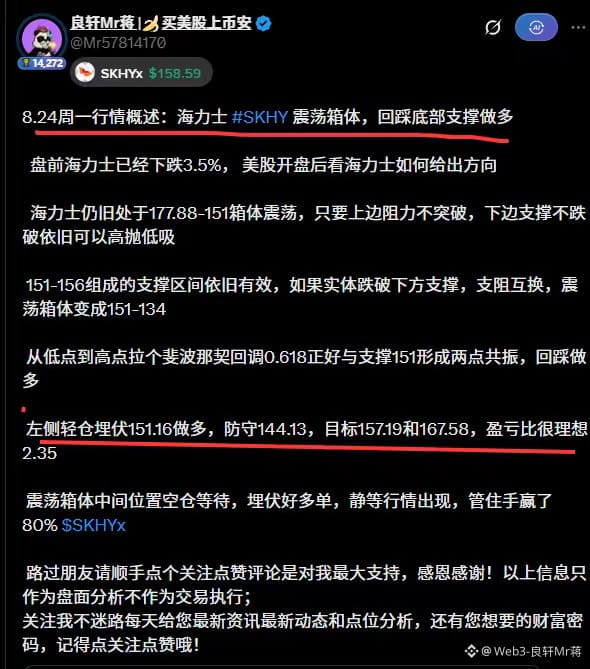
Hynix is still trading in the 177.88–151 range. As long as the upper resistance is not broken and the lower support does not fall, high-sell/low-buy opportunities remain valid
The support zone formed by 151–156 remains effective. If a candle body breaks below the lower support, support and resistance switch roles, and the trading range shifts to 151–134
Pull a Fibonacci retracement from the low to the high: the 0.618 level lines up exactly with support at 151, creating a two-point resonance—buy on the pullback
Enter a light long position at 151.16 from the left side; defense at 144.13; targets at 157.19 and 167.58. The risk/reward ratio is very attractive at 2.35
In the middle of the trading range, stay flat and wait. Set orders in advance, then calmly wait for the market to show up. Control your hands—you win 80%
If you pass by, please tap to follow, like, and comment—those are my biggest support. Thank you and appreciate it! The information above is only for chart analysis and not for executing trades;
Follow me so you won’t get lost. I provide you with the latest information, updates, and level analysis every day, and the wealth codes you want—remember to follow and like! $SKHYB
#布伦特原油跌1.87%
Before the open, Hynix is down 3.5%. After the U.S. stock market opens, we’ll see what direction Hynix gives
Hynix is still trading in the 177.88–151 range. As long as the upper resistance is not broken and the lower support does not fall, high-sell/low-buy opportunities remain valid
The support zone formed by 151–156 remains effective. If a candle body breaks below the lower support, support and resistance switch roles, and the trading range shifts to 151–134
Pull a Fibonacci retracement from the low to the high: the 0.618 level lines up exactly with support at 151, creating a two-point resonance—buy on the pullback
Enter a light long position at 151.16 from the left side; defense at 144.13; targets at 157.19 and 167.58. The risk/reward ratio is very attractive at 2.35
In the middle of the trading range, stay flat and wait. Set orders in advance, then calmly wait for the market to show up. Control your hands—you win 80%
If you pass by, please tap to follow, like, and comment—those are my biggest support. Thank you and appreciate it! The information above is only for chart analysis and not for executing trades;
Follow me so you won’t get lost. I provide you with the latest information, updates, and level analysis every day, and the wealth codes you want—remember to follow and like! $SKHYB
#布伦特原油跌1.87%
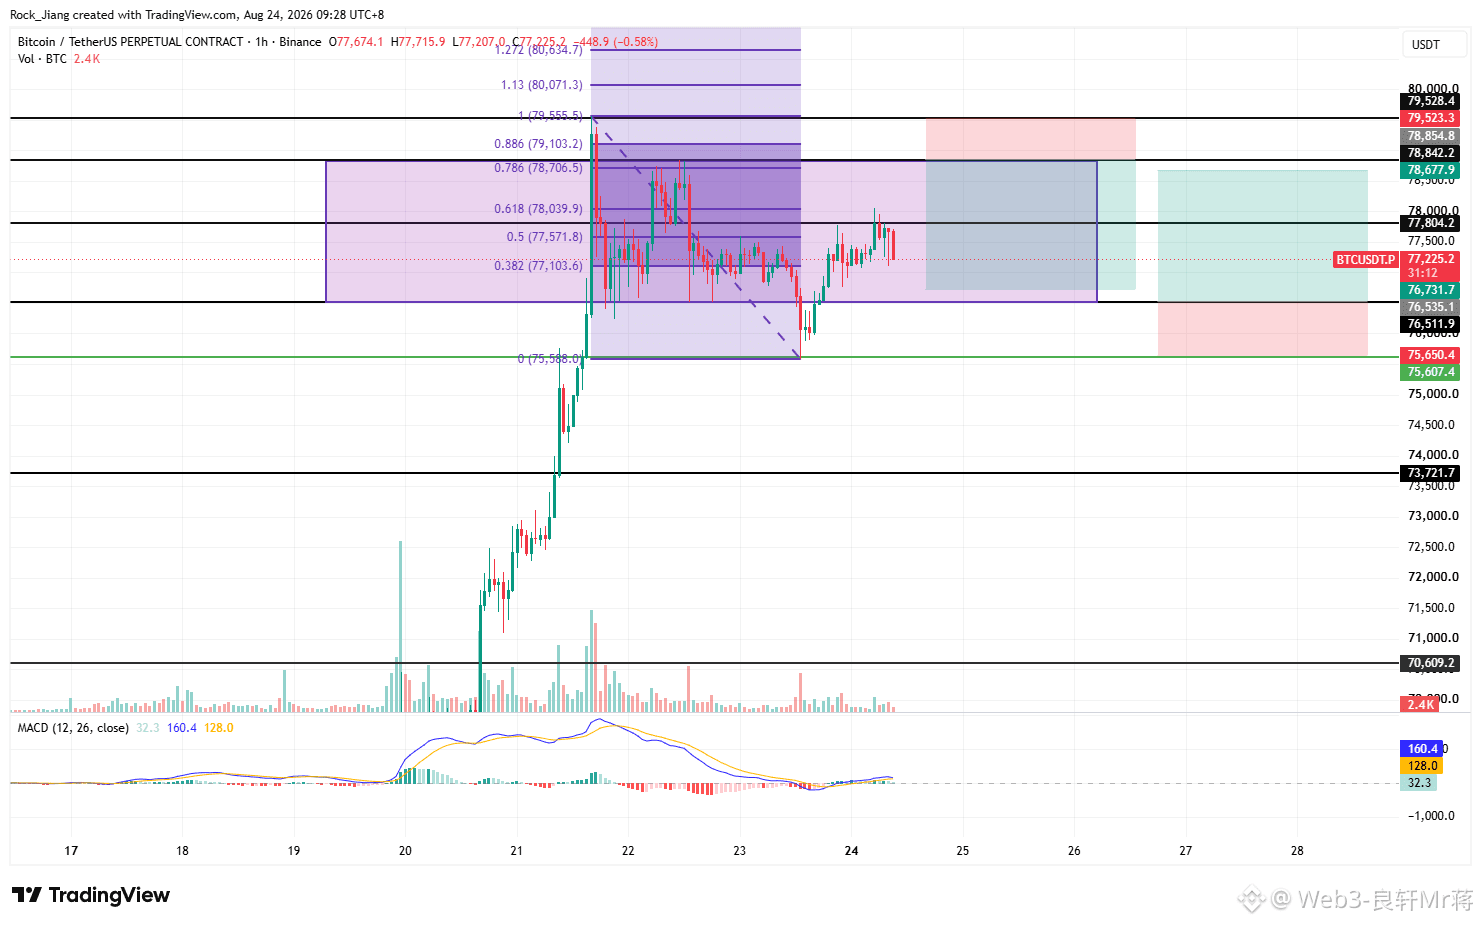
8.24 Monday Morning Market Overview: BTC is showing a ranging box pattern. High-sell low-buy with defensive tactics
This morning, BTC closed with a long lower wick and a bullish candlestick. The weekly close formed a strong-bodied bullish candle. The week’s gain exceeded 23%, the largest weekly rise since March 2023.
After three consecutive days of gains last week, BTC rose from 64K to 79K—an upside rebound of about 15,000 points. It is now consolidating around the 78K area, repairing and awaiting new signals.
The 7.78 level has flipped between resistance and support. The horizontal line connects the past and the next step; both bulls and bears have another chance to test the market here.
Pull a Fibonacci 0.618 retracement from the high to the low: the rebound encountered resistance at this point, which also creates a two-point confluence with 7.78.
7.88 is the top boundary resistance of the box. For now, the number of resistance validations looks effective, so consider shorting on the rebound.
7.65 is the bottom support of the box. It has been tested multiple times and remains valid. Consider going long on pullbacks.
Set a left-side plan: short at 7.88, defend above 7.95. Targets are near 7.81 and 7.67. The risk-reward ratio fully runs out to 3.18.
Set a left-side plan: long at 7.65, defend at 7.56. Targets are near 7.74 and 7.85. The risk-reward ratio fully runs out to 2.42.
At the middle of the range, it’s best to watch more and act less—ideally stay still—observe and wait for opportunities while staying in cash.
If you pass by, please take a moment to follow, like, and comment—it’s the biggest support for me. Thank you and I appreciate it! The above information is only for chart analysis and not for executing trades;
Follow me so you won’t get lost. I’ll bring you the latest news and updates every day, along with price level analysis. And the wealth password you want—remember to follow and like! #比特币创2023年3月来最强周涨幅 $BTC
This morning, BTC closed with a long lower wick and a bullish candlestick. The weekly close formed a strong-bodied bullish candle. The week’s gain exceeded 23%, the largest weekly rise since March 2023.
After three consecutive days of gains last week, BTC rose from 64K to 79K—an upside rebound of about 15,000 points. It is now consolidating around the 78K area, repairing and awaiting new signals.
The 7.78 level has flipped between resistance and support. The horizontal line connects the past and the next step; both bulls and bears have another chance to test the market here.
Pull a Fibonacci 0.618 retracement from the high to the low: the rebound encountered resistance at this point, which also creates a two-point confluence with 7.78.
7.88 is the top boundary resistance of the box. For now, the number of resistance validations looks effective, so consider shorting on the rebound.
7.65 is the bottom support of the box. It has been tested multiple times and remains valid. Consider going long on pullbacks.
Set a left-side plan: short at 7.88, defend above 7.95. Targets are near 7.81 and 7.67. The risk-reward ratio fully runs out to 3.18.
Set a left-side plan: long at 7.65, defend at 7.56. Targets are near 7.74 and 7.85. The risk-reward ratio fully runs out to 2.42.
At the middle of the range, it’s best to watch more and act less—ideally stay still—observe and wait for opportunities while staying in cash.
If you pass by, please take a moment to follow, like, and comment—it’s the biggest support for me. Thank you and I appreciate it! The above information is only for chart analysis and not for executing trades;
Follow me so you won’t get lost. I’ll bring you the latest news and updates every day, along with price level analysis. And the wealth password you want—remember to follow and like! #比特币创2023年3月来最强周涨幅 $BTC
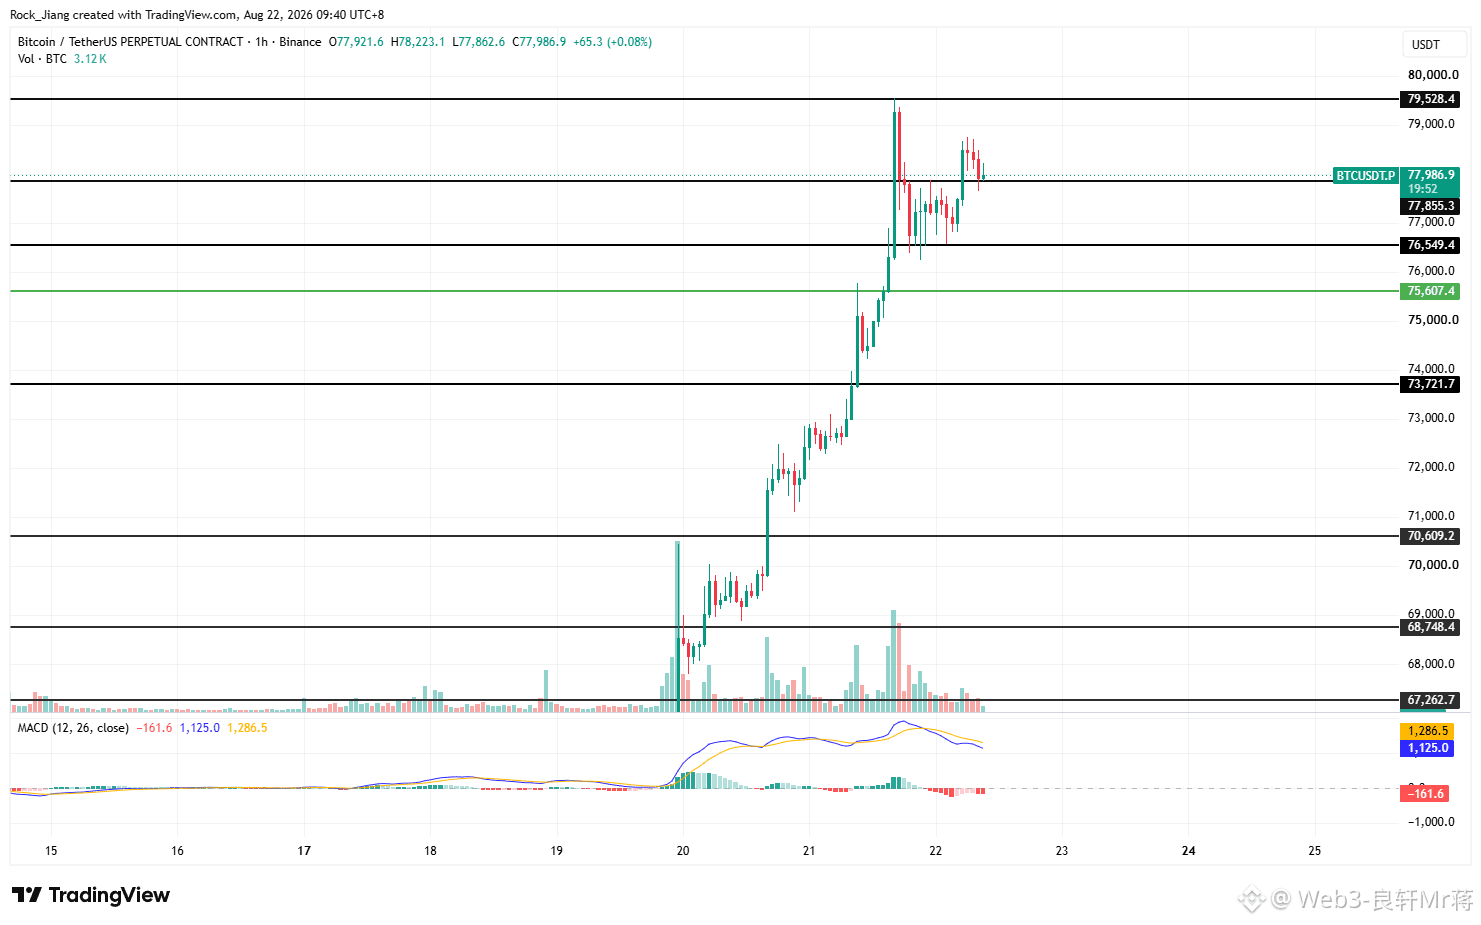
8.22 Weekend Morning Market Overview: BTC consolidates at the high end over the weekend, waiting to see what happens
In the morning, BTC closed with a large bullish candle, and the daily chart shows five consecutive green candles
Yesterday, BTC surged nearly 6,500 points from the low to the high. It has risen by more than 4,000 points each day for three straight days, making everyone feel like they’re seeing the long-awaited bull market again
Market enthusiasm is back—liquidity comes with it, and funds return. Everyone will again focus on the crypto track
Back to the chart: BTC is ranging around 7.8 in the high zone. On the 1H timeframe, there’s a divergence between volume and price—volume and price relationships aren’t consistent. Given the weekend’s lack of liquidity, there’s currently no movement to speak of
7.77 is a key level for now; it connects what came before and what comes next, and both longs and shorts have opportunities
During the rally, a pullback at 7.65 formed a temporary support. Since the market is moving in one direction upward, BTC is also looking for new support and resistance. All resistance and support levels can’t be proven and can only be valid briefly
The market trend is bullish. The idea is to buy on pullbacks—don’t blindly short or chase longs. If there’s an opportunity to enter on a pullback, take it!
Don’t get FOMO or miss-out anxiety. I keep emphasizing: the crypto market isn’t short of opportunities—what’s lacking is patience and ammunition. Manage your emotions and control your position size
According to CMC data, today’s Greed & Fear Index is 75, indicating a greed state
BTC’s market cap dominance has risen to 59.3%, up 0.42 percentage points. ETH’s market share is 11.5%, up 1.13 percentage points
If you pass by, please be kind and hit follow, like, and leave a comment—this is my biggest support. Thank you and I’m grateful! The information above is for market analysis only and not for executing trades;
Follow me so you won’t get lost. I’ll bring you the latest news, latest updates, and price-point analysis every day—along with the wealth codes you want. Remember to click follow and like#比特币创2023年3月来最佳周表现 $BTC
In the morning, BTC closed with a large bullish candle, and the daily chart shows five consecutive green candles
Yesterday, BTC surged nearly 6,500 points from the low to the high. It has risen by more than 4,000 points each day for three straight days, making everyone feel like they’re seeing the long-awaited bull market again
Market enthusiasm is back—liquidity comes with it, and funds return. Everyone will again focus on the crypto track
Back to the chart: BTC is ranging around 7.8 in the high zone. On the 1H timeframe, there’s a divergence between volume and price—volume and price relationships aren’t consistent. Given the weekend’s lack of liquidity, there’s currently no movement to speak of
7.77 is a key level for now; it connects what came before and what comes next, and both longs and shorts have opportunities
During the rally, a pullback at 7.65 formed a temporary support. Since the market is moving in one direction upward, BTC is also looking for new support and resistance. All resistance and support levels can’t be proven and can only be valid briefly
The market trend is bullish. The idea is to buy on pullbacks—don’t blindly short or chase longs. If there’s an opportunity to enter on a pullback, take it!
Don’t get FOMO or miss-out anxiety. I keep emphasizing: the crypto market isn’t short of opportunities—what’s lacking is patience and ammunition. Manage your emotions and control your position size
According to CMC data, today’s Greed & Fear Index is 75, indicating a greed state
BTC’s market cap dominance has risen to 59.3%, up 0.42 percentage points. ETH’s market share is 11.5%, up 1.13 percentage points
If you pass by, please be kind and hit follow, like, and leave a comment—this is my biggest support. Thank you and I’m grateful! The information above is for market analysis only and not for executing trades;
Follow me so you won’t get lost. I’ll bring you the latest news, latest updates, and price-point analysis every day—along with the wealth codes you want. Remember to click follow and like#比特币创2023年3月来最佳周表现 $BTC
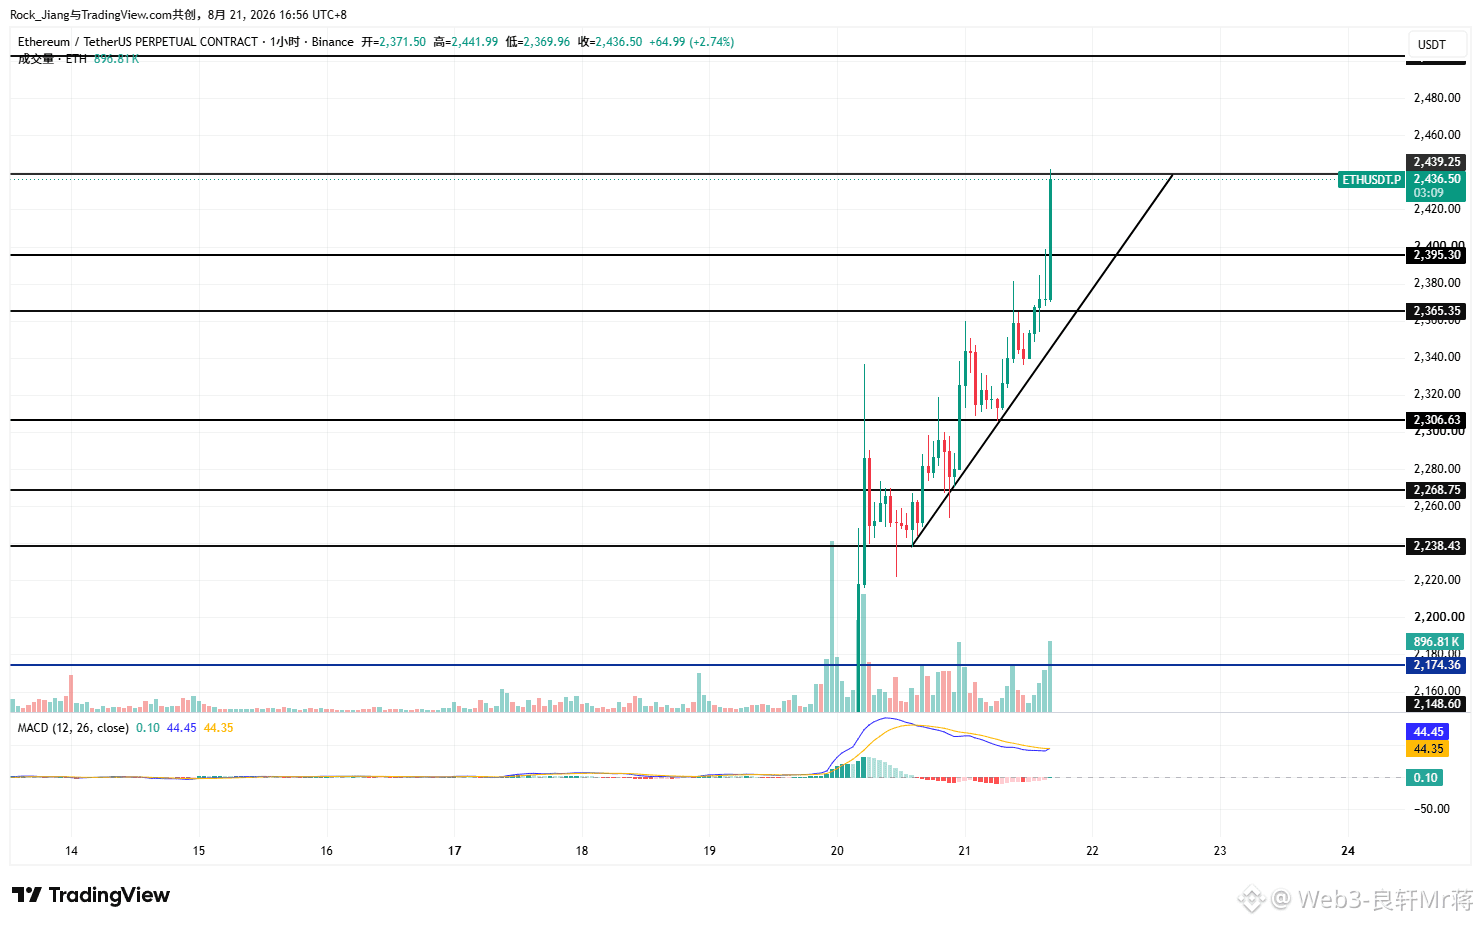
8.21 Market Overview: ETH breaks down repeatedly; staying in cash and waiting
BTC is at 79K and about to hit 80K. ETH rebounds to 2450 but meets resistance
BTC or ETH—right now is when momentum is strong. Don’t make up reasons out of thin air to short, and don’t get carried away and chase longs blindly
Going with the trend is correct, but you must be clear in your mind: is this market actually reversing, or is it just a long-awaited rebound?
In the crypto space, it’s not about who has more bullets—it’s about who can hold on until the very end. Whether you are still at the table for the final banquet is what matters
ETH is continuously breaking out, then breaking down. If there isn’t familiarity with the current market conditions, I’d rather stay in cash than blindly chase longs or fantasize about shorting
The image I posted is meaningful: the BTC position held by Mike Saylor has not only recovered break-even but is also in profit. In contrast, Tom Lee’s ETH position is not yet at break-even—it’s still on the road to getting there
Even with the current market, for ETH to immediately return to 3400 still requires a certain amount of buying power to pull it up
Both BTC and ETH are doing well. Indirectly, this shows that the BTC holdings are still more advantageous than ETH. So gradually building a BTC position and buying on dips is the right move
If you pass by, please give a quick follow, like, and leave a comment—your support means the most. Thank you and I’m grateful. The information above is only for market analysis and not for trade execution;
Follow me so you won’t get lost—every day I’ll bring you the latest information, newest developments, and level/price analysis. And if you want the wealth code, remember to follow, like, and give the thumbs up. #三星拟周五公布新股东回报计划 $BTC
BTC is at 79K and about to hit 80K. ETH rebounds to 2450 but meets resistance
BTC or ETH—right now is when momentum is strong. Don’t make up reasons out of thin air to short, and don’t get carried away and chase longs blindly
Going with the trend is correct, but you must be clear in your mind: is this market actually reversing, or is it just a long-awaited rebound?
In the crypto space, it’s not about who has more bullets—it’s about who can hold on until the very end. Whether you are still at the table for the final banquet is what matters
ETH is continuously breaking out, then breaking down. If there isn’t familiarity with the current market conditions, I’d rather stay in cash than blindly chase longs or fantasize about shorting
The image I posted is meaningful: the BTC position held by Mike Saylor has not only recovered break-even but is also in profit. In contrast, Tom Lee’s ETH position is not yet at break-even—it’s still on the road to getting there
Even with the current market, for ETH to immediately return to 3400 still requires a certain amount of buying power to pull it up
Both BTC and ETH are doing well. Indirectly, this shows that the BTC holdings are still more advantageous than ETH. So gradually building a BTC position and buying on dips is the right move
If you pass by, please give a quick follow, like, and leave a comment—your support means the most. Thank you and I’m grateful. The information above is only for market analysis and not for trade execution;
Follow me so you won’t get lost—every day I’ll bring you the latest information, newest developments, and level/price analysis. And if you want the wealth code, remember to follow, like, and give the thumbs up. #三星拟周五公布新股东回报计划 $BTC

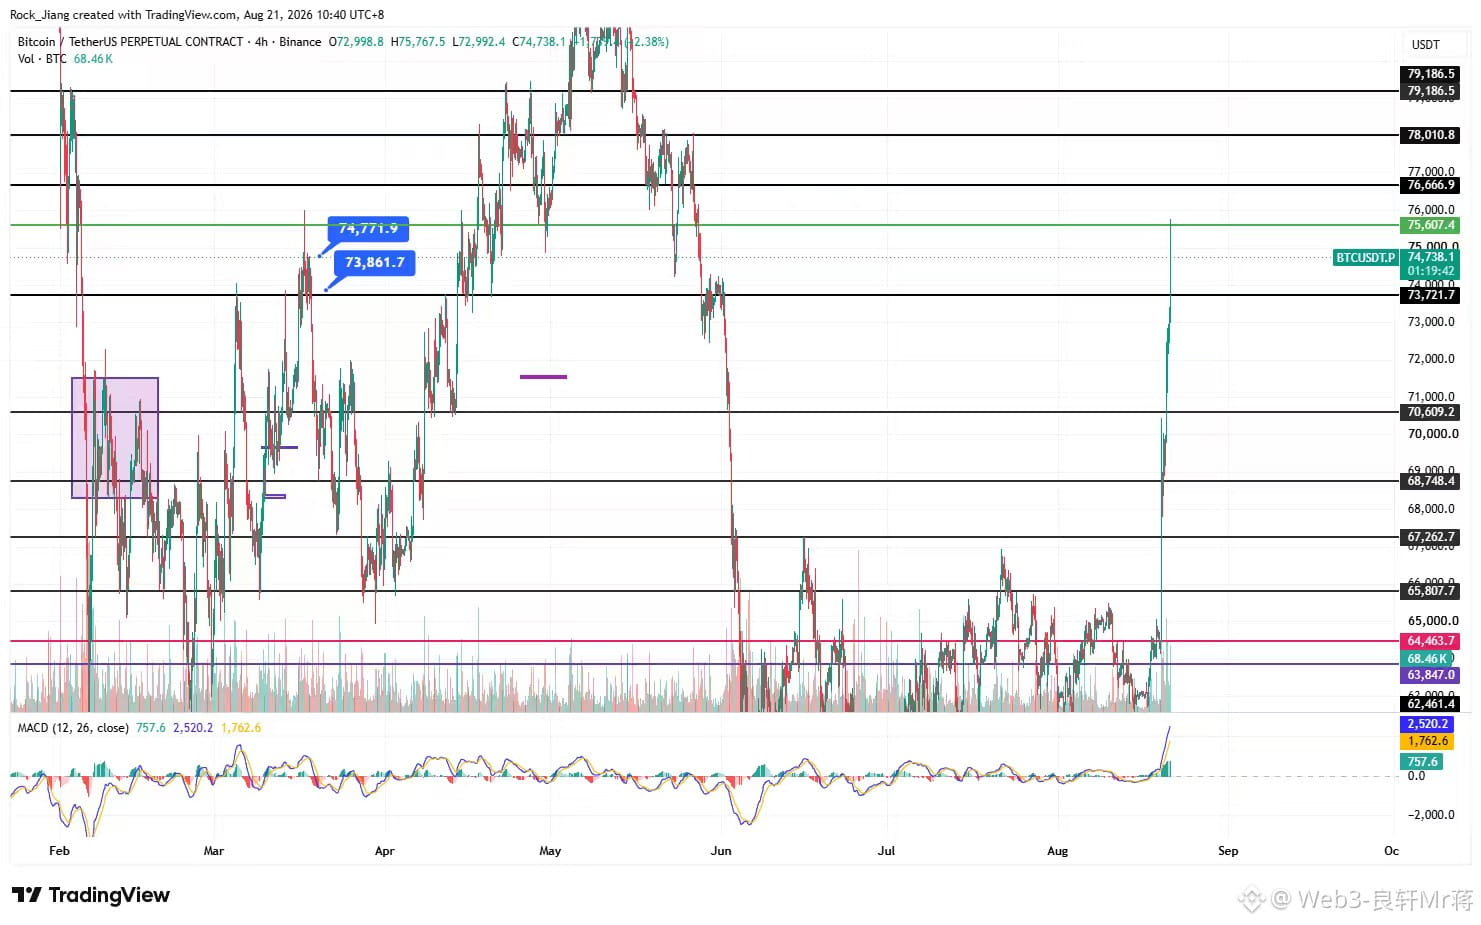
8.21 Morning Market Overview: BTC revisits 75K after an interval of 3 months—has the bull turned around like a bull coming back for real? Let me walk you through it
This morning, BTC closed with a strong bullish candlestick entity; four consecutive green days on the daily chart, rising step by step and taking off
After BTC pulled back from 83K in May down to 57K, it returned to 75K again after three months
During this period, it consolidated at 60K–65K, which took up about two months and involved repeated choppy trading to accumulate positions; however, this also gave us opportunities to take profits at the top and buy dips within the range. Finally, over the past two days, it built up momentum—continuous large bullish candles pierced through the sky, and once again delivered a remarkable breakout
Yesterday, I mentioned three points in my post from a macro perspective; today I’m revisiting the chart and sharing my personal take based on technical analysis
BTC returning to 75K has been followed by short positions at high leverage gradually acting as fuel, and a large number of shorts being forced to close—pushing the upside momentum of “big pie” higher;
When the overhead selling pressure decreases further, the rebound becomes stronger; as we often say: the car is lighter, and it drives faster!
We can see that the inflow of capital isn’t only into BTC—ETH and some major coins also rise along, which indicates that liquidity across the crypto market has started to become active
So here’s the question: is it really “the bull returns as a bull again,” meaning a reversal? Does it mean we should blindly go long with a one-way rally?
I’ll say the same thing: the relationship between price action and the information on the chart—what it gives you—is the true reflection. The resistance zone around 7.56 is also a concentrated area of option-expiration chips, with heavy pressure and supply to sell;
I still think that after BTC has been moving sideways for a long time, a rebound alone isn’t evidence that a real reversal bull run has begun; it’s also not like the early days of the bull market after the halving when Trump took office at the end of 2024, when BTC made new ATH every day
Since BTC has broken key levels consecutively, personally I won’t chase longs and I won’t blindly short—no dyeing the mix with long/short bias; I’ll wait for it to cool down and then look for opportunities like that. More time in trading is about waiting—learn to be friends with time!
If you’re passing by, please hit follow and like and leave a comment—those are my biggest support, thank you and I really appreciate it. The information above is for chart analysis only and not execution advice;
Follow me so you won’t get lost—I’ll bring you the latest information, latest updates, and price-point analysis every day. And if you’re looking for wealth codes, remember to follow and like. #特朗普敦促国会通过Clarity法案 $BTC
This morning, BTC closed with a strong bullish candlestick entity; four consecutive green days on the daily chart, rising step by step and taking off
After BTC pulled back from 83K in May down to 57K, it returned to 75K again after three months
During this period, it consolidated at 60K–65K, which took up about two months and involved repeated choppy trading to accumulate positions; however, this also gave us opportunities to take profits at the top and buy dips within the range. Finally, over the past two days, it built up momentum—continuous large bullish candles pierced through the sky, and once again delivered a remarkable breakout
Yesterday, I mentioned three points in my post from a macro perspective; today I’m revisiting the chart and sharing my personal take based on technical analysis
BTC returning to 75K has been followed by short positions at high leverage gradually acting as fuel, and a large number of shorts being forced to close—pushing the upside momentum of “big pie” higher;
When the overhead selling pressure decreases further, the rebound becomes stronger; as we often say: the car is lighter, and it drives faster!
We can see that the inflow of capital isn’t only into BTC—ETH and some major coins also rise along, which indicates that liquidity across the crypto market has started to become active
So here’s the question: is it really “the bull returns as a bull again,” meaning a reversal? Does it mean we should blindly go long with a one-way rally?
I’ll say the same thing: the relationship between price action and the information on the chart—what it gives you—is the true reflection. The resistance zone around 7.56 is also a concentrated area of option-expiration chips, with heavy pressure and supply to sell;
I still think that after BTC has been moving sideways for a long time, a rebound alone isn’t evidence that a real reversal bull run has begun; it’s also not like the early days of the bull market after the halving when Trump took office at the end of 2024, when BTC made new ATH every day
Since BTC has broken key levels consecutively, personally I won’t chase longs and I won’t blindly short—no dyeing the mix with long/short bias; I’ll wait for it to cool down and then look for opportunities like that. More time in trading is about waiting—learn to be friends with time!
If you’re passing by, please hit follow and like and leave a comment—those are my biggest support, thank you and I really appreciate it. The information above is for chart analysis only and not execution advice;
Follow me so you won’t get lost—I’ll bring you the latest information, latest updates, and price-point analysis every day. And if you’re looking for wealth codes, remember to follow and like. #特朗普敦促国会通过Clarity法案 $BTC
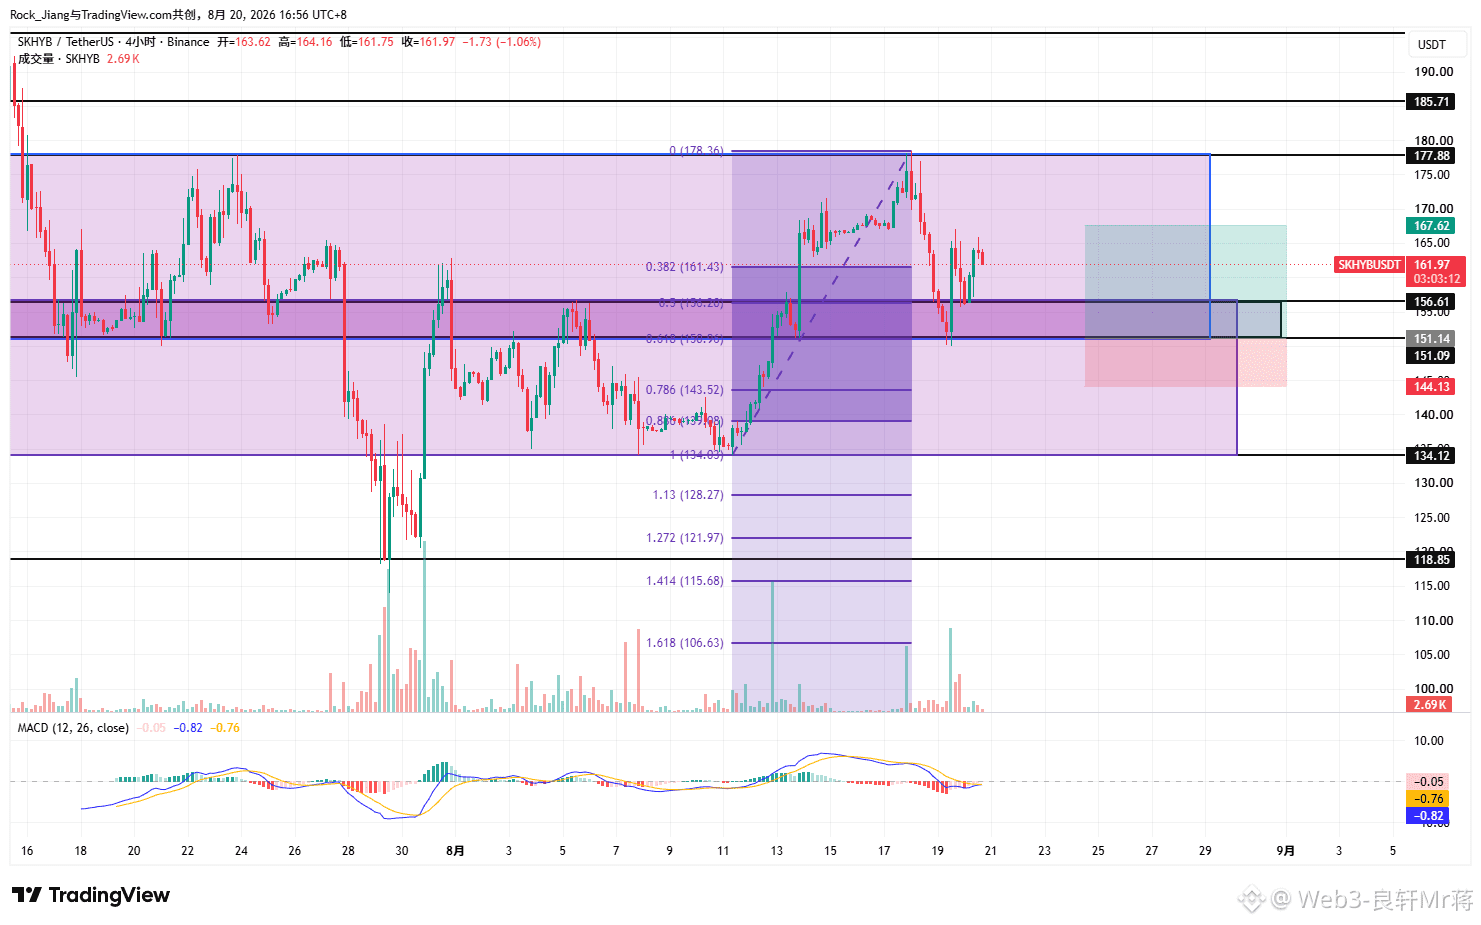
8.20 Market Overview: Have you followed the pullback long on Hynix SKHY? #FOMC会议纪要 $SKHYB
SKHY moved up from the previous 134-151 (purple) ranging zone to the 151-177 (blue) ranging zone. Have you caught the high-sell low-buy opportunity?
SKHY went long at 134, exited at 151. After the bounce, it shorted at 177.88, and now it’s pulling back to 151 to go long again! Trading back and forth between two ranging ranges.
Last night, US stocks opened strong and kept rising. The three major indexes also ended the day with a small gain by this morning.
BTC is now stabilizing above 71K, up 7,000 points; ETH is back around 2200, up more than 400 points. As for ETH breaking through, I’m not looking at that for now.
Compared with Micron and SanDisk, even though Hynix has had multiple circuit breaks, it has still been very stable and strong in the past few days!
The support zone formed by 151-151 remains valid. If you have no position, you can wait for the pullback to go long. Defense (stop) at 144.13, targets at 157.19 and 167.58—the risk-reward ratio is very ideal.
151 is the 0.618 retracement from the low to the high. A pullback to this level can trigger a rebound, so the long setup is justified.
On the left side, place a pending short at 177.88, defense at 1857.71, targets around 170.05 and 161.74.
If you’re passing by, please click to follow, like, and leave a comment—your support means the most. Thank you and I appreciate it! The information above is for order-book/panel analysis only and not for executing trades;
Follow me so you won’t get lost—I'll bring you the latest updates and level analysis every day, plus the wealth code you want. Remember to follow and like!
SKHY moved up from the previous 134-151 (purple) ranging zone to the 151-177 (blue) ranging zone. Have you caught the high-sell low-buy opportunity?
SKHY went long at 134, exited at 151. After the bounce, it shorted at 177.88, and now it’s pulling back to 151 to go long again! Trading back and forth between two ranging ranges.
Last night, US stocks opened strong and kept rising. The three major indexes also ended the day with a small gain by this morning.
BTC is now stabilizing above 71K, up 7,000 points; ETH is back around 2200, up more than 400 points. As for ETH breaking through, I’m not looking at that for now.
Compared with Micron and SanDisk, even though Hynix has had multiple circuit breaks, it has still been very stable and strong in the past few days!
The support zone formed by 151-151 remains valid. If you have no position, you can wait for the pullback to go long. Defense (stop) at 144.13, targets at 157.19 and 167.58—the risk-reward ratio is very ideal.
151 is the 0.618 retracement from the low to the high. A pullback to this level can trigger a rebound, so the long setup is justified.
On the left side, place a pending short at 177.88, defense at 1857.71, targets around 170.05 and 161.74.
If you’re passing by, please click to follow, like, and leave a comment—your support means the most. Thank you and I appreciate it! The information above is for order-book/panel analysis only and not for executing trades;
Follow me so you won’t get lost—I'll bring you the latest updates and level analysis every day, plus the wealth code you want. Remember to follow and like!
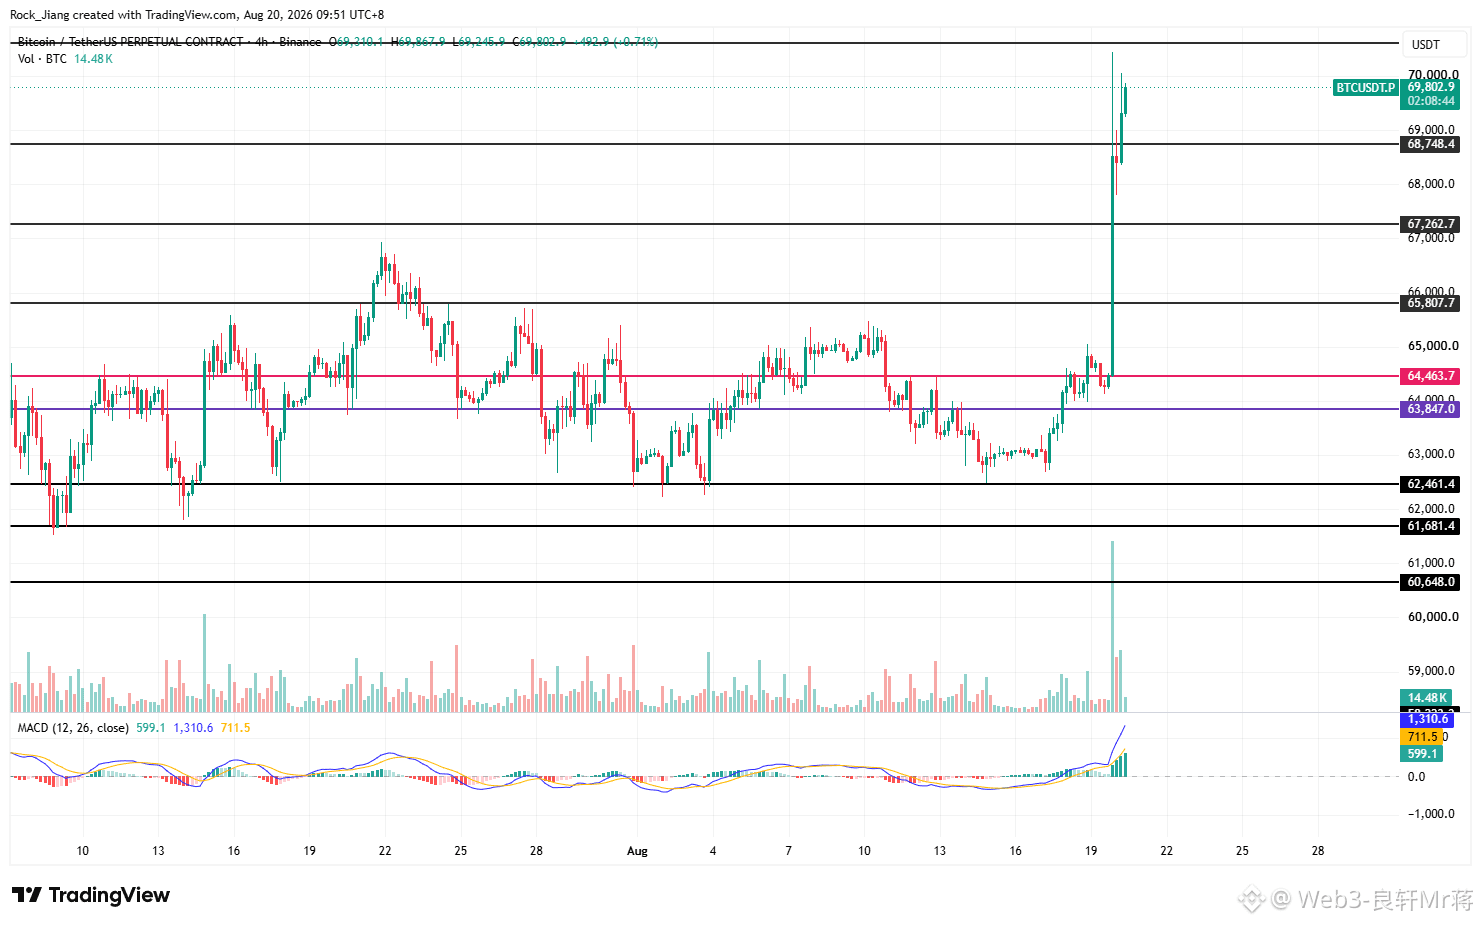
8.20 Morning Market Overview: BTC suddenly surged up by 6,300 points—shorts cried in the bathroom
This morning BTC closed with long upper and lower wicks and a strong bullish candle. BTC rocketed from the low of 6.41 straight up to 7.04, driving up by a hard 6,300 points
A few days ago I shorted at 6.38, added to the position at 6.44, and when it retraced to 6.41 I reduced exposure. Last night my T2 was also knocked out, but luckily the loss was only a small position
Why did the global crypto market for BTC suddenly explode upward by 6,300 points? My personal analysis is as follows—three points:
1: Trump once again praised BTC as a crucial element of strategic reserves. The U.S. government holds BTC again; at the same time, he stated that the U.S. government has completely ended its “war on crypto,” and the crypto industry is thriving
2: The SEC, which has been wavering, may provide more support and favorable policies for a clearer framework/law. Regulatory easing has boosted market sentiment and the public’s emotions
3: As the hype around AI and U.S. stocks gradually cools off, the first institutions and capital that caught the benefits have been exiting and then flowing back into BTC, increasing liquidity in the crypto market
Back to the chart: BTC still has the potential to push higher. The key is to build strength and hold above 70k!
In the past 24H, liquidations across the entire network involved 173,743 people, with a total value of 2.98 billion USD. Long liquidations were 242 million USD, while short liquidations were as high as 2.74 billion USD. The main liquidation was shorts—also, I contributed a share, too
The current market is hard to read. Don’t chase longs, and don’t daydream about shorting. Stay in cash and patiently wait for familiar price action. Wait for a structure validation that involves multiple rounds of range (box) consolidation before entering again. Keep your “ammo” ready for opportunities, and don’t give fuel to both sides
If you pass by, please tap follow and like and leave a review—your support means the most to me. Thank you and I’m grateful! The above information is for market analysis only and not for trade execution;
Follow me and you won’t get lost. Every day I’ll bring you the latest info, latest developments, and price-level analysis—plus the wealth code you want. Remember to tap follow and like. #FOMC会议纪要 $BTC
This morning BTC closed with long upper and lower wicks and a strong bullish candle. BTC rocketed from the low of 6.41 straight up to 7.04, driving up by a hard 6,300 points
A few days ago I shorted at 6.38, added to the position at 6.44, and when it retraced to 6.41 I reduced exposure. Last night my T2 was also knocked out, but luckily the loss was only a small position
Why did the global crypto market for BTC suddenly explode upward by 6,300 points? My personal analysis is as follows—three points:
1: Trump once again praised BTC as a crucial element of strategic reserves. The U.S. government holds BTC again; at the same time, he stated that the U.S. government has completely ended its “war on crypto,” and the crypto industry is thriving
2: The SEC, which has been wavering, may provide more support and favorable policies for a clearer framework/law. Regulatory easing has boosted market sentiment and the public’s emotions
3: As the hype around AI and U.S. stocks gradually cools off, the first institutions and capital that caught the benefits have been exiting and then flowing back into BTC, increasing liquidity in the crypto market
Back to the chart: BTC still has the potential to push higher. The key is to build strength and hold above 70k!
In the past 24H, liquidations across the entire network involved 173,743 people, with a total value of 2.98 billion USD. Long liquidations were 242 million USD, while short liquidations were as high as 2.74 billion USD. The main liquidation was shorts—also, I contributed a share, too
The current market is hard to read. Don’t chase longs, and don’t daydream about shorting. Stay in cash and patiently wait for familiar price action. Wait for a structure validation that involves multiple rounds of range (box) consolidation before entering again. Keep your “ammo” ready for opportunities, and don’t give fuel to both sides
If you pass by, please tap follow and like and leave a review—your support means the most to me. Thank you and I’m grateful! The above information is for market analysis only and not for trade execution;
Follow me and you won’t get lost. Every day I’ll bring you the latest info, latest developments, and price-level analysis—plus the wealth code you want. Remember to tap follow and like. #FOMC会议纪要 $BTC
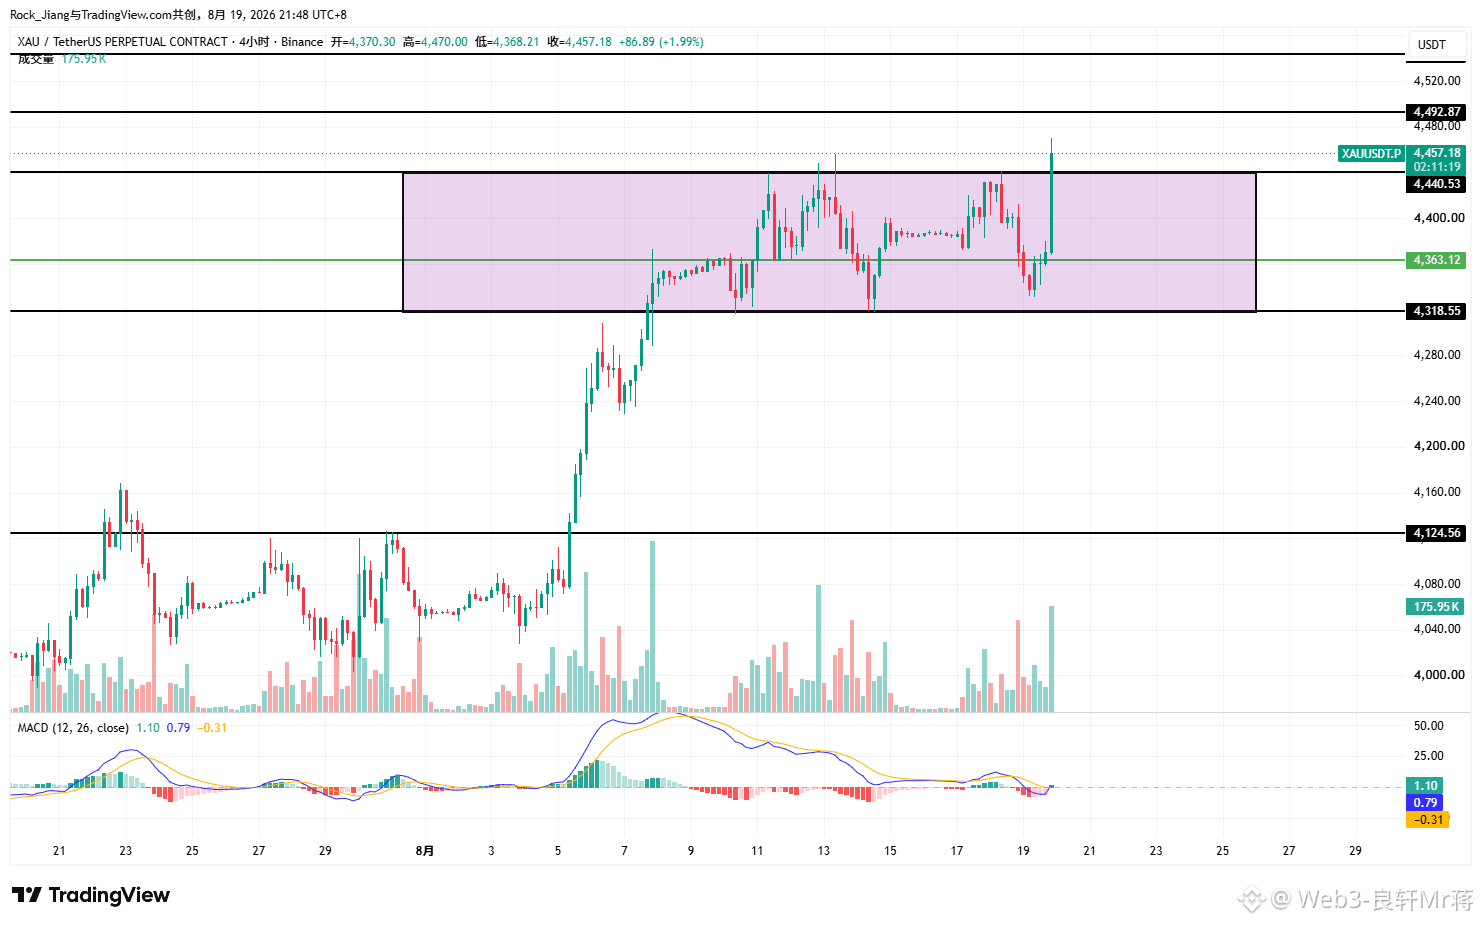
8.19 Evening Market Overview: XAU gold long position took profit at 77 points and exited; short position has been opened and is still holding
U.S. stocks have just opened, and all three major indexes are gapping up. Both crypto and U.S. stocks are rising in response!
Yesterday, XAU gold was set up with a long order at 4363. The add-on at 4318 almost didn’t get filled.
Just now, this big bullish candle automatically closed and took profit on both T1/T2, locking in 77 points; the counter-trend short setup is also still open/holding
Hold the XAU short with the stop-loss in place. This move is a bit aggressive—just stay patient and wait for the market to either run out or hit the stop; if it doesn’t reach enough, then it’ll be a double-win for both long and short.
If you’ve been checking my daily posts and following my rhythm, trading with low position size and low leverage, then during this period you should also be making money hand over fist.
If you’re passing by, please hit follow, like, and leave a comment—your support means the most. Thank you and I appreciate it. The information above is for market analysis only and not for trade execution;
Follow me so you won’t get lost—I’ll bring you the latest news, latest updates, and level/price analysis every day, and also the wealth code you want. Remember to follow, like, and comment #美国存储股延续跌势 $XAU
U.S. stocks have just opened, and all three major indexes are gapping up. Both crypto and U.S. stocks are rising in response!
Yesterday, XAU gold was set up with a long order at 4363. The add-on at 4318 almost didn’t get filled.
Just now, this big bullish candle automatically closed and took profit on both T1/T2, locking in 77 points; the counter-trend short setup is also still open/holding
Hold the XAU short with the stop-loss in place. This move is a bit aggressive—just stay patient and wait for the market to either run out or hit the stop; if it doesn’t reach enough, then it’ll be a double-win for both long and short.
If you’ve been checking my daily posts and following my rhythm, trading with low position size and low leverage, then during this period you should also be making money hand over fist.
If you’re passing by, please hit follow, like, and leave a comment—your support means the most. Thank you and I appreciate it. The information above is for market analysis only and not for trade execution;
Follow me so you won’t get lost—I’ll bring you the latest news, latest updates, and level/price analysis every day, and also the wealth code you want. Remember to follow, like, and comment #美国存储股延续跌势 $XAU
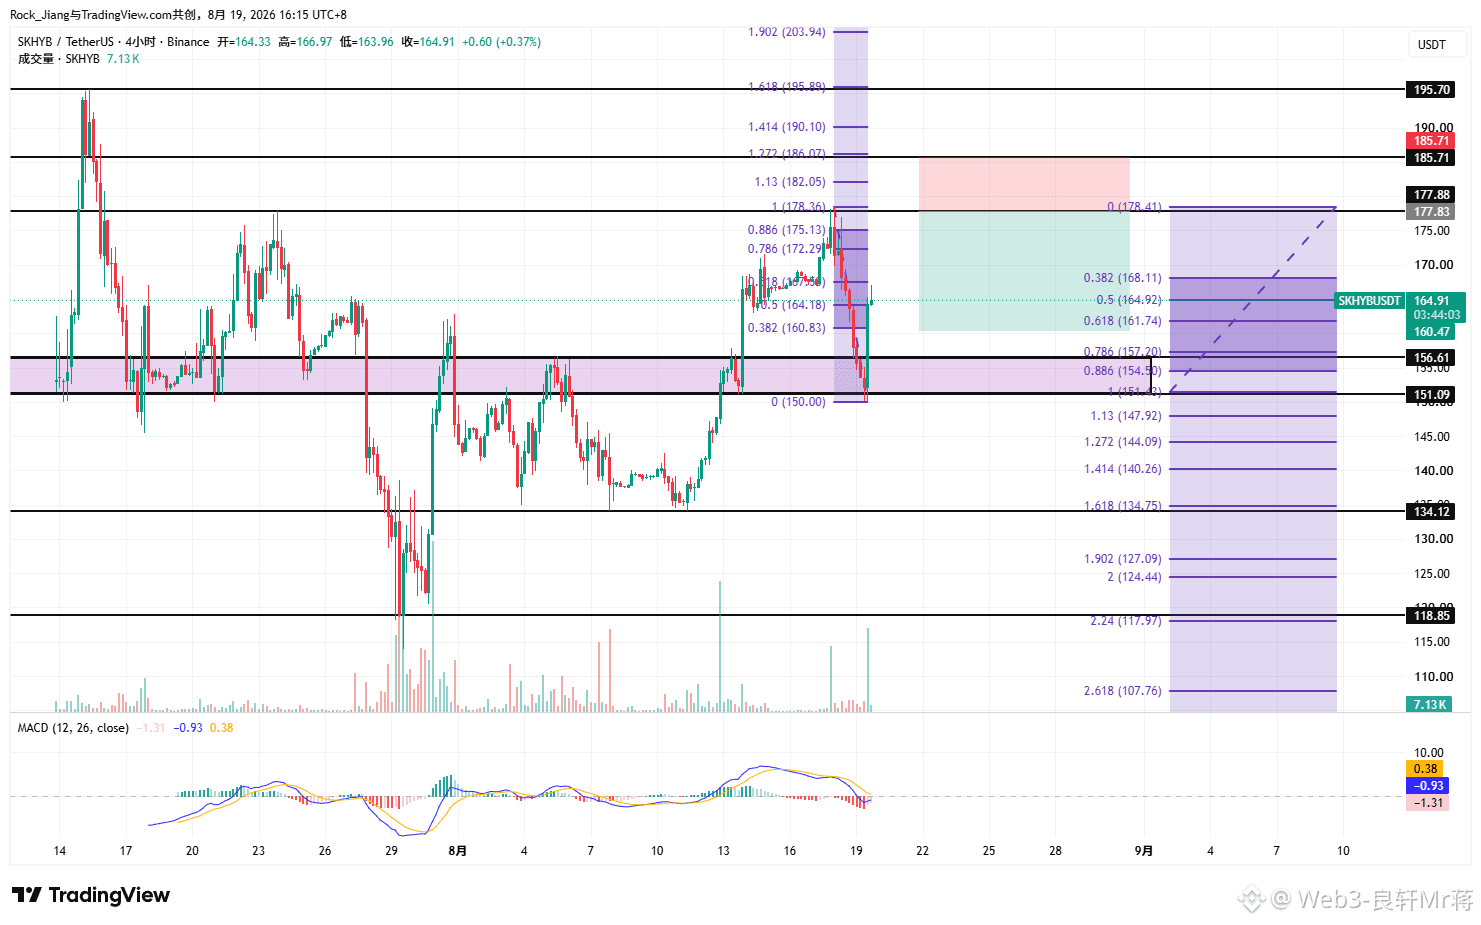
8.19 Market Overview: Hynix Retraces to Support Zone and Rebounds
SKHY Hynix touched the 177.88 resistance level and triggered a pullback. The resistance above has formed a consensus to go short. For the big players to continue to seize the buy-side liquidity above, more buy orders are needed to join in
Two days ago, I also told my friends that at the 177.88 resistance level there will be selling pressure. Long positions can close around here and then reverse to short
Part of the reason is that Samsung Electronics (Hynix) in South Korea announced a 40 trillion KRW share buyback. The overnight U.S. market also helped boost it, rising more than 2%
151-156.61, which used to be resistance, has turned into a support range. Retracement to 151 quickly formed a rebound
From the high to the low, draw a Fibonacci 0.618 retracement. At 167.69 there is resistance pressure. Long positions can choose to reduce exposure here, while keeping the tail position to watch the prior high area around 177.88
With no position, lightly set up a short at 177.88. Defend at 1857.71. Targets are around 170.05 and 161.74; risk-reward ratio 2.2
If you pass by, please take a moment to follow, like, and leave a comment—your support means the most to me. Thank you for your gratitude! The above information is only for chart/market analysis and is not for executing trades;
Follow me so you won’t get lost. I’ll bring you the latest updates and level analysis every day. And the wealth password you want—remember to follow, like, and #宇树科技上市首日涨629% $SKHYB
SKHY Hynix touched the 177.88 resistance level and triggered a pullback. The resistance above has formed a consensus to go short. For the big players to continue to seize the buy-side liquidity above, more buy orders are needed to join in
Two days ago, I also told my friends that at the 177.88 resistance level there will be selling pressure. Long positions can close around here and then reverse to short
Part of the reason is that Samsung Electronics (Hynix) in South Korea announced a 40 trillion KRW share buyback. The overnight U.S. market also helped boost it, rising more than 2%
151-156.61, which used to be resistance, has turned into a support range. Retracement to 151 quickly formed a rebound
From the high to the low, draw a Fibonacci 0.618 retracement. At 167.69 there is resistance pressure. Long positions can choose to reduce exposure here, while keeping the tail position to watch the prior high area around 177.88
With no position, lightly set up a short at 177.88. Defend at 1857.71. Targets are around 170.05 and 161.74; risk-reward ratio 2.2
If you pass by, please take a moment to follow, like, and leave a comment—your support means the most to me. Thank you for your gratitude! The above information is only for chart/market analysis and is not for executing trades;
Follow me so you won’t get lost. I’ll bring you the latest updates and level analysis every day. And the wealth password you want—remember to follow, like, and #宇树科技上市首日涨629% $SKHYB
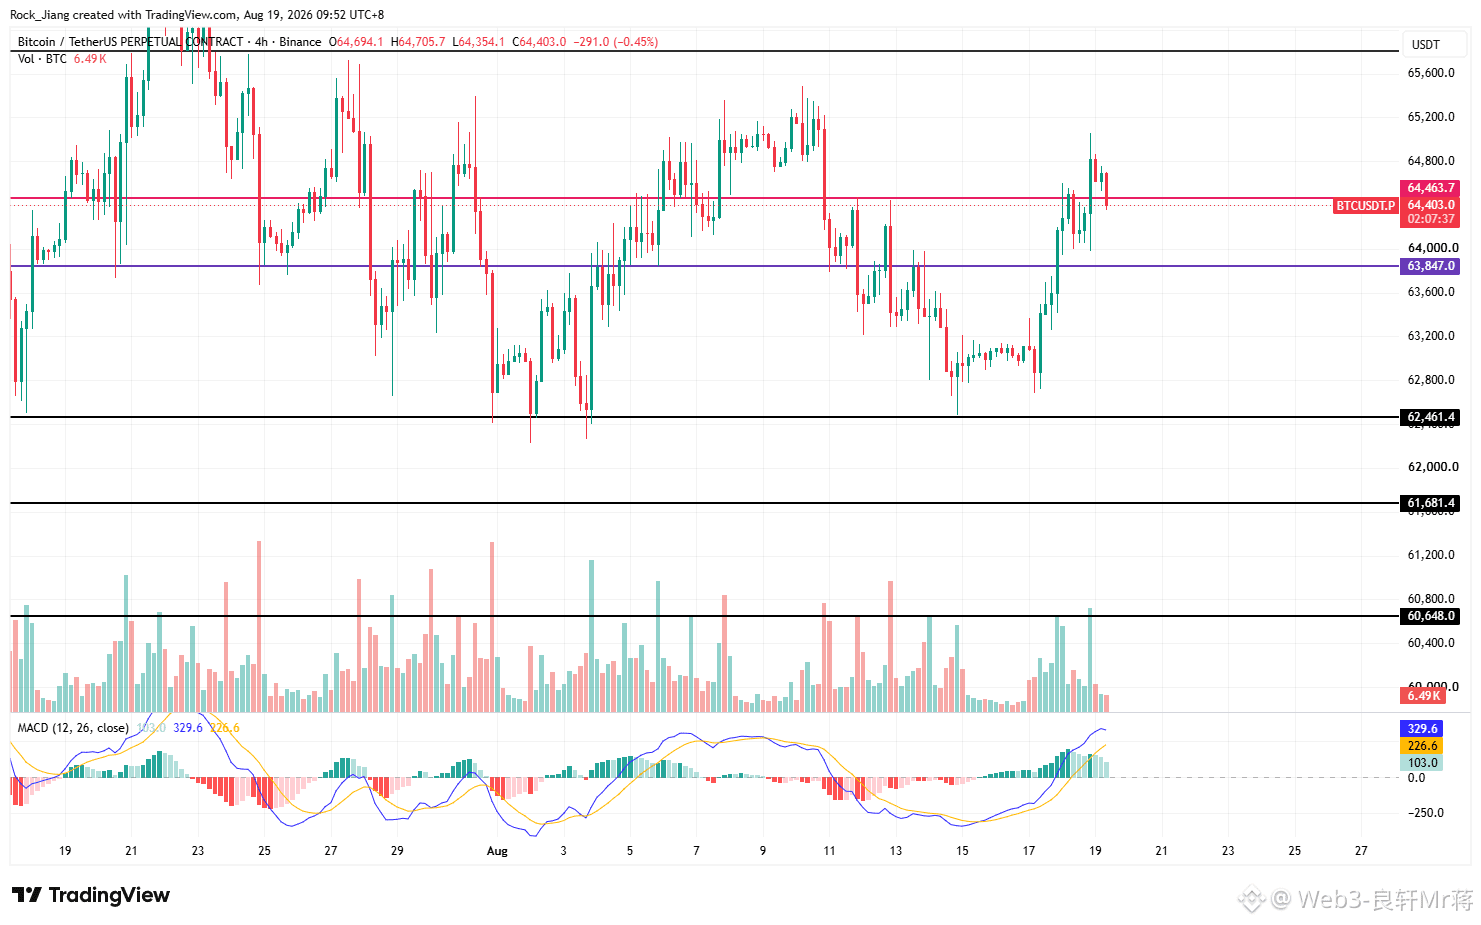
8.19 Morning Market Overview: Holding the BTC short—everything is under my control; if it breaks out then falls back, short in line with the trend.
In the morning, BTC formed an up candle with long upper and lower wicks; high-level bulls and bears battled back and forth.
Short BTC at 6.38, add to the position at 6.44, reduce around the cost basis near 6.41; keep the short position and wait for the market to run.
BTC broke through 6.44 and seized the liquidity above; only by repeatedly probing upward can a valid breakout form and complete a rebound; otherwise it will chop sideways back and forth.
BTC 4H shows a price-volume divergence; MACD has a top bearish divergence—everything points to a bearish signal! Beware of a fake breakout that lures longs with a bull trap—be careful!
BTC’s body breaks down through 6.44 again; with no position, short in line with the move. Defend the prior high at 6.51; targets are around 6.37 and 6.30.
The spot BTC ETF has seen net inflows for two consecutive working days;
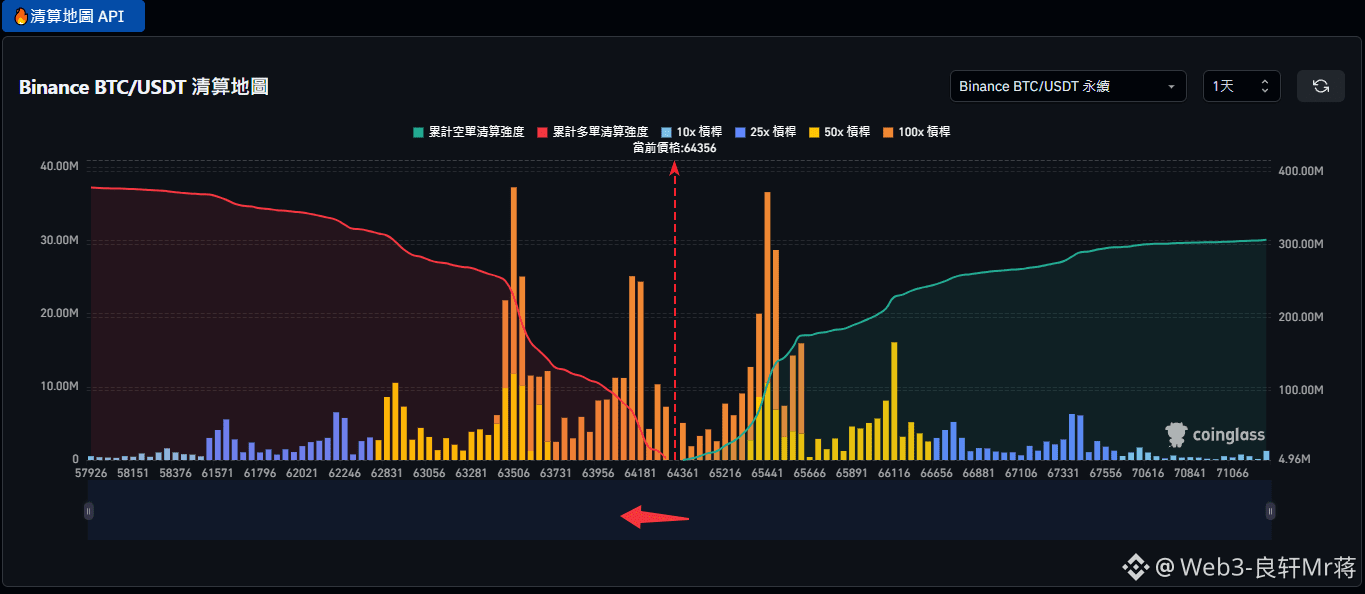
As of the past 24H, a total of 65,372 traders were liquidated across the whole network for $214M, with longs at $118M and shorts at $95M!
According to the liquidation map, the high-multiple leveraged concentration area is near the long zone around 6.40–6.43; longs, please be careful!
If you’re passing by, please quickly follow, like, and leave a comment—your support means a lot to me, thank you. The information above is only for chart analysis and not for trade execution;
Follow me so you won’t get lost—I'll bring you the latest updates, latest developments, and level analysis every day, and also the wealth password you want. Remember to follow, like, and tap #比特币永续合约资金费率创20个月新高 $BTC
In the morning, BTC formed an up candle with long upper and lower wicks; high-level bulls and bears battled back and forth.
Short BTC at 6.38, add to the position at 6.44, reduce around the cost basis near 6.41; keep the short position and wait for the market to run.
BTC broke through 6.44 and seized the liquidity above; only by repeatedly probing upward can a valid breakout form and complete a rebound; otherwise it will chop sideways back and forth.
BTC 4H shows a price-volume divergence; MACD has a top bearish divergence—everything points to a bearish signal! Beware of a fake breakout that lures longs with a bull trap—be careful!
BTC’s body breaks down through 6.44 again; with no position, short in line with the move. Defend the prior high at 6.51; targets are around 6.37 and 6.30.
The spot BTC ETF has seen net inflows for two consecutive working days;
As of the past 24H, a total of 65,372 traders were liquidated across the whole network for $214M, with longs at $118M and shorts at $95M!
According to the liquidation map, the high-multiple leveraged concentration area is near the long zone around 6.40–6.43; longs, please be careful!
If you’re passing by, please quickly follow, like, and leave a comment—your support means a lot to me, thank you. The information above is only for chart analysis and not for trade execution;
Follow me so you won’t get lost—I'll bring you the latest updates, latest developments, and level analysis every day, and also the wealth password you want. Remember to follow, like, and tap #比特币永续合约资金费率创20个月新高 $BTC
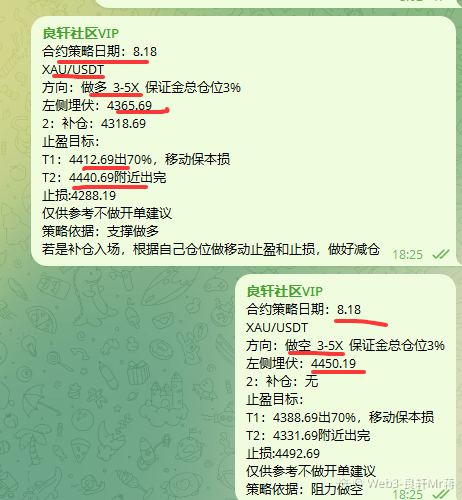
8.18 Market Overview: XAU box-range consolidation—have you learned to buy low and sell high?
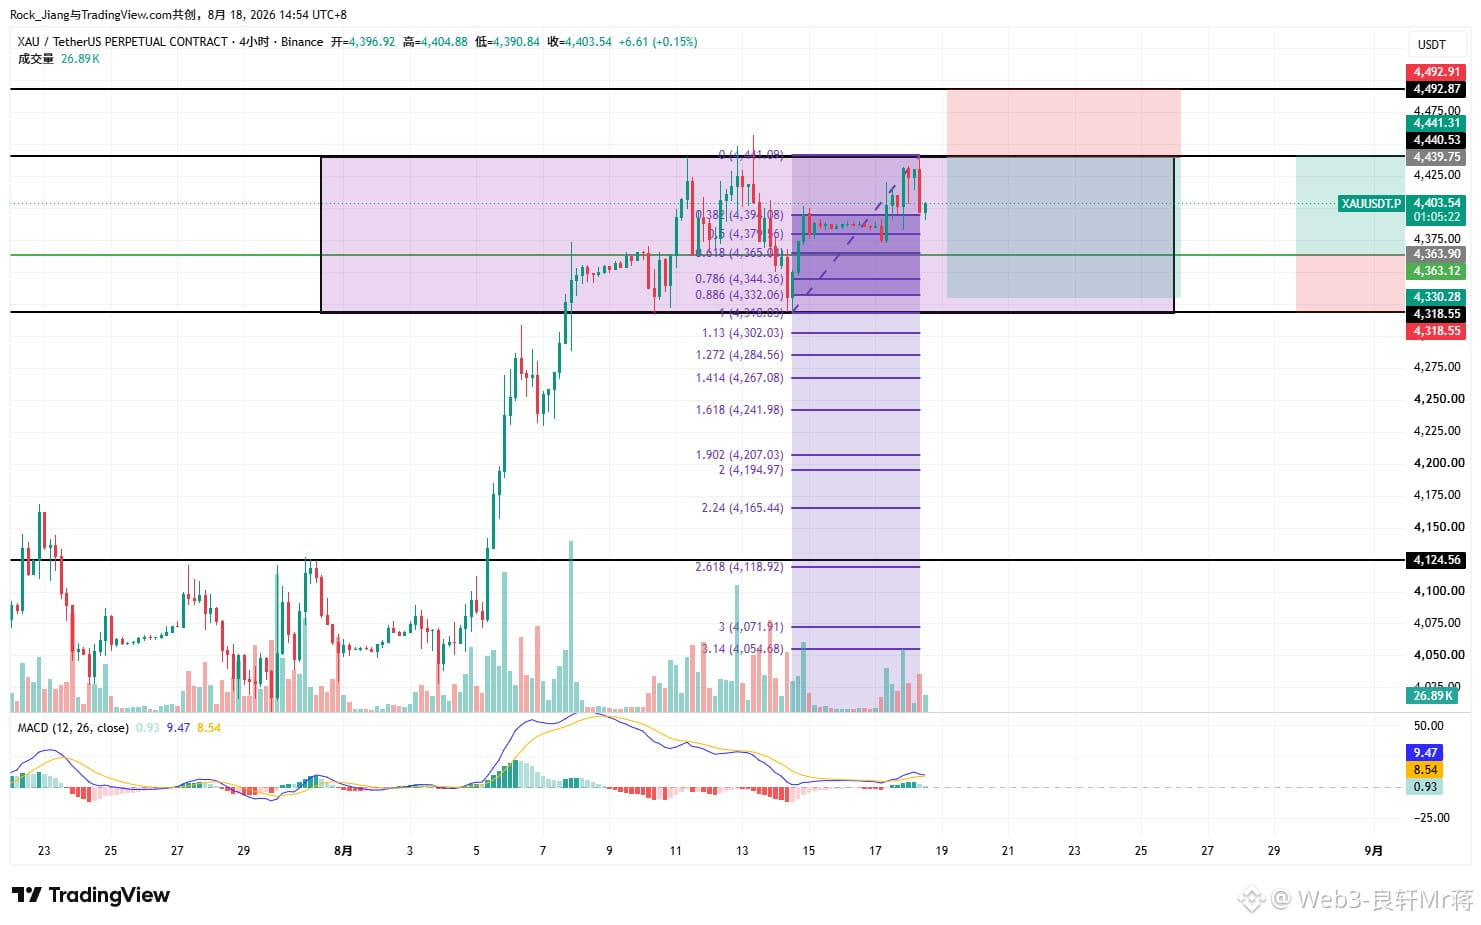
XAU gold is trading in a 4440–4318 box range. As long as resistance at the upper boundary does not break upward and support at the lower boundary does not break down, you can keep buying low and selling high within the range.
The 4440 resistance has been touched multiple times but has not formed a valid breakout—its resistance verification is effective.
4363 provides solid support with a key horizontal level that connects above and below; it also aligns with the 0.618 retracement from the low to the high, creating a resonance with support.
4318 is the bottom support of the box. The number of retest attempts is valid—if the price breaks below it, you must cut losses, because there is no effective support underneath.
For the left-side setup: stay short from 4440, defense at 4492, targets around 4388 and 4331, with a risk-reward ratio of 2.06.
For the left-side setup: stay long from 4365, can add on dips, with defense also placed around 4318, targets around 4412 and 4440, with a risk-reward ratio of 1.71.
If you’re passing by, please take a moment to follow, like, and leave a comment—your support means a lot. Thank you! The information above is for chart analysis only and is not meant as trading instructions;
Follow me so you won’t get lost. I’ll bring you the latest updates and level analysis every day, along with the wealth “password” you want. Remember to follow, like, and comment #以太坊基金会启动Glamsterdam测试网 $XAU
XAU gold is trading in a 4440–4318 box range. As long as resistance at the upper boundary does not break upward and support at the lower boundary does not break down, you can keep buying low and selling high within the range.
The 4440 resistance has been touched multiple times but has not formed a valid breakout—its resistance verification is effective.
4363 provides solid support with a key horizontal level that connects above and below; it also aligns with the 0.618 retracement from the low to the high, creating a resonance with support.
4318 is the bottom support of the box. The number of retest attempts is valid—if the price breaks below it, you must cut losses, because there is no effective support underneath.
For the left-side setup: stay short from 4440, defense at 4492, targets around 4388 and 4331, with a risk-reward ratio of 2.06.
For the left-side setup: stay long from 4365, can add on dips, with defense also placed around 4318, targets around 4412 and 4440, with a risk-reward ratio of 1.71.
If you’re passing by, please take a moment to follow, like, and leave a comment—your support means a lot. Thank you! The information above is for chart analysis only and is not meant as trading instructions;
Follow me so you won’t get lost. I’ll bring you the latest updates and level analysis every day, along with the wealth “password” you want. Remember to follow, like, and comment #以太坊基金会启动Glamsterdam测试网 $XAU
8.18 Morning Market Overview: BTC short position is in profit—hold it steadily
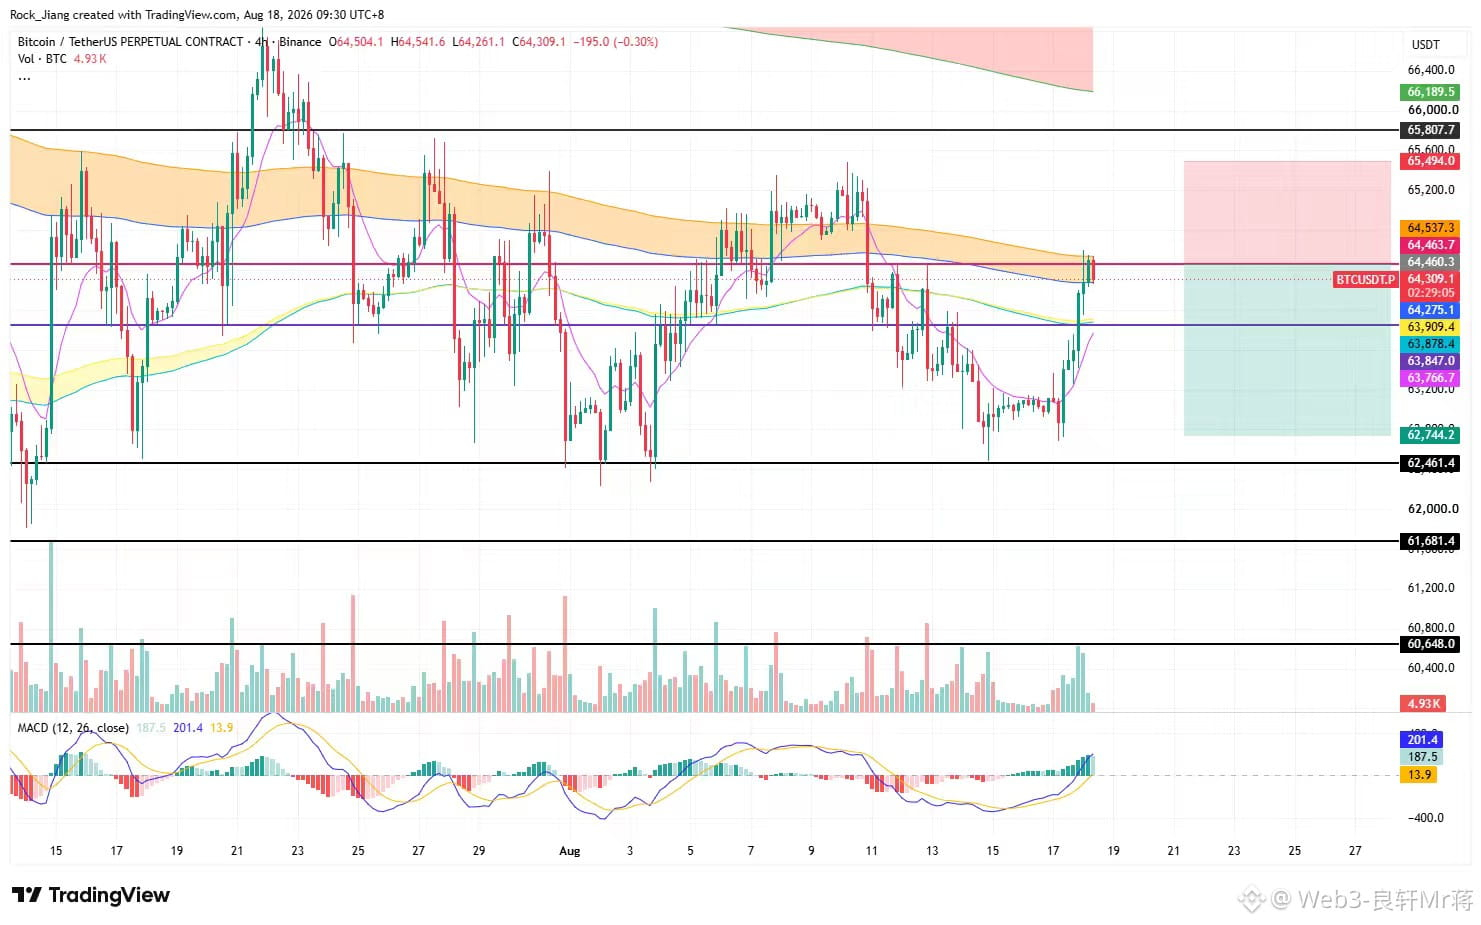
This morning BTC closed with a strong bullish candle. From the low to the high, it rebounded by 1,800 points yesterday—finally, a long-awaited rebound.
In the past two days, I’ve been emphasizing that when BTC breaks above the descending trendline, there will be a rebound. Because I saw resistance at 6.38 and 6.44, I didn’t choose to go long.
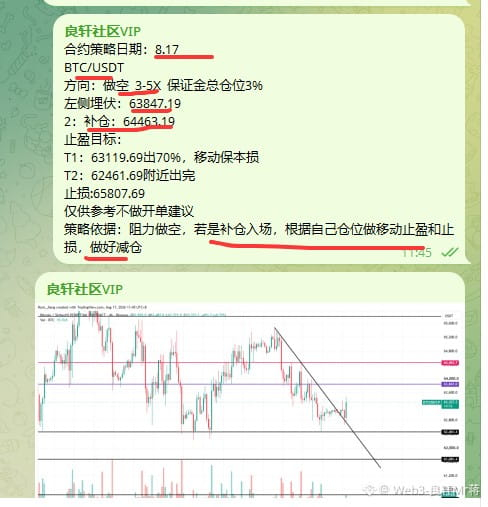
Instead, I shorted at 6.38, added more at 6.44, and raised the average short price—currently it’s in floating profit. Just be patient and hold the short position. First reduce some at the cost basis, then break even and control the risk to look at T2.
BTC rose by 1,800 points yesterday, but ultimately it met resistance at 6.44 and pulled back. This is a strong pressure and dense shorting area. Everyone will eventually reach a consensus here and short at the same time.
Put simply: if your long position is trapped here and the rebound brings price back near your cost, will you reduce your position or close and exit? And then wouldn’t that create sell pressure on the chart?
In the Vegas channel, the EMA288–338 resistance zone is also between 6.42 and 6.45, so the shorting idea is fully valid.
Looking at the 4H volume-price divergence: the volume-price relationship is inconsistent—price is rising on decreasing volume, indicating institutions and big players have already completed their de-risking and stepped out in stages, while some retail traders are left like stragglers.
6.38, which was previously resistance and has turned into support, can also be treated as the first de-risking/exit position. For those adding or entering later, you can adjust de-risking based on your own cost.
If you have no position, you can consider placing a pending short at 6.45. Defense: the previous high at 6.55. Targets: around 6.35 and 6.26. Risk-reward ratio is 1.66
If you’re passing by, please take a moment to follow, like, and leave a comment—your support means the most to me. Thanks and I appreciate it. The information above is only for chart analysis and does not constitute trade execution;
Follow me so you won’t get lost—every day I’ll bring you the latest information, latest updates, and point-by-point analysis. And for the wealth “password” you want—remember to follow, like, and {#加密初创上半年融资112亿美元 $BTC }
This morning BTC closed with a strong bullish candle. From the low to the high, it rebounded by 1,800 points yesterday—finally, a long-awaited rebound.
In the past two days, I’ve been emphasizing that when BTC breaks above the descending trendline, there will be a rebound. Because I saw resistance at 6.38 and 6.44, I didn’t choose to go long.
Instead, I shorted at 6.38, added more at 6.44, and raised the average short price—currently it’s in floating profit. Just be patient and hold the short position. First reduce some at the cost basis, then break even and control the risk to look at T2.
BTC rose by 1,800 points yesterday, but ultimately it met resistance at 6.44 and pulled back. This is a strong pressure and dense shorting area. Everyone will eventually reach a consensus here and short at the same time.
Put simply: if your long position is trapped here and the rebound brings price back near your cost, will you reduce your position or close and exit? And then wouldn’t that create sell pressure on the chart?
In the Vegas channel, the EMA288–338 resistance zone is also between 6.42 and 6.45, so the shorting idea is fully valid.
Looking at the 4H volume-price divergence: the volume-price relationship is inconsistent—price is rising on decreasing volume, indicating institutions and big players have already completed their de-risking and stepped out in stages, while some retail traders are left like stragglers.
6.38, which was previously resistance and has turned into support, can also be treated as the first de-risking/exit position. For those adding or entering later, you can adjust de-risking based on your own cost.
If you have no position, you can consider placing a pending short at 6.45. Defense: the previous high at 6.55. Targets: around 6.35 and 6.26. Risk-reward ratio is 1.66
If you’re passing by, please take a moment to follow, like, and leave a comment—your support means the most to me. Thanks and I appreciate it. The information above is only for chart analysis and does not constitute trade execution;
Follow me so you won’t get lost—every day I’ll bring you the latest information, latest updates, and point-by-point analysis. And for the wealth “password” you want—remember to follow, like, and {#加密初创上半年融资112亿美元 $BTC }
Log in to explore more content