
币圈十四姨
2.1k Posts

币圈十四姨
Report
Block User
资深女性交易员十年老炮用数据和纪律说话 不吹牛只讲逻辑$币安手续费八折返佣码: SR988
Open Trade
High-Frequency Trader
2.7 Months
0 Following
20 Followers
41 Liked
Posts
Portfolio
PINNED
·
--
Hey everyone, it’s Auntie Fourteen.
Some people say crypto is a casino. I’m not going to argue. My view is simple: whether crypto is a scam isn’t the important thing. What matters are the opportunities created by consensus and the redistribution of wealth. Once you understand that, you’ll stop asking, “Is it still too late to get in?” and start asking, “Which side of this redistribution am I on?”
My approach isn’t flashy: HODL as my foundation, with a focus on the trend. I look at technical indicators alongside community consensus, and position sizing always comes before picking coins. Good picks can win you one trade; good position management keeps you at the table. If the trend breaks, cut your losses—don’t talk to me about faith. If it hasn’t broken, hold on—don’t talk to me about being afraid of heights. Having vision means holding on. 👍
The facts show that most self-proclaimed trading gurus are all talk. If you want to learn from me, remember this: trading is simple. If you’re right, hold on; if you’re wrong, cut your losses. Don’t trade too often—let your profits run. Don’t rush to find a 100x coin; get your trading knowledge up to scratch first. Those who chase in out of FOMO usually end up losing everything. 😅
I don’t watch the charts all day. A crash in the middle of the night? I go to bed on time and don’t check the market at night. Even after three losing trades in a row, I stay calm and deal with the stress on my own—I never go around complaining. Outside crypto, I enjoy photography and singing. No matter how wild the market gets, life goes on.
People ask if I’ll stay in this space after achieving financial freedom. I will—to do what I love, and help make sure more newcomers don’t get taken for a ride.
By the way, I generally don’t talk about coins unless I think they can 10x. I’m not selling until they do. 😂
Follow me, and Auntie Fourteen will ride out the bull and bear markets with you.
Hey everyone, it’s Auntie Fourteen.
Some people say crypto is a casino. I’m not going to argue. My view is simple: whether crypto is a scam isn’t the important thing. What matters are the opportunities created by consensus and the redistribution of wealth. Once you understand that, you’ll stop asking, “Is it still too late to get in?” and start asking, “Which side of this redistribution am I on?”
My approach isn’t flashy: HODL as my foundation, with a focus on the trend. I look at technical indicators alongside community consensus, and position sizing always comes before picking coins. Good picks can win you one trade; good position management keeps you at the table. If the trend breaks, cut your losses—don’t talk to me about faith. If it hasn’t broken, hold on—don’t talk to me about being afraid of heights. Having vision means holding on. 👍
The facts show that most self-proclaimed trading gurus are all talk. If you want to learn from me, remember this: trading is simple. If you’re right, hold on; if you’re wrong, cut your losses. Don’t trade too often—let your profits run. Don’t rush to find a 100x coin; get your trading knowledge up to scratch first. Those who chase in out of FOMO usually end up losing everything. 😅
I don’t watch the charts all day. A crash in the middle of the night? I go to bed on time and don’t check the market at night. Even after three losing trades in a row, I stay calm and deal with the stress on my own—I never go around complaining. Outside crypto, I enjoy photography and singing. No matter how wild the market gets, life goes on.
People ask if I’ll stay in this space after achieving financial freedom. I will—to do what I love, and help make sure more newcomers don’t get taken for a ride.
By the way, I generally don’t talk about coins unless I think they can 10x. I’m not selling until they do. 😂
Follow me, and Auntie Fourteen will ride out the bull and bear markets with you.
Some people say crypto is a casino. I’m not going to argue. My view is simple: whether crypto is a scam isn’t the important thing. What matters are the opportunities created by consensus and the redistribution of wealth. Once you understand that, you’ll stop asking, “Is it still too late to get in?” and start asking, “Which side of this redistribution am I on?”
My approach isn’t flashy: HODL as my foundation, with a focus on the trend. I look at technical indicators alongside community consensus, and position sizing always comes before picking coins. Good picks can win you one trade; good position management keeps you at the table. If the trend breaks, cut your losses—don’t talk to me about faith. If it hasn’t broken, hold on—don’t talk to me about being afraid of heights. Having vision means holding on. 👍
The facts show that most self-proclaimed trading gurus are all talk. If you want to learn from me, remember this: trading is simple. If you’re right, hold on; if you’re wrong, cut your losses. Don’t trade too often—let your profits run. Don’t rush to find a 100x coin; get your trading knowledge up to scratch first. Those who chase in out of FOMO usually end up losing everything. 😅
I don’t watch the charts all day. A crash in the middle of the night? I go to bed on time and don’t check the market at night. Even after three losing trades in a row, I stay calm and deal with the stress on my own—I never go around complaining. Outside crypto, I enjoy photography and singing. No matter how wild the market gets, life goes on.
People ask if I’ll stay in this space after achieving financial freedom. I will—to do what I love, and help make sure more newcomers don’t get taken for a ride.
By the way, I generally don’t talk about coins unless I think they can 10x. I’m not selling until they do. 😂
Follow me, and Auntie Fourteen will ride out the bull and bear markets with you.
1
35
·
--
I just saw the Hang Seng Tech Index fall 3.02% and the Hang Seng Index fall 1.55%.
The FT says $ALIBABA and $TENCENT have lost a combined $75 billion in market value this week, amid fears that U.S. chip restrictions will tighten further after Jensen Huang's departure.
I just saw the Hang Seng Tech Index fall 3.02% and the Hang Seng Index fall 1.55%.
The FT says $ALIBABA and $TENCENT have lost a combined $75 billion in market value this week, amid fears that U.S. chip restrictions will tighten further after Jensen Huang's departure.
The FT says $ALIBABA and $TENCENT have lost a combined $75 billion in market value this week, amid fears that U.S. chip restrictions will tighten further after Jensen Huang's departure.
38
·
--
I see Chinese AI companies cutting eSSD orders because of U.S. export restrictions, so major storage vendors like $SSNLF and $SKHY are redirecting that supply to U.S. cloud customers. NAND demand at U.S. data centers is still tight, so $DRAM is another trend to keep an eye on.
I see Chinese AI companies cutting eSSD orders because of U.S. export restrictions, so major storage vendors like $SSNLF and $SKHY are redirecting that supply to U.S. cloud customers. NAND demand at U.S. data centers is still tight, so $DRAM is another trend to keep an eye on.
68
·
--
$MAGMA Let me take a look at the one-hour chart. I’m leaning bullish, provided the price holds above 0.32063.
The daily trend is aligned, but $BTC is currently bearish, so this trade would be countertrend. It would only be valid if we first see a sweep of the lows followed by a recovery.
To the upside, I’m initially watching 0.36078. If that liquidity high is taken out cleanly, then I’ll look at 0.37932.
$MAGMA Let me take a look at the one-hour chart. I’m leaning bullish, provided the price holds above 0.32063.
The daily trend is aligned, but $BTC is currently bearish, so this trade would be countertrend. It would only be valid if we first see a sweep of the lows followed by a recovery.
To the upside, I’m initially watching 0.36078. If that liquidity high is taken out cleanly, then I’ll look at 0.37932.
The daily trend is aligned, but $BTC is currently bearish, so this trade would be countertrend. It would only be valid if we first see a sweep of the lows followed by a recovery.
To the upside, I’m initially watching 0.36078. If that liquidity high is taken out cleanly, then I’ll look at 0.37932.
198
·
--
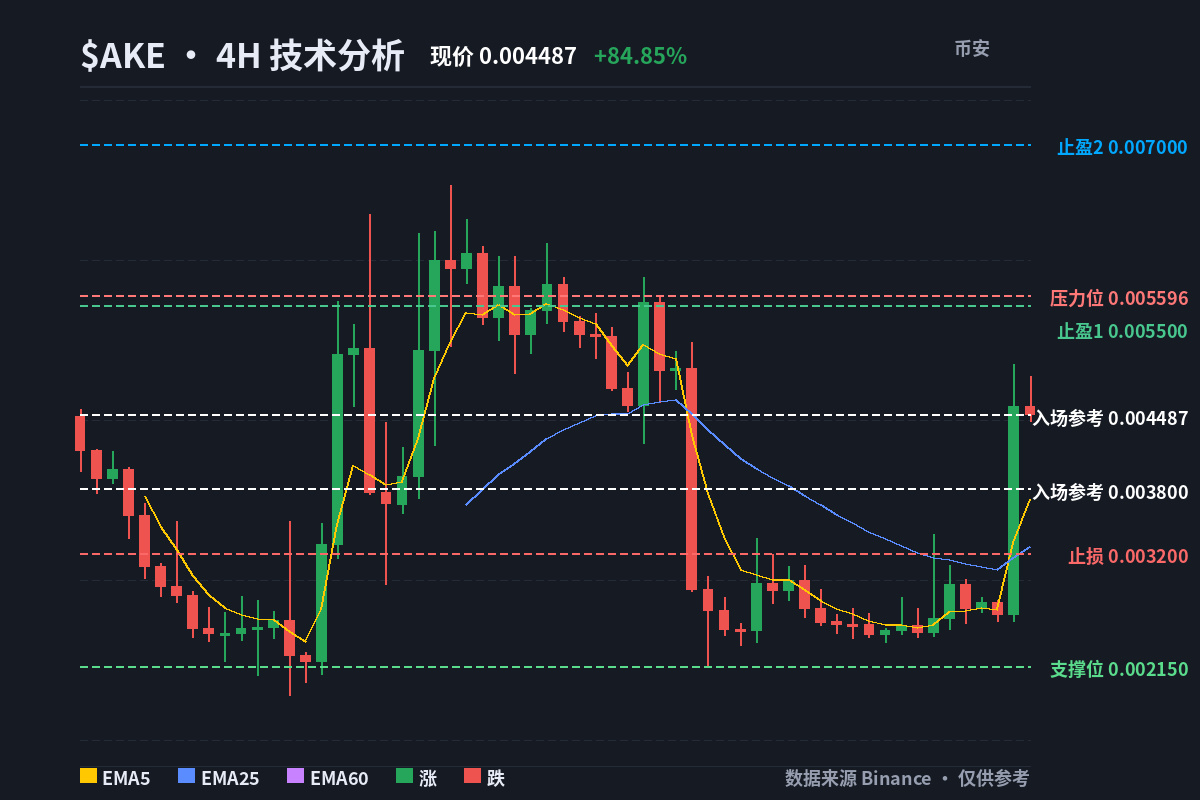
$AKE surged 84.85% in a day and shot straight to the top of the gainers’ list. I actually pulled my hand back.
What really stands out is when it made this move: BTC is down 6.66%, the Fear & Greed Index is only 19, and the whole market is in the red, while this coin is climbing on its own. This doesn’t look like a trend taking off; it feels more like someone shouting across the middle of a poker table. At the current price of 0.004564, I’m not chasing. The area where I’m waiting to buy is around 0.0038. If it breaks below 0.0032, I’m out of this game.
Volume has definitely picked up: the latest 4h contract trading volume was $8.65 million, and the daily candle’s was $143 million. But volatility over the past three 4h candles is 22.95%, and daily volatility is 38.9%. This kind of erratic movement doesn’t look like healthy price-and-volume momentum. More importantly, OI is 70M against a market cap of 89M: the positions in the contracts are nearly 80% of the entire market cap. And this coin doesn’t even have spot trading—it’s pure contract speculation, with no spot market to provide support. One gust of wind and liquidations can cascade. I know this setup: the faster it rises, the faster it turns around looking for someone to catch the bag.
The moving averages and RSI aren’t helping either. On the 4h chart, the price is above EMA5 at 0.003699, EMA25 at 0.003265, and EMA60 at 0.003691, which looks pretty strong. But EMA5 and EMA60 are only 0.000008 apart. The price has just punched through the cluster of moving averages all at once; there’s no real depth to the bullish alignment yet. On the daily chart, EMA5 at 0.003629 is up against EMA25 at 0.014519, so the bearish structure hasn’t been repaired. A 86.34% decline over the period can’t be made up with a single bullish candle. The 4h RSI7 is already overbought at 79.4, while daily RSI7 is only 38.8 and RSI14 is 33.9. The longer timeframe is still cold while the shorter one is already burning—that’s what a short-term spike looks like.
Now look at who’s taking on the risk. The 24h funding rate is +0.4018%, meaning longs are paying shorts. The account long/short ratio is 1.6911, and the large-trader position ratio is 1.5416. Retail traders and large traders are on the same side—all long. Nobody is being squeezed short. The cost of this rally is entirely on the new longs, and if the move runs out of steam, they’ll be the first to let go. An 84% gain isn’t consensus; it’s a transfer of costs.
📊 Bias: Wait for a pullback, then go long
💰 Entry: Buy around 0.0038; don’t chase at the current price of 0.004564
🛑 Stop loss: Exit if it breaks below 0.0032
🎯 Take profit 1: 0.0055
🎯 Take profit 2: 0.0070
I’ve worked out the risk/reward: chasing at the current price means 30% downside and 20% upside—a bad deal, so I’m not taking it. Buying on a retest of 0.0038 means 16% downside and 45% upside. That’s a deal I’ll take. Overbought doesn’t mean it’s topped; a tired hand does.
Will 0.0038 hold, or will 0.0032 break first? I’m betting on the former. Feel free to prove me wrong 😅
$AKE #技术分析 #Auntie Fourteen
$AKE surged 84.85% in a day and shot straight to the top of the gainers’ list. I actually pulled my hand back.
What really stands out is when it made this move: BTC is down 6.66%, the Fear & Greed Index is only 19, and the whole market is in the red, while this coin is climbing on its own. This doesn’t look like a trend taking off; it feels more like someone shouting across the middle of a poker table. At the current price of 0.004564, I’m not chasing. The area where I’m waiting to buy is around 0.0038. If it breaks below 0.0032, I’m out of this game.
Volume has definitely picked up: the latest 4h contract trading volume was $8.65 million, and the daily candle’s was $143 million. But volatility over the past three 4h candles is 22.95%, and daily volatility is 38.9%. This kind of erratic movement doesn’t look like healthy price-and-volume momentum. More importantly, OI is 70M against a market cap of 89M: the positions in the contracts are nearly 80% of the entire market cap. And this coin doesn’t even have spot trading—it’s pure contract speculation, with no spot market to provide support. One gust of wind and liquidations can cascade. I know this setup: the faster it rises, the faster it turns around looking for someone to catch the bag.
The moving averages and RSI aren’t helping either. On the 4h chart, the price is above EMA5 at 0.003699, EMA25 at 0.003265, and EMA60 at 0.003691, which looks pretty strong. But EMA5 and EMA60 are only 0.000008 apart. The price has just punched through the cluster of moving averages all at once; there’s no real depth to the bullish alignment yet. On the daily chart, EMA5 at 0.003629 is up against EMA25 at 0.014519, so the bearish structure hasn’t been repaired. A 86.34% decline over the period can’t be made up with a single bullish candle. The 4h RSI7 is already overbought at 79.4, while daily RSI7 is only 38.8 and RSI14 is 33.9. The longer timeframe is still cold while the shorter one is already burning—that’s what a short-term spike looks like.
Now look at who’s taking on the risk. The 24h funding rate is +0.4018%, meaning longs are paying shorts. The account long/short ratio is 1.6911, and the large-trader position ratio is 1.5416. Retail traders and large traders are on the same side—all long. Nobody is being squeezed short. The cost of this rally is entirely on the new longs, and if the move runs out of steam, they’ll be the first to let go. An 84% gain isn’t consensus; it’s a transfer of costs.
📊 Bias: Wait for a pullback, then go long
💰 Entry: Buy around 0.0038; don’t chase at the current price of 0.004564
🛑 Stop loss: Exit if it breaks below 0.0032
🎯 Take profit 1: 0.0055
🎯 Take profit 2: 0.0070
I’ve worked out the risk/reward: chasing at the current price means 30% downside and 20% upside—a bad deal, so I’m not taking it. Buying on a retest of 0.0038 means 16% downside and 45% upside. That’s a deal I’ll take. Overbought doesn’t mean it’s topped; a tired hand does.
Will 0.0038 hold, or will 0.0032 break first? I’m betting on the former. Feel free to prove me wrong 😅
$AKE #技术分析 #Auntie Fourteen
What really stands out is when it made this move: BTC is down 6.66%, the Fear & Greed Index is only 19, and the whole market is in the red, while this coin is climbing on its own. This doesn’t look like a trend taking off; it feels more like someone shouting across the middle of a poker table. At the current price of 0.004564, I’m not chasing. The area where I’m waiting to buy is around 0.0038. If it breaks below 0.0032, I’m out of this game.
Volume has definitely picked up: the latest 4h contract trading volume was $8.65 million, and the daily candle’s was $143 million. But volatility over the past three 4h candles is 22.95%, and daily volatility is 38.9%. This kind of erratic movement doesn’t look like healthy price-and-volume momentum. More importantly, OI is 70M against a market cap of 89M: the positions in the contracts are nearly 80% of the entire market cap. And this coin doesn’t even have spot trading—it’s pure contract speculation, with no spot market to provide support. One gust of wind and liquidations can cascade. I know this setup: the faster it rises, the faster it turns around looking for someone to catch the bag.
The moving averages and RSI aren’t helping either. On the 4h chart, the price is above EMA5 at 0.003699, EMA25 at 0.003265, and EMA60 at 0.003691, which looks pretty strong. But EMA5 and EMA60 are only 0.000008 apart. The price has just punched through the cluster of moving averages all at once; there’s no real depth to the bullish alignment yet. On the daily chart, EMA5 at 0.003629 is up against EMA25 at 0.014519, so the bearish structure hasn’t been repaired. A 86.34% decline over the period can’t be made up with a single bullish candle. The 4h RSI7 is already overbought at 79.4, while daily RSI7 is only 38.8 and RSI14 is 33.9. The longer timeframe is still cold while the shorter one is already burning—that’s what a short-term spike looks like.
Now look at who’s taking on the risk. The 24h funding rate is +0.4018%, meaning longs are paying shorts. The account long/short ratio is 1.6911, and the large-trader position ratio is 1.5416. Retail traders and large traders are on the same side—all long. Nobody is being squeezed short. The cost of this rally is entirely on the new longs, and if the move runs out of steam, they’ll be the first to let go. An 84% gain isn’t consensus; it’s a transfer of costs.
📊 Bias: Wait for a pullback, then go long
💰 Entry: Buy around 0.0038; don’t chase at the current price of 0.004564
🛑 Stop loss: Exit if it breaks below 0.0032
🎯 Take profit 1: 0.0055
🎯 Take profit 2: 0.0070
I’ve worked out the risk/reward: chasing at the current price means 30% downside and 20% upside—a bad deal, so I’m not taking it. Buying on a retest of 0.0038 means 16% downside and 45% upside. That’s a deal I’ll take. Overbought doesn’t mean it’s topped; a tired hand does.
Will 0.0038 hold, or will 0.0032 break first? I’m betting on the former. Feel free to prove me wrong 😅
$AKE #技术分析 #Auntie Fourteen
166
·
--
I took a look at Thursday’s U.S. market close: the Dow fell 0.36%, the S&P 500 dropped 0.35%, and the Nasdaq slid 0.39%—a modest decline across the board.
$NVDA closed down 4.3%, after plunging as much as 13% intraday. That’s a pretty alarming swing;
on the other hand, some chip stocks rose more than 5.5%, helping to steady things a bit.
$SKHY fell 3%.
Chinese stocks listed in the U.S. also had a rough session: the Nasdaq Golden Dragon China Index closed down 3.1%, and $BABA fell 7%.
My take is that while the indexes were only slightly lower, individual stocks were sharply divided. The sudden intraday plunge in a stock like $NVDA in particular suggests investor sentiment is still unsettled.
I took a look at Thursday’s U.S. market close: the Dow fell 0.36%, the S&P 500 dropped 0.35%, and the Nasdaq slid 0.39%—a modest decline across the board.
$NVDA closed down 4.3%, after plunging as much as 13% intraday. That’s a pretty alarming swing;
on the other hand, some chip stocks rose more than 5.5%, helping to steady things a bit.
$SKHY fell 3%.
Chinese stocks listed in the U.S. also had a rough session: the Nasdaq Golden Dragon China Index closed down 3.1%, and $BABA fell 7%.
My take is that while the indexes were only slightly lower, individual stocks were sharply divided. The sudden intraday plunge in a stock like $NVDA in particular suggests investor sentiment is still unsettled.
$NVDA closed down 4.3%, after plunging as much as 13% intraday. That’s a pretty alarming swing;
on the other hand, some chip stocks rose more than 5.5%, helping to steady things a bit.
$SKHY fell 3%.
Chinese stocks listed in the U.S. also had a rough session: the Nasdaq Golden Dragon China Index closed down 3.1%, and $BABA fell 7%.
My take is that while the indexes were only slightly lower, individual stocks were sharply divided. The sudden intraday plunge in a stock like $NVDA in particular suggests investor sentiment is still unsettled.
194
·
--
$ZHIPU is down 2.8% on this move, and volume has surged to 5x. Is this a warning of distribution, or is a deeper pullback just getting started?
I’m leaning bearish: the 1-hour structure is clearly in a downtrend, with both highs and lows moving lower. We’ve just seen another sharp sell-off of -2.8%, accompanied by an extreme 5x spike in relative volume. This price action doesn’t look good to me.
$ZHIPU is down 2.8% on this move, and volume has surged to 5x. Is this a warning of distribution, or is a deeper pullback just getting started?
I’m leaning bearish: the 1-hour structure is clearly in a downtrend, with both highs and lows moving lower. We’ve just seen another sharp sell-off of -2.8%, accompanied by an extreme 5x spike in relative volume. This price action doesn’t look good to me.
I’m leaning bearish: the 1-hour structure is clearly in a downtrend, with both highs and lows moving lower. We’ve just seen another sharp sell-off of -2.8%, accompanied by an extreme 5x spike in relative volume. This price action doesn’t look good to me.
283
·
--
I think this mega-IPO is basically a liquidity vacuum colliding with an AI re-rating: an IPO this huge will pull institutional money hard into pure-play AI software, forcing Wall Street to reprice the entire AI stack.
It’s also a major validation for custom AI chips like $AVGO and $MRVL—not just the GPU-only approach. Anthropic...
I think this mega-IPO is basically a liquidity vacuum colliding with an AI re-rating: an IPO this huge will pull institutional money hard into pure-play AI software, forcing Wall Street to reprice the entire AI stack.
It’s also a major validation for custom AI chips like $AVGO and $MRVL —not just the GPU-only approach. Anthropic...
It’s also a major validation for custom AI chips like $AVGO and $MRVL —not just the GPU-only approach. Anthropic...
165
·
--
The key issue now isn’t demand, but the attitude on the supply side: $NVDA was able to secure HBM capacity back then because Huang had spent years building relationships and trust with memory makers like Samsung and SK Hynix.
But what about a “newcomer” buyer—would they still be as willing to supply them as readily as they did Huang?
The same goes for $TSM : whether it can get priority access to capacity for the latest chips is still an open question.
Put simply, Huang’s influence and trust within this supply chain were real advantages. If that foundation starts to erode, $NVDA could easily run into trouble.
The key issue now isn’t demand, but the attitude on the supply side: $NVDA was able to secure HBM capacity back then because Huang had spent years building relationships and trust with memory makers like Samsung and SK Hynix.
But what about a “newcomer” buyer—would they still be as willing to supply them as readily as they did Huang?
The same goes for $TSM : whether it can get priority access to capacity for the latest chips is still an open question.
Put simply, Huang’s influence and trust within this supply chain were real advantages. If that foundation starts to erode, $NVDA could easily run into trouble.
But what about a “newcomer” buyer—would they still be as willing to supply them as readily as they did Huang?
The same goes for $TSM : whether it can get priority access to capacity for the latest chips is still an open question.
Put simply, Huang’s influence and trust within this supply chain were real advantages. If that foundation starts to erode, $NVDA could easily run into trouble.
147
·
--
I’ve been looking through Tencent’s books lately: $TENCENT in the first half of 2026, capital expenditure was RMB 84.7 billion and personnel costs were RMB 64.5 billion.
A year ago, capex was only 0.7 times payroll; now it’s jumped straight to 1.3 times.
Capex rose by about 82%, while personnel costs have barely moved.
Put simply, the infrastructure bill has to be watched every month just like headcount—and at Tencent, it’s now the bigger of the two.
I’ve been looking through Tencent’s books lately: $TENCENT in the first half of 2026, capital expenditure was RMB 84.7 billion and personnel costs were RMB 64.5 billion.
A year ago, capex was only 0.7 times payroll; now it’s jumped straight to 1.3 times.
Capex rose by about 82%, while personnel costs have barely moved.
Put simply, the infrastructure bill has to be watched every month just like headcount—and at Tencent, it’s now the bigger of the two.
A year ago, capex was only 0.7 times payroll; now it’s jumped straight to 1.3 times.
Capex rose by about 82%, while personnel costs have barely moved.
Put simply, the infrastructure bill has to be watched every month just like headcount—and at Tencent, it’s now the bigger of the two.
52
·
--
After the close on November 30, $MSTR will leave the MSCI USA Index, so passive funds tracking the index may have to sell shares.
Strategy still holds those 850,364 $BTC; there are no forced sales or delisting.
What I really care about is this: with less passive buying of $MSTR , could Bitcoin’s buying momentum slow in the future?
After the close on November 30, $MSTR will leave the MSCI USA Index, so passive funds tracking the index may have to sell shares.
Strategy still holds those 850,364 $BTC ; there are no forced sales or delisting.
What I really care about is this: with less passive buying of $MSTR , could Bitcoin’s buying momentum slow in the future?
Strategy still holds those 850,364 $BTC ; there are no forced sales or delisting.
What I really care about is this: with less passive buying of $MSTR , could Bitcoin’s buying momentum slow in the future?
228
·
--
$DODOX funding rate: +0.0331%. This number is a lot more interesting than its 8.58% gain. The longs are paying out of pocket every day to pay the shorts protection money, while BTC is still sitting at -3.40%. Auntie Fourteen has seen this act plenty of times—the more急ly it rises, the more uneasy the side paying up gets.
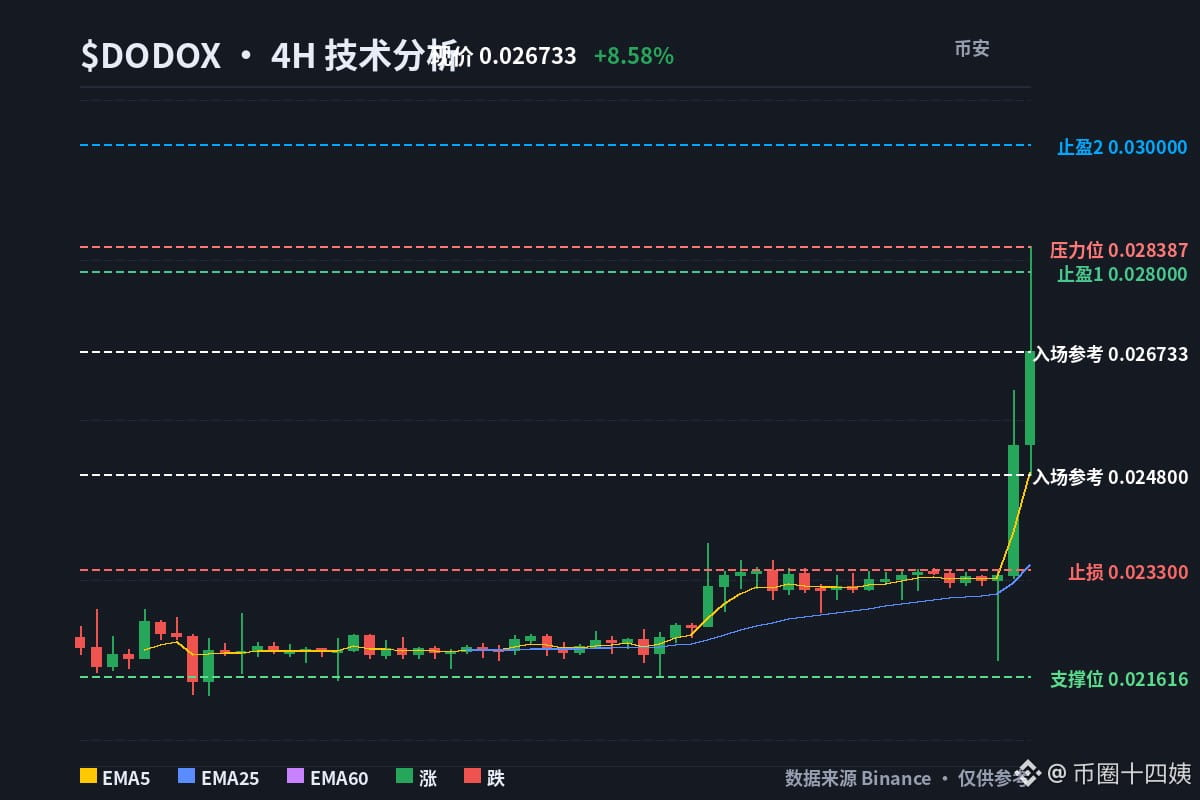
I’m not chasing at the current price of 0.025247. If I’m getting in, I’ll wait for a pullback to 0.0248, around the 4h EMA5 line. If it drops below 0.0233, I’ll admit defeat and get out. I’ll leave the middle stretch to the quick-handed traders. Let me be clear upfront: it’s not that I’m bearish, I’m just not buying at this price.
Let’s lay out the technicals. The 4h EMAs 5/25/60 are at 0.024819/0.023379/0.02254, a textbook bullish alignment. The daily 5/25 are lined up at 0.024129/0.022837, so the trend itself is fine. The trouble is the RSI—the 4h 7-period is 95.0, the 14-period is 89.1, and the daily 14-period is 70.5, just having crossed 70. That’s not strength; that’s a hand cramp.
Sentiment is even more straightforward. A positive funding rate of 0.0331% means perpetual-contract longs are paying to keep their positions open—crowded longs are plain to see. But the account long/short ratio is 0.9448, so smaller accounts haven’t actually dared to go in big; the large-holder position ratio is 2.0618, with more than twice as many longs concentrated in a handful of accounts. This divergence looks like “smart money is bullish,” but once the leverage structure loosens, the first to run will be the most heavily positioned. OI is 5M against a 28M market cap, nearly 18%; the latest daily candle had $20.45 million in trading volume—turning over 70% of the market cap in a day. This isn’t a slow bull run; it’s a scramble for chairs.
The broader market isn’t helping either: BTC -3.40%, ALL -3.89%, yet $DODOX is still sitting at No. 3 on the gainers list, moving independently. An independent move has only two outcomes: it establishes its own trend, or it catches down harder than everything else. Volatility across the last 3 candles is 10%; both the 4h and daily readings are in double digits. Bulls and bears are both playing for real—neither side is sitting out. The contract has been listed for 1192 days, so it’s an established market; liquidity probably won’t disappear, but you also won’t get the kind of bargain where a new coin shoots straight up on a single wick.
Here’s the risk/reward: chase at the current price, and the downside is 7.7% (to 0.0233) versus 18.8% upside (to 0.0300). The numbers don’t look bad, but the odds aren’t on my side, so I’m passing. Enter on a pullback to 0.0248, and it’s 6.0% downside versus 21.0% upside. I’ll take that.
A rally built on leverage loses its ladder faster than it builds one.
📊 Direction: Wait for a pullback, then go long
💰 Entry reference: Buy near 0.0248 on a pullback
🛑 Stop-loss: Exit if it falls below 0.0233
🎯 Take profit 1: 0.0280
🎯 Take profit 2: 0.0300
Will 0.0248 hold, or will 0.0233 break first? I’m betting on the former—feel free to prove me wrong 😅
$DODOX #技术分析 #AuntieFourteen
$DODOX funding rate: +0.0331%. This number is a lot more interesting than its 8.58% gain. The longs are paying out of pocket every day to pay the shorts protection money, while BTC is still sitting at -3.40%. Auntie Fourteen has seen this act plenty of times—the more急ly it rises, the more uneasy the side paying up gets.
I’m not chasing at the current price of 0.025247. If I’m getting in, I’ll wait for a pullback to 0.0248, around the 4h EMA5 line. If it drops below 0.0233, I’ll admit defeat and get out. I’ll leave the middle stretch to the quick-handed traders. Let me be clear upfront: it’s not that I’m bearish, I’m just not buying at this price.
Let’s lay out the technicals. The 4h EMAs 5/25/60 are at 0.024819/0.023379/0.02254, a textbook bullish alignment. The daily 5/25 are lined up at 0.024129/0.022837, so the trend itself is fine. The trouble is the RSI—the 4h 7-period is 95.0, the 14-period is 89.1, and the daily 14-period is 70.5, just having crossed 70. That’s not strength; that’s a hand cramp.
Sentiment is even more straightforward. A positive funding rate of 0.0331% means perpetual-contract longs are paying to keep their positions open—crowded longs are plain to see. But the account long/short ratio is 0.9448, so smaller accounts haven’t actually dared to go in big; the large-holder position ratio is 2.0618, with more than twice as many longs concentrated in a handful of accounts. This divergence looks like “smart money is bullish,” but once the leverage structure loosens, the first to run will be the most heavily positioned. OI is 5M against a 28M market cap, nearly 18%; the latest daily candle had $20.45 million in trading volume—turning over 70% of the market cap in a day. This isn’t a slow bull run; it’s a scramble for chairs.
The broader market isn’t helping either: BTC -3.40%, ALL -3.89%, yet $DODOX is still sitting at No. 3 on the gainers list, moving independently. An independent move has only two outcomes: it establishes its own trend, or it catches down harder than everything else. Volatility across the last 3 candles is 10%; both the 4h and daily readings are in double digits. Bulls and bears are both playing for real—neither side is sitting out. The contract has been listed for 1192 days, so it’s an established market; liquidity probably won’t disappear, but you also won’t get the kind of bargain where a new coin shoots straight up on a single wick.
Here’s the risk/reward: chase at the current price, and the downside is 7.7% (to 0.0233) versus 18.8% upside (to 0.0300). The numbers don’t look bad, but the odds aren’t on my side, so I’m passing. Enter on a pullback to 0.0248, and it’s 6.0% downside versus 21.0% upside. I’ll take that.
A rally built on leverage loses its ladder faster than it builds one.
📊 Direction: Wait for a pullback, then go long
💰 Entry reference: Buy near 0.0248 on a pullback
🛑 Stop-loss: Exit if it falls below 0.0233
🎯 Take profit 1: 0.0280
🎯 Take profit 2: 0.0300
Will 0.0248 hold, or will 0.0233 break first? I’m betting on the former—feel free to prove me wrong 😅
$DODOX #技术分析 #AuntieFourteen
I’m not chasing at the current price of 0.025247. If I’m getting in, I’ll wait for a pullback to 0.0248, around the 4h EMA5 line. If it drops below 0.0233, I’ll admit defeat and get out. I’ll leave the middle stretch to the quick-handed traders. Let me be clear upfront: it’s not that I’m bearish, I’m just not buying at this price.
Let’s lay out the technicals. The 4h EMAs 5/25/60 are at 0.024819/0.023379/0.02254, a textbook bullish alignment. The daily 5/25 are lined up at 0.024129/0.022837, so the trend itself is fine. The trouble is the RSI—the 4h 7-period is 95.0, the 14-period is 89.1, and the daily 14-period is 70.5, just having crossed 70. That’s not strength; that’s a hand cramp.
Sentiment is even more straightforward. A positive funding rate of 0.0331% means perpetual-contract longs are paying to keep their positions open—crowded longs are plain to see. But the account long/short ratio is 0.9448, so smaller accounts haven’t actually dared to go in big; the large-holder position ratio is 2.0618, with more than twice as many longs concentrated in a handful of accounts. This divergence looks like “smart money is bullish,” but once the leverage structure loosens, the first to run will be the most heavily positioned. OI is 5M against a 28M market cap, nearly 18%; the latest daily candle had $20.45 million in trading volume—turning over 70% of the market cap in a day. This isn’t a slow bull run; it’s a scramble for chairs.
The broader market isn’t helping either: BTC -3.40%, ALL -3.89%, yet $DODOX is still sitting at No. 3 on the gainers list, moving independently. An independent move has only two outcomes: it establishes its own trend, or it catches down harder than everything else. Volatility across the last 3 candles is 10%; both the 4h and daily readings are in double digits. Bulls and bears are both playing for real—neither side is sitting out. The contract has been listed for 1192 days, so it’s an established market; liquidity probably won’t disappear, but you also won’t get the kind of bargain where a new coin shoots straight up on a single wick.
Here’s the risk/reward: chase at the current price, and the downside is 7.7% (to 0.0233) versus 18.8% upside (to 0.0300). The numbers don’t look bad, but the odds aren’t on my side, so I’m passing. Enter on a pullback to 0.0248, and it’s 6.0% downside versus 21.0% upside. I’ll take that.
A rally built on leverage loses its ladder faster than it builds one.
📊 Direction: Wait for a pullback, then go long
💰 Entry reference: Buy near 0.0248 on a pullback
🛑 Stop-loss: Exit if it falls below 0.0233
🎯 Take profit 1: 0.0280
🎯 Take profit 2: 0.0300
Will 0.0248 hold, or will 0.0233 break first? I’m betting on the former—feel free to prove me wrong 😅
$DODOX #技术分析 #AuntieFourteen
411
·
--
$SNXX plunged 3.7% in just fifteen minutes, with volume also swelling to 1.9 times its previous level. The chart structure speaks for itself—there’s really not much to be optimistic about.
I’m still bearish on $SNXX . After the sharp drop and surge in volume, the one-hour chart is completely aligned in a bearish formation, with highs and lows continuing to fall. The daily trend and $BTC aren’t helping either.
$SNXX plunged 3.7% in just fifteen minutes, with volume also swelling to 1.9 times its previous level. The chart structure speaks for itself—there’s really not much to be optimistic about.
I’m still bearish on $SNXX . After the sharp drop and surge in volume, the one-hour chart is completely aligned in a bearish formation, with highs and lows continuing to fall. The daily trend and $BTC aren’t helping either.
I’m still bearish on $SNXX . After the sharp drop and surge in volume, the one-hour chart is completely aligned in a bearish formation, with highs and lows continuing to fall. The daily trend and $BTC aren’t helping either.
331
·
--
$PLAY rose 15.20% in 24 hours, climbing to 3rd place on the gainers' list. And the funding rate is still charging +0.2125%—longs are paying to stay in while the price rises. I've seen this show before.
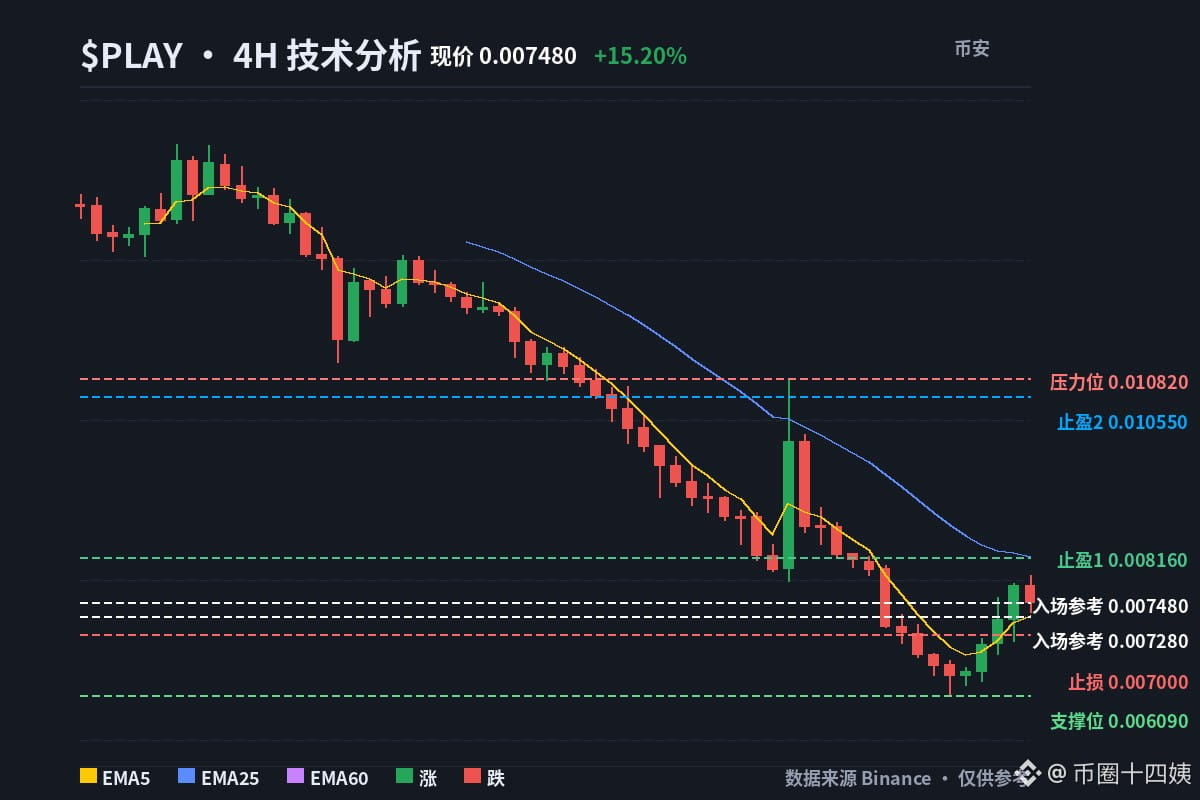
At the current price of 0.00773, Auntie Fourteen isn't chasing. There's resistance overhead at 0.00816, where the 4-hour EMA25 and daily EMA5 converge, 5.6% above the current price. Below, 0.00728 is the 4-hour EMA5, then the round-number level at 0.0070. If I'm getting in, I'll wait for a pullback to 0.00728. If it breaks below 0.0070, I'll admit defeat and get out. I'm staying away from the middle.
Sentiment is really striking today. The funding rate is positive 0.2125%, so longs have to pay shorts rent every few hours—and the price is still rising. Longs are already paying up. The account long/short ratio is 3.6729, and the top traders' position ratio is 1.3345. Retail longs outnumber top-trader longs by 2.75 to 1. That divergence is right there in front of us; I don't think big money is leading the charge. It looks more like small traders cheering each other on. 👍
OI is 4M, market cap is 8M, and open positions are worth half the market cap. The latest daily candle had 9.27 million in trading volume, more than the entire market cap. Daily turnover exceeded the market cap by more than 100%—this move came from short-term traders going head-to-head, not from anyone quietly accumulating. It rose fast, and it could unwind just as fast.
Now let's look at the chart. The 4-hour chart is down 44.22% over 60 candles, and the daily chart is down 59.67% over 30 candles. Today's 15.20% rise is just a bounce in that hole. Daily RSI7 is only 24.1 and RSI14 is 25.8, so it really is oversold. But the price is still below the daily EMA5 at 0.008165 and EMA25 at 0.012772, and the bearish moving-average alignment hasn't improved at all. Oversold doesn't mean it's bottomed; it just means the decline is taking a breather. 😂
BTC is down 3.16% over 24 hours, ALL is down 4.32%, while $PLAY is up 15.20% against the broader market. I've seen plenty of coins move independently; most end up catching down, while a few really do have a story behind them. It's been listed on futures for 468 days, so it's no newcomer. When something suddenly moves independently, I'd rather treat it as a sentiment-driven move.
Here's the risk/reward: chasing at 0.00773 with a stop at 0.0070 means a 9.4% loss. Reaching 0.00816 would only give 5.6% upside. That's 9.4% down for 5.6% up—an upside-down trade. I'm not taking it. If I enter on a pullback to 0.00728, the same stop means a loss of just 3.8%; reaching 0.00816 gives 12.1% upside, and reaching 0.01055 gives 44.9%. That trade I'll take.
My bet is that the first to fold will be the longs who chased the rally—the ones paying the funding, on the wrong side of the divergence, with their stops all clustered at the same 0.0070 level.
📊 Direction: Wait for a pullback, then go long
💰 Entry reference: Scale in on a pullback to 0.00728 (4-hour EMA5)
🛑 Stop loss: Below 0.0070
🎯 Take profit 1: 0.00816 (where the 4-hour EMA25 and daily EMA5 converge)
🎯 Take profit 2: 0.01055 (4-hour EMA60)
Will 0.00728 hold, or will 0.0070 break first? I'm betting on the former. Feel free to prove me wrong. 😅
$PLAY #技术分析 #Auntie Fourteen
$PLAY rose 15.20% in 24 hours, climbing to 3rd place on the gainers' list. And the funding rate is still charging +0.2125%—longs are paying to stay in while the price rises. I've seen this show before.
At the current price of 0.00773, Auntie Fourteen isn't chasing. There's resistance overhead at 0.00816, where the 4-hour EMA25 and daily EMA5 converge, 5.6% above the current price. Below, 0.00728 is the 4-hour EMA5, then the round-number level at 0.0070. If I'm getting in, I'll wait for a pullback to 0.00728. If it breaks below 0.0070, I'll admit defeat and get out. I'm staying away from the middle.
Sentiment is really striking today. The funding rate is positive 0.2125%, so longs have to pay shorts rent every few hours—and the price is still rising. Longs are already paying up. The account long/short ratio is 3.6729, and the top traders' position ratio is 1.3345. Retail longs outnumber top-trader longs by 2.75 to 1. That divergence is right there in front of us; I don't think big money is leading the charge. It looks more like small traders cheering each other on. 👍
OI is 4M, market cap is 8M, and open positions are worth half the market cap. The latest daily candle had 9.27 million in trading volume, more than the entire market cap. Daily turnover exceeded the market cap by more than 100%—this move came from short-term traders going head-to-head, not from anyone quietly accumulating. It rose fast, and it could unwind just as fast.
Now let's look at the chart. The 4-hour chart is down 44.22% over 60 candles, and the daily chart is down 59.67% over 30 candles. Today's 15.20% rise is just a bounce in that hole. Daily RSI7 is only 24.1 and RSI14 is 25.8, so it really is oversold. But the price is still below the daily EMA5 at 0.008165 and EMA25 at 0.012772, and the bearish moving-average alignment hasn't improved at all. Oversold doesn't mean it's bottomed; it just means the decline is taking a breather. 😂
BTC is down 3.16% over 24 hours, ALL is down 4.32%, while $PLAY is up 15.20% against the broader market. I've seen plenty of coins move independently; most end up catching down, while a few really do have a story behind them. It's been listed on futures for 468 days, so it's no newcomer. When something suddenly moves independently, I'd rather treat it as a sentiment-driven move.
Here's the risk/reward: chasing at 0.00773 with a stop at 0.0070 means a 9.4% loss. Reaching 0.00816 would only give 5.6% upside. That's 9.4% down for 5.6% up—an upside-down trade. I'm not taking it. If I enter on a pullback to 0.00728, the same stop means a loss of just 3.8%; reaching 0.00816 gives 12.1% upside, and reaching 0.01055 gives 44.9%. That trade I'll take.
My bet is that the first to fold will be the longs who chased the rally—the ones paying the funding, on the wrong side of the divergence, with their stops all clustered at the same 0.0070 level.
📊 Direction: Wait for a pullback, then go long
💰 Entry reference: Scale in on a pullback to 0.00728 (4-hour EMA5)
🛑 Stop loss: Below 0.0070
🎯 Take profit 1: 0.00816 (where the 4-hour EMA25 and daily EMA5 converge)
🎯 Take profit 2: 0.01055 (4-hour EMA60)
Will 0.00728 hold, or will 0.0070 break first? I'm betting on the former. Feel free to prove me wrong. 😅
$PLAY #技术分析 #Auntie Fourteen
At the current price of 0.00773, Auntie Fourteen isn't chasing. There's resistance overhead at 0.00816, where the 4-hour EMA25 and daily EMA5 converge, 5.6% above the current price. Below, 0.00728 is the 4-hour EMA5, then the round-number level at 0.0070. If I'm getting in, I'll wait for a pullback to 0.00728. If it breaks below 0.0070, I'll admit defeat and get out. I'm staying away from the middle.
Sentiment is really striking today. The funding rate is positive 0.2125%, so longs have to pay shorts rent every few hours—and the price is still rising. Longs are already paying up. The account long/short ratio is 3.6729, and the top traders' position ratio is 1.3345. Retail longs outnumber top-trader longs by 2.75 to 1. That divergence is right there in front of us; I don't think big money is leading the charge. It looks more like small traders cheering each other on. 👍
OI is 4M, market cap is 8M, and open positions are worth half the market cap. The latest daily candle had 9.27 million in trading volume, more than the entire market cap. Daily turnover exceeded the market cap by more than 100%—this move came from short-term traders going head-to-head, not from anyone quietly accumulating. It rose fast, and it could unwind just as fast.
Now let's look at the chart. The 4-hour chart is down 44.22% over 60 candles, and the daily chart is down 59.67% over 30 candles. Today's 15.20% rise is just a bounce in that hole. Daily RSI7 is only 24.1 and RSI14 is 25.8, so it really is oversold. But the price is still below the daily EMA5 at 0.008165 and EMA25 at 0.012772, and the bearish moving-average alignment hasn't improved at all. Oversold doesn't mean it's bottomed; it just means the decline is taking a breather. 😂
BTC is down 3.16% over 24 hours, ALL is down 4.32%, while $PLAY is up 15.20% against the broader market. I've seen plenty of coins move independently; most end up catching down, while a few really do have a story behind them. It's been listed on futures for 468 days, so it's no newcomer. When something suddenly moves independently, I'd rather treat it as a sentiment-driven move.
Here's the risk/reward: chasing at 0.00773 with a stop at 0.0070 means a 9.4% loss. Reaching 0.00816 would only give 5.6% upside. That's 9.4% down for 5.6% up—an upside-down trade. I'm not taking it. If I enter on a pullback to 0.00728, the same stop means a loss of just 3.8%; reaching 0.00816 gives 12.1% upside, and reaching 0.01055 gives 44.9%. That trade I'll take.
My bet is that the first to fold will be the longs who chased the rally—the ones paying the funding, on the wrong side of the divergence, with their stops all clustered at the same 0.0070 level.
📊 Direction: Wait for a pullback, then go long
💰 Entry reference: Scale in on a pullback to 0.00728 (4-hour EMA5)
🛑 Stop loss: Below 0.0070
🎯 Take profit 1: 0.00816 (where the 4-hour EMA25 and daily EMA5 converge)
🎯 Take profit 2: 0.01055 (4-hour EMA60)
Will 0.00728 hold, or will 0.0070 break first? I'm betting on the former. Feel free to prove me wrong. 😅
$PLAY #技术分析 #Auntie Fourteen
91
·
--
I’ve recently been watching the two marginal buyers of $BTC — ETFs and treasury companies — and both have now gone quiet.
The scale of passive selling on $MSTR ’s side isn’t large, and it was already expected;
what I’m paying more attention to is when ETF flows turn positive again.
As for how I handle this kind of buying drought in my own strategy, I’ll write about that separately later.
This does not constitute investment advice.
I’ve recently been watching the two marginal buyers of $BTC — ETFs and treasury companies — and both have now gone quiet.
The scale of passive selling on $MSTR ’s side isn’t large, and it was already expected;
what I’m paying more attention to is when ETF flows turn positive again.
As for how I handle this kind of buying drought in my own strategy, I’ll write about that separately later.
This does not constitute investment advice.
The scale of passive selling on $MSTR ’s side isn’t large, and it was already expected;
what I’m paying more attention to is when ETF flows turn positive again.
As for how I handle this kind of buying drought in my own strategy, I’ll write about that separately later.
This does not constitute investment advice.
406
·
--
Looking at this group of stocks, $CRWV is leading the pack, up 14%. $SKHY is also in the 5%–8% range, while several other semiconductor and AI hardware names are moving higher in tandem. $NVDA is up a modest 3%.
The market is showing signs of life, but whether it can hold its ground depends on whether these stocks can maintain their gains after the open.
Looking at this group of stocks, $CRWV is leading the pack, up 14%. $SKHY is also in the 5%–8% range, while several other semiconductor and AI hardware names are moving higher in tandem. $NVDA is up a modest 3%.
The market is showing signs of life, but whether it can hold its ground depends on whether these stocks can maintain their gains after the open.
The market is showing signs of life, but whether it can hold its ground depends on whether these stocks can maintain their gains after the open.
404
·
--
We saw this MSCI thing coming a long time ago, so it’s no surprise.
Anyway, I’m still holding $MSTR and haven’t touched it.
We saw this MSCI thing coming a long time ago, so it’s no surprise.
Anyway, I’m still holding $MSTR and haven’t touched it.
Anyway, I’m still holding $MSTR and haven’t touched it.
45
·
--
Samsung has brought forward the schedule for its new HBM packaging line by a full year.
The 46 trillion won framework itself isn’t news; the real change is that construction has begun, and operations are now slated to start in June 2028.
This pace is a signal worth watching for both $DRAM and $SKHY .
Samsung has brought forward the schedule for its new HBM packaging line by a full year.
The 46 trillion won framework itself isn’t news; the real change is that construction has begun, and operations are now slated to start in June 2028.
This pace is a signal worth watching for both $DRAM and $SKHY .
The 46 trillion won framework itself isn’t news; the real change is that construction has begun, and operations are now slated to start in June 2028.
This pace is a signal worth watching for both $DRAM and $SKHY .
73
·
--
I took a look at the $KGEN daily chart. It’s formed a descending wedge and looks like it may be about to reverse.
You can see buyers stepping in near the 0.06–0.07 support zone. If it can get back above 0.09, the way opens toward 0.12 and 0.17.
My bigger target is 0.208, which is roughly 147% upside.
I took a look at the $KGEN daily chart. It’s formed a descending wedge and looks like it may be about to reverse.
You can see buyers stepping in near the 0.06–0.07 support zone. If it can get back above 0.09, the way opens toward 0.12 and 0.17.
My bigger target is 0.208, which is roughly 147% upside.
You can see buyers stepping in near the 0.06–0.07 support zone. If it can get back above 0.09, the way opens toward 0.12 and 0.17.
My bigger target is 0.208, which is roughly 147% upside.
208
·
--
MSCI confirmed that it will remove $MSTR from its indices after November 30.
It closed at 122.35, up 1.06%, then fell another 1.8% after hours to 120.20 (8 p.m. ET). It’s now below its 200-day moving average of 133.16.
I’m just wondering whether this wave of selling pressure is over, or if it will drag on until the end of the month.
MSCI confirmed that it will remove $MSTR from its indices after November 30.
It closed at 122.35, up 1.06%, then fell another 1.8% after hours to 120.20 (8 p.m. ET). It’s now below its 200-day moving average of 133.16.
I’m just wondering whether this wave of selling pressure is over, or if it will drag on until the end of the month.
It closed at 122.35, up 1.06%, then fell another 1.8% after hours to 120.20 (8 p.m. ET). It’s now below its 200-day moving average of 133.16.
I’m just wondering whether this wave of selling pressure is over, or if it will drag on until the end of the month.
77
Log in to explore more content
Join global crypto users on Binance Square
⚡️ Get latest and useful information about crypto.
💬 Trusted by the world’s largest crypto exchange.
👍 Discover real insights from verified creators.
Email / Phone number
Trending Topics
USPPIMissMayEaseBTCPressure
3,396 views
183 Discussing
US PPI Rises 6.5% a Year in October, Slightly Below 6.6% Forecast
Binance News
·10 Likes
·6.6k views
BitcoinCoreDisclosesTorTrafficVulnerability
0 views
0 Discussing
WhatWillDriveCryptoandStocks’NextRebound?
88,888 views
1,201 Discussing