

币圈十四爷
250 Posts

币圈十四爷
Report
Block User
专职交易为生量化与主观并行🐮 赚认知内的钱 亏计划内的亏 慢就是快活着才有复利🐌 币安手续费8折返佣码SR988
Open Trade
8 Days
0 Following
2 Followers
7 Liked
Posts
Portfolio
·
--
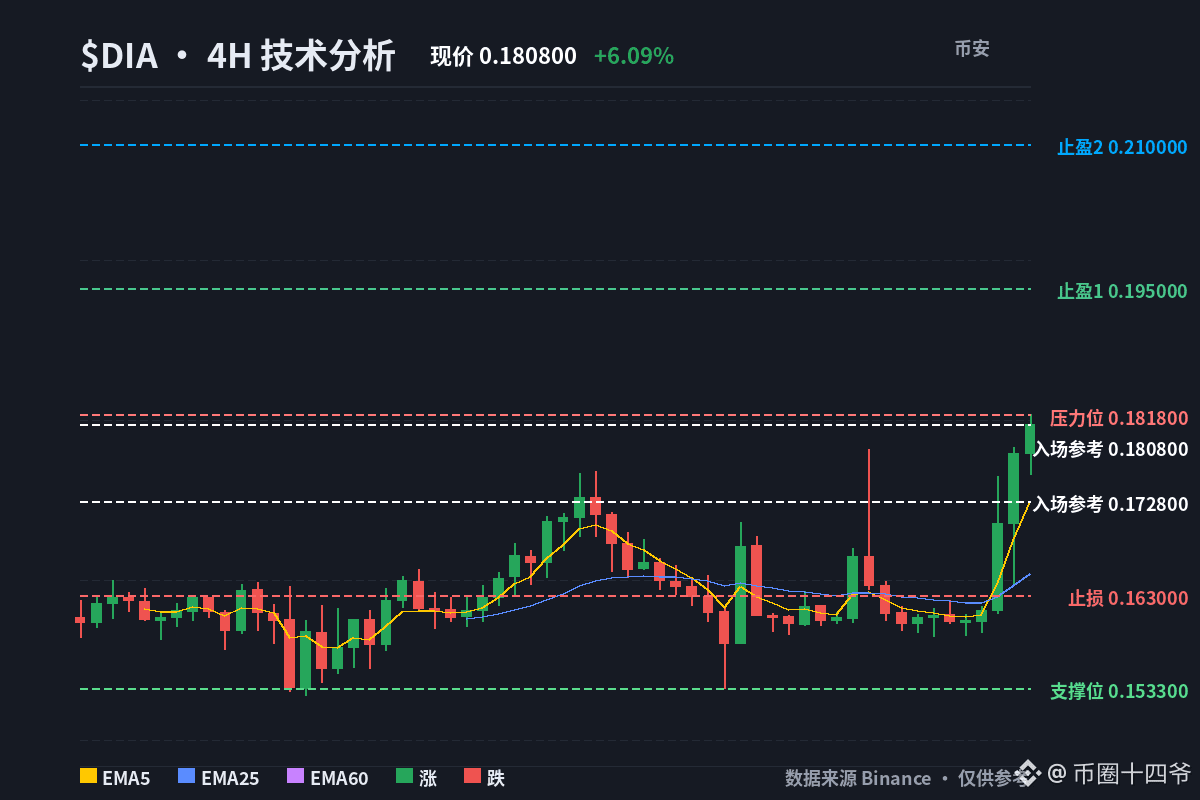
$DIA is up 6.09% over 24h and has surged to #13 on the gainers list, but I’m not chasing it. Not because it’s weak—the price is just too far above the 4h EMA5. Buying here would mean providing exit liquidity for the people who got in earlier.
Let’s be clear about the numbers first: the API shows 0.1446, which doesn’t match the K-line price of 0.18. I’m calculating the risk/reward based on 0.18, not chasing a rounded price. My bias is clear: wait for a pullback and go long. I’d only enter if it retests around 0.1728 (4h EMA5) and holds. If it breaks below 0.163, I’m out.
What’s really keeping my hands off is positioning. The account long/short ratio is 2.367, and the top-trader positioning ratio is 3.0177—both skewed long, with top traders even more crowded than retail. The funding rate is positive at +0.03%, so longs are paying for protection. Who will be first to let go? If price loses the EMA5, leveraged longs will be the quickest to run, especially since top traders are more heavily positioned than retail. When everyone is leaning the same way, there’s no real opposing side—and no short-squeeze fuel either. On a pullback, they can only trip over one another. OI is 4M against a 21M market cap, or about 19%, so leverage isn’t exactly light. If the trade goes the wrong way, sentiment can flip fast.
The trend is still intact: the 4h EMA5/25/60 are at 0.1727/0.1653/0.1632, with the bullish alignment still widening. The daily EMA5 at 0.1688 is also providing support below. But RSI7 is already 85.3, and daily RSI7 is 76.8. The last 3 candles moved 6.62% on the 4h and 10.4% on the daily. Volume is genuinely elevated too: about 900K U on the latest 4h candle and about 5.47M U on the daily. A high-volume breakout with overbought readings is a trend worth respecting—but the current price isn’t worth chasing.
BTC is down 0.09%, and the overall market is down 0.97%, while $DIA is moving independently. I’ll give it that. But when the tide goes out, an independent move has no broader market to support it, and pullbacks can be deeper than expected.
📊 Bias: Wait for a pullback, then go long
💰 Entry reference: 0.1728 (4h EMA5)—enter only after a retest holds
🛑 Stop loss: 0.163; if it breaks, get out—don’t stubbornly hold
🎯 Take profit 1: 0.195
🎯 Take profit 2: 0.21 (measured move target after breaking out of the 4h range of 0.15–0.18)
Funding is the protection fee; EMA5 is the trigger.
Would you go long on a retest of 0.1728, or agree that the bulls should fold if 0.163 breaks? Pick one.
$DIA #技术分析 #十三爷
$DIA is up 6.09% over 24h and has surged to #13 on the gainers list, but I’m not chasing it. Not because it’s weak—the price is just too far above the 4h EMA5. Buying here would mean providing exit liquidity for the people who got in earlier.
Let’s be clear about the numbers first: the API shows 0.1446, which doesn’t match the K-line price of 0.18. I’m calculating the risk/reward based on 0.18, not chasing a rounded price. My bias is clear: wait for a pullback and go long. I’d only enter if it retests around 0.1728 (4h EMA5) and holds. If it breaks below 0.163, I’m out.
What’s really keeping my hands off is positioning. The account long/short ratio is 2.367, and the top-trader positioning ratio is 3.0177—both skewed long, with top traders even more crowded than retail. The funding rate is positive at +0.03%, so longs are paying for protection. Who will be first to let go? If price loses the EMA5, leveraged longs will be the quickest to run, especially since top traders are more heavily positioned than retail. When everyone is leaning the same way, there’s no real opposing side—and no short-squeeze fuel either. On a pullback, they can only trip over one another. OI is 4M against a 21M market cap, or about 19%, so leverage isn’t exactly light. If the trade goes the wrong way, sentiment can flip fast.
The trend is still intact: the 4h EMA5/25/60 are at 0.1727/0.1653/0.1632, with the bullish alignment still widening. The daily EMA5 at 0.1688 is also providing support below. But RSI7 is already 85.3, and daily RSI7 is 76.8. The last 3 candles moved 6.62% on the 4h and 10.4% on the daily. Volume is genuinely elevated too: about 900K U on the latest 4h candle and about 5.47M U on the daily. A high-volume breakout with overbought readings is a trend worth respecting—but the current price isn’t worth chasing.
BTC is down 0.09%, and the overall market is down 0.97%, while $DIA is moving independently. I’ll give it that. But when the tide goes out, an independent move has no broader market to support it, and pullbacks can be deeper than expected.
📊 Bias: Wait for a pullback, then go long
💰 Entry reference: 0.1728 (4h EMA5)—enter only after a retest holds
🛑 Stop loss: 0.163; if it breaks, get out—don’t stubbornly hold
🎯 Take profit 1: 0.195
🎯 Take profit 2: 0.21 (measured move target after breaking out of the 4h range of 0.15–0.18)
Funding is the protection fee; EMA5 is the trigger.
Would you go long on a retest of 0.1728, or agree that the bulls should fold if 0.163 breaks? Pick one.
$DIA #技术分析 #十三爷
Let’s be clear about the numbers first: the API shows 0.1446, which doesn’t match the K-line price of 0.18. I’m calculating the risk/reward based on 0.18, not chasing a rounded price. My bias is clear: wait for a pullback and go long. I’d only enter if it retests around 0.1728 (4h EMA5) and holds. If it breaks below 0.163, I’m out.
What’s really keeping my hands off is positioning. The account long/short ratio is 2.367, and the top-trader positioning ratio is 3.0177—both skewed long, with top traders even more crowded than retail. The funding rate is positive at +0.03%, so longs are paying for protection. Who will be first to let go? If price loses the EMA5, leveraged longs will be the quickest to run, especially since top traders are more heavily positioned than retail. When everyone is leaning the same way, there’s no real opposing side—and no short-squeeze fuel either. On a pullback, they can only trip over one another. OI is 4M against a 21M market cap, or about 19%, so leverage isn’t exactly light. If the trade goes the wrong way, sentiment can flip fast.
The trend is still intact: the 4h EMA5/25/60 are at 0.1727/0.1653/0.1632, with the bullish alignment still widening. The daily EMA5 at 0.1688 is also providing support below. But RSI7 is already 85.3, and daily RSI7 is 76.8. The last 3 candles moved 6.62% on the 4h and 10.4% on the daily. Volume is genuinely elevated too: about 900K U on the latest 4h candle and about 5.47M U on the daily. A high-volume breakout with overbought readings is a trend worth respecting—but the current price isn’t worth chasing.
BTC is down 0.09%, and the overall market is down 0.97%, while $DIA is moving independently. I’ll give it that. But when the tide goes out, an independent move has no broader market to support it, and pullbacks can be deeper than expected.
📊 Bias: Wait for a pullback, then go long
💰 Entry reference: 0.1728 (4h EMA5)—enter only after a retest holds
🛑 Stop loss: 0.163; if it breaks, get out—don’t stubbornly hold
🎯 Take profit 1: 0.195
🎯 Take profit 2: 0.21 (measured move target after breaking out of the 4h range of 0.15–0.18)
Funding is the protection fee; EMA5 is the trigger.
Would you go long on a retest of 0.1728, or agree that the bulls should fold if 0.163 breaks? Pick one.
$DIA #技术分析 #十三爷
2
·
--
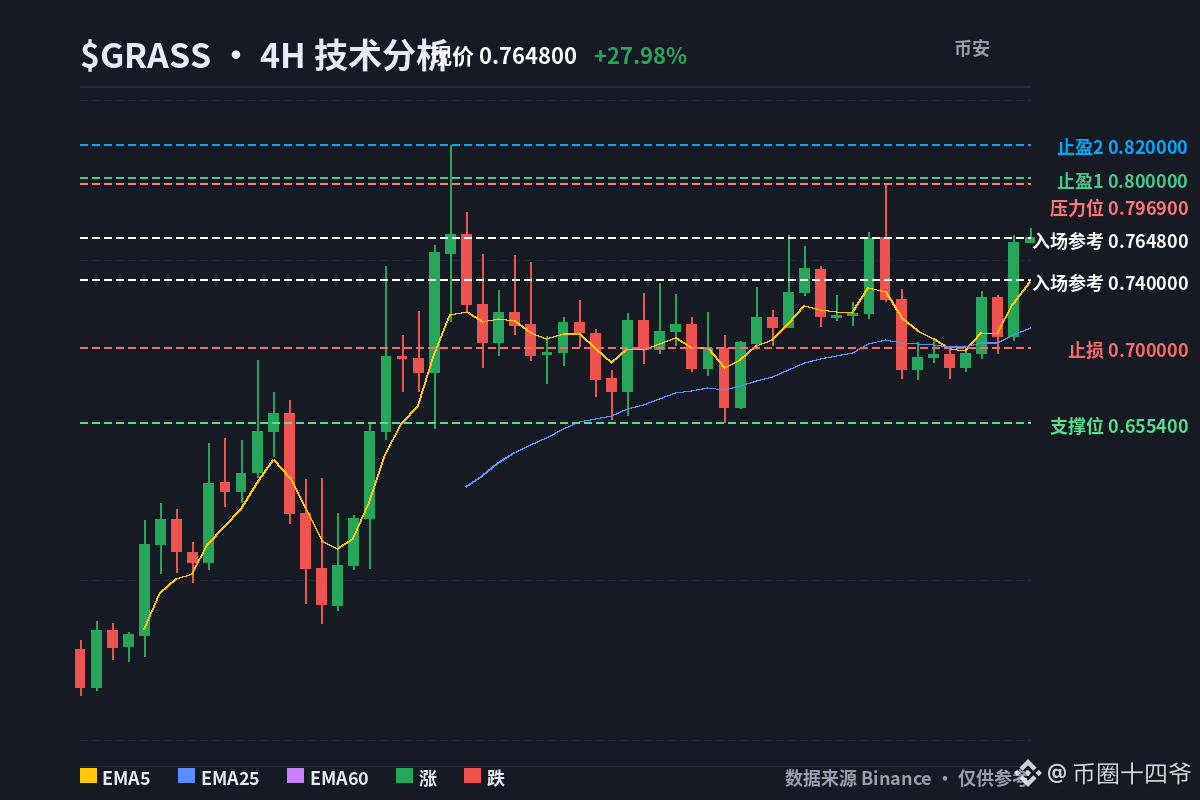
$GRASS 24h surged 27.98%, ranking 3rd on the gainers list, but I’m not chasing it. The current price is 0.7665. I’ll only wait for a pullback near 0.74 to go long; if it breaks below 0.70, I’ll admit defeat.
First, the positioning. The funding rate is +0.2381%—positive, meaning longs are paying to stay protected. The account long/short ratio is 1.4913, and the large-holder position ratio is 2.206. Both lean long, but large holders are steadier than retail traders. OI is 136M, market cap is 185M, and OI/market cap is about 73.5%—leverage is piled on heavily. Who’ll let go first? If the price pulls back, the retail longs who chased the rally will be the first to run; large holders may not be in a hurry to exit. Who’ll be left holding the bag? The people buying above 0.76 right now. I won’t be buying there.
The technical picture is still intact. On the 4h chart, EMA5=0.7388, EMA25=0.7118, and EMA60=0.6721—bullish alignment. On the daily chart, EMA5=0.7176 and EMA25=0.5212, so the trend is still up. But the daily RSI7 is 74.7, and the 4h RSI7 is 66.2, so the risk-reward for chasing the price has already deteriorated. Volatility over the last 3 candles is 4.71% on the 4h chart and 12.46% on the daily chart—not small, so stops need enough room.
BTC is +0.29% over 24h, while ALL is -1.28%. $GRASS is moving independently against the market, which deserves respect, but the broader market isn’t providing support. If the tide turns, there may not be enough buyers to catch it.
My plan: I won’t chase the current price; I’ll wait for a pullback.
📊 Direction: Long
💰 Entry reference: Buy in batches on a pullback near 0.74, where support holds
🛑 Stop-loss: Exit if it breaks below 0.70; admit defeat
🎯 Take profit 1: Trim near the previous high at 0.80
🎯 Take profit 2: Trim again near the top of the 0.82 range
When longs are crowded, a pullback is my entry ticket.
Would you go long on a pullback to 0.74, or admit defeat if it breaks below 0.70? Pick one.
$GRASS #技术分析 #ThirteenthLord
$GRASS 24h surged 27.98%, ranking 3rd on the gainers list, but I’m not chasing it. The current price is 0.7665. I’ll only wait for a pullback near 0.74 to go long; if it breaks below 0.70, I’ll admit defeat.
First, the positioning. The funding rate is +0.2381%—positive, meaning longs are paying to stay protected. The account long/short ratio is 1.4913, and the large-holder position ratio is 2.206. Both lean long, but large holders are steadier than retail traders. OI is 136M, market cap is 185M, and OI/market cap is about 73.5%—leverage is piled on heavily. Who’ll let go first? If the price pulls back, the retail longs who chased the rally will be the first to run; large holders may not be in a hurry to exit. Who’ll be left holding the bag? The people buying above 0.76 right now. I won’t be buying there.
The technical picture is still intact. On the 4h chart, EMA5=0.7388, EMA25=0.7118, and EMA60=0.6721—bullish alignment. On the daily chart, EMA5=0.7176 and EMA25=0.5212, so the trend is still up. But the daily RSI7 is 74.7, and the 4h RSI7 is 66.2, so the risk-reward for chasing the price has already deteriorated. Volatility over the last 3 candles is 4.71% on the 4h chart and 12.46% on the daily chart—not small, so stops need enough room.
BTC is +0.29% over 24h, while ALL is -1.28%. $GRASS is moving independently against the market, which deserves respect, but the broader market isn’t providing support. If the tide turns, there may not be enough buyers to catch it.
My plan: I won’t chase the current price; I’ll wait for a pullback.
📊 Direction: Long
💰 Entry reference: Buy in batches on a pullback near 0.74, where support holds
🛑 Stop-loss: Exit if it breaks below 0.70; admit defeat
🎯 Take profit 1: Trim near the previous high at 0.80
🎯 Take profit 2: Trim again near the top of the 0.82 range
When longs are crowded, a pullback is my entry ticket.
Would you go long on a pullback to 0.74, or admit defeat if it breaks below 0.70? Pick one.
$GRASS #技术分析 #ThirteenthLord
First, the positioning. The funding rate is +0.2381%—positive, meaning longs are paying to stay protected. The account long/short ratio is 1.4913, and the large-holder position ratio is 2.206. Both lean long, but large holders are steadier than retail traders. OI is 136M, market cap is 185M, and OI/market cap is about 73.5%—leverage is piled on heavily. Who’ll let go first? If the price pulls back, the retail longs who chased the rally will be the first to run; large holders may not be in a hurry to exit. Who’ll be left holding the bag? The people buying above 0.76 right now. I won’t be buying there.
The technical picture is still intact. On the 4h chart, EMA5=0.7388, EMA25=0.7118, and EMA60=0.6721—bullish alignment. On the daily chart, EMA5=0.7176 and EMA25=0.5212, so the trend is still up. But the daily RSI7 is 74.7, and the 4h RSI7 is 66.2, so the risk-reward for chasing the price has already deteriorated. Volatility over the last 3 candles is 4.71% on the 4h chart and 12.46% on the daily chart—not small, so stops need enough room.
BTC is +0.29% over 24h, while ALL is -1.28%. $GRASS is moving independently against the market, which deserves respect, but the broader market isn’t providing support. If the tide turns, there may not be enough buyers to catch it.
My plan: I won’t chase the current price; I’ll wait for a pullback.
📊 Direction: Long
💰 Entry reference: Buy in batches on a pullback near 0.74, where support holds
🛑 Stop-loss: Exit if it breaks below 0.70; admit defeat
🎯 Take profit 1: Trim near the previous high at 0.80
🎯 Take profit 2: Trim again near the top of the 0.82 range
When longs are crowded, a pullback is my entry ticket.
Would you go long on a pullback to 0.74, or admit defeat if it breaks below 0.70? Pick one.
$GRASS #技术分析 #ThirteenthLord
30
·
--
I saw $CARV start moving with five days to go before its unlock—and this time, the entire unlock is allocated to the team and investors.
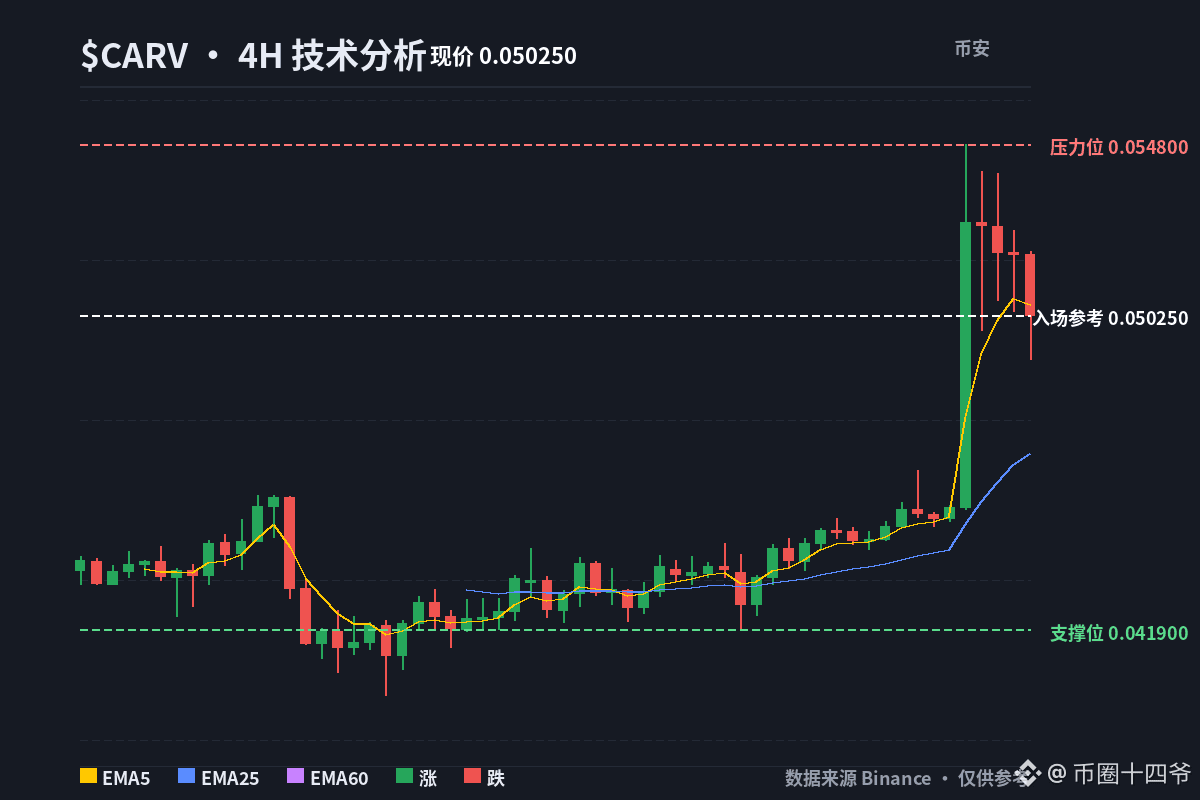
Over the past two weeks, $CARV had been grinding between 0.042 and 0.045, with daily trading volume hovering around $1 million.
Around noon UTC, it suddenly jumped 15%, hitting 0.053, while futures trading volume surged to $43 million.
At this price level and with that kind of volume, I really think it’s worth keeping an eye on.
I saw $CARV start moving with five days to go before its unlock—and this time, the entire unlock is allocated to the team and investors.
Over the past two weeks, $CARV had been grinding between 0.042 and 0.045, with daily trading volume hovering around $1 million.
Around noon UTC, it suddenly jumped 15%, hitting 0.053, while futures trading volume surged to $43 million.
At this price level and with that kind of volume, I really think it’s worth keeping an eye on.
Over the past two weeks, $CARV had been grinding between 0.042 and 0.045, with daily trading volume hovering around $1 million.
Around noon UTC, it suddenly jumped 15%, hitting 0.053, while futures trading volume surged to $43 million.
At this price level and with that kind of volume, I really think it’s worth keeping an eye on.
·
--
$EDU Large-trader position ratio: 3.27; retail account long/short ratio: 1.60. Both sides are leaning long, so I’m not chasing at the current price.
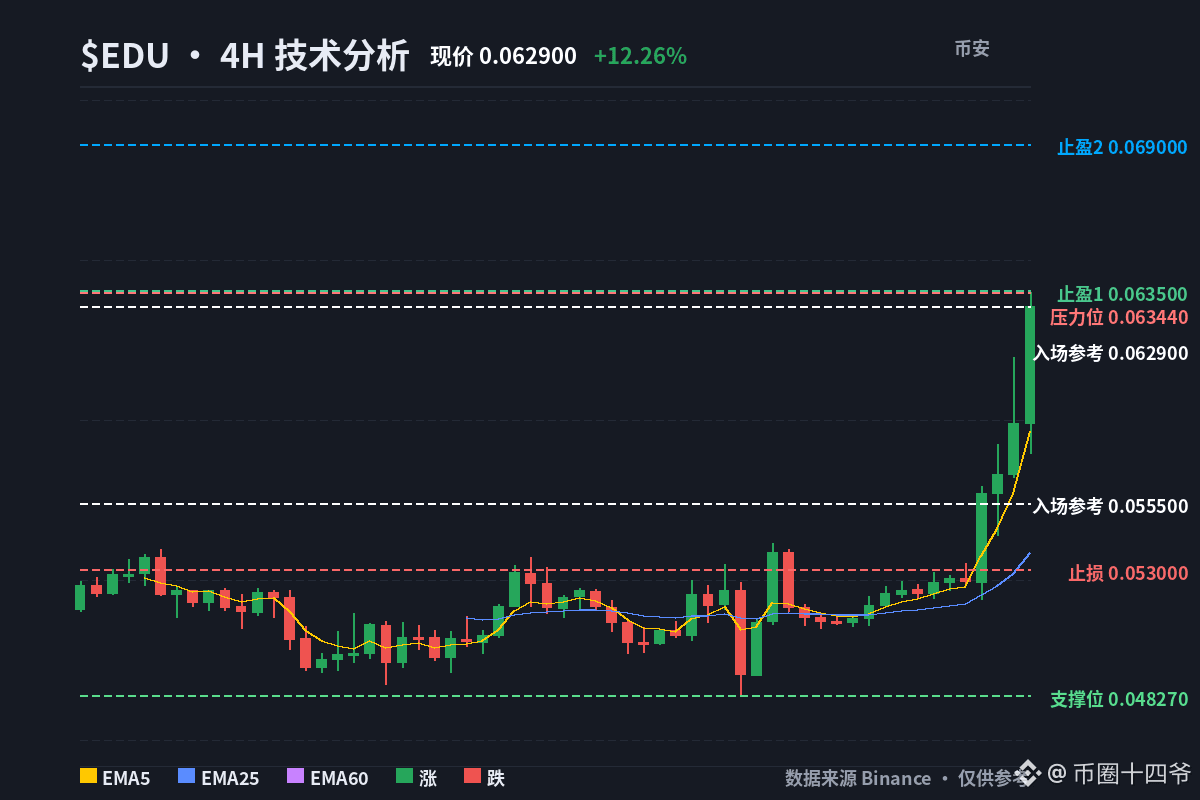
I’m bullish, but I’ll only buy a pullback around 0.0555. If it falls below 0.0530, I’ll admit I’m wrong and exit. I’m staying away at the current price.
First, a note on the figures: the order book shows 0.0585, while the 4h candlestick snapshot says 0.06. The two don’t match. I’m calculating the risk/reward using the live price, not chasing based on the rounded figure.
The most interesting thing about this chart isn’t the gain—it’s the long/short structure. The account long/short ratio is 1.60, meaning retail traders lean long; the large-trader position ratio is 3.27, roughly twice the retail level. They agree on direction, but differ by a factor of two in conviction. Positions are shifting toward the larger players. But with a positive funding rate of +0.06%, longs are paying a premium for protection, and retail traders’ loose positions have stop-losses closest to the current price. If there’s a shakeout, retail will be the first to let go. Chasing now would mean helping the people behind that 3.27 ratio cash out. Master Thirteen isn’t taking the last step of the relay.
The trend itself is still intact. The 4h EMA5/25/60 are 0.0582/0.0537/0.0519, in a full bullish alignment, and the daily EMA5 is still above 0.0554. But the 4h RSI7 is already 93.7, RSI14 is 82.4, and daily RSI7 is 84.6—the risk/reward for chasing longs has already thinned out. The trend deserves respect, but the current price doesn’t deserve a chase.
As for volume, the latest 4h candle came in at $4.72 million, and the daily volume is $16.76 million. Volatility over the last 3 candles is 7.81% (9.49% on the daily). Volume is genuinely up, and volatility has genuinely expanded, so give your stop-loss enough room.
What about the broader market? BTC is up 0.33% over 24h, while ALL is down 1.47%. $EDU is up 12.26% on its own, ranking 9th among gainers. This independent move deserves respect, but the broader market’s retreat isn’t providing support. So I’m setting a pullback entry, not paying a premium at the current price.
📊 Direction: Long (wait for a pullback)
💰 Entry reference: Around 0.0555 (near the daily EMA5 at 0.0554); enter only if buyers step in on the pullback
🛑 Stop-loss: 0.0530 (if it breaks below the 4h EMA25 at 0.0537, the thesis is invalid—admit you’re wrong and exit)
🎯 Take profit 1: 0.0635 (the first level above the current price, about +14%)
🎯 Take profit 2: 0.0690 (the next level, projected using daily volatility of 9.49%)
Funding is the fuel; key levels are the trigger.
Are you betting on buyers stepping in at 0.0555 on a pullback, or on the bulls admitting they’re wrong after a break below 0.0530? Pick one.
$EDU #技术分析 #Master Thirteen
$EDU Large-trader position ratio: 3.27; retail account long/short ratio: 1.60. Both sides are leaning long, so I’m not chasing at the current price.
I’m bullish, but I’ll only buy a pullback around 0.0555. If it falls below 0.0530, I’ll admit I’m wrong and exit. I’m staying away at the current price.
First, a note on the figures: the order book shows 0.0585, while the 4h candlestick snapshot says 0.06. The two don’t match. I’m calculating the risk/reward using the live price, not chasing based on the rounded figure.
The most interesting thing about this chart isn’t the gain—it’s the long/short structure. The account long/short ratio is 1.60, meaning retail traders lean long; the large-trader position ratio is 3.27, roughly twice the retail level. They agree on direction, but differ by a factor of two in conviction. Positions are shifting toward the larger players. But with a positive funding rate of +0.06%, longs are paying a premium for protection, and retail traders’ loose positions have stop-losses closest to the current price. If there’s a shakeout, retail will be the first to let go. Chasing now would mean helping the people behind that 3.27 ratio cash out. Master Thirteen isn’t taking the last step of the relay.
The trend itself is still intact. The 4h EMA5/25/60 are 0.0582/0.0537/0.0519, in a full bullish alignment, and the daily EMA5 is still above 0.0554. But the 4h RSI7 is already 93.7, RSI14 is 82.4, and daily RSI7 is 84.6—the risk/reward for chasing longs has already thinned out. The trend deserves respect, but the current price doesn’t deserve a chase.
As for volume, the latest 4h candle came in at $4.72 million, and the daily volume is $16.76 million. Volatility over the last 3 candles is 7.81% (9.49% on the daily). Volume is genuinely up, and volatility has genuinely expanded, so give your stop-loss enough room.
What about the broader market? BTC is up 0.33% over 24h, while ALL is down 1.47%. $EDU is up 12.26% on its own, ranking 9th among gainers. This independent move deserves respect, but the broader market’s retreat isn’t providing support. So I’m setting a pullback entry, not paying a premium at the current price.
📊 Direction: Long (wait for a pullback)
💰 Entry reference: Around 0.0555 (near the daily EMA5 at 0.0554); enter only if buyers step in on the pullback
🛑 Stop-loss: 0.0530 (if it breaks below the 4h EMA25 at 0.0537, the thesis is invalid—admit you’re wrong and exit)
🎯 Take profit 1: 0.0635 (the first level above the current price, about +14%)
🎯 Take profit 2: 0.0690 (the next level, projected using daily volatility of 9.49%)
Funding is the fuel; key levels are the trigger.
Are you betting on buyers stepping in at 0.0555 on a pullback, or on the bulls admitting they’re wrong after a break below 0.0530? Pick one.
$EDU #技术分析 #Master Thirteen
I’m bullish, but I’ll only buy a pullback around 0.0555. If it falls below 0.0530, I’ll admit I’m wrong and exit. I’m staying away at the current price.
First, a note on the figures: the order book shows 0.0585, while the 4h candlestick snapshot says 0.06. The two don’t match. I’m calculating the risk/reward using the live price, not chasing based on the rounded figure.
The most interesting thing about this chart isn’t the gain—it’s the long/short structure. The account long/short ratio is 1.60, meaning retail traders lean long; the large-trader position ratio is 3.27, roughly twice the retail level. They agree on direction, but differ by a factor of two in conviction. Positions are shifting toward the larger players. But with a positive funding rate of +0.06%, longs are paying a premium for protection, and retail traders’ loose positions have stop-losses closest to the current price. If there’s a shakeout, retail will be the first to let go. Chasing now would mean helping the people behind that 3.27 ratio cash out. Master Thirteen isn’t taking the last step of the relay.
The trend itself is still intact. The 4h EMA5/25/60 are 0.0582/0.0537/0.0519, in a full bullish alignment, and the daily EMA5 is still above 0.0554. But the 4h RSI7 is already 93.7, RSI14 is 82.4, and daily RSI7 is 84.6—the risk/reward for chasing longs has already thinned out. The trend deserves respect, but the current price doesn’t deserve a chase.
As for volume, the latest 4h candle came in at $4.72 million, and the daily volume is $16.76 million. Volatility over the last 3 candles is 7.81% (9.49% on the daily). Volume is genuinely up, and volatility has genuinely expanded, so give your stop-loss enough room.
What about the broader market? BTC is up 0.33% over 24h, while ALL is down 1.47%. $EDU is up 12.26% on its own, ranking 9th among gainers. This independent move deserves respect, but the broader market’s retreat isn’t providing support. So I’m setting a pullback entry, not paying a premium at the current price.
📊 Direction: Long (wait for a pullback)
💰 Entry reference: Around 0.0555 (near the daily EMA5 at 0.0554); enter only if buyers step in on the pullback
🛑 Stop-loss: 0.0530 (if it breaks below the 4h EMA25 at 0.0537, the thesis is invalid—admit you’re wrong and exit)
🎯 Take profit 1: 0.0635 (the first level above the current price, about +14%)
🎯 Take profit 2: 0.0690 (the next level, projected using daily volatility of 9.49%)
Funding is the fuel; key levels are the trigger.
Are you betting on buyers stepping in at 0.0555 on a pullback, or on the bulls admitting they’re wrong after a break below 0.0530? Pick one.
$EDU #技术分析 #Master Thirteen
10
·
--
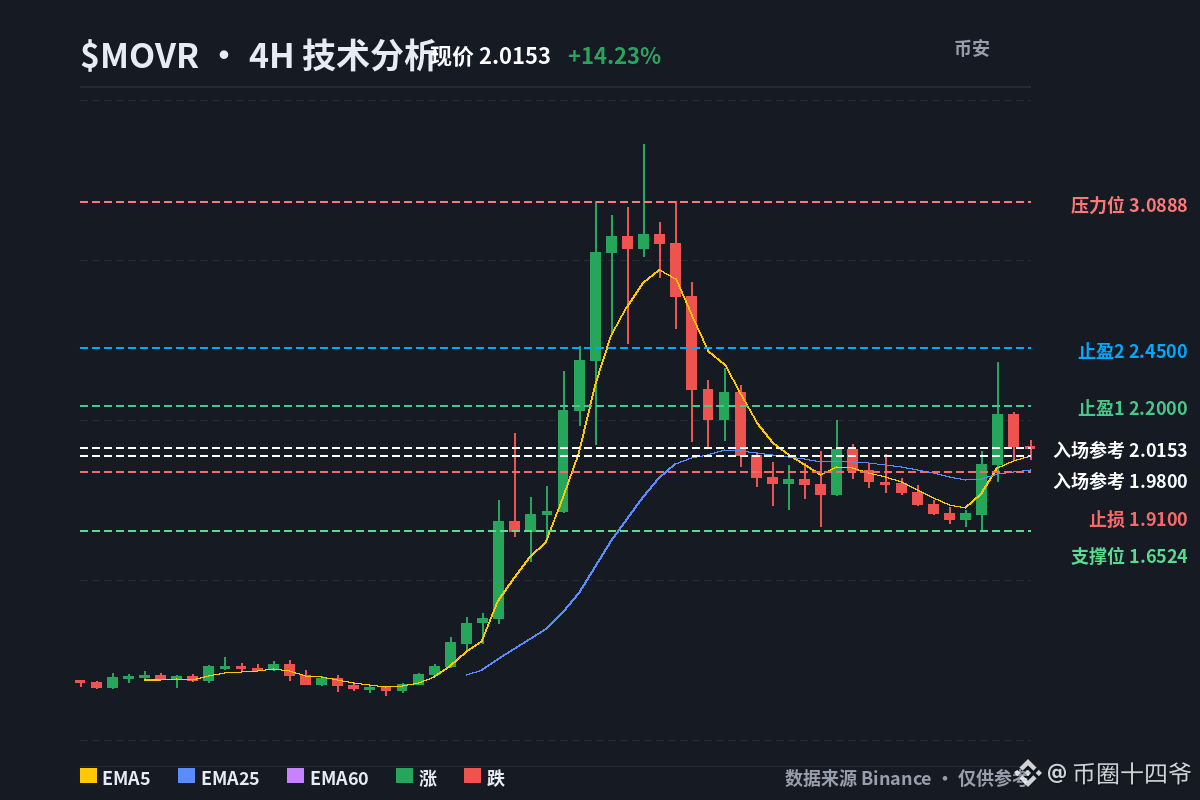
$MOVR is up 14.23%, climbing to No. 6 on the gainers list, but I’m not chasing it. First, look at the long/short ratios: 0.9037 for accounts and 1.2599 for top traders—they’re positioned in opposite directions.
I’m bullish on this coin, but I won’t buy at the current price of 2.02. I’ll wait for a pullback to around 1.98 before entering. If it breaks below 1.91, I’ll admit I’m wrong and get out.
First, the most important point: the 24-hour funding rate is -0.5695%. It’s negative, meaning shorts are paying longs a protection fee. Next, the account long/short ratio is 0.9037, so retail traders are bearish overall; the top traders’ position ratio is 1.2599, so they’re bullish. Retail is short, top traders are long, and shorts are paying to hold their positions—in this setup, it’s often the shorts, not the longs, who fold first. If the price pushes higher, the fuel for a short squeeze is already there.
But don’t rush to go all in. $MOVR has a market cap of only 25M, while OI is already 38M, putting OI at about 152% of market cap. Leverage is stacked very heavily. With a setup like this, if you’re on the right side, it moves fast; if you’re wrong, it turns on you even faster. So I’d rather wait for a pullback than be the last one buying above 2.02.
The trend is still intact. The 4h EMA5 is 1.978, EMA25 is 1.919, and EMA60 is 1.632—a textbook bullish alignment. On the daily chart, EMA5 at 1.899 is also above EMA25 at 1.295. RSI is 57.2/54.2 on the 4h and 60.3/61.9 on the daily, so neither timeframe is overbought. After pulling back from a high of 3.34 all the way to 2.02, it’s also down 6.7% over the last three candles. The overbought conditions have already been washed out, which leaves room to buy the pullback.
As for the broader market, BTC is only up 0.07%, while the overall market is down 1.51%. $MOVR is up more than 14% on its own—a market-defying, independent move. That deserves respect, but if the tide turns, it won’t have the broader market to support it, so don’t size your position too aggressively.
The candle snapshot is 2.02 and the order book shows 2.0194. I calculate risk/reward using the live price, not a rounded price to chase.
📊 Direction: Long
💰 Entry reference: Around 1.98; enter only if the 4h EMA5 holds as support on a pullback
🛑 Stop loss: 1.91; if it breaks below the 4h EMA25, the bullish thesis is invalidated—admit defeat and exit
🎯 Take profit 1: 2.2, the previous rebound base
🎯 Take profit 2: 2.45, halfway toward recovering the previous high of 3.34
Shorts are paying a protection fee, but the squeeze still needs to hold above 1.98 first.
Would you buy the pullback at 1.98, or do you think the squeeze fizzles if it breaks below 1.91? Pick one.
$MOVR #技术分析 #ThirteenthMaster
$MOVR is up 14.23%, climbing to No. 6 on the gainers list, but I’m not chasing it. First, look at the long/short ratios: 0.9037 for accounts and 1.2599 for top traders—they’re positioned in opposite directions.
I’m bullish on this coin, but I won’t buy at the current price of 2.02. I’ll wait for a pullback to around 1.98 before entering. If it breaks below 1.91, I’ll admit I’m wrong and get out.
First, the most important point: the 24-hour funding rate is -0.5695%. It’s negative, meaning shorts are paying longs a protection fee. Next, the account long/short ratio is 0.9037, so retail traders are bearish overall; the top traders’ position ratio is 1.2599, so they’re bullish. Retail is short, top traders are long, and shorts are paying to hold their positions—in this setup, it’s often the shorts, not the longs, who fold first. If the price pushes higher, the fuel for a short squeeze is already there.
But don’t rush to go all in. $MOVR has a market cap of only 25M, while OI is already 38M, putting OI at about 152% of market cap. Leverage is stacked very heavily. With a setup like this, if you’re on the right side, it moves fast; if you’re wrong, it turns on you even faster. So I’d rather wait for a pullback than be the last one buying above 2.02.
The trend is still intact. The 4h EMA5 is 1.978, EMA25 is 1.919, and EMA60 is 1.632—a textbook bullish alignment. On the daily chart, EMA5 at 1.899 is also above EMA25 at 1.295. RSI is 57.2/54.2 on the 4h and 60.3/61.9 on the daily, so neither timeframe is overbought. After pulling back from a high of 3.34 all the way to 2.02, it’s also down 6.7% over the last three candles. The overbought conditions have already been washed out, which leaves room to buy the pullback.
As for the broader market, BTC is only up 0.07%, while the overall market is down 1.51%. $MOVR is up more than 14% on its own—a market-defying, independent move. That deserves respect, but if the tide turns, it won’t have the broader market to support it, so don’t size your position too aggressively.
The candle snapshot is 2.02 and the order book shows 2.0194. I calculate risk/reward using the live price, not a rounded price to chase.
📊 Direction: Long
💰 Entry reference: Around 1.98; enter only if the 4h EMA5 holds as support on a pullback
🛑 Stop loss: 1.91; if it breaks below the 4h EMA25, the bullish thesis is invalidated—admit defeat and exit
🎯 Take profit 1: 2.2, the previous rebound base
🎯 Take profit 2: 2.45, halfway toward recovering the previous high of 3.34
Shorts are paying a protection fee, but the squeeze still needs to hold above 1.98 first.
Would you buy the pullback at 1.98, or do you think the squeeze fizzles if it breaks below 1.91? Pick one.
$MOVR #技术分析 #ThirteenthMaster
I’m bullish on this coin, but I won’t buy at the current price of 2.02. I’ll wait for a pullback to around 1.98 before entering. If it breaks below 1.91, I’ll admit I’m wrong and get out.
First, the most important point: the 24-hour funding rate is -0.5695%. It’s negative, meaning shorts are paying longs a protection fee. Next, the account long/short ratio is 0.9037, so retail traders are bearish overall; the top traders’ position ratio is 1.2599, so they’re bullish. Retail is short, top traders are long, and shorts are paying to hold their positions—in this setup, it’s often the shorts, not the longs, who fold first. If the price pushes higher, the fuel for a short squeeze is already there.
But don’t rush to go all in. $MOVR has a market cap of only 25M, while OI is already 38M, putting OI at about 152% of market cap. Leverage is stacked very heavily. With a setup like this, if you’re on the right side, it moves fast; if you’re wrong, it turns on you even faster. So I’d rather wait for a pullback than be the last one buying above 2.02.
The trend is still intact. The 4h EMA5 is 1.978, EMA25 is 1.919, and EMA60 is 1.632—a textbook bullish alignment. On the daily chart, EMA5 at 1.899 is also above EMA25 at 1.295. RSI is 57.2/54.2 on the 4h and 60.3/61.9 on the daily, so neither timeframe is overbought. After pulling back from a high of 3.34 all the way to 2.02, it’s also down 6.7% over the last three candles. The overbought conditions have already been washed out, which leaves room to buy the pullback.
As for the broader market, BTC is only up 0.07%, while the overall market is down 1.51%. $MOVR is up more than 14% on its own—a market-defying, independent move. That deserves respect, but if the tide turns, it won’t have the broader market to support it, so don’t size your position too aggressively.
The candle snapshot is 2.02 and the order book shows 2.0194. I calculate risk/reward using the live price, not a rounded price to chase.
📊 Direction: Long
💰 Entry reference: Around 1.98; enter only if the 4h EMA5 holds as support on a pullback
🛑 Stop loss: 1.91; if it breaks below the 4h EMA25, the bullish thesis is invalidated—admit defeat and exit
🎯 Take profit 1: 2.2, the previous rebound base
🎯 Take profit 2: 2.45, halfway toward recovering the previous high of 3.34
Shorts are paying a protection fee, but the squeeze still needs to hold above 1.98 first.
Would you buy the pullback at 1.98, or do you think the squeeze fizzles if it breaks below 1.91? Pick one.
$MOVR #技术分析 #ThirteenthMaster
17
·
--
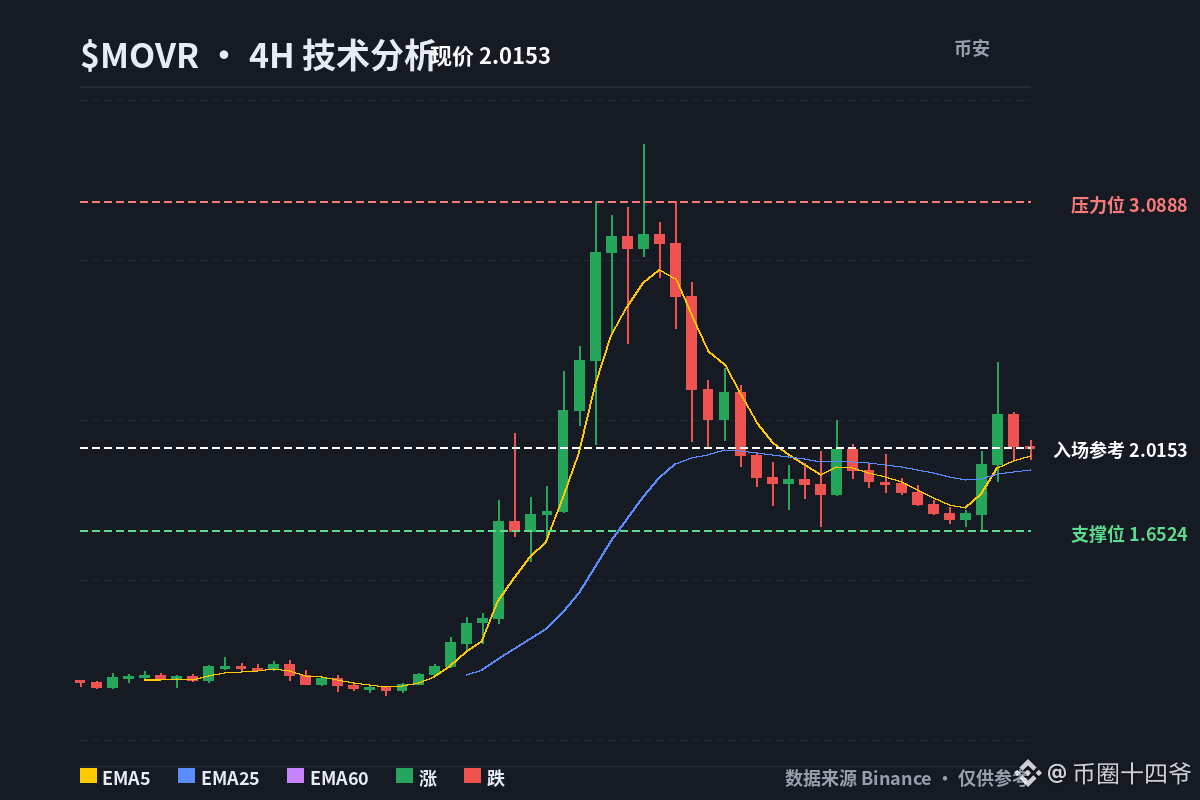
$MOVR is up 16.4% over 24 hours, with trading volume surging to 2.2x. This momentum is real—the question is whether this rally can hold.
I'm leaning bullish for now. As long as the 1-hour structure holds, the trend is confirmed bullish, and the daily chart and $BTC 's price action are both supporting further gains.
It has pushed up another 3.6% recently, so short-term sentiment is still strong. But to see whether the move can continue, keep a close eye on the structure and make sure it doesn't break down.
$MOVR is up 16.4% over 24 hours, with trading volume surging to 2.2x. This momentum is real—the question is whether this rally can hold.
I'm leaning bullish for now. As long as the 1-hour structure holds, the trend is confirmed bullish, and the daily chart and $BTC 's price action are both supporting further gains.
It has pushed up another 3.6% recently, so short-term sentiment is still strong. But to see whether the move can continue, keep a close eye on the structure and make sure it doesn't break down.
I'm leaning bullish for now. As long as the 1-hour structure holds, the trend is confirmed bullish, and the daily chart and $BTC 's price action are both supporting further gains.
It has pushed up another 3.6% recently, so short-term sentiment is still strong. But to see whether the move can continue, keep a close eye on the structure and make sure it doesn't break down.
114
·
--
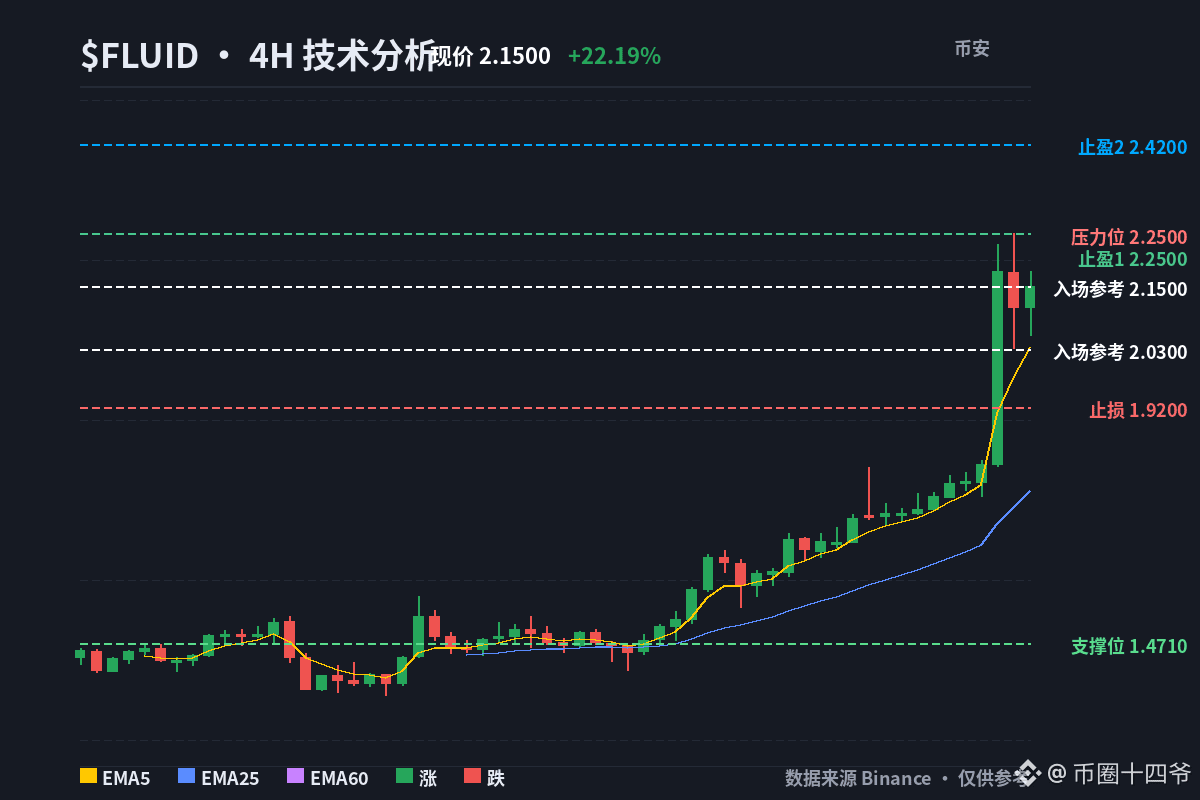
Chasing highs feels great—until the drop turns into a funeral. $FLUID was up 22.19% over 24h, ranking third in gains. At the current price of 2.11, I’m actually not chasing—I’ll wait for a pullback near 2.03 to go long, and if it breaks below 1.92, I’ll admit defeat and get out.
The order book shows 2.109, while the 4h candlestick snapshot shows 2.15. Those prices don’t match, so I’m calculating the risk/reward using the live price, not buying based on a rounded price.
The funding rate is the most interesting part: the 24h funding rate is -0.6585%, meaning shorts are paying longs a protection fee. The fuel for a short squeeze is clearly still there. But the account long/short ratio is 1.0683, and the top trader position ratio is 1.0541—retail and whales are crowded on the same side, both leaning long. Shorts are paying, but the longs aren’t exactly in the clear either. This isn’t a one-sided sure thing; it’s about who lets go first above 2.15. If it can’t get above that level, those who chased the rally today will probably be the first to run.
The trend is still intact. The 4h EMA5/25/60 are 2.033, 1.762, and 1.565—a textbook bullish alignment. The daily EMA5 at 1.81 is also well above the EMA25 at 1.45. The problem is the risk/reward: 4h RSI7 is 85.3, and daily RSI7 is 91.7. Chasing here is basically paying to carry someone else to the top.
Volume is holding up: the latest daily candle traded $62.77 million, and a single 4h candle traded $6.92 million. Volatility is 11.8%. OI of 16M against a market cap of 179M is about 8.9%, so leverage isn’t particularly high and a reversal shouldn’t be too brutal.
BTC is down 0.13%, and the overall market is down 1.81%. $FLUID is moving independently; its strength deserves respect, but there’s no support from the broader market, and no one will be there to catch it when the tide goes out.
My plan is clear: don’t chase the current price. I’ll pull the trigger if it finds support near 2.03, with 2.25 as the first target and 2.42 for the second leg. If you disagree, go ahead and say so—13th Lord loves being proven wrong by the data.
📊 Direction: Long (wait for a pullback)
💰 Entry reference: 2.03 (pullback holds near the 4h EMA5)
🛑 Stop-loss: 1.92 (if it breaks below, admit defeat and exit)
🎯 Take-profit 1: 2.25 (4h / daily previous high)
🎯 Take-profit 2: 2.42
Shorts paying a protection fee doesn’t mean I can chase with my eyes closed.
Would you go long on a pullback to 2.03, or say the bulls were wrong if it breaks below 1.92? Pick one.
$FLUID #技术分析 #13thLord
Chasing highs feels great—until the drop turns into a funeral. $FLUID was up 22.19% over 24h, ranking third in gains. At the current price of 2.11, I’m actually not chasing—I’ll wait for a pullback near 2.03 to go long, and if it breaks below 1.92, I’ll admit defeat and get out.
The order book shows 2.109, while the 4h candlestick snapshot shows 2.15. Those prices don’t match, so I’m calculating the risk/reward using the live price, not buying based on a rounded price.
The funding rate is the most interesting part: the 24h funding rate is -0.6585%, meaning shorts are paying longs a protection fee. The fuel for a short squeeze is clearly still there. But the account long/short ratio is 1.0683, and the top trader position ratio is 1.0541—retail and whales are crowded on the same side, both leaning long. Shorts are paying, but the longs aren’t exactly in the clear either. This isn’t a one-sided sure thing; it’s about who lets go first above 2.15. If it can’t get above that level, those who chased the rally today will probably be the first to run.
The trend is still intact. The 4h EMA5/25/60 are 2.033, 1.762, and 1.565—a textbook bullish alignment. The daily EMA5 at 1.81 is also well above the EMA25 at 1.45. The problem is the risk/reward: 4h RSI7 is 85.3, and daily RSI7 is 91.7. Chasing here is basically paying to carry someone else to the top.
Volume is holding up: the latest daily candle traded $62.77 million, and a single 4h candle traded $6.92 million. Volatility is 11.8%. OI of 16M against a market cap of 179M is about 8.9%, so leverage isn’t particularly high and a reversal shouldn’t be too brutal.
BTC is down 0.13%, and the overall market is down 1.81%. $FLUID is moving independently; its strength deserves respect, but there’s no support from the broader market, and no one will be there to catch it when the tide goes out.
My plan is clear: don’t chase the current price. I’ll pull the trigger if it finds support near 2.03, with 2.25 as the first target and 2.42 for the second leg. If you disagree, go ahead and say so—13th Lord loves being proven wrong by the data.
📊 Direction: Long (wait for a pullback)
💰 Entry reference: 2.03 (pullback holds near the 4h EMA5)
🛑 Stop-loss: 1.92 (if it breaks below, admit defeat and exit)
🎯 Take-profit 1: 2.25 (4h / daily previous high)
🎯 Take-profit 2: 2.42
Shorts paying a protection fee doesn’t mean I can chase with my eyes closed.
Would you go long on a pullback to 2.03, or say the bulls were wrong if it breaks below 1.92? Pick one.
$FLUID #技术分析 #13thLord
The order book shows 2.109, while the 4h candlestick snapshot shows 2.15. Those prices don’t match, so I’m calculating the risk/reward using the live price, not buying based on a rounded price.
The funding rate is the most interesting part: the 24h funding rate is -0.6585%, meaning shorts are paying longs a protection fee. The fuel for a short squeeze is clearly still there. But the account long/short ratio is 1.0683, and the top trader position ratio is 1.0541—retail and whales are crowded on the same side, both leaning long. Shorts are paying, but the longs aren’t exactly in the clear either. This isn’t a one-sided sure thing; it’s about who lets go first above 2.15. If it can’t get above that level, those who chased the rally today will probably be the first to run.
The trend is still intact. The 4h EMA5/25/60 are 2.033, 1.762, and 1.565—a textbook bullish alignment. The daily EMA5 at 1.81 is also well above the EMA25 at 1.45. The problem is the risk/reward: 4h RSI7 is 85.3, and daily RSI7 is 91.7. Chasing here is basically paying to carry someone else to the top.
Volume is holding up: the latest daily candle traded $62.77 million, and a single 4h candle traded $6.92 million. Volatility is 11.8%. OI of 16M against a market cap of 179M is about 8.9%, so leverage isn’t particularly high and a reversal shouldn’t be too brutal.
BTC is down 0.13%, and the overall market is down 1.81%. $FLUID is moving independently; its strength deserves respect, but there’s no support from the broader market, and no one will be there to catch it when the tide goes out.
My plan is clear: don’t chase the current price. I’ll pull the trigger if it finds support near 2.03, with 2.25 as the first target and 2.42 for the second leg. If you disagree, go ahead and say so—13th Lord loves being proven wrong by the data.
📊 Direction: Long (wait for a pullback)
💰 Entry reference: 2.03 (pullback holds near the 4h EMA5)
🛑 Stop-loss: 1.92 (if it breaks below, admit defeat and exit)
🎯 Take-profit 1: 2.25 (4h / daily previous high)
🎯 Take-profit 2: 2.42
Shorts paying a protection fee doesn’t mean I can chase with my eyes closed.
Would you go long on a pullback to 2.03, or say the bulls were wrong if it breaks below 1.92? Pick one.
$FLUID #技术分析 #13thLord
4
·
--
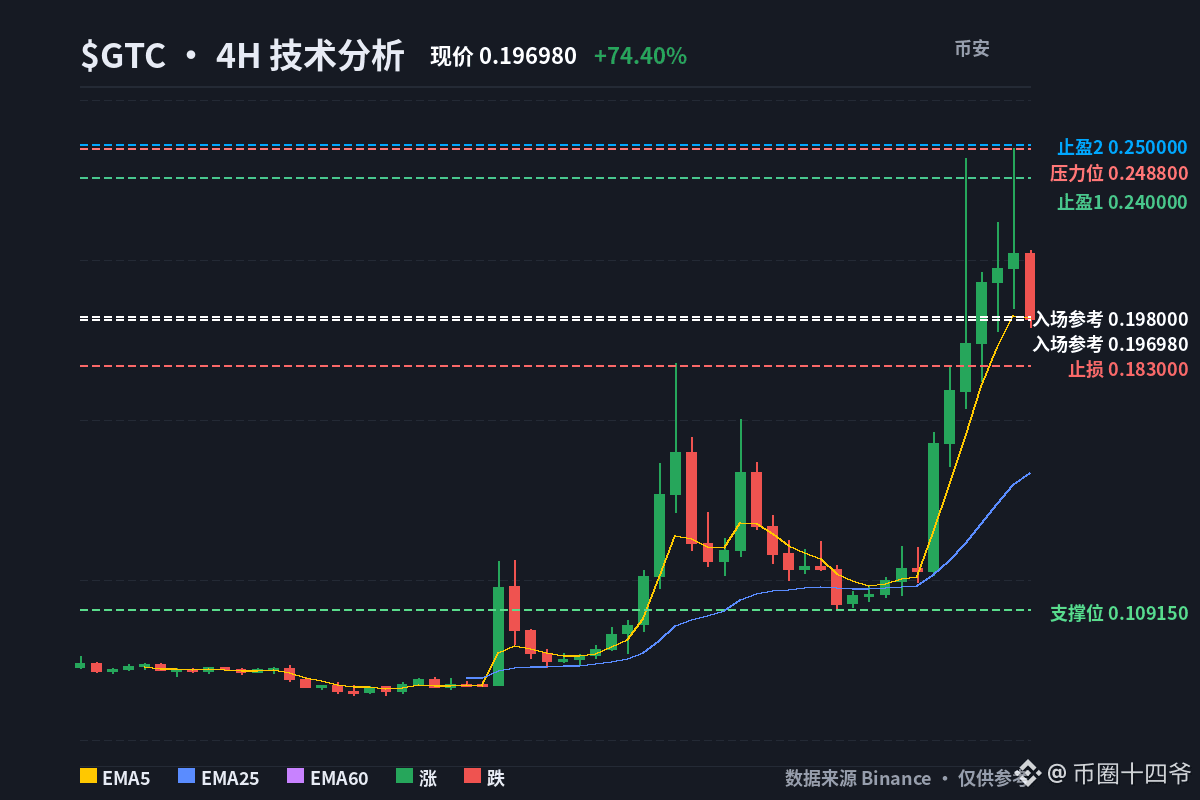
$GTC 24 hours +74.4%, ranked #1 among top gainers—and yet I wouldn’t chase it at the current price. It’s not that the coin is weak; it’s that anyone buying here is just carrying the bags for those who got in earlier.
First, let’s look at sentiment and positioning. The 24-hour cumulative funding rate is -1.39%: shorts are paying longs for protection, and negative funding is direct fuel for a short squeeze. The account long/short ratio is 0.9857, meaning retail traders are roughly even, with a slight short bias. The large-trader position ratio is 1.2658, so big players are clearly still leaning long. Retail is bearish, big players are bullish, and shorts are still paying—that split suggests that as long as the price doesn’t collapse, shorts are more likely to fold first, not longs.
But don’t rush in blindly. OI is 13M and market cap is 18M, putting the ratio at around 72%. Leverage is piled on, so if the trade goes the wrong way, sentiment can flip fast. Daily RSI7 is already 81.2, while 4-hour RSI7 is 68.1. The last 3 daily candles are up 73.57%, and volatility is 35.14%, so the risk/reward for chasing has deteriorated. The trend is still intact, but the current price isn’t worth chasing.
Technically, the 4-hour EMA5 is 0.1977, EMA25 is 0.15086, and EMA60 is 0.114, with the bullish EMAs widely spread. The daily EMA5 is 0.156 and EMA25 is 0.107, also in a bullish alignment. Price is hugging the EMA5, so a pullback near the EMA5 is where I’d wait to enter. 0.25 is the shared range high on both the 4-hour and daily charts—the first major resistance. The last 3 4-hour candles are down 7.21%, which means the spike is being digested; that’s not a bad thing. The order book shows 0.21228, while the candlestick snapshot shows 0.2. Since the figures differ, I’m calculating the risk/reward using the live price, not chasing based on a rounded figure.
$BTC 24h: -0.09%; the overall market (ALL): -1.80%. $GTC is moving completely independently of the broader market. An independent move deserves respect, but if it reverses, there’s no broader-market support—so position size and invalidation levels need to be set firmly.
Here’s my plan 👇
📈 Direction: Long; buy the pullback, don’t chase the current price
💰 Entry: Around 0.198; enter once the pullback to the 4-hour EMA5 stabilizes
🛑 Stop-loss: 0.183; if it breaks below, cut the loss and exit
🎯 Take-profit 1: 0.24
🎯 Take-profit 2: 0.25, the major resistance at the previous high
The protection fees paid by shorts often end up becoming fuel for longs—but only if you don’t buy at the very top.
Feel free to disagree. Lord Thirteen loves being proven wrong by the data.
$GTC #技术分析 #LordThirteen
$GTC 24 hours +74.4%, ranked #1 among top gainers—and yet I wouldn’t chase it at the current price. It’s not that the coin is weak; it’s that anyone buying here is just carrying the bags for those who got in earlier.
First, let’s look at sentiment and positioning. The 24-hour cumulative funding rate is -1.39%: shorts are paying longs for protection, and negative funding is direct fuel for a short squeeze. The account long/short ratio is 0.9857, meaning retail traders are roughly even, with a slight short bias. The large-trader position ratio is 1.2658, so big players are clearly still leaning long. Retail is bearish, big players are bullish, and shorts are still paying—that split suggests that as long as the price doesn’t collapse, shorts are more likely to fold first, not longs.
But don’t rush in blindly. OI is 13M and market cap is 18M, putting the ratio at around 72%. Leverage is piled on, so if the trade goes the wrong way, sentiment can flip fast. Daily RSI7 is already 81.2, while 4-hour RSI7 is 68.1. The last 3 daily candles are up 73.57%, and volatility is 35.14%, so the risk/reward for chasing has deteriorated. The trend is still intact, but the current price isn’t worth chasing.
Technically, the 4-hour EMA5 is 0.1977, EMA25 is 0.15086, and EMA60 is 0.114, with the bullish EMAs widely spread. The daily EMA5 is 0.156 and EMA25 is 0.107, also in a bullish alignment. Price is hugging the EMA5, so a pullback near the EMA5 is where I’d wait to enter. 0.25 is the shared range high on both the 4-hour and daily charts—the first major resistance. The last 3 4-hour candles are down 7.21%, which means the spike is being digested; that’s not a bad thing. The order book shows 0.21228, while the candlestick snapshot shows 0.2. Since the figures differ, I’m calculating the risk/reward using the live price, not chasing based on a rounded figure.
$BTC 24h: -0.09%; the overall market (ALL): -1.80%. $GTC is moving completely independently of the broader market. An independent move deserves respect, but if it reverses, there’s no broader-market support—so position size and invalidation levels need to be set firmly.
Here’s my plan 👇
📈 Direction: Long; buy the pullback, don’t chase the current price
💰 Entry: Around 0.198; enter once the pullback to the 4-hour EMA5 stabilizes
🛑 Stop-loss: 0.183; if it breaks below, cut the loss and exit
🎯 Take-profit 1: 0.24
🎯 Take-profit 2: 0.25, the major resistance at the previous high
The protection fees paid by shorts often end up becoming fuel for longs—but only if you don’t buy at the very top.
Feel free to disagree. Lord Thirteen loves being proven wrong by the data.
$GTC #技术分析 #LordThirteen
First, let’s look at sentiment and positioning. The 24-hour cumulative funding rate is -1.39%: shorts are paying longs for protection, and negative funding is direct fuel for a short squeeze. The account long/short ratio is 0.9857, meaning retail traders are roughly even, with a slight short bias. The large-trader position ratio is 1.2658, so big players are clearly still leaning long. Retail is bearish, big players are bullish, and shorts are still paying—that split suggests that as long as the price doesn’t collapse, shorts are more likely to fold first, not longs.
But don’t rush in blindly. OI is 13M and market cap is 18M, putting the ratio at around 72%. Leverage is piled on, so if the trade goes the wrong way, sentiment can flip fast. Daily RSI7 is already 81.2, while 4-hour RSI7 is 68.1. The last 3 daily candles are up 73.57%, and volatility is 35.14%, so the risk/reward for chasing has deteriorated. The trend is still intact, but the current price isn’t worth chasing.
Technically, the 4-hour EMA5 is 0.1977, EMA25 is 0.15086, and EMA60 is 0.114, with the bullish EMAs widely spread. The daily EMA5 is 0.156 and EMA25 is 0.107, also in a bullish alignment. Price is hugging the EMA5, so a pullback near the EMA5 is where I’d wait to enter. 0.25 is the shared range high on both the 4-hour and daily charts—the first major resistance. The last 3 4-hour candles are down 7.21%, which means the spike is being digested; that’s not a bad thing. The order book shows 0.21228, while the candlestick snapshot shows 0.2. Since the figures differ, I’m calculating the risk/reward using the live price, not chasing based on a rounded figure.
$BTC 24h: -0.09%; the overall market (ALL): -1.80%. $GTC is moving completely independently of the broader market. An independent move deserves respect, but if it reverses, there’s no broader-market support—so position size and invalidation levels need to be set firmly.
Here’s my plan 👇
📈 Direction: Long; buy the pullback, don’t chase the current price
💰 Entry: Around 0.198; enter once the pullback to the 4-hour EMA5 stabilizes
🛑 Stop-loss: 0.183; if it breaks below, cut the loss and exit
🎯 Take-profit 1: 0.24
🎯 Take-profit 2: 0.25, the major resistance at the previous high
The protection fees paid by shorts often end up becoming fuel for longs—but only if you don’t buy at the very top.
Feel free to disagree. Lord Thirteen loves being proven wrong by the data.
$GTC #技术分析 #LordThirteen
146
·
--
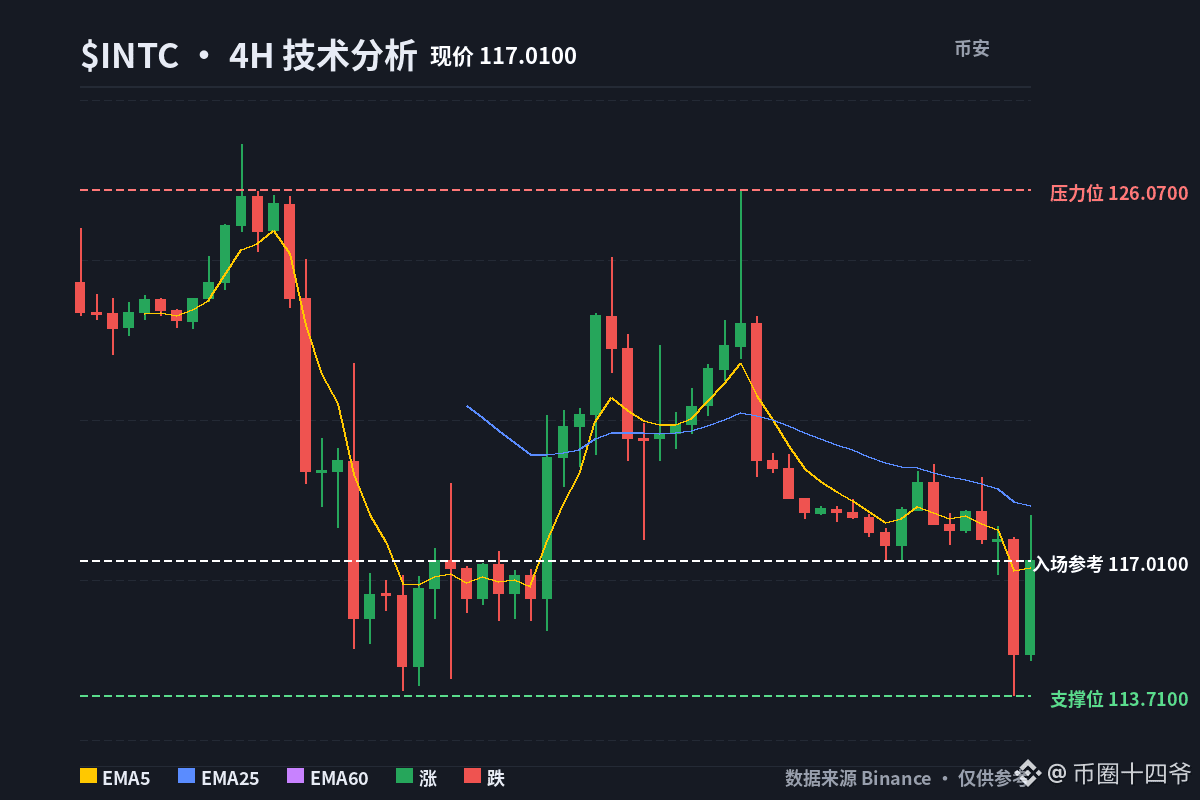
$TSLA I’ve pretty much figured this out now. Elon and Tesla have been aiming for ultra-large-scale mass production from the very beginning, and their capacity planning is much bigger than everyone thought.
For $INTC , this is not bearish at all; on the contrary, it’s a win-win situation.
$TSLA I’ve pretty much figured this out now. Elon and Tesla have been aiming for ultra-large-scale mass production from the very beginning, and their capacity planning is much bigger than everyone thought.
For $INTC , this is not bearish at all; on the contrary, it’s a win-win situation.
For $INTC , this is not bearish at all; on the contrary, it’s a win-win situation.
5
·
--
See translation
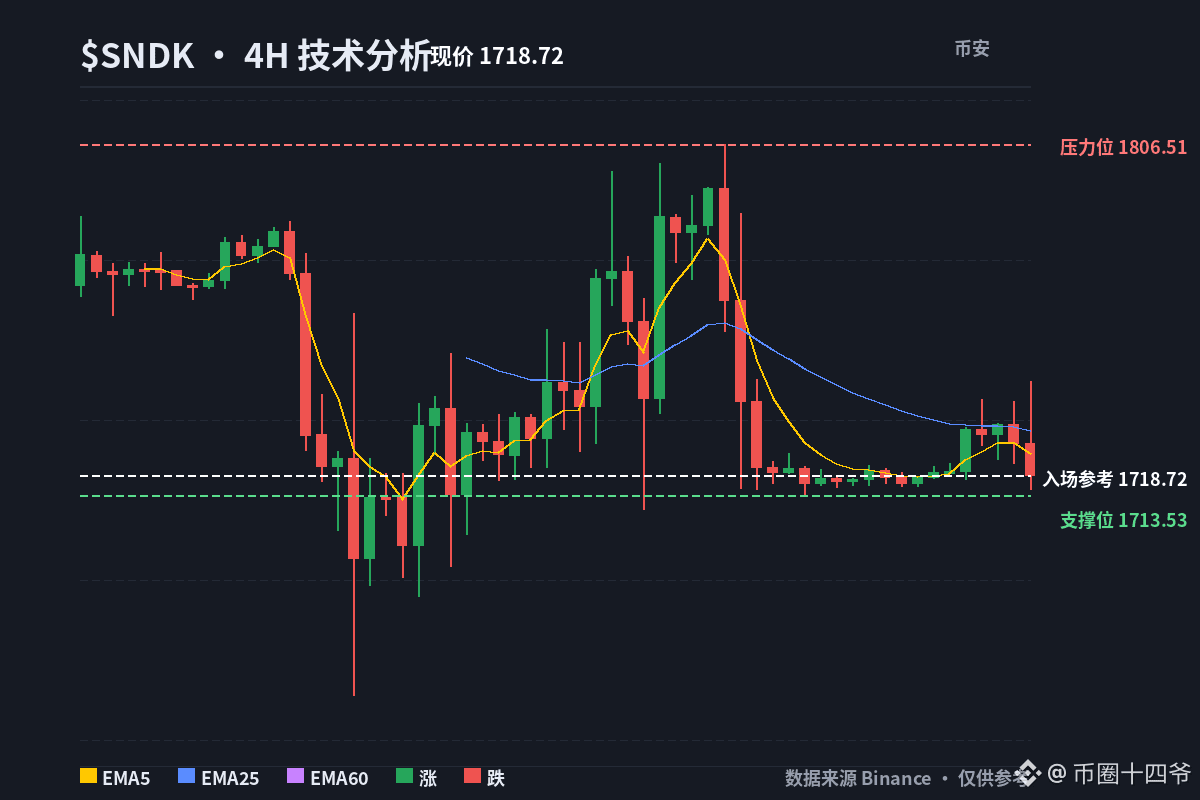
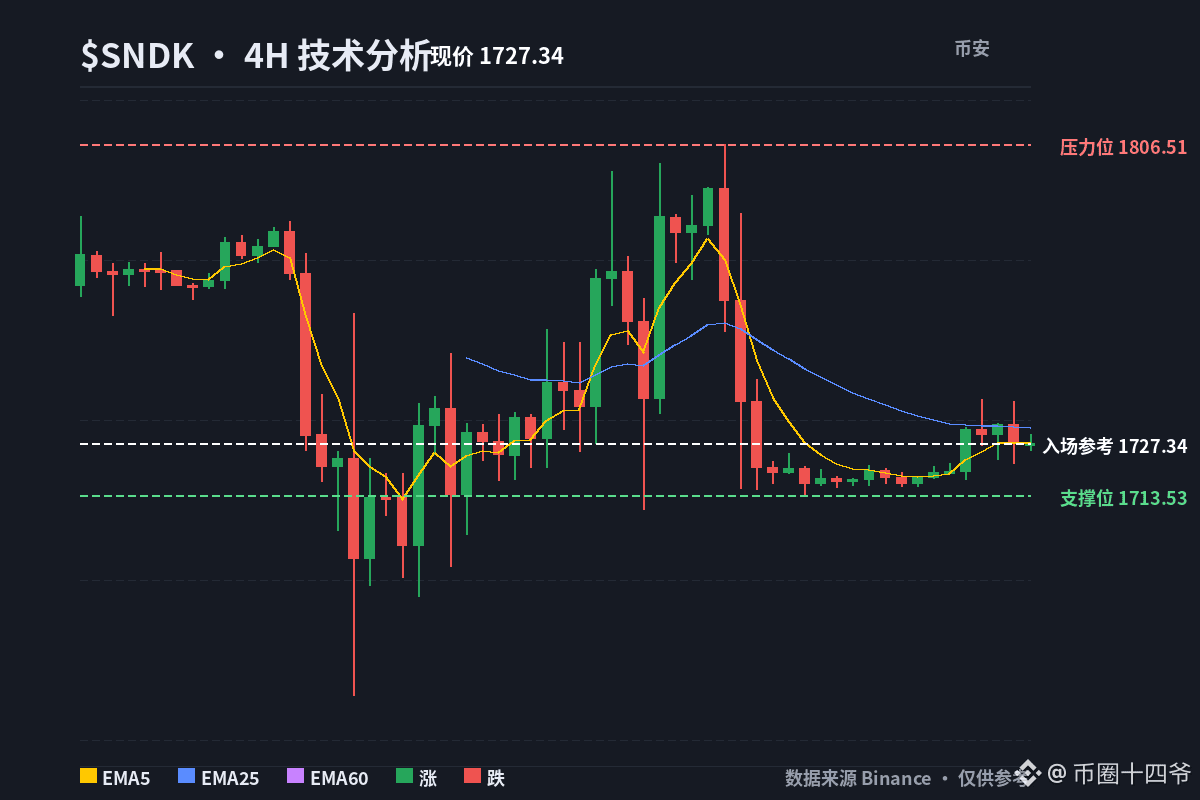
$SNDK 闪迪盘前聊两句
现在4小时级别是在走归零轴反弹,但上涨力度明显衰竭了,两小时大周期动能也在衰减。
30分钟MACD已经下穿零轴,日内方向偏空。
盘前现价1723,比周五休盘就微涨0.23%,这点涨幅挡不住往下走。
回调目标:第一看1679,第二看1617。
开盘后重点盯4小时级别怎么走。
$SNDK 闪迪盘前聊两句
现在4小时级别是在走归零轴反弹,但上涨力度明显衰竭了,两小时大周期动能也在衰减。
30分钟MACD已经下穿零轴,日内方向偏空。
盘前现价1723,比周五休盘就微涨0.23%,这点涨幅挡不住往下走。
回调目标:第一看1679,第二看1617。
开盘后重点盯4小时级别怎么走。
现在4小时级别是在走归零轴反弹,但上涨力度明显衰竭了,两小时大周期动能也在衰减。
30分钟MACD已经下穿零轴,日内方向偏空。
盘前现价1723,比周五休盘就微涨0.23%,这点涨幅挡不住往下走。
回调目标:第一看1679,第二看1617。
开盘后重点盯4小时级别怎么走。
5
·
--
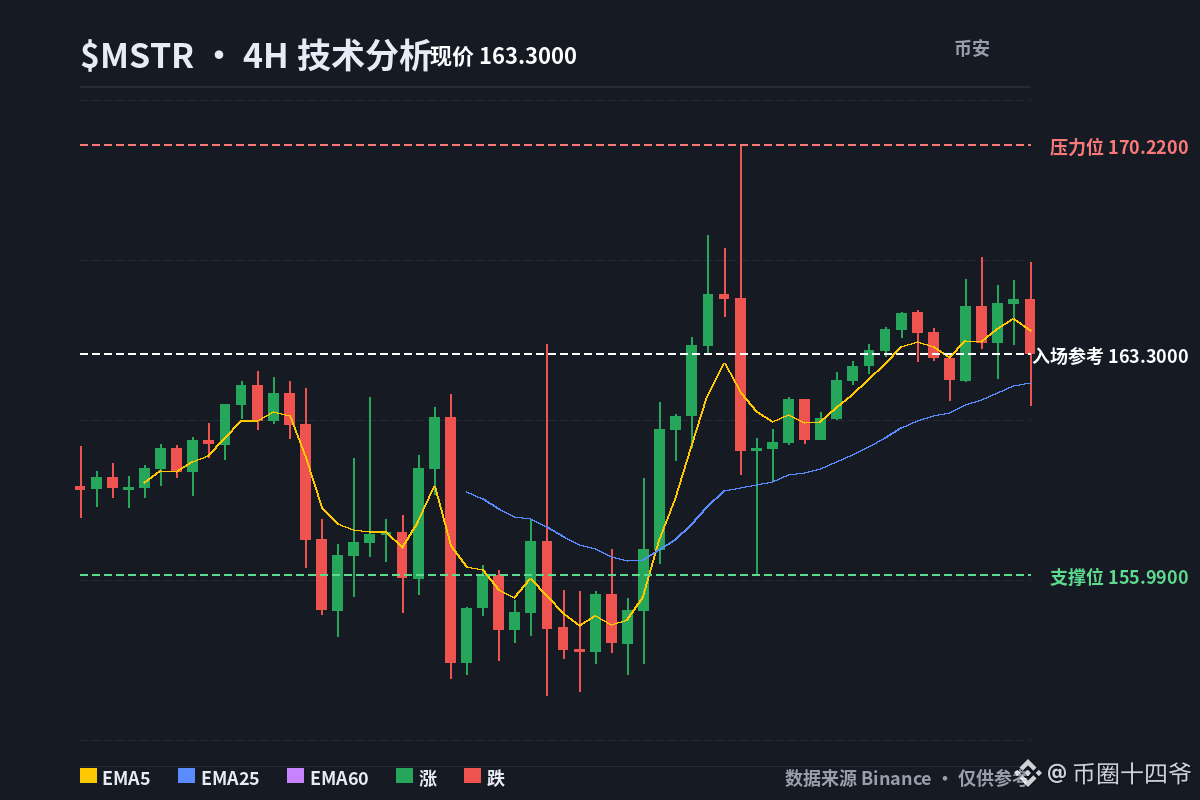
Have you ever set price targets for $BTC, $MSTR , or $ASST, where once they hit, you’d say, “I’m going to take profits and move them into a few other assets”?
For me, the profits would have to be pretty substantial before I’d seriously consider doing that.
What about you?
Have you ever set price targets for $BTC , $MSTR , or $ASST, where once they hit, you’d say, “I’m going to take profits and move them into a few other assets”?
For me, the profits would have to be pretty substantial before I’d seriously consider doing that.
What about you?
For me, the profits would have to be pretty substantial before I’d seriously consider doing that.
What about you?
1
74
·
--
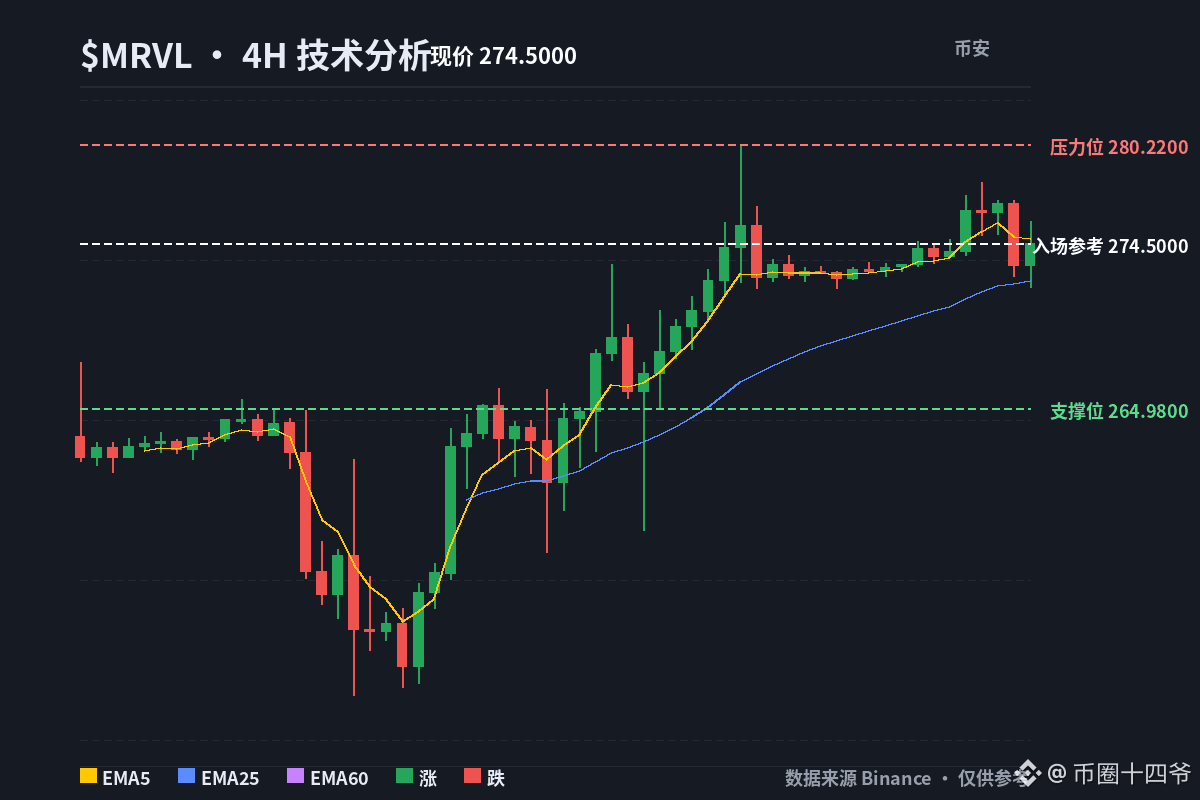
$MRVL is one I’ve been watching closely, and the reason is simple: its potential may extend beyond custom AI chips.
Ahead of Investor Day, Piper Sandler laid out a FY2031 framework estimate of roughly $45 billion in revenue and around $19 in earnings per share;
HSBC is also reportedly raising its estimates.
With this kind of upside potential, it’s worth getting both your position and mindset ready in advance.
$MRVL is one I’ve been watching closely, and the reason is simple: its potential may extend beyond custom AI chips.
Ahead of Investor Day, Piper Sandler laid out a FY2031 framework estimate of roughly $45 billion in revenue and around $19 in earnings per share;
HSBC is also reportedly raising its estimates.
With this kind of upside potential, it’s worth getting both your position and mindset ready in advance.
Ahead of Investor Day, Piper Sandler laid out a FY2031 framework estimate of roughly $45 billion in revenue and around $19 in earnings per share;
HSBC is also reportedly raising its estimates.
With this kind of upside potential, it’s worth getting both your position and mindset ready in advance.
6
·
--
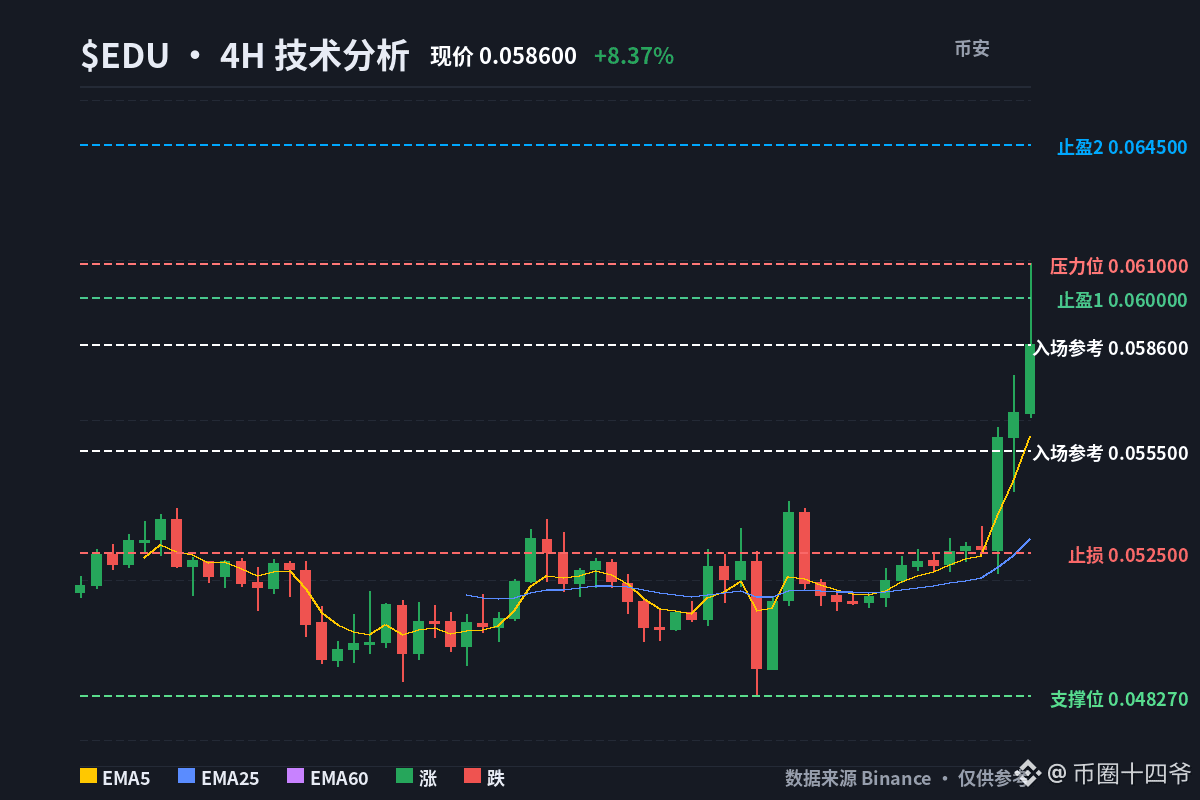
$EDU 24h rose +8.37%, ranking 9th among the biggest gainers, while $BTC rose just 1.67% and the overall market ALL fell 1.13%—this is an independent move, not a trailing act of following the crowd. But I wouldn’t chase at the current price. I’ll wait to go long on a pullback near 0.0555; if it drops below 0.0525, I’ll admit defeat.
The K-line snapshot shows 0.06 because it’s rounded; I’m calculating the risk/reward using the real-time price of 0.0566. The real problem is positioning: the account long/short ratio is 1.6008, and the large-trader position ratio is 3.2723. Both retail traders and large traders are positioned long, with the large traders even more aggressive. The funding rate is positive at +0.06%, meaning longs are paying shorts a protection fee. In this setup, who will be the first to let go? Not the shorts, but the longs who chased the rally—if the funding rate turns negative or the 4h EMA5 breaks, the first wave will run for the exits. OI is 9M against a market cap of 49M, or around 18%; leverage isn’t through the roof, but if the move goes the wrong way, sentiment can turn fast.
The trend itself is still intact: the 4h EMA5/25/60 are 0.0559 / 0.0529 / 0.0517, in a clear bullish alignment, and the daily EMA5 is also above the EMA25. The problem is RSI: the 4h RSI7 is already at 89.2, the daily RSI is 79.2, and volatility over the last 3 candles is 7.14%. Chasing here would just mean lifting the price for someone else. The trend deserves respect, but the current price isn’t worth chasing; a pullback and successful support test are my trigger.
📊 Direction: Long (wait for a pullback; don’t chase the current price)
💰 Entry reference: Around 0.0555; enter only after it stabilizes above the 4h EMA5
🛑 Stop loss: 0.0525; if it breaks below, admit defeat and exit immediately
🎯 Take profit 1: 0.0600, resistance at the previous high and K-line high
🎯 Take profit 2: 0.0645, measured extension after holding above 0.06
Funding is the fuel; the pullback is the trigger.
Would you go long on a pullback to 0.0555, or say the bulls are wrong if it breaks below 0.0525? Pick one.
$EDU #技术分析 #Thirteenth Lord
$EDU 24h rose +8.37%, ranking 9th among the biggest gainers, while $BTC rose just 1.67% and the overall market ALL fell 1.13%—this is an independent move, not a trailing act of following the crowd. But I wouldn’t chase at the current price. I’ll wait to go long on a pullback near 0.0555; if it drops below 0.0525, I’ll admit defeat.
The K-line snapshot shows 0.06 because it’s rounded; I’m calculating the risk/reward using the real-time price of 0.0566. The real problem is positioning: the account long/short ratio is 1.6008, and the large-trader position ratio is 3.2723. Both retail traders and large traders are positioned long, with the large traders even more aggressive. The funding rate is positive at +0.06%, meaning longs are paying shorts a protection fee. In this setup, who will be the first to let go? Not the shorts, but the longs who chased the rally—if the funding rate turns negative or the 4h EMA5 breaks, the first wave will run for the exits. OI is 9M against a market cap of 49M, or around 18%; leverage isn’t through the roof, but if the move goes the wrong way, sentiment can turn fast.
The trend itself is still intact: the 4h EMA5/25/60 are 0.0559 / 0.0529 / 0.0517, in a clear bullish alignment, and the daily EMA5 is also above the EMA25. The problem is RSI: the 4h RSI7 is already at 89.2, the daily RSI is 79.2, and volatility over the last 3 candles is 7.14%. Chasing here would just mean lifting the price for someone else. The trend deserves respect, but the current price isn’t worth chasing; a pullback and successful support test are my trigger.
📊 Direction: Long (wait for a pullback; don’t chase the current price)
💰 Entry reference: Around 0.0555; enter only after it stabilizes above the 4h EMA5
🛑 Stop loss: 0.0525; if it breaks below, admit defeat and exit immediately
🎯 Take profit 1: 0.0600, resistance at the previous high and K-line high
🎯 Take profit 2: 0.0645, measured extension after holding above 0.06
Funding is the fuel; the pullback is the trigger.
Would you go long on a pullback to 0.0555, or say the bulls are wrong if it breaks below 0.0525? Pick one.
$EDU #技术分析 #Thirteenth Lord
The K-line snapshot shows 0.06 because it’s rounded; I’m calculating the risk/reward using the real-time price of 0.0566. The real problem is positioning: the account long/short ratio is 1.6008, and the large-trader position ratio is 3.2723. Both retail traders and large traders are positioned long, with the large traders even more aggressive. The funding rate is positive at +0.06%, meaning longs are paying shorts a protection fee. In this setup, who will be the first to let go? Not the shorts, but the longs who chased the rally—if the funding rate turns negative or the 4h EMA5 breaks, the first wave will run for the exits. OI is 9M against a market cap of 49M, or around 18%; leverage isn’t through the roof, but if the move goes the wrong way, sentiment can turn fast.
The trend itself is still intact: the 4h EMA5/25/60 are 0.0559 / 0.0529 / 0.0517, in a clear bullish alignment, and the daily EMA5 is also above the EMA25. The problem is RSI: the 4h RSI7 is already at 89.2, the daily RSI is 79.2, and volatility over the last 3 candles is 7.14%. Chasing here would just mean lifting the price for someone else. The trend deserves respect, but the current price isn’t worth chasing; a pullback and successful support test are my trigger.
📊 Direction: Long (wait for a pullback; don’t chase the current price)
💰 Entry reference: Around 0.0555; enter only after it stabilizes above the 4h EMA5
🛑 Stop loss: 0.0525; if it breaks below, admit defeat and exit immediately
🎯 Take profit 1: 0.0600, resistance at the previous high and K-line high
🎯 Take profit 2: 0.0645, measured extension after holding above 0.06
Funding is the fuel; the pullback is the trigger.
Would you go long on a pullback to 0.0555, or say the bulls are wrong if it breaks below 0.0525? Pick one.
$EDU #技术分析 #Thirteenth Lord
105
·
--
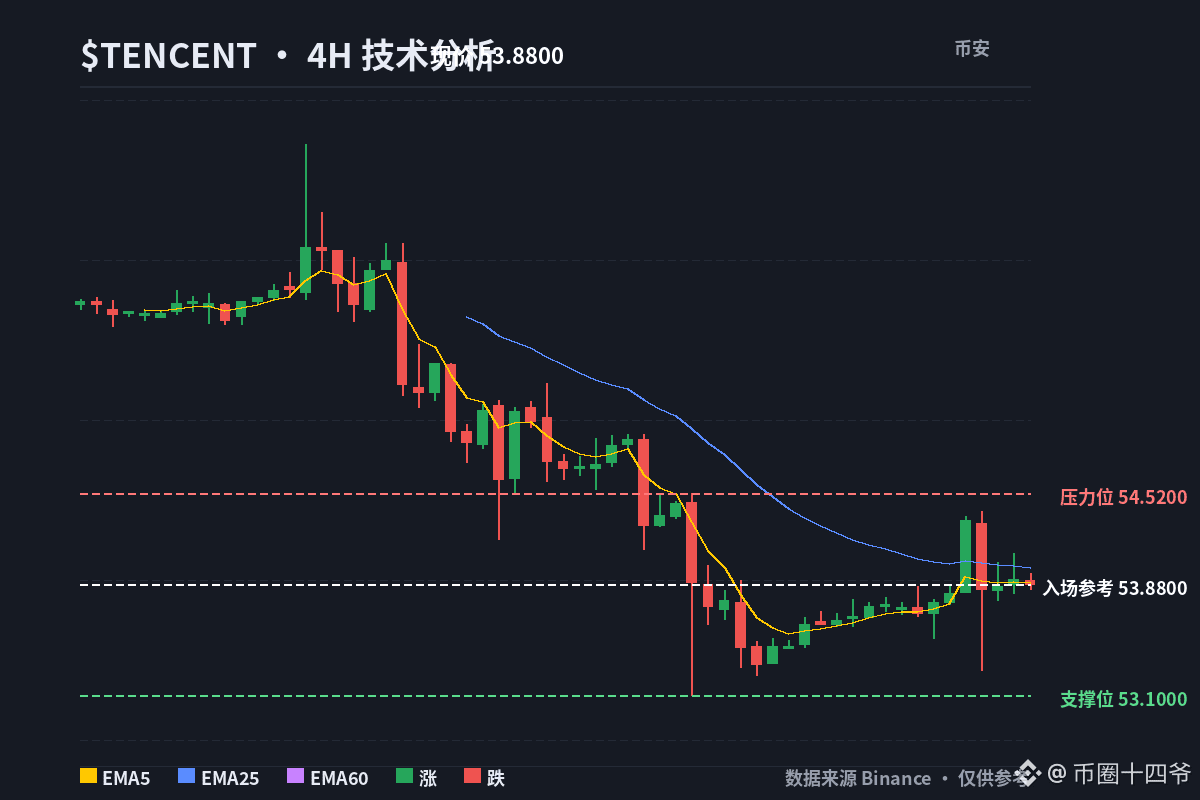
I see a clear signal here: $TENCENT just signed a multiyear cloud contract with Oracle worth roughly $7 billion.
The key isn’t the amount. It’s that they didn’t build their own infrastructure at home or lease more capacity there—instead, they shifted their compute budget overseas.
China’s biggest AI buyer is handing that money to a non-Chinese provider. That alone is a pretty telling signal.
I see a clear signal here: $TENCENT just signed a multiyear cloud contract with Oracle worth roughly $7 billion.
The key isn’t the amount. It’s that they didn’t build their own infrastructure at home or lease more capacity there—instead, they shifted their compute budget overseas.
China’s biggest AI buyer is handing that money to a non-Chinese provider. That alone is a pretty telling signal.
The key isn’t the amount. It’s that they didn’t build their own infrastructure at home or lease more capacity there—instead, they shifted their compute budget overseas.
China’s biggest AI buyer is handing that money to a non-Chinese provider. That alone is a pretty telling signal.
·
--
Kioxia is still trending downward. $SNDK and $MU need to step up and rally.
Semiconductor equipment stocks like Advantest are mostly up. $NVDA has hit another new high, and market risk appetite is clearly picking up pace.
Kioxia is still trending downward. $SNDK and $MU need to step up and rally.
Semiconductor equipment stocks like Advantest are mostly up. $NVDA has hit another new high, and market risk appetite is clearly picking up pace.
Semiconductor equipment stocks like Advantest are mostly up. $NVDA has hit another new high, and market risk appetite is clearly picking up pace.
89
·
--
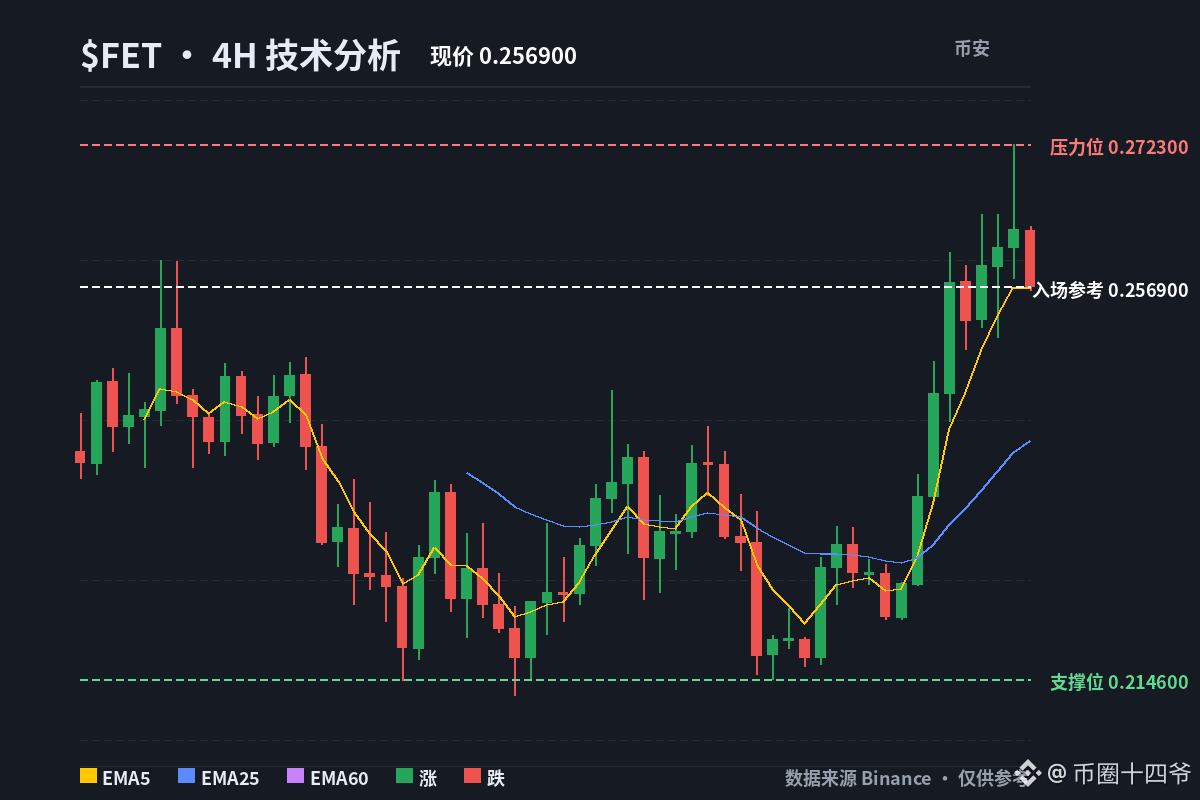
I'm keeping an eye on $FET. It's already reached resistance, and it feels like it could take off any moment.
I'm keeping an eye on $FET . It's already reached resistance, and it feels like it could take off any moment.
16
·
--
See translation
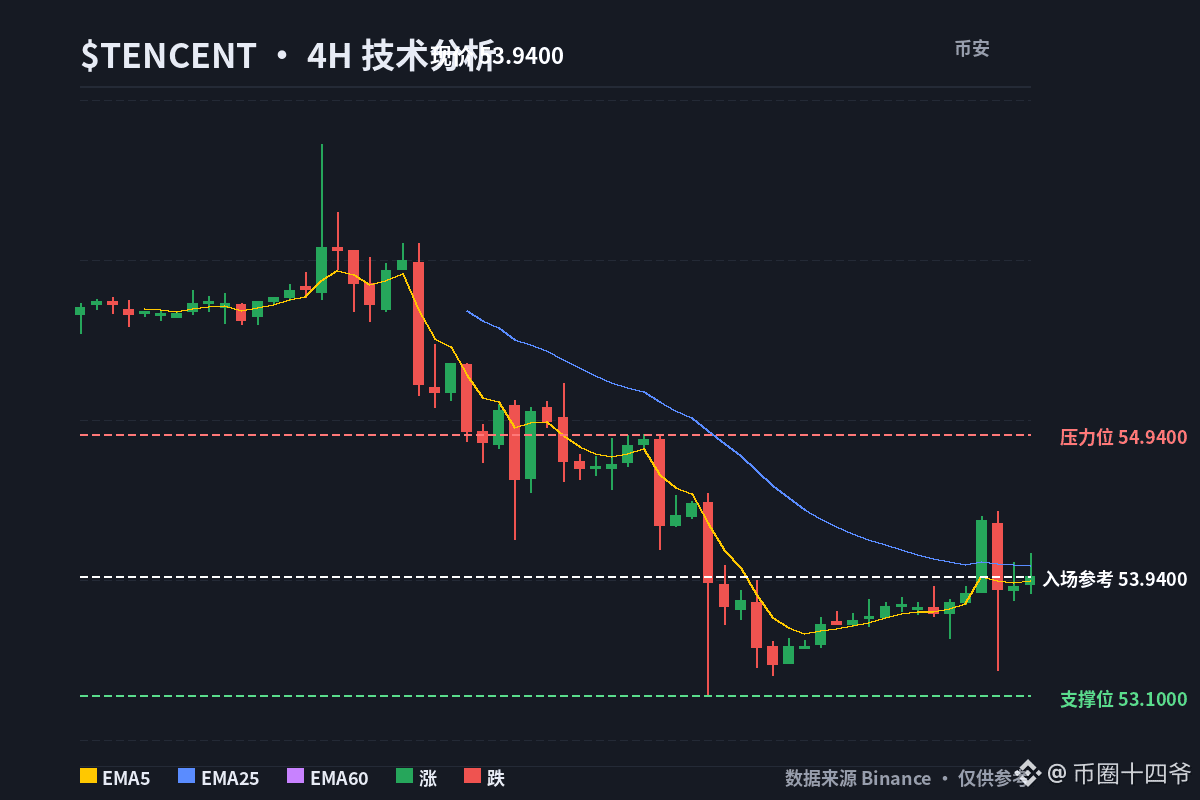
看到有人推腾讯10倍杠杆上线,我先说清楚,这不是什么新IPO。
腾讯2004年6月16日在香港上市,发行价3.70港元,2014年一拆五之后相当于每股0.74港元。
它的美股ADR $TCEHY 盘前大概54美元,按拆股调整后的发行价算,差不多是570倍,这都过去22年了。
看到有人推腾讯10倍杠杆上线,我先说清楚,这不是什么新IPO。
腾讯2004年6月16日在香港上市,发行价3.70港元,2014年一拆五之后相当于每股0.74港元。
它的美股ADR $TCEHY 盘前大概54美元,按拆股调整后的发行价算,差不多是570倍,这都过去22年了。
腾讯2004年6月16日在香港上市,发行价3.70港元,2014年一拆五之后相当于每股0.74港元。
它的美股ADR $TCEHY 盘前大概54美元,按拆股调整后的发行价算,差不多是570倍,这都过去22年了。
·
--
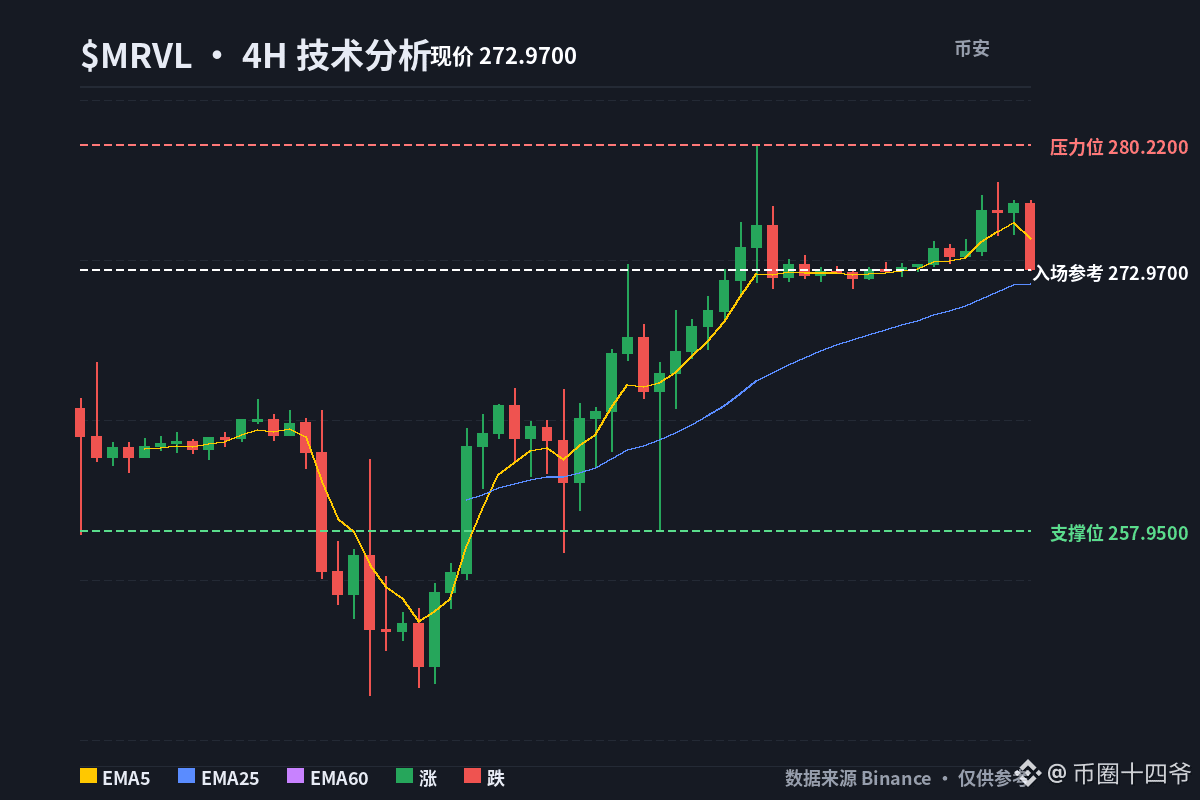
I've always thought the real story with $MRVL wasn't the GPU at all—the real highlight is interconnect.
Their just-reported second-quarter revenue was $2.739 billion, up 37% year over year, with data center accounting for a full 79%.
And they expect another 15% growth next quarter, bringing revenue to $3.15 billion.
I've always thought the real story with $MRVL wasn't the GPU at all—the real highlight is interconnect.
Their just-reported second-quarter revenue was $2.739 billion, up 37% year over year, with data center accounting for a full 79%.
And they expect another 15% growth next quarter, bringing revenue to $3.15 billion.
Their just-reported second-quarter revenue was $2.739 billion, up 37% year over year, with data center accounting for a full 79%.
And they expect another 15% growth next quarter, bringing revenue to $3.15 billion.
·
--
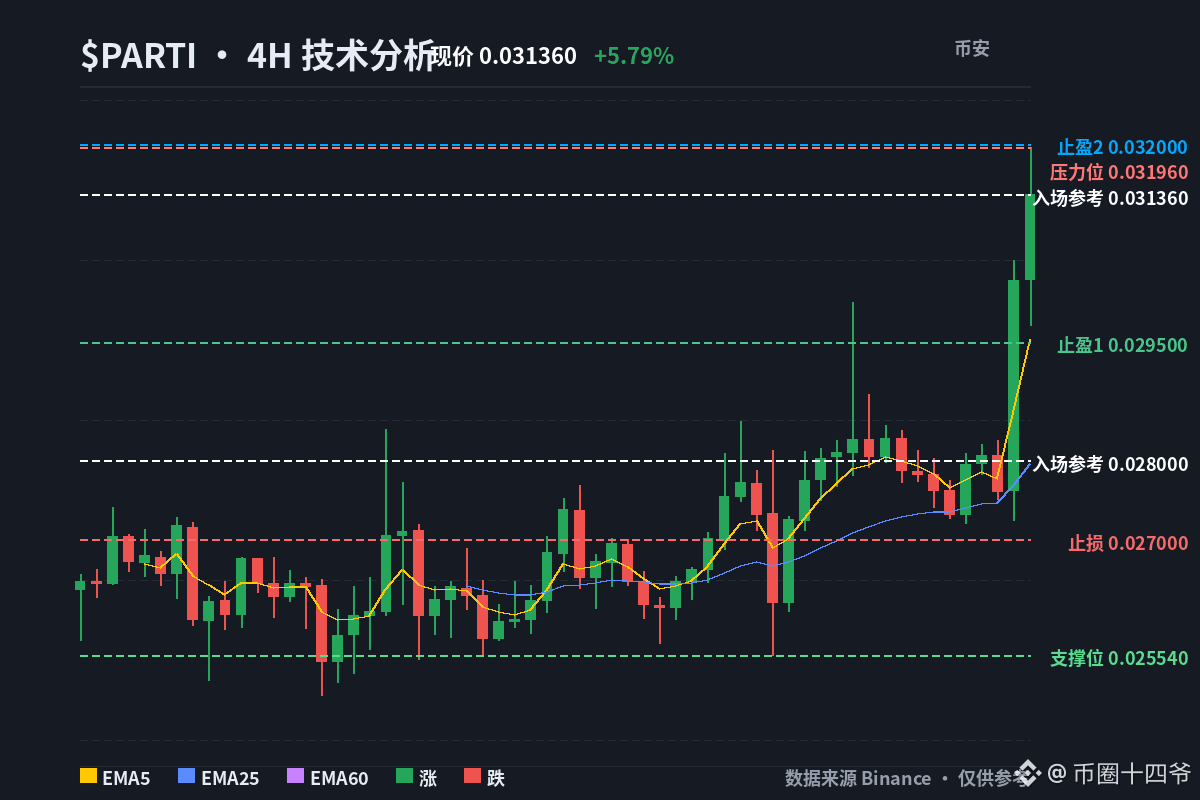
$PARTI 4-hour RSI7 has already overheated at 82.3, and the daily RSI is also sitting at 81.6. Price is hovering around 0.03, so I’m not chasing here. I’ll wait for a pullback to around 0.028 to go long. If it drops below 0.027, I’ll admit defeat and exit, keeping my powder dry.
Let’s be clear about sentiment first: the issue isn’t the trend, but who’s paying for protection. Funding is +0.03%, meaning longs are paying shorts. That shows the chasers have already lined up to pay their dues. The account long/short ratio is 1.27, and the top-trader position ratio is 2.09. Retail traders and whales are unusually aligned on the long side, with nobody taking the other side of the whales. When everyone agrees like this, a pullback is what you need to worry about most. If the market lets go, the first to run will be those with the highest leverage. That’s why I’m not taking the last handoff at the current price. OI is 15M against a market cap of 21M, putting OI at around 71% of market cap. Leverage is heavily stacked, so if the direction turns out to be wrong, sentiment could flip very quickly.
Now let’s look at the technical levels. The 4-hour EMAs are aligned bullishly, EMA5>25>60, and the daily EMAs are also bullish, EMA5>25. The trend hasn’t broken down, but the last three 4-hour candles gained 13.58%, putting it ninth on the gainers list. Volatility over the last three 4-hour candles is 6.92%, and daily volatility is 9.8%. That’s like firing all your bullets at once, which makes a pullback more likely. The quoted prices don’t line up: the order book shows 0.0234, while the current price on the candlestick chart is 0.03. I’m calculating the risk/reward based on a real-time price around 0.0295, not chasing that lower quote.
BTC is only up +0.86%, while the overall market (ALL) is actually down -1.28%. $PARTI has independently rallied 5.79% against the trend, which deserves respect, but when the broader market retreats, it has one less layer of support.
Your position size determines your state of mind. Don’t get carried away.
📊 Direction: Long (wait for a pullback)
💰 Entry reference: Look for support around 0.028 on a pullback
🛑 Stop loss: Exit if it breaks below 0.027
🎯 Take profit 1: 0.0295
🎯 Take profit 2: 0.032
Being overbought doesn’t mean the top is in, but chasing a long at the current price is no longer worth the risk.
Would you go long on a pullback to 0.028, or do you think the trend weakens if it breaks below 0.027? Pick one.
$PARTI #技术分析 #Thirteenth Master
$PARTI 4-hour RSI7 has already overheated at 82.3, and the daily RSI is also sitting at 81.6. Price is hovering around 0.03, so I’m not chasing here. I’ll wait for a pullback to around 0.028 to go long. If it drops below 0.027, I’ll admit defeat and exit, keeping my powder dry.
Let’s be clear about sentiment first: the issue isn’t the trend, but who’s paying for protection. Funding is +0.03%, meaning longs are paying shorts. That shows the chasers have already lined up to pay their dues. The account long/short ratio is 1.27, and the top-trader position ratio is 2.09. Retail traders and whales are unusually aligned on the long side, with nobody taking the other side of the whales. When everyone agrees like this, a pullback is what you need to worry about most. If the market lets go, the first to run will be those with the highest leverage. That’s why I’m not taking the last handoff at the current price. OI is 15M against a market cap of 21M, putting OI at around 71% of market cap. Leverage is heavily stacked, so if the direction turns out to be wrong, sentiment could flip very quickly.
Now let’s look at the technical levels. The 4-hour EMAs are aligned bullishly, EMA5>25>60, and the daily EMAs are also bullish, EMA5>25. The trend hasn’t broken down, but the last three 4-hour candles gained 13.58%, putting it ninth on the gainers list. Volatility over the last three 4-hour candles is 6.92%, and daily volatility is 9.8%. That’s like firing all your bullets at once, which makes a pullback more likely. The quoted prices don’t line up: the order book shows 0.0234, while the current price on the candlestick chart is 0.03. I’m calculating the risk/reward based on a real-time price around 0.0295, not chasing that lower quote.
BTC is only up +0.86%, while the overall market (ALL) is actually down -1.28%. $PARTI has independently rallied 5.79% against the trend, which deserves respect, but when the broader market retreats, it has one less layer of support.
Your position size determines your state of mind. Don’t get carried away.
📊 Direction: Long (wait for a pullback)
💰 Entry reference: Look for support around 0.028 on a pullback
🛑 Stop loss: Exit if it breaks below 0.027
🎯 Take profit 1: 0.0295
🎯 Take profit 2: 0.032
Being overbought doesn’t mean the top is in, but chasing a long at the current price is no longer worth the risk.
Would you go long on a pullback to 0.028, or do you think the trend weakens if it breaks below 0.027? Pick one.
$PARTI #技术分析 #Thirteenth Master
Let’s be clear about sentiment first: the issue isn’t the trend, but who’s paying for protection. Funding is +0.03%, meaning longs are paying shorts. That shows the chasers have already lined up to pay their dues. The account long/short ratio is 1.27, and the top-trader position ratio is 2.09. Retail traders and whales are unusually aligned on the long side, with nobody taking the other side of the whales. When everyone agrees like this, a pullback is what you need to worry about most. If the market lets go, the first to run will be those with the highest leverage. That’s why I’m not taking the last handoff at the current price. OI is 15M against a market cap of 21M, putting OI at around 71% of market cap. Leverage is heavily stacked, so if the direction turns out to be wrong, sentiment could flip very quickly.
Now let’s look at the technical levels. The 4-hour EMAs are aligned bullishly, EMA5>25>60, and the daily EMAs are also bullish, EMA5>25. The trend hasn’t broken down, but the last three 4-hour candles gained 13.58%, putting it ninth on the gainers list. Volatility over the last three 4-hour candles is 6.92%, and daily volatility is 9.8%. That’s like firing all your bullets at once, which makes a pullback more likely. The quoted prices don’t line up: the order book shows 0.0234, while the current price on the candlestick chart is 0.03. I’m calculating the risk/reward based on a real-time price around 0.0295, not chasing that lower quote.
BTC is only up +0.86%, while the overall market (ALL) is actually down -1.28%. $PARTI has independently rallied 5.79% against the trend, which deserves respect, but when the broader market retreats, it has one less layer of support.
Your position size determines your state of mind. Don’t get carried away.
📊 Direction: Long (wait for a pullback)
💰 Entry reference: Look for support around 0.028 on a pullback
🛑 Stop loss: Exit if it breaks below 0.027
🎯 Take profit 1: 0.0295
🎯 Take profit 2: 0.032
Being overbought doesn’t mean the top is in, but chasing a long at the current price is no longer worth the risk.
Would you go long on a pullback to 0.028, or do you think the trend weakens if it breaks below 0.027? Pick one.
$PARTI #技术分析 #Thirteenth Master
12
·
--
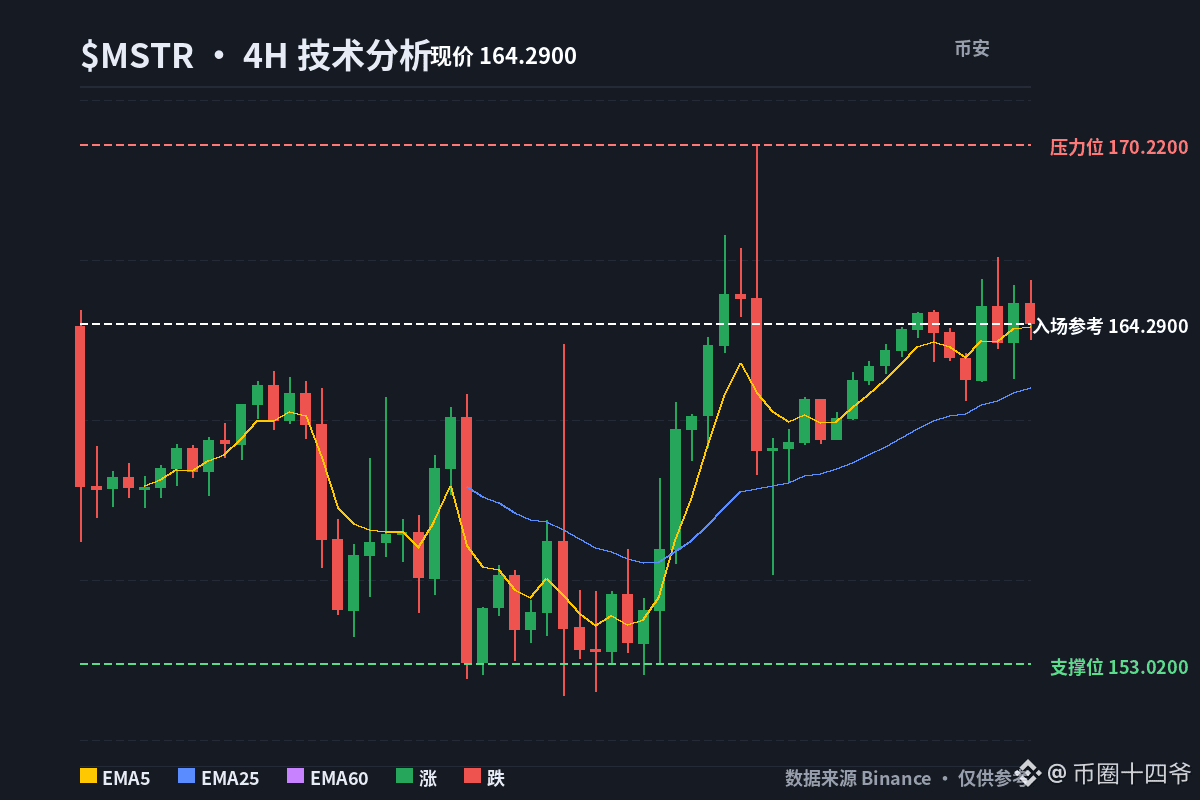
I’ve been tracking the intraday price spread between $MSTR and $COIN . The more I watch, the more interesting it gets. In this market’s wild swings, when retail sentiment pulls away from the underlying asset $BTC , have you noticed the same kind of decoupling?
I’ve been tracking the intraday price spread between $MSTR and $COIN . The more I watch, the more interesting it gets. In this market’s wild swings, when retail sentiment pulls away from the underlying asset $BTC , have you noticed the same kind of decoupling?
22
Log in to explore more content
Join global crypto users on Binance Square
⚡️ Get latest and useful information about crypto.
💬 Trusted by the world’s largest crypto exchange.
👍 Discover real insights from verified creators.
Email / Phone number
Trending Topics
ADAGains10%Above$0.27
9,897 views
153 Discussing
$ADA is making a strong move today jumping over 10 percent to around 027 and breaking into a new 90 day high
Trading volume has also surged above 1 billion showing strong market activity
The move comes as $ADA continues its recovery from the June lows while its recent technical structure has turned more bullish
The 027 to 028 zone is now the key area to watch A sustained breakout could open the door toward higher resistance levels
But after such a sharp daily move volatility could remain high
#ADAGains10%Above$0.27 #crypto #ADA #Cardano #crypto #Write2Earn
AbdullahAbid_7
·0 Likes
·304 views
ETHUp70%InQ3ButLiquidityFalls
112,238 views
906 Discussing
EthStakingExitQueueHits2026High
40,689 views
659 Discussing