
JARAH AHMED
221 Posts

JARAH AHMED
Report
Block User
I'm Seeing what you can earn 💸🤑.. So Don't forget TP/SL
Open Trade
Frequent Trader
1.3 Years
10 Following
107 Followers
97 Liked
Posts
Portfolio
All
Quotes
Videos
·
--
$AIO
1\. General trend
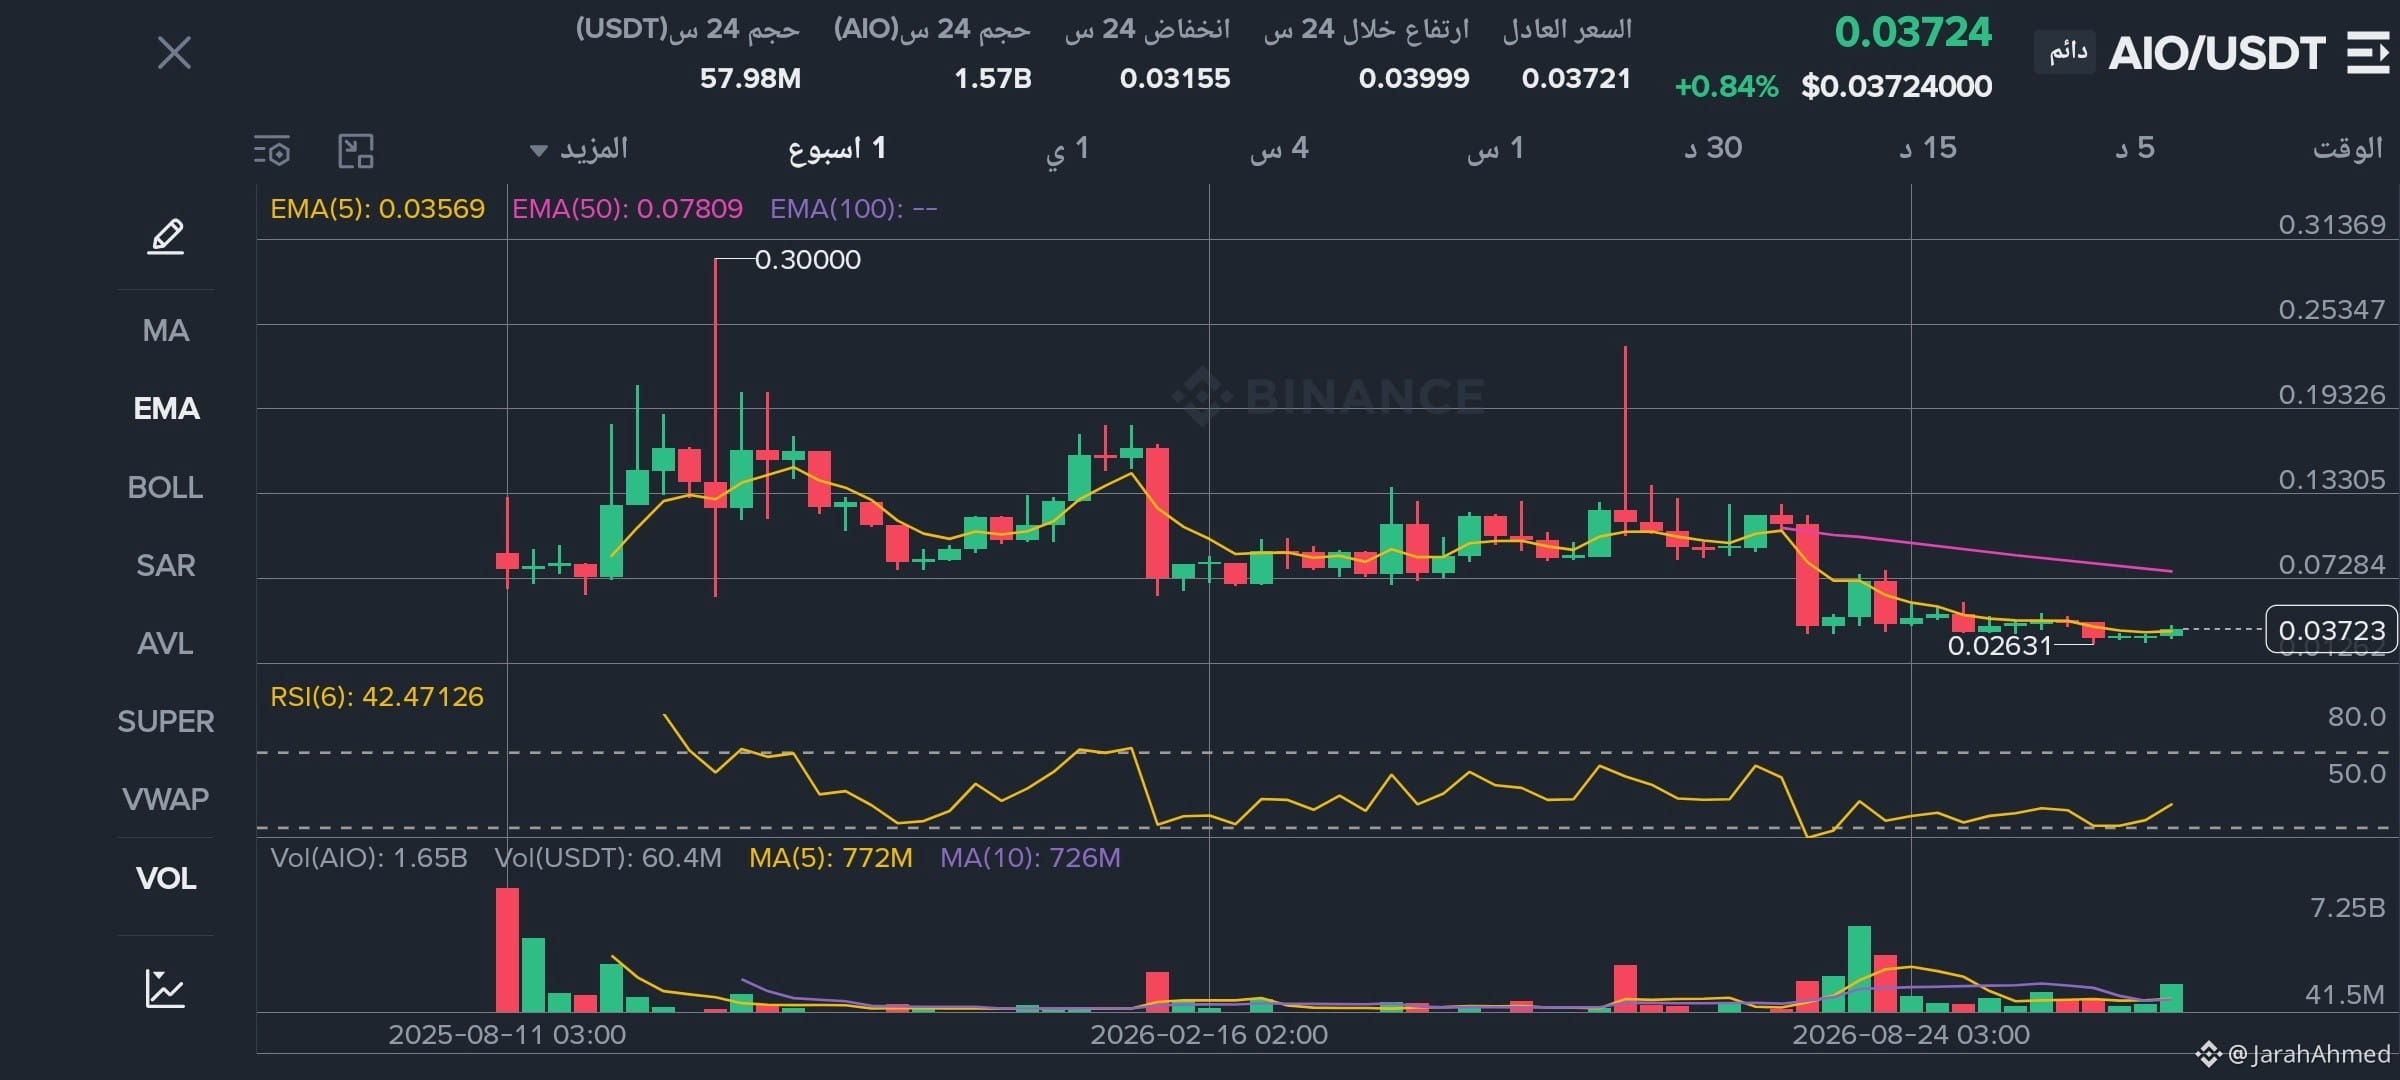
* Weekly: bearish.
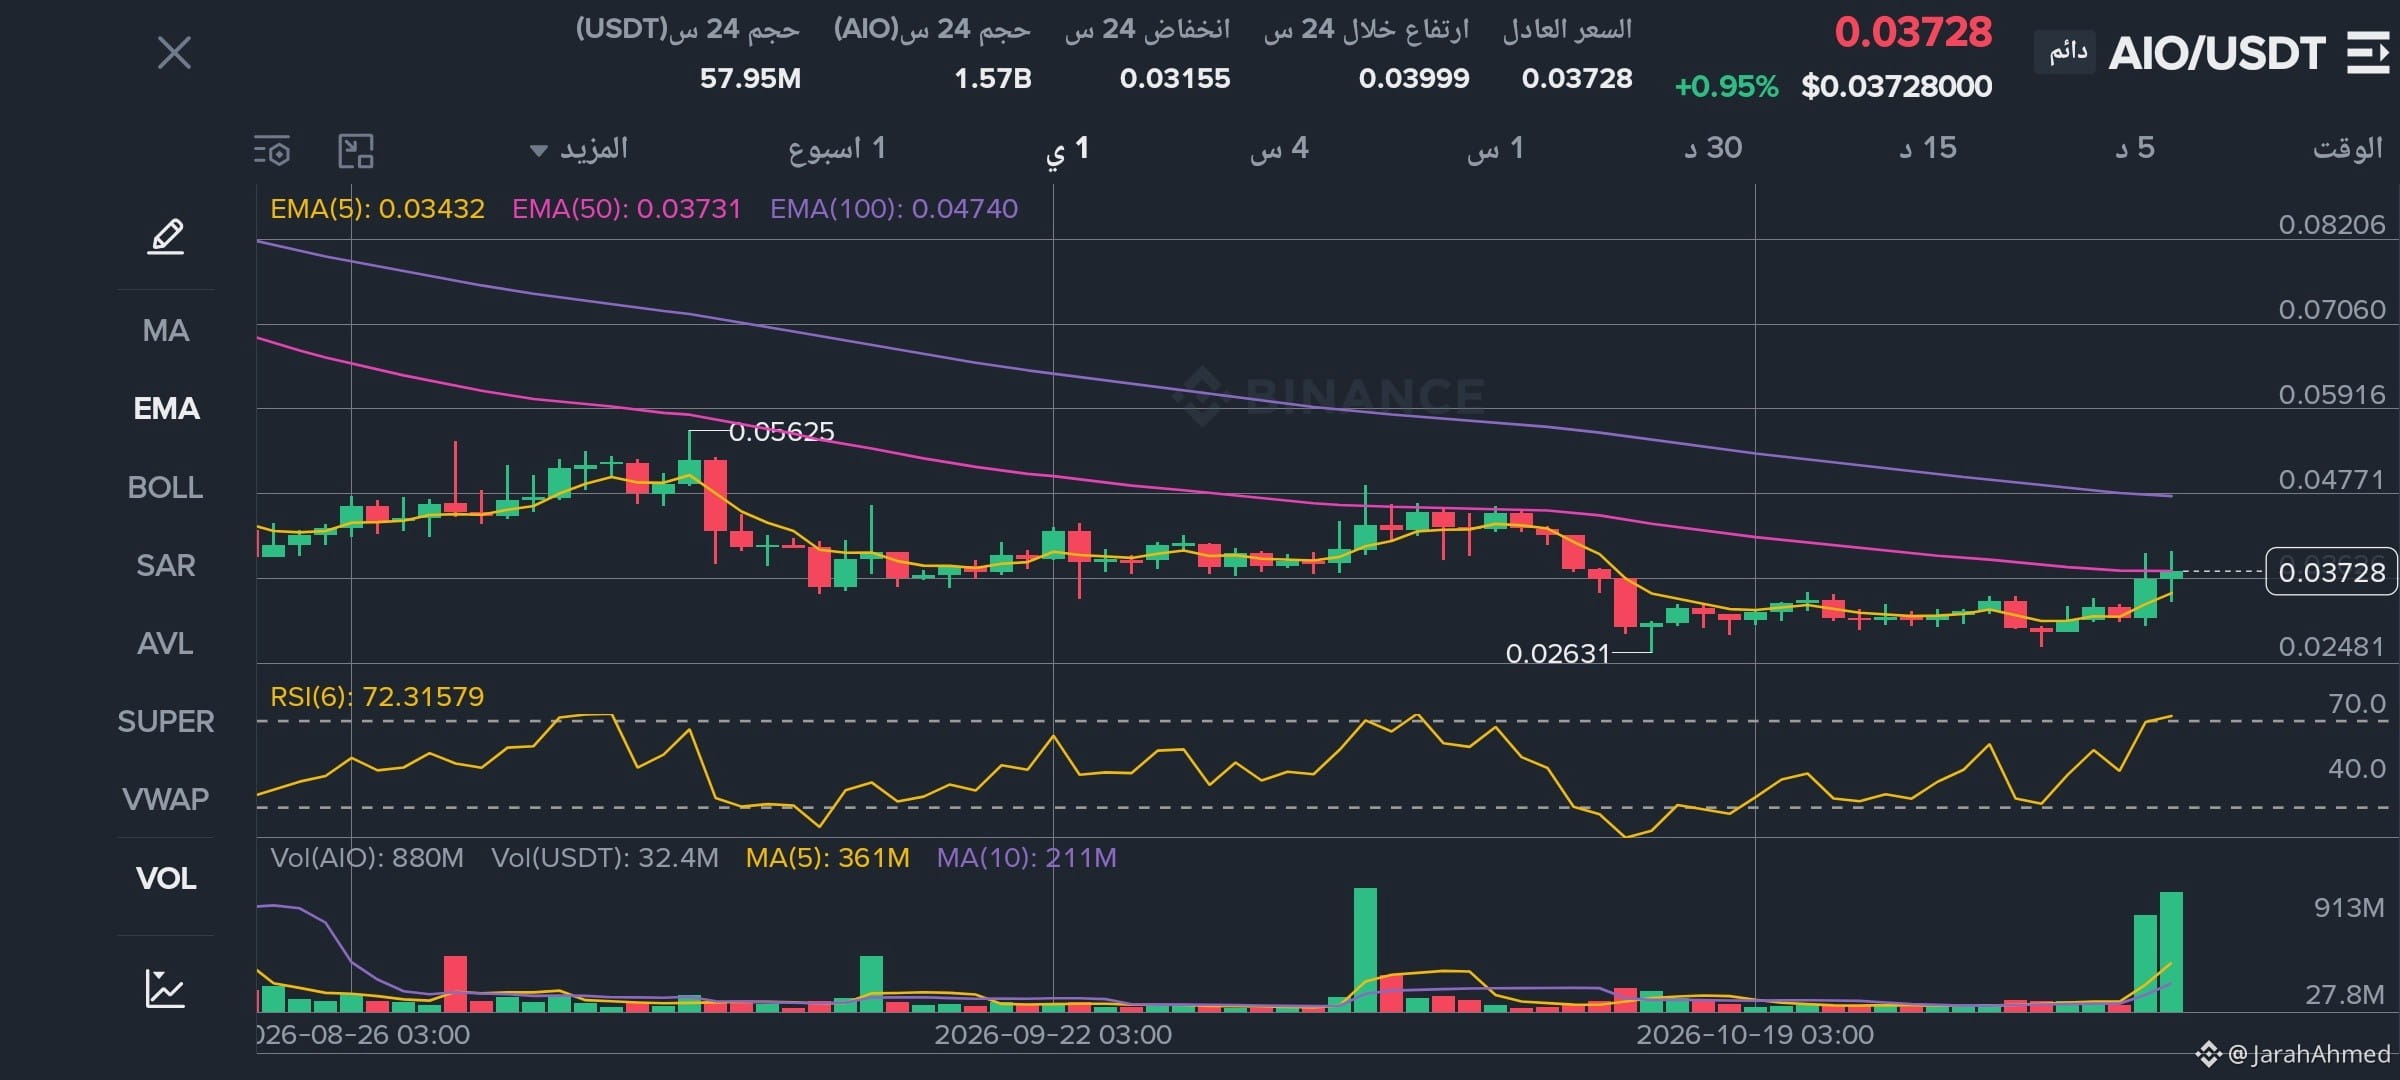
* Daily: bullish rebound.
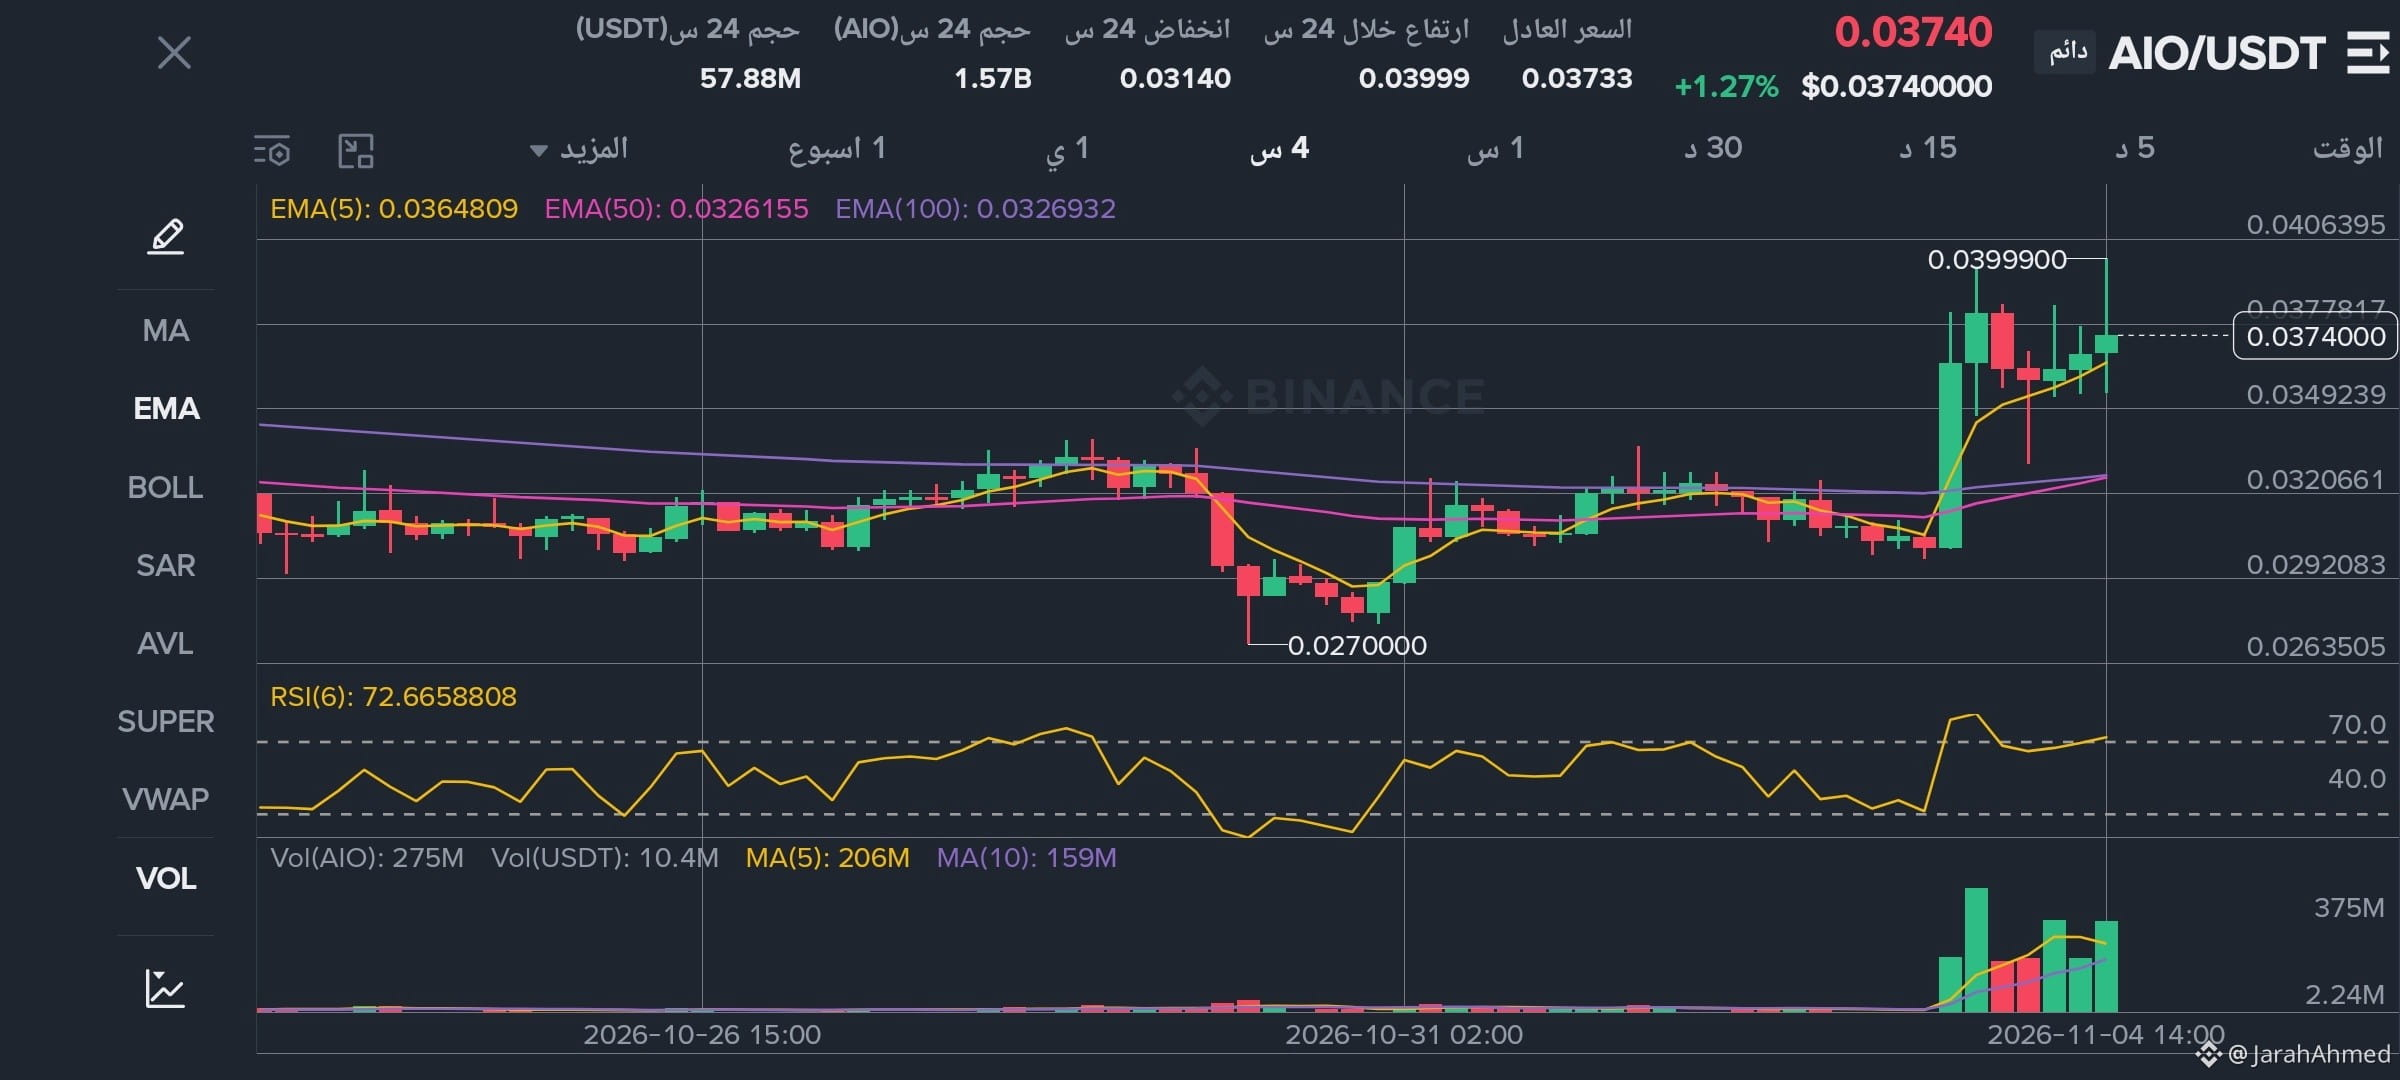
* Hourly: short-term bullish with strong momentum.
2\. Price patterns and candlesticks
* Breakout of a previous sideways range near 0.0320.
* Strong bullish candles accompanied by a notable increase in trading volume.
* Price consolidation below the 0.03999 resistance.
* RSI elevated near 72, indicating the possibility of a short-term correction.
3\. Entry point $AIO
* Hypothetical entry: 0.0350 – 0.0360 after confirmation of stability.
* Alternative: break above 0.0400 and close above it on the 4-hour chart.
4\. Stop loss
\- 0.0320
5\. First target TP1
\- 0.0400
6\. Second target TP2
\- 0.0470
Assessment: Short-term momentum is positive, but the weekly trend remains bearish. It is preferable to wait for a retest of the breakout zone rather than chase the price at 0.0374.
$AIO
1\. General trend
* Weekly: bearish.
* Daily: bullish rebound.
* Hourly: short-term bullish with strong momentum.
2\. Price patterns and candlesticks
* Breakout of a previous sideways range near 0.0320.
* Strong bullish candles accompanied by a notable increase in trading volume.
* Price consolidation below the 0.03999 resistance.
* RSI elevated near 72, indicating the possibility of a short-term correction.
3\. Entry point $AIO
* Hypothetical entry: 0.0350 – 0.0360 after confirmation of stability.
* Alternative: break above 0.0400 and close above it on the 4-hour chart.
4\. Stop loss
\- 0.0320
5\. First target TP1
\- 0.0400
6\. Second target TP2
\- 0.0470
Assessment: Short-term momentum is positive, but the weekly trend remains bearish. It is preferable to wait for a retest of the breakout zone rather than chase the price at 0.0374.
1\. General trend
* Weekly: bearish.
* Daily: bullish rebound.
* Hourly: short-term bullish with strong momentum.
2\. Price patterns and candlesticks
* Breakout of a previous sideways range near 0.0320.
* Strong bullish candles accompanied by a notable increase in trading volume.
* Price consolidation below the 0.03999 resistance.
* RSI elevated near 72, indicating the possibility of a short-term correction.
3\. Entry point $AIO
* Hypothetical entry: 0.0350 – 0.0360 after confirmation of stability.
* Alternative: break above 0.0400 and close above it on the 4-hour chart.
4\. Stop loss
\- 0.0320
5\. First target TP1
\- 0.0400
6\. Second target TP2
\- 0.0470
Assessment: Short-term momentum is positive, but the weekly trend remains bearish. It is preferable to wait for a retest of the breakout zone rather than chase the price at 0.0374.
58
·
--
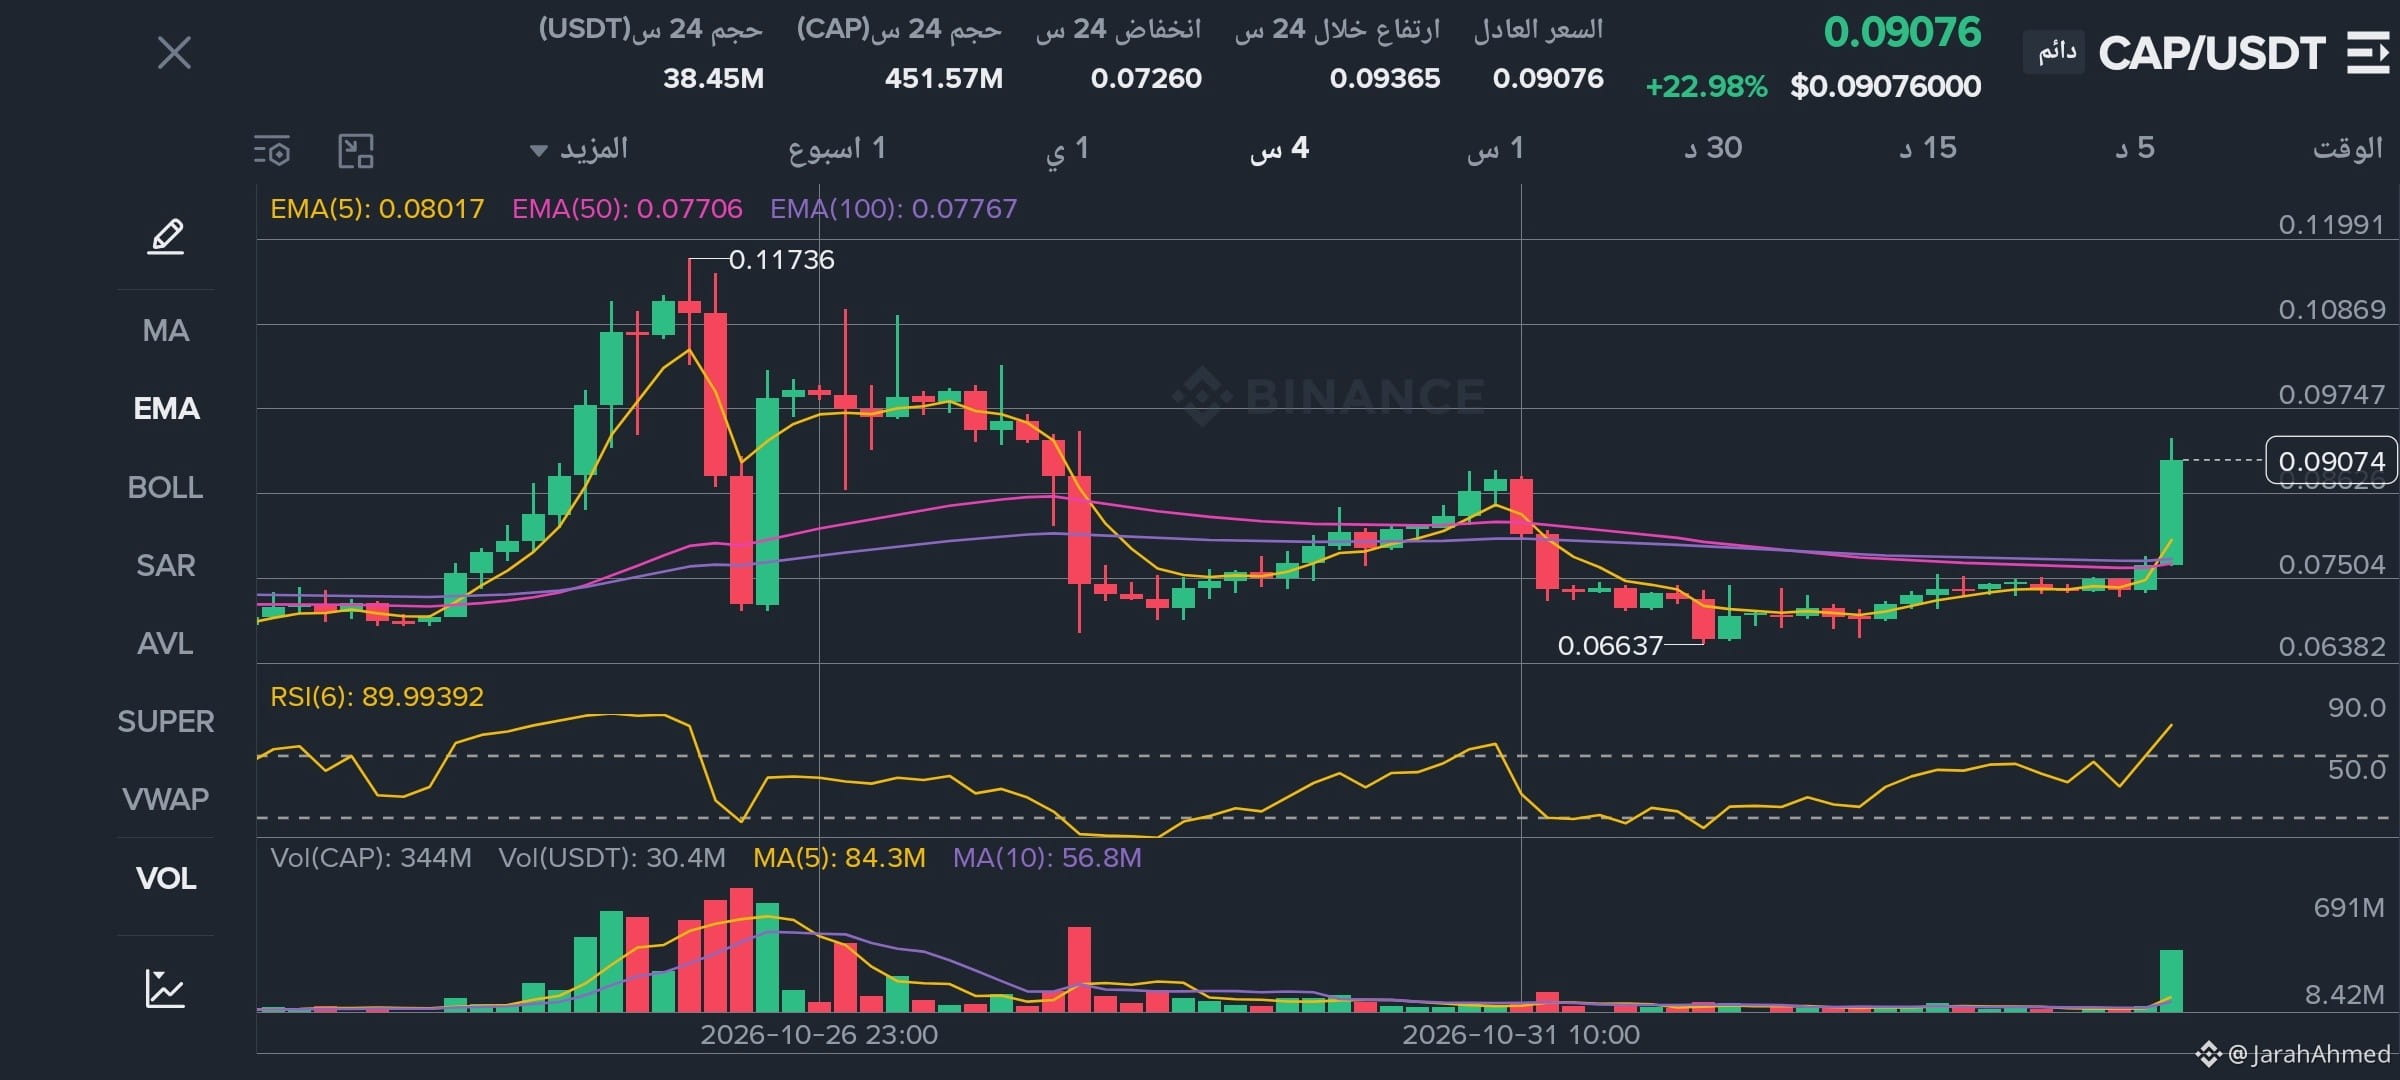
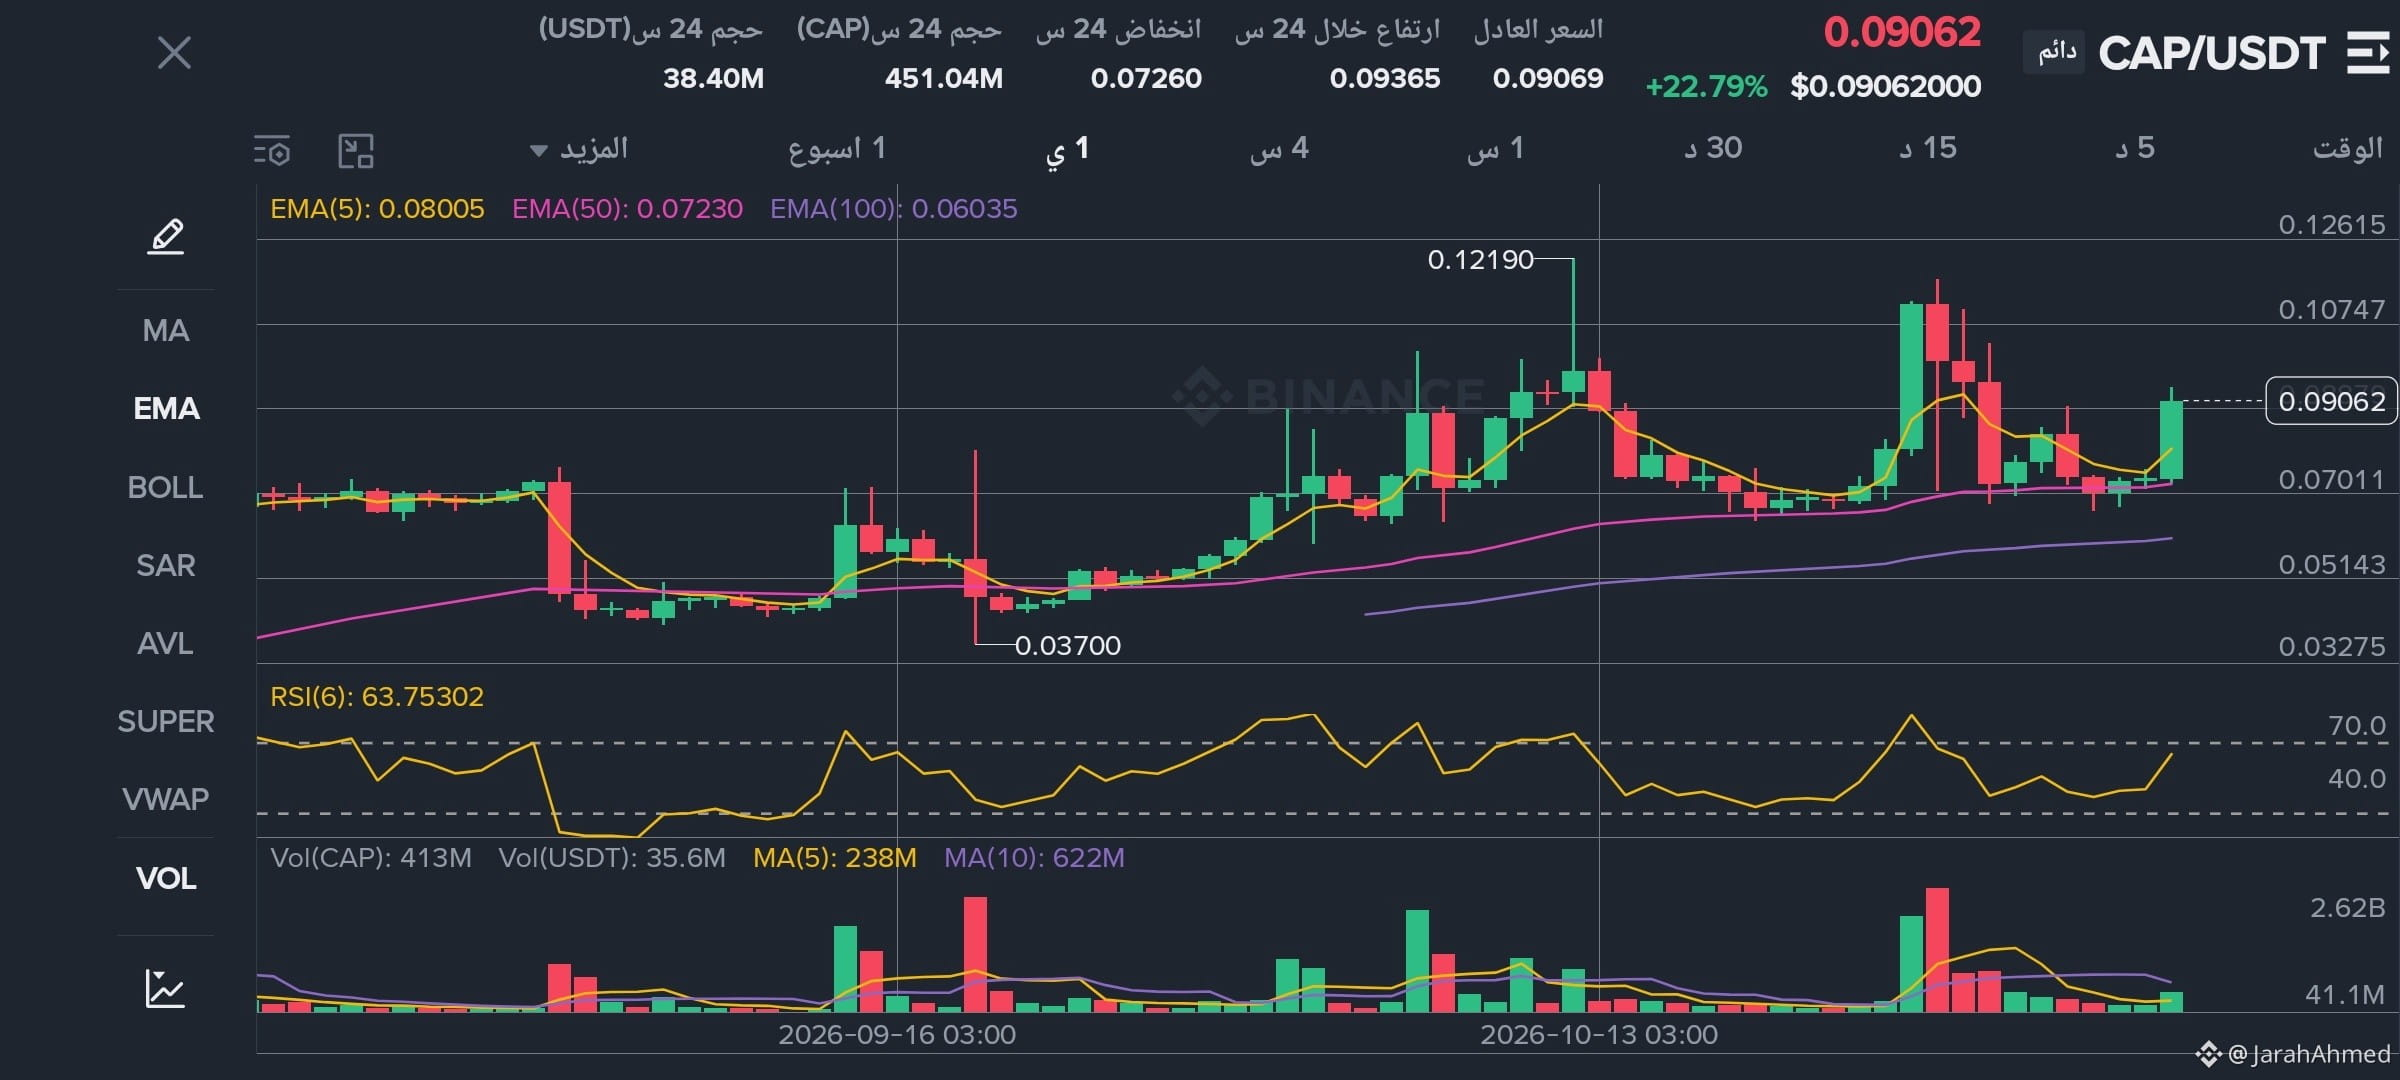
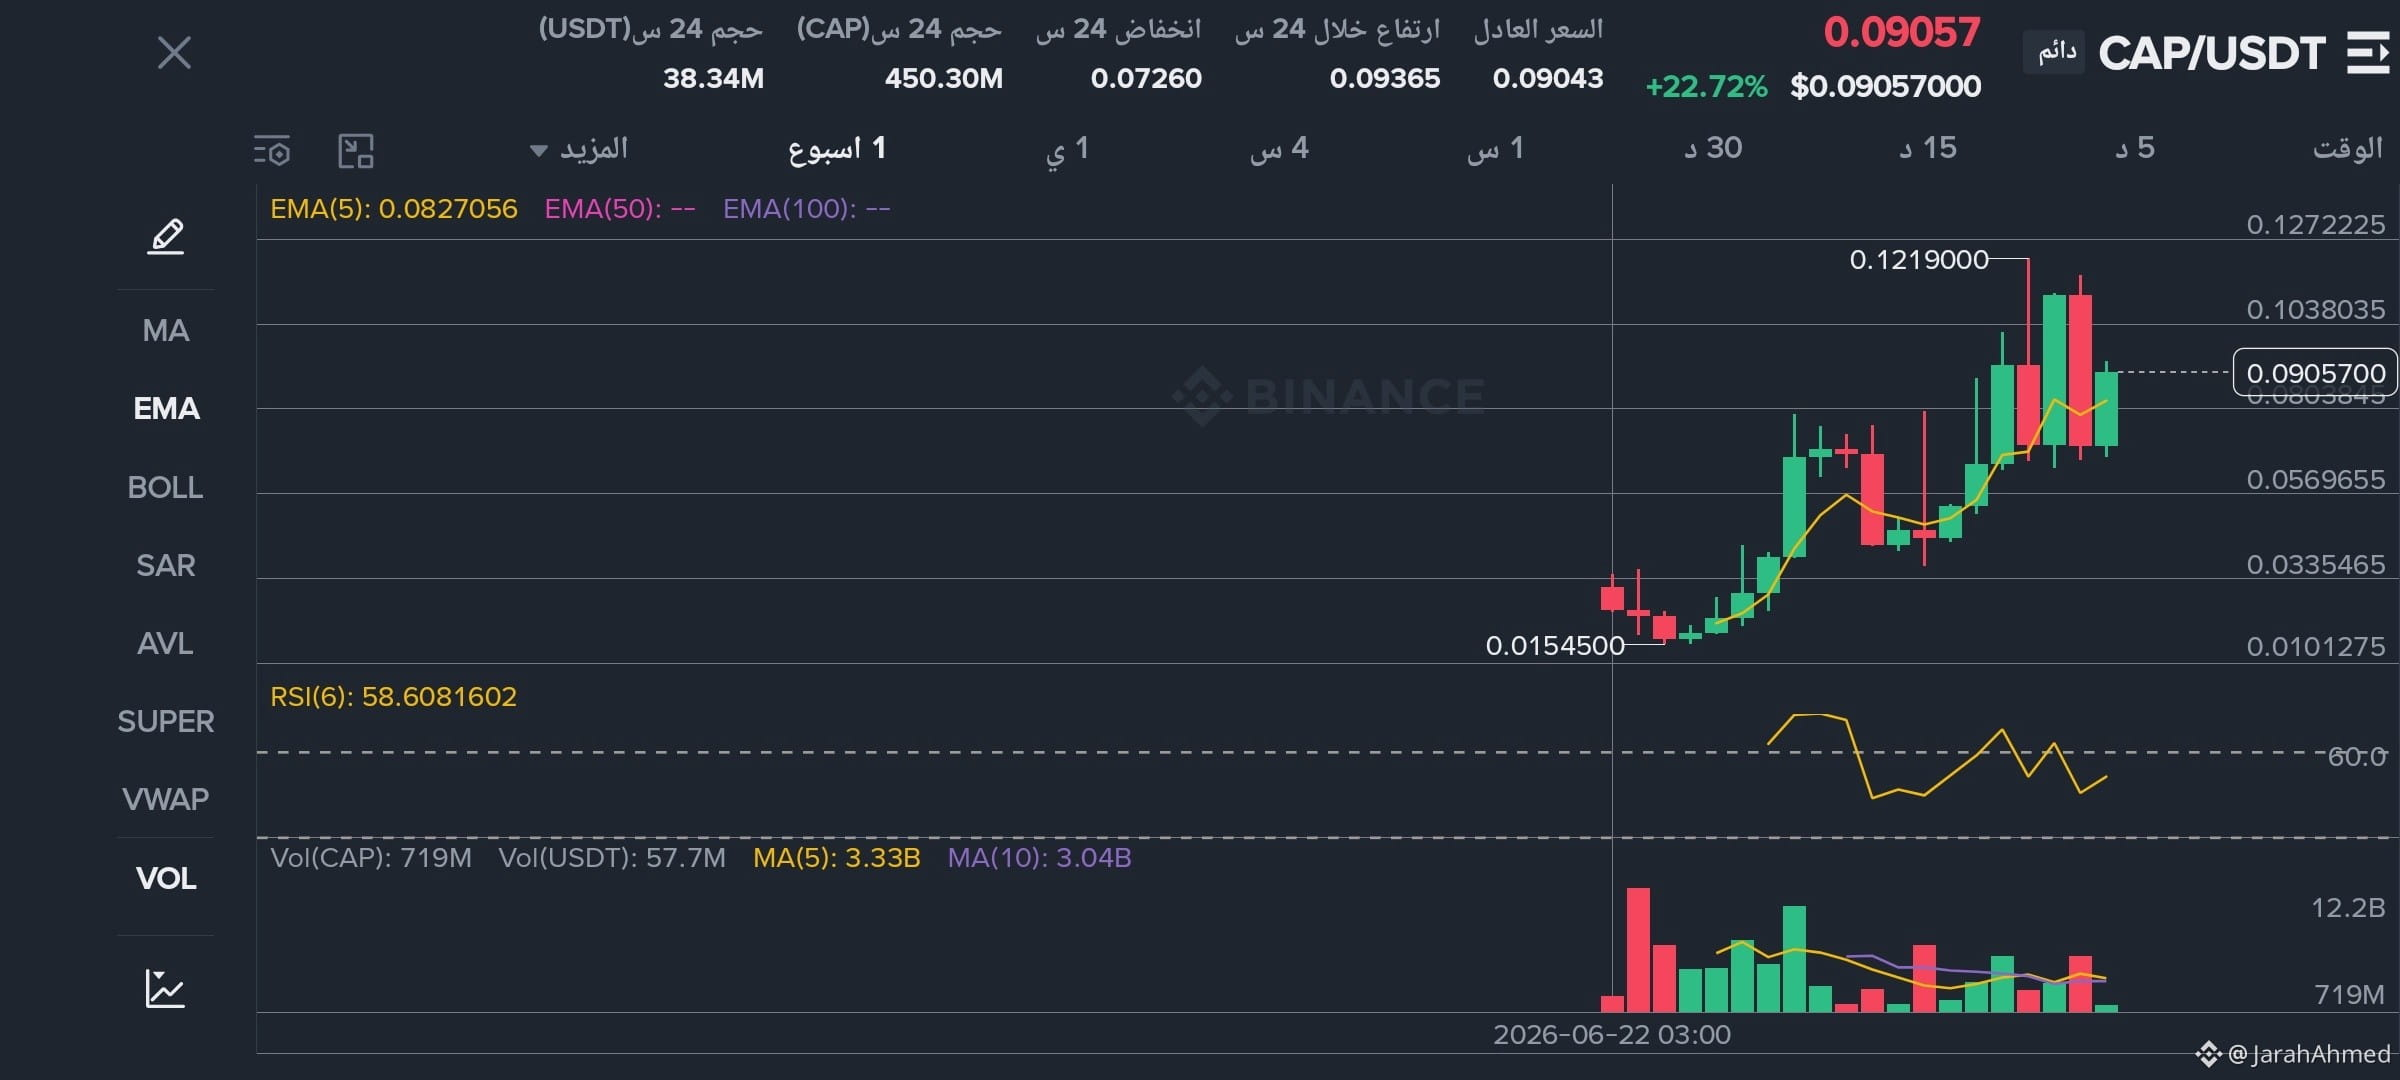
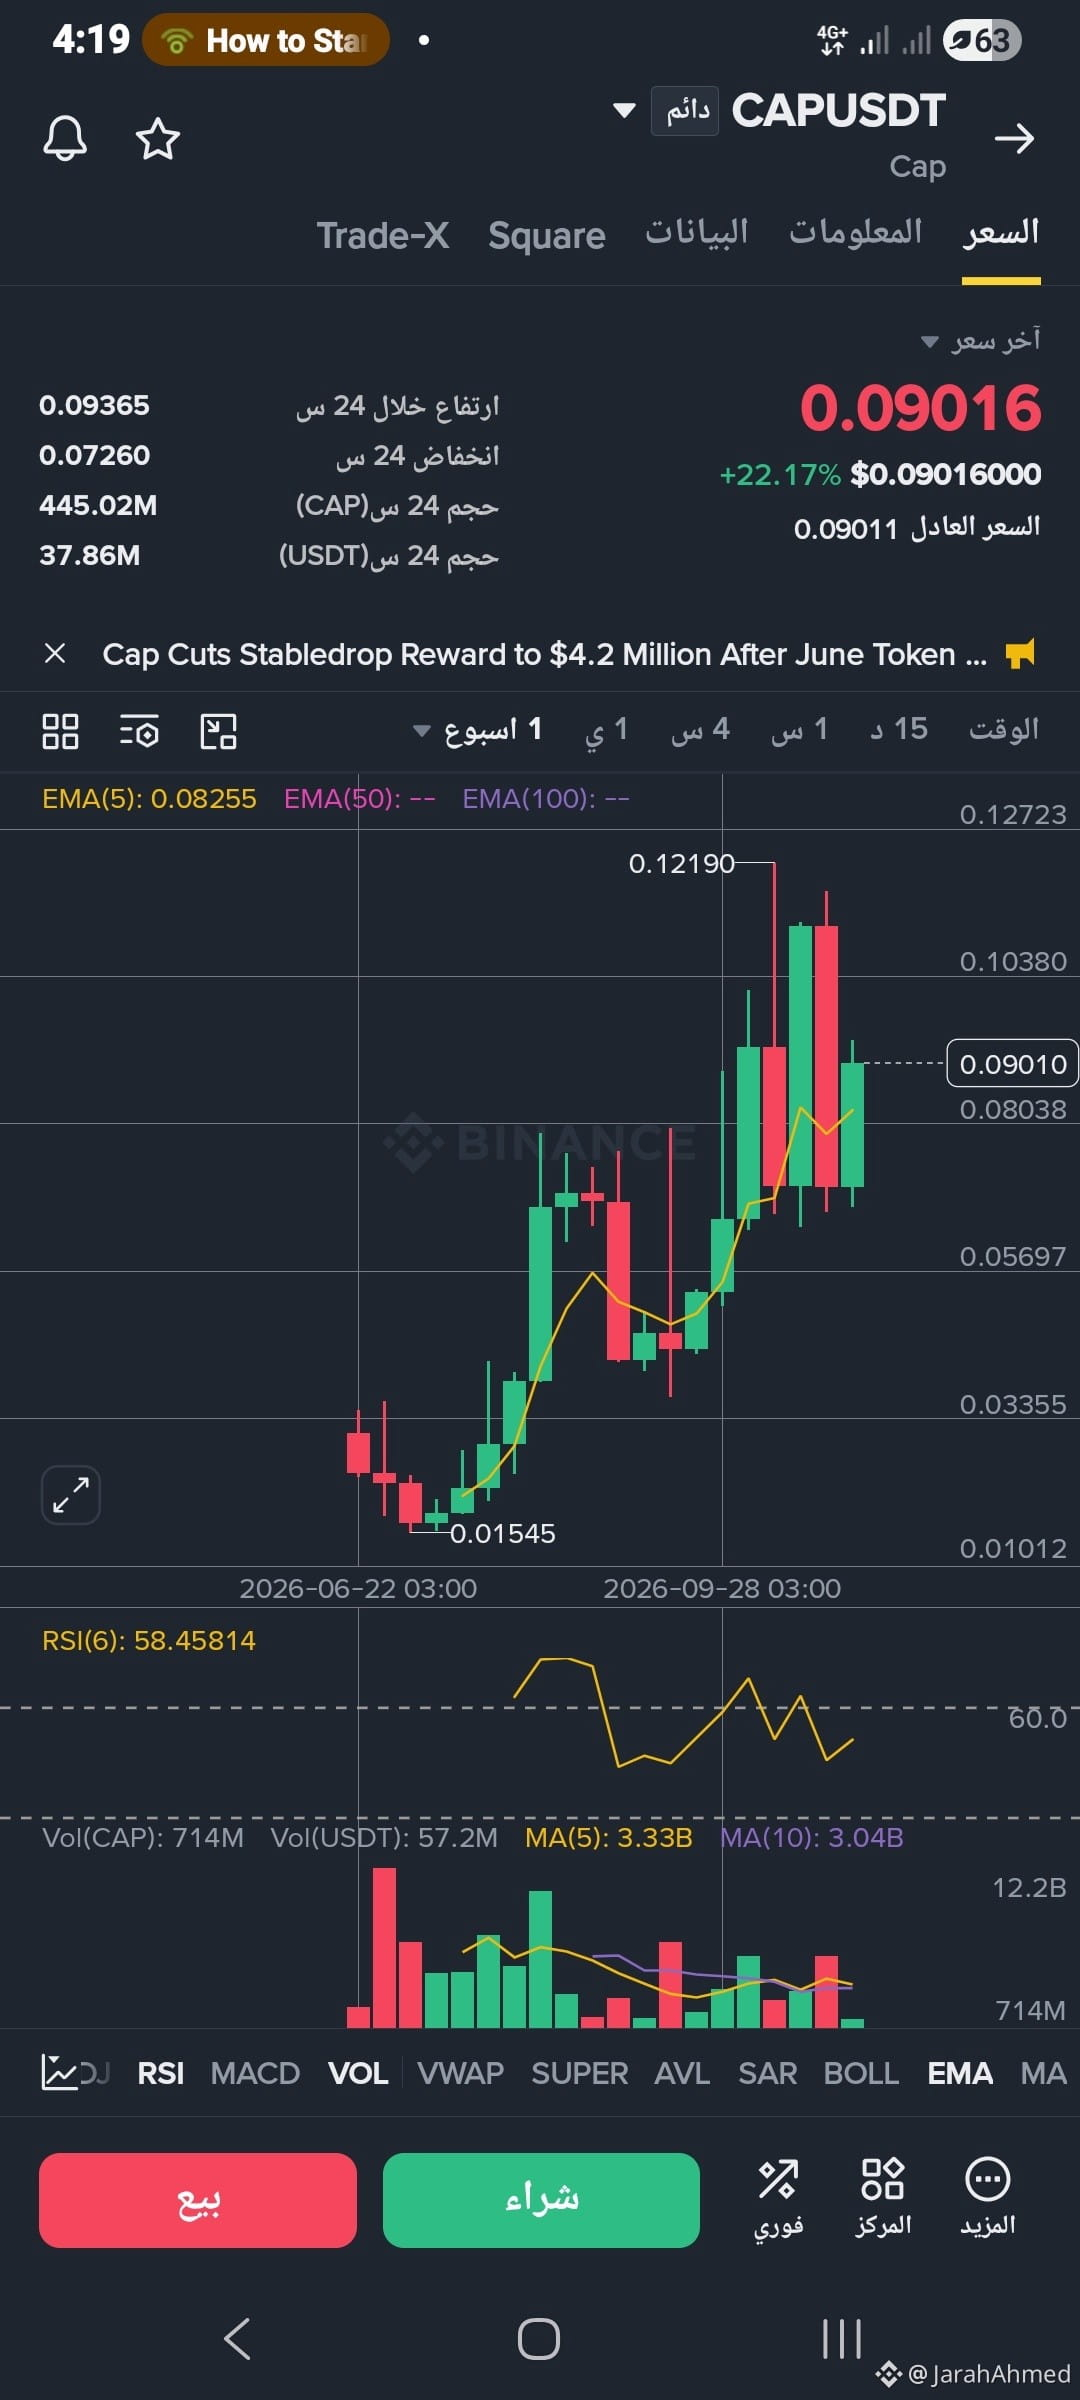
$CAP 💰 Entry point
0.0820 – 0.0850
Wait for a correction and a retest of the zone, with confirmation of a rebound.
I don't recommend chasing the price at 0.0906 after the rapid rise.
🔴. Stop loss
0.0740
🎯. First target
0.0975 USDT
🎯. Second target
$CAP 0.1087 USDT
$CAP 💰 Entry point
0.0820 – 0.0850
Wait for a correction and a retest of the zone, with confirmation of a rebound.
I don't recommend chasing the price at 0.0906 after the rapid rise.
🔴. Stop loss
0.0740
🎯. First target
0.0975 USDT
🎯. Second target
$CAP 0.1087 USDT
0.0820 – 0.0850
Wait for a correction and a retest of the zone, with confirmation of a rebound.
I don't recommend chasing the price at 0.0906 after the rapid rise.
🔴. Stop loss
0.0740
🎯. First target
0.0975 USDT
🎯. Second target
$CAP 0.1087 USDT
79
·
--
This is how you build wealth 💸💸💰💰
$USELESS $HOT $TMO.US
This is how you build wealth 💸💸💰💰
$USELESS $HOT $TMO.US
$USELESS $HOT $TMO.US




18
·
--
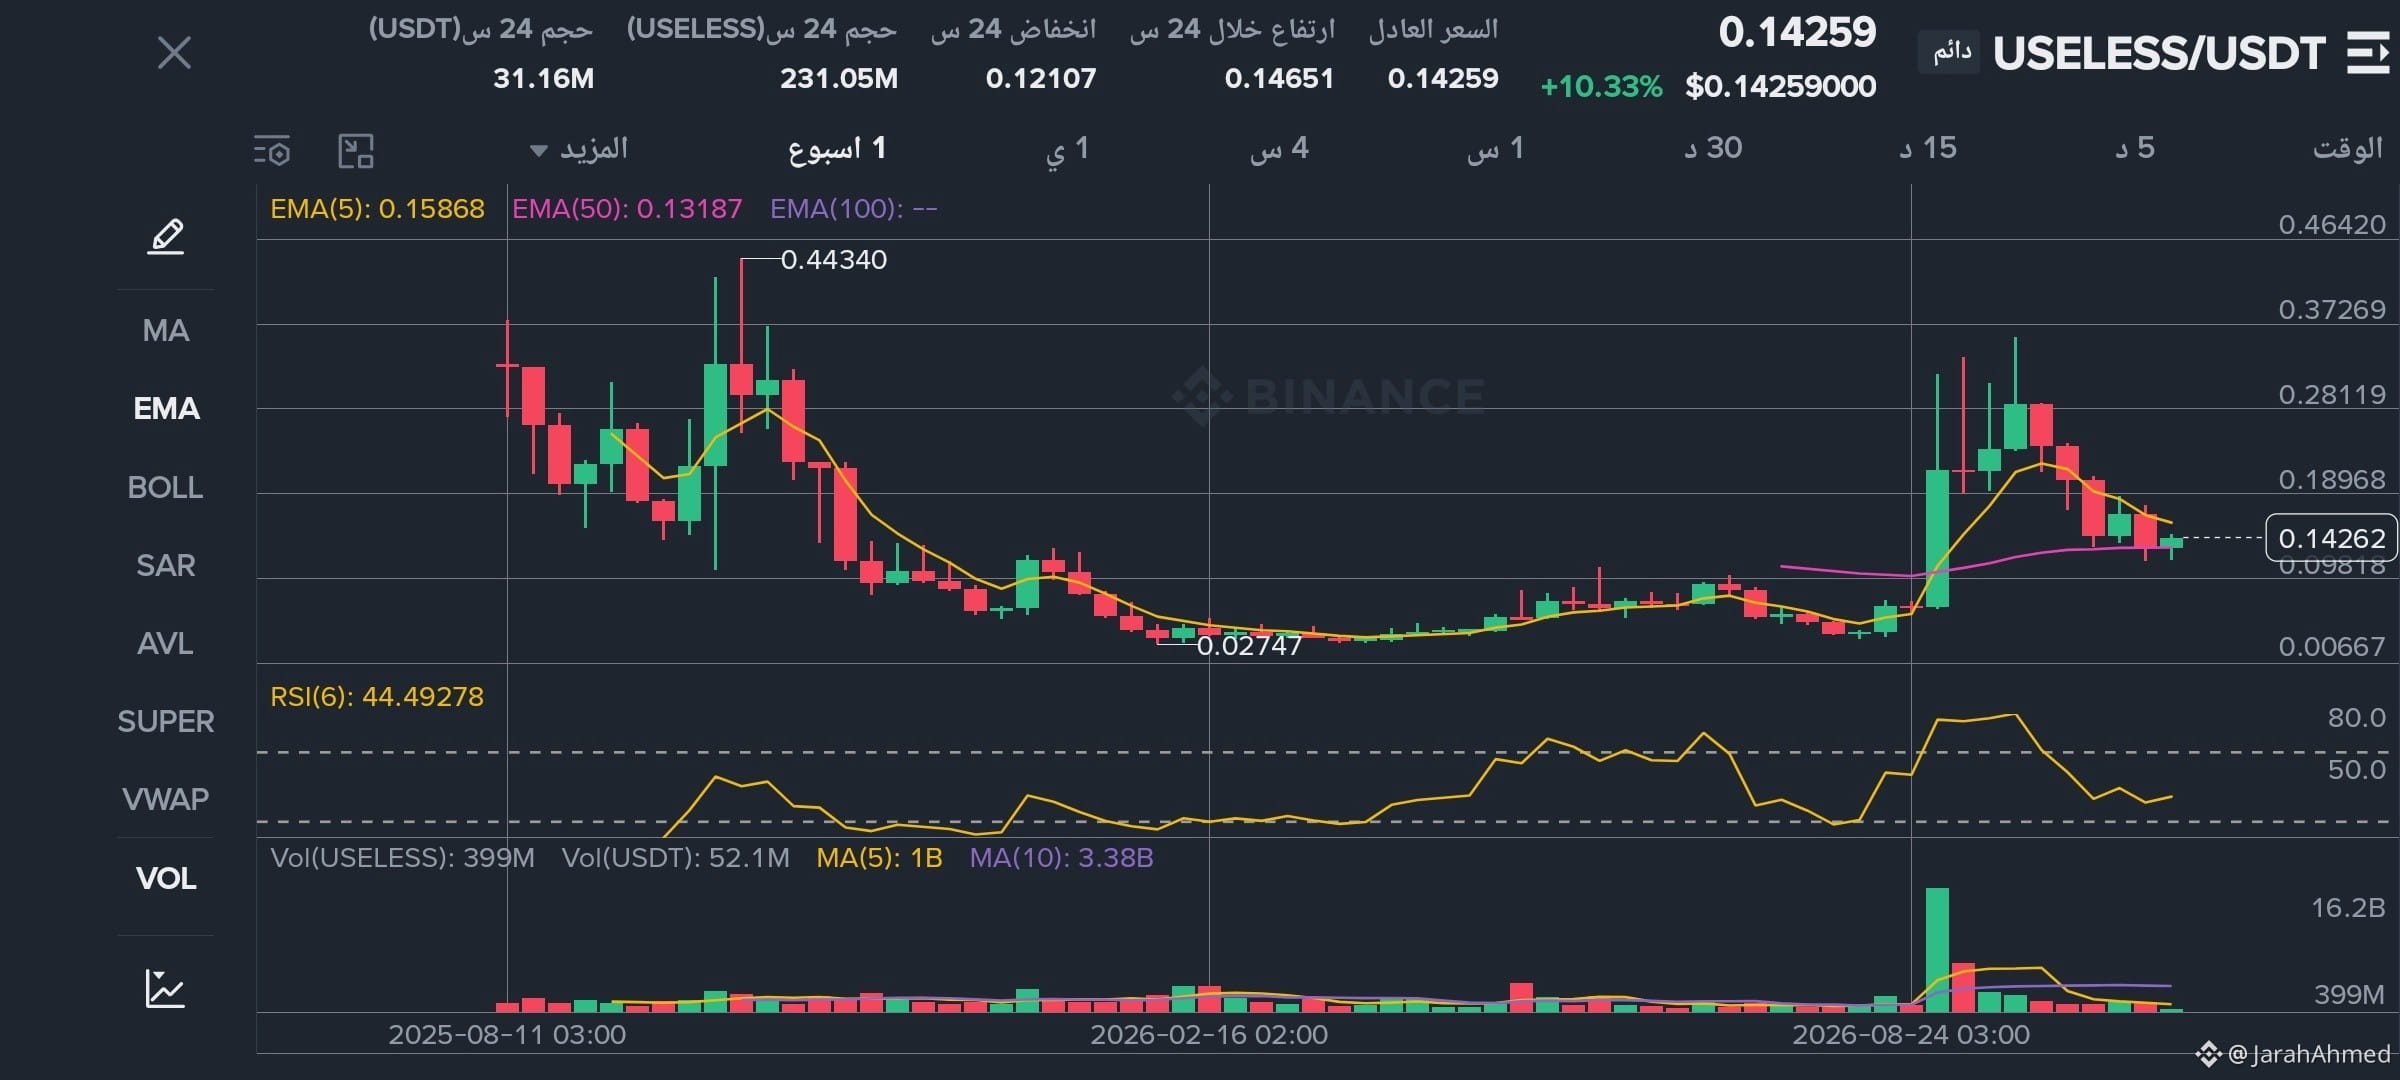
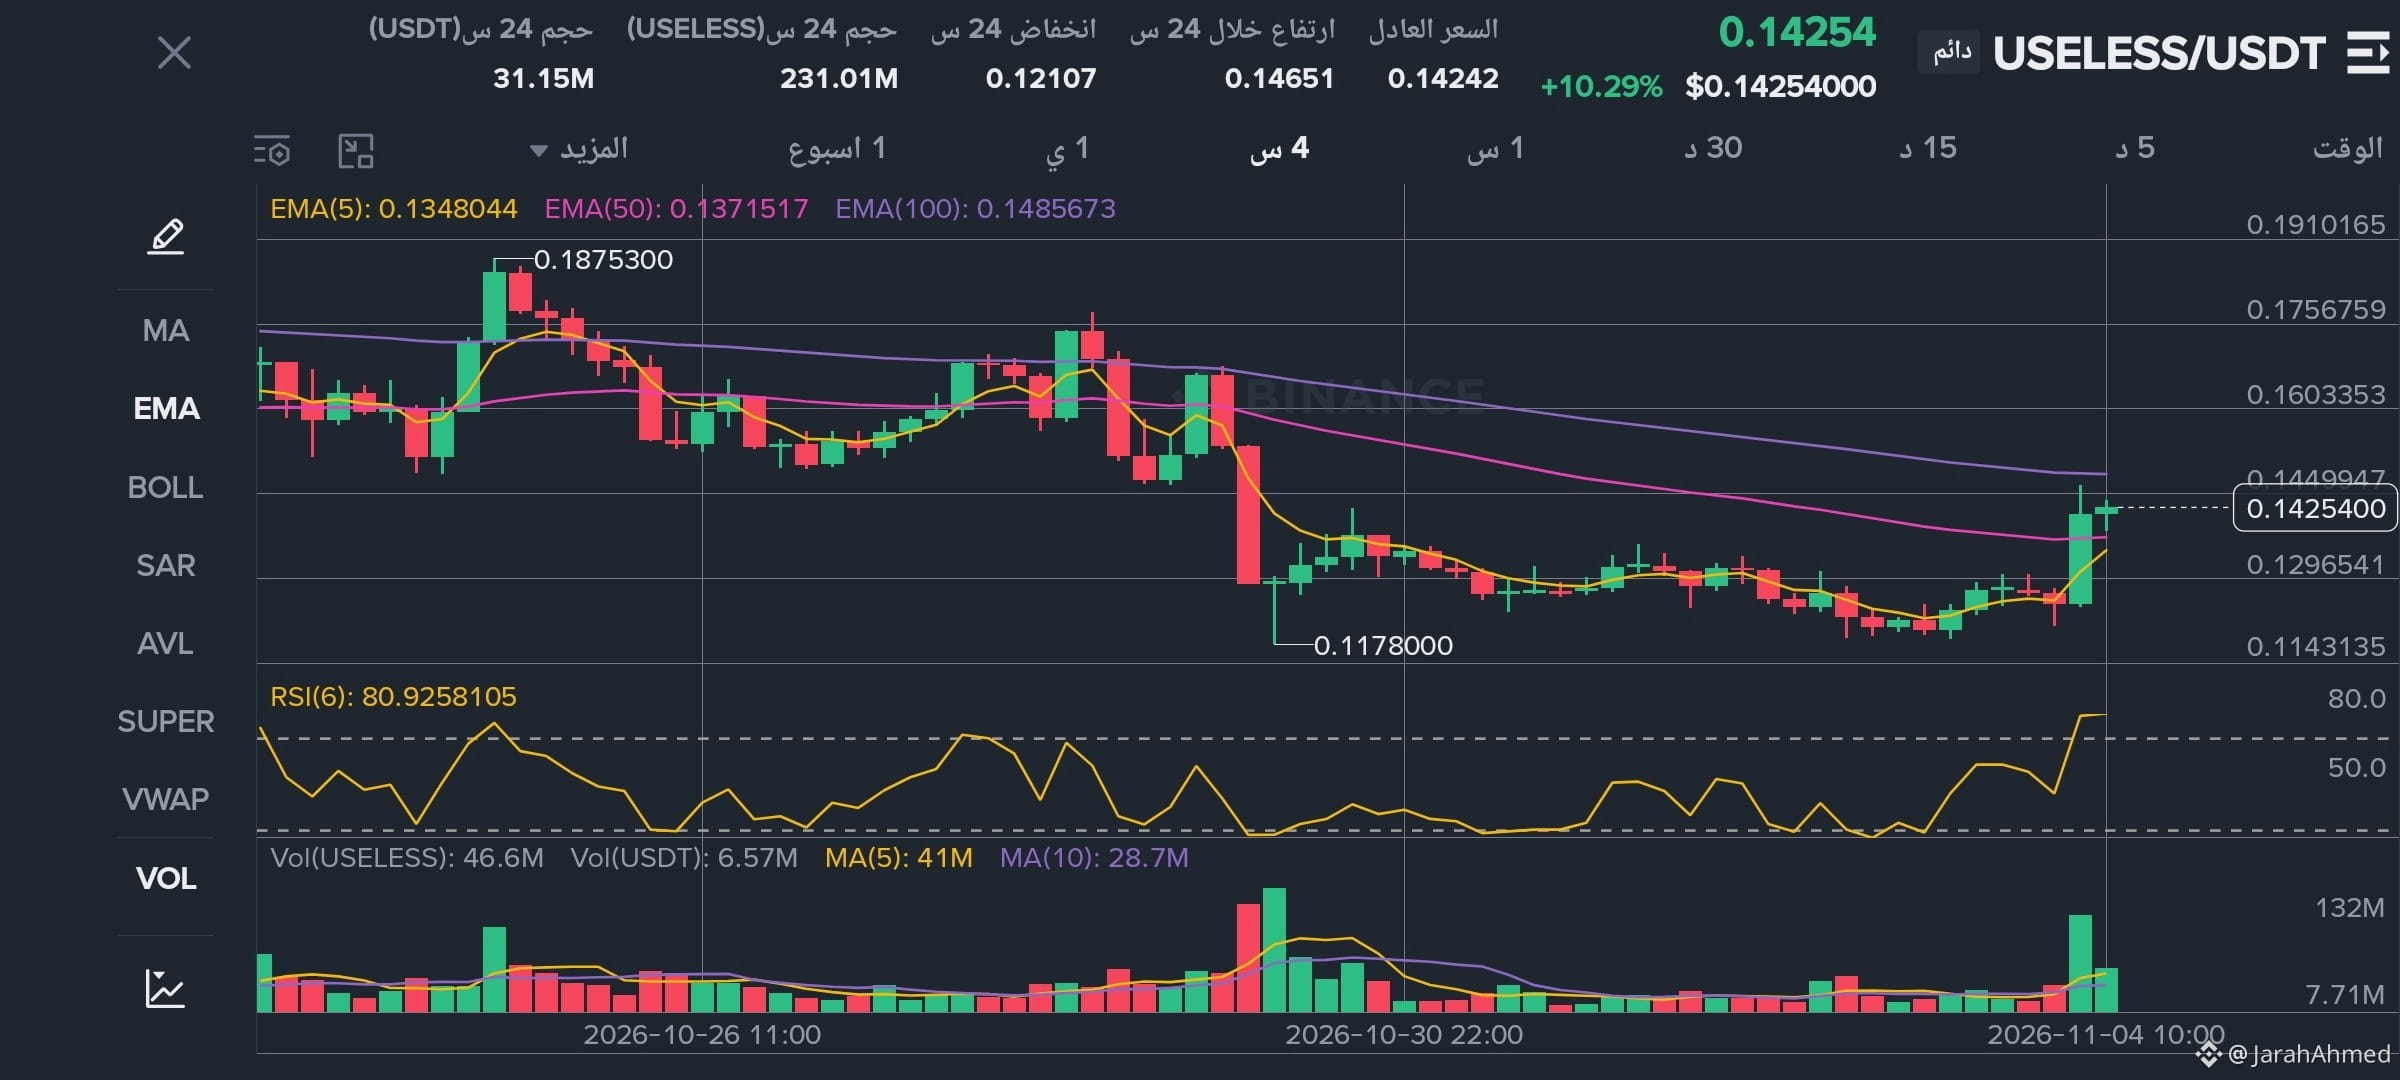
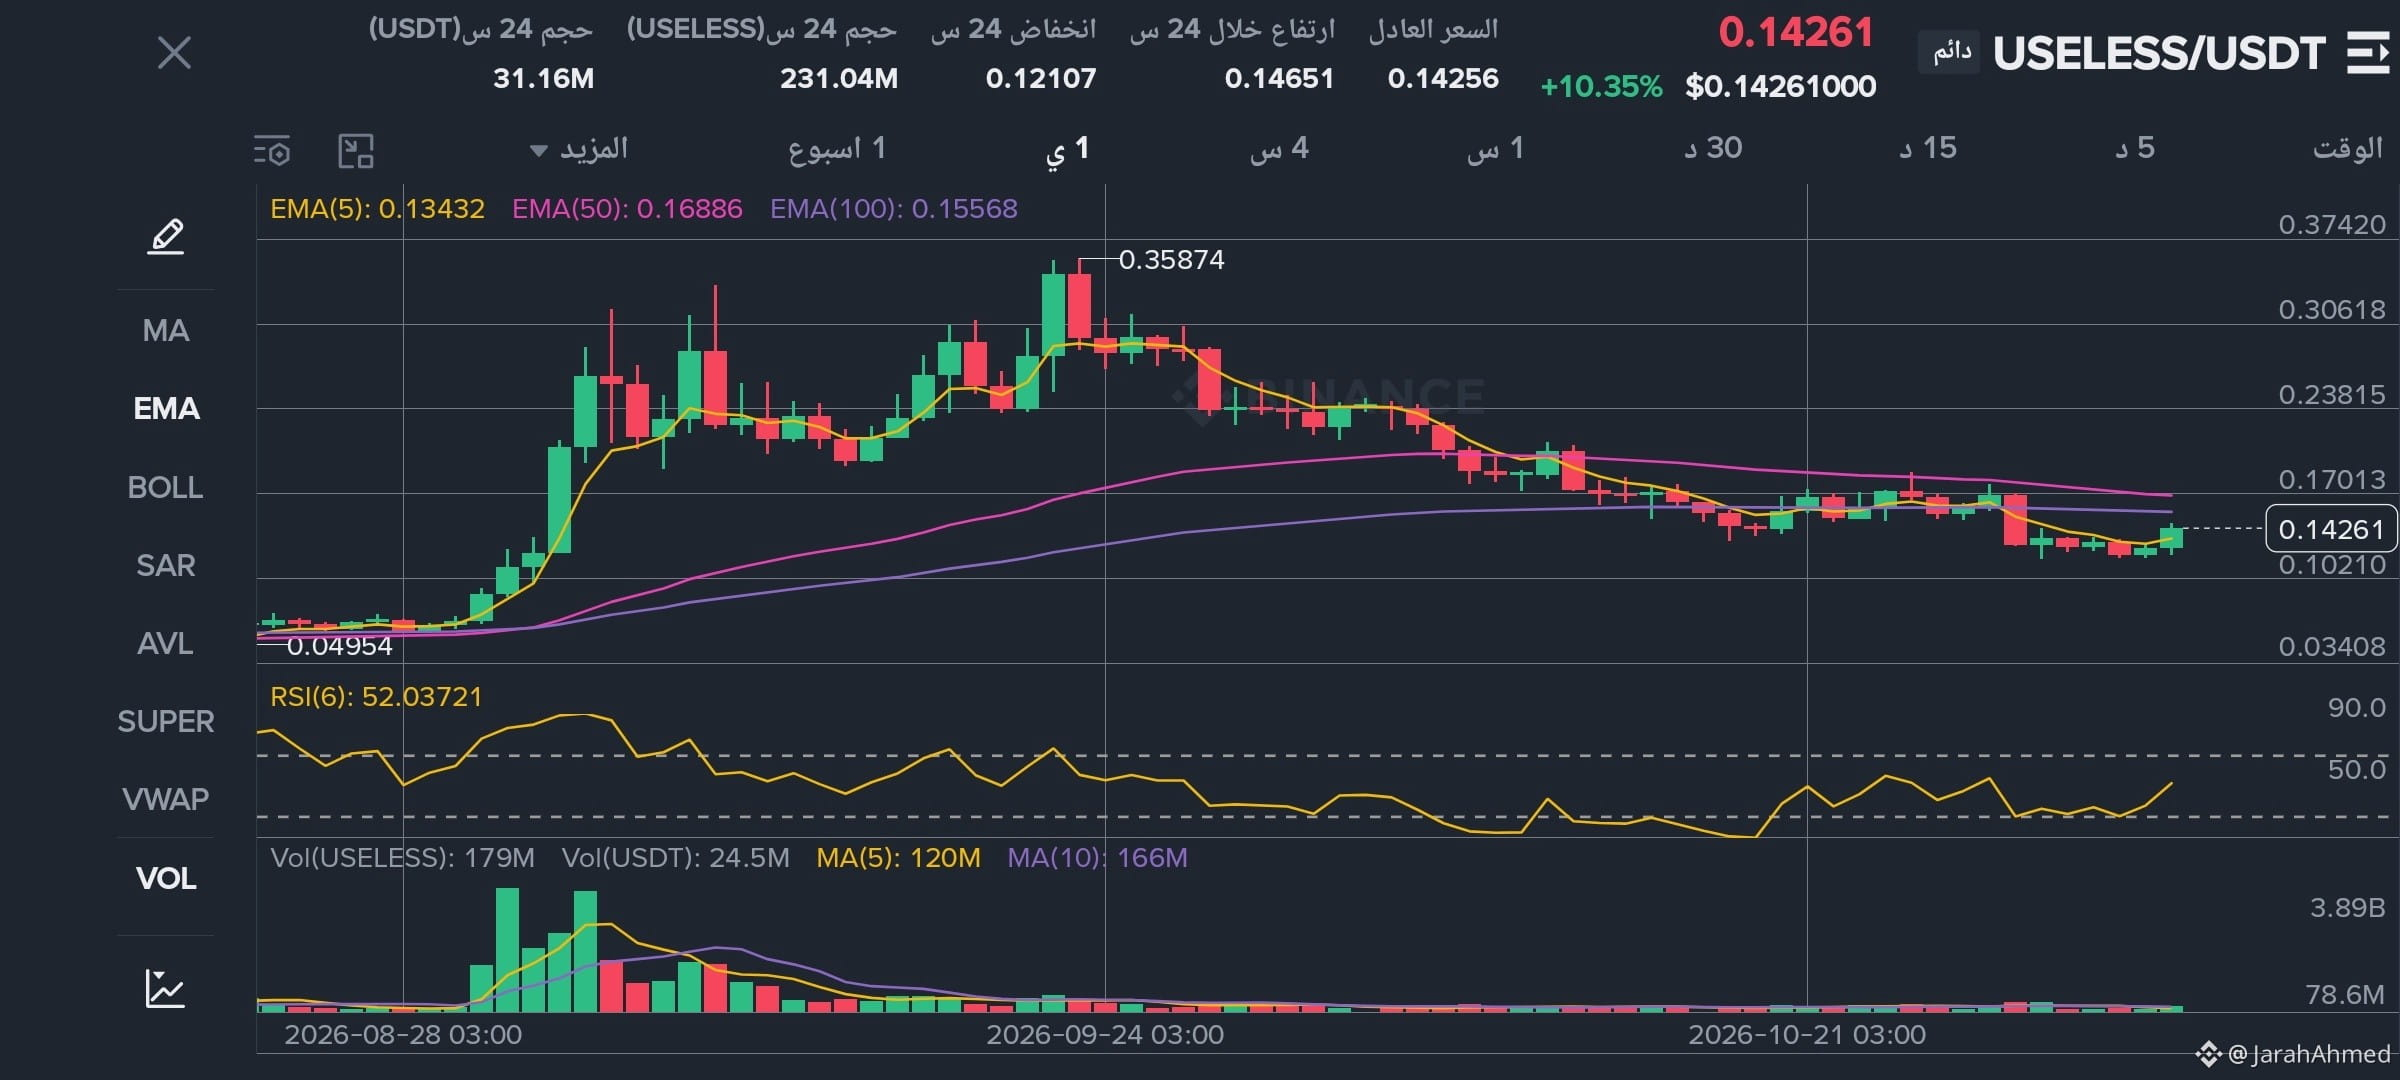
$USELESS A ready-made analysis from me—profits are waiting for you 🤑🤑🤑
* 4-hour timeframe: short-term bullish
Patterns and candlesticks
* Strong upward momentum accompanied by a notable increase in trading volume.
* A correction following the upward move.
* A strong bullish candlestick on the 4-hour timeframe.
Liquidity and target zones
* Liquidity above the previous accumulation zone was targeted.
* High trading volume appeared during the breakout.
* The 0.1465 zone represents significant resistance.
* Liquidity below 0.1340 is worth monitoring.
Best entry scenario
Scenario 1: Conditional buy (Long)
Wait for the price to correct to the 0.1340–0.1370 support zone and for confirmation of a rebound.
Suggested trade levels
Entry zone
0.1348–0.1372
Stop loss
0.1290
First target TP1
0.1465
$USELESS A ready-made analysis from me—profits are waiting for you 🤑🤑🤑
* 4-hour timeframe: short-term bullish
Patterns and candlesticks
* Strong upward momentum accompanied by a notable increase in trading volume.
* A correction following the upward move.
* A strong bullish candlestick on the 4-hour timeframe.
Liquidity and target zones
* Liquidity above the previous accumulation zone was targeted.
* High trading volume appeared during the breakout.
* The 0.1465 zone represents significant resistance.
* Liquidity below 0.1340 is worth monitoring.
Best entry scenario
Scenario 1: Conditional buy (Long)
Wait for the price to correct to the 0.1340–0.1370 support zone and for confirmation of a rebound.
Suggested trade levels
Entry zone
0.1348–0.1372
Stop loss
0.1290
First target TP1
0.1465
* 4-hour timeframe: short-term bullish
Patterns and candlesticks
* Strong upward momentum accompanied by a notable increase in trading volume.
* A correction following the upward move.
* A strong bullish candlestick on the 4-hour timeframe.
Liquidity and target zones
* Liquidity above the previous accumulation zone was targeted.
* High trading volume appeared during the breakout.
* The 0.1465 zone represents significant resistance.
* Liquidity below 0.1340 is worth monitoring.
Best entry scenario
Scenario 1: Conditional buy (Long)
Wait for the price to correct to the 0.1340–0.1370 support zone and for confirmation of a rebound.
Suggested trade levels
Entry zone
0.1348–0.1372
Stop loss
0.1290
First target TP1
0.1465
90
·
--
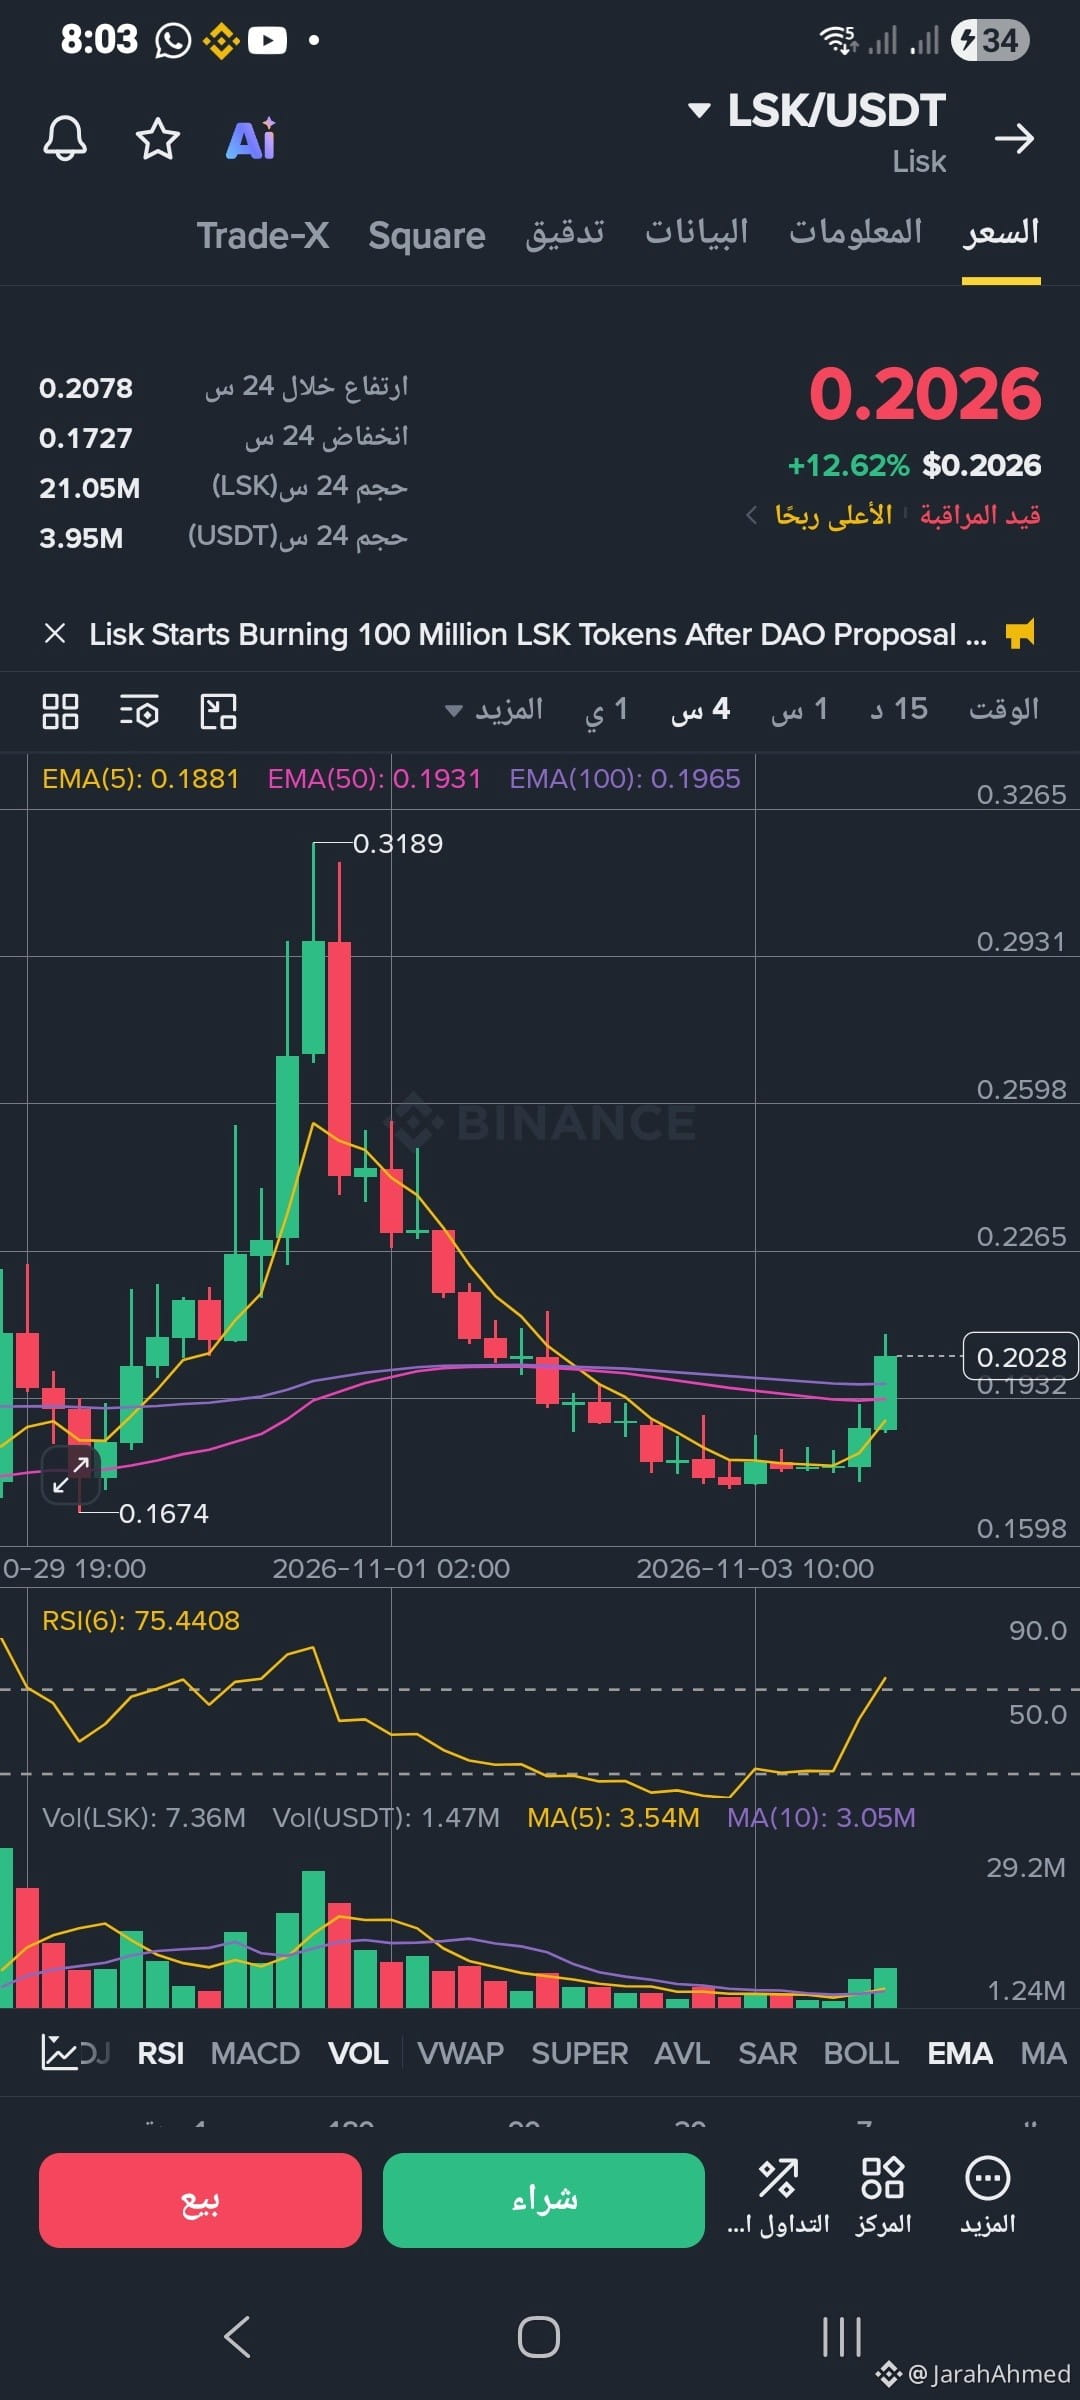
💰 Our goal is not to chase every rising coin, but to understand the market and look for well-considered opportunities $LSK
💰 Our goal is not to chase every rising coin, but to understand the market and look for well-considered opportunities $LSK
189
·
--
.. Move, get started, take risks, and don't forget to wear your seat belt 💸💰💰 Money makes money
$HOT
$XRP
$QI
.. Move, get started, take risks, and don't forget to wear your seat belt 💸💰💰 Money makes money
$HOT
$XRP
$QI
$HOT
$XRP
$QI

6
·
--
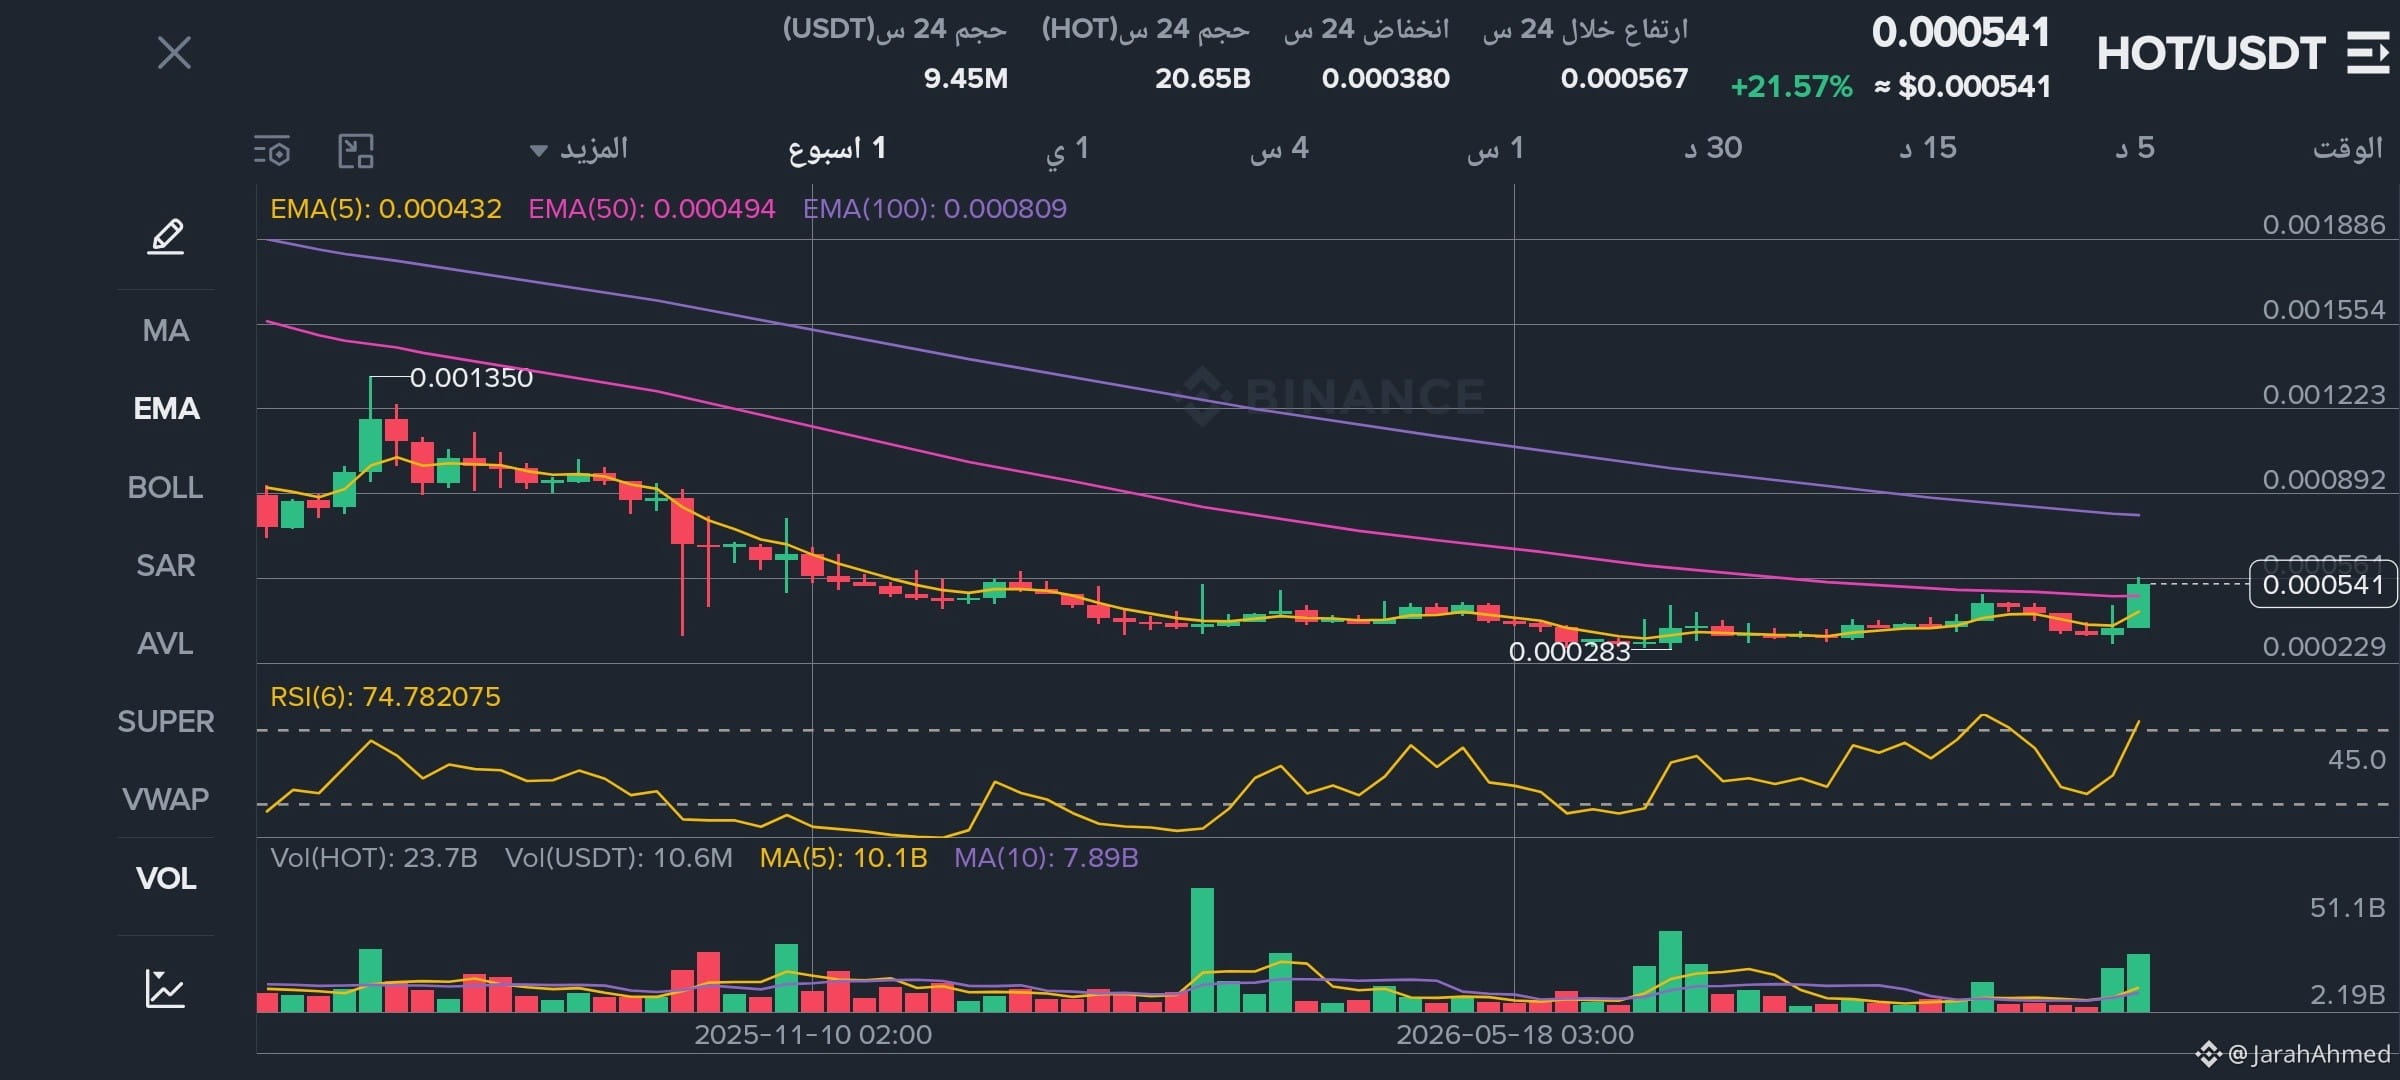
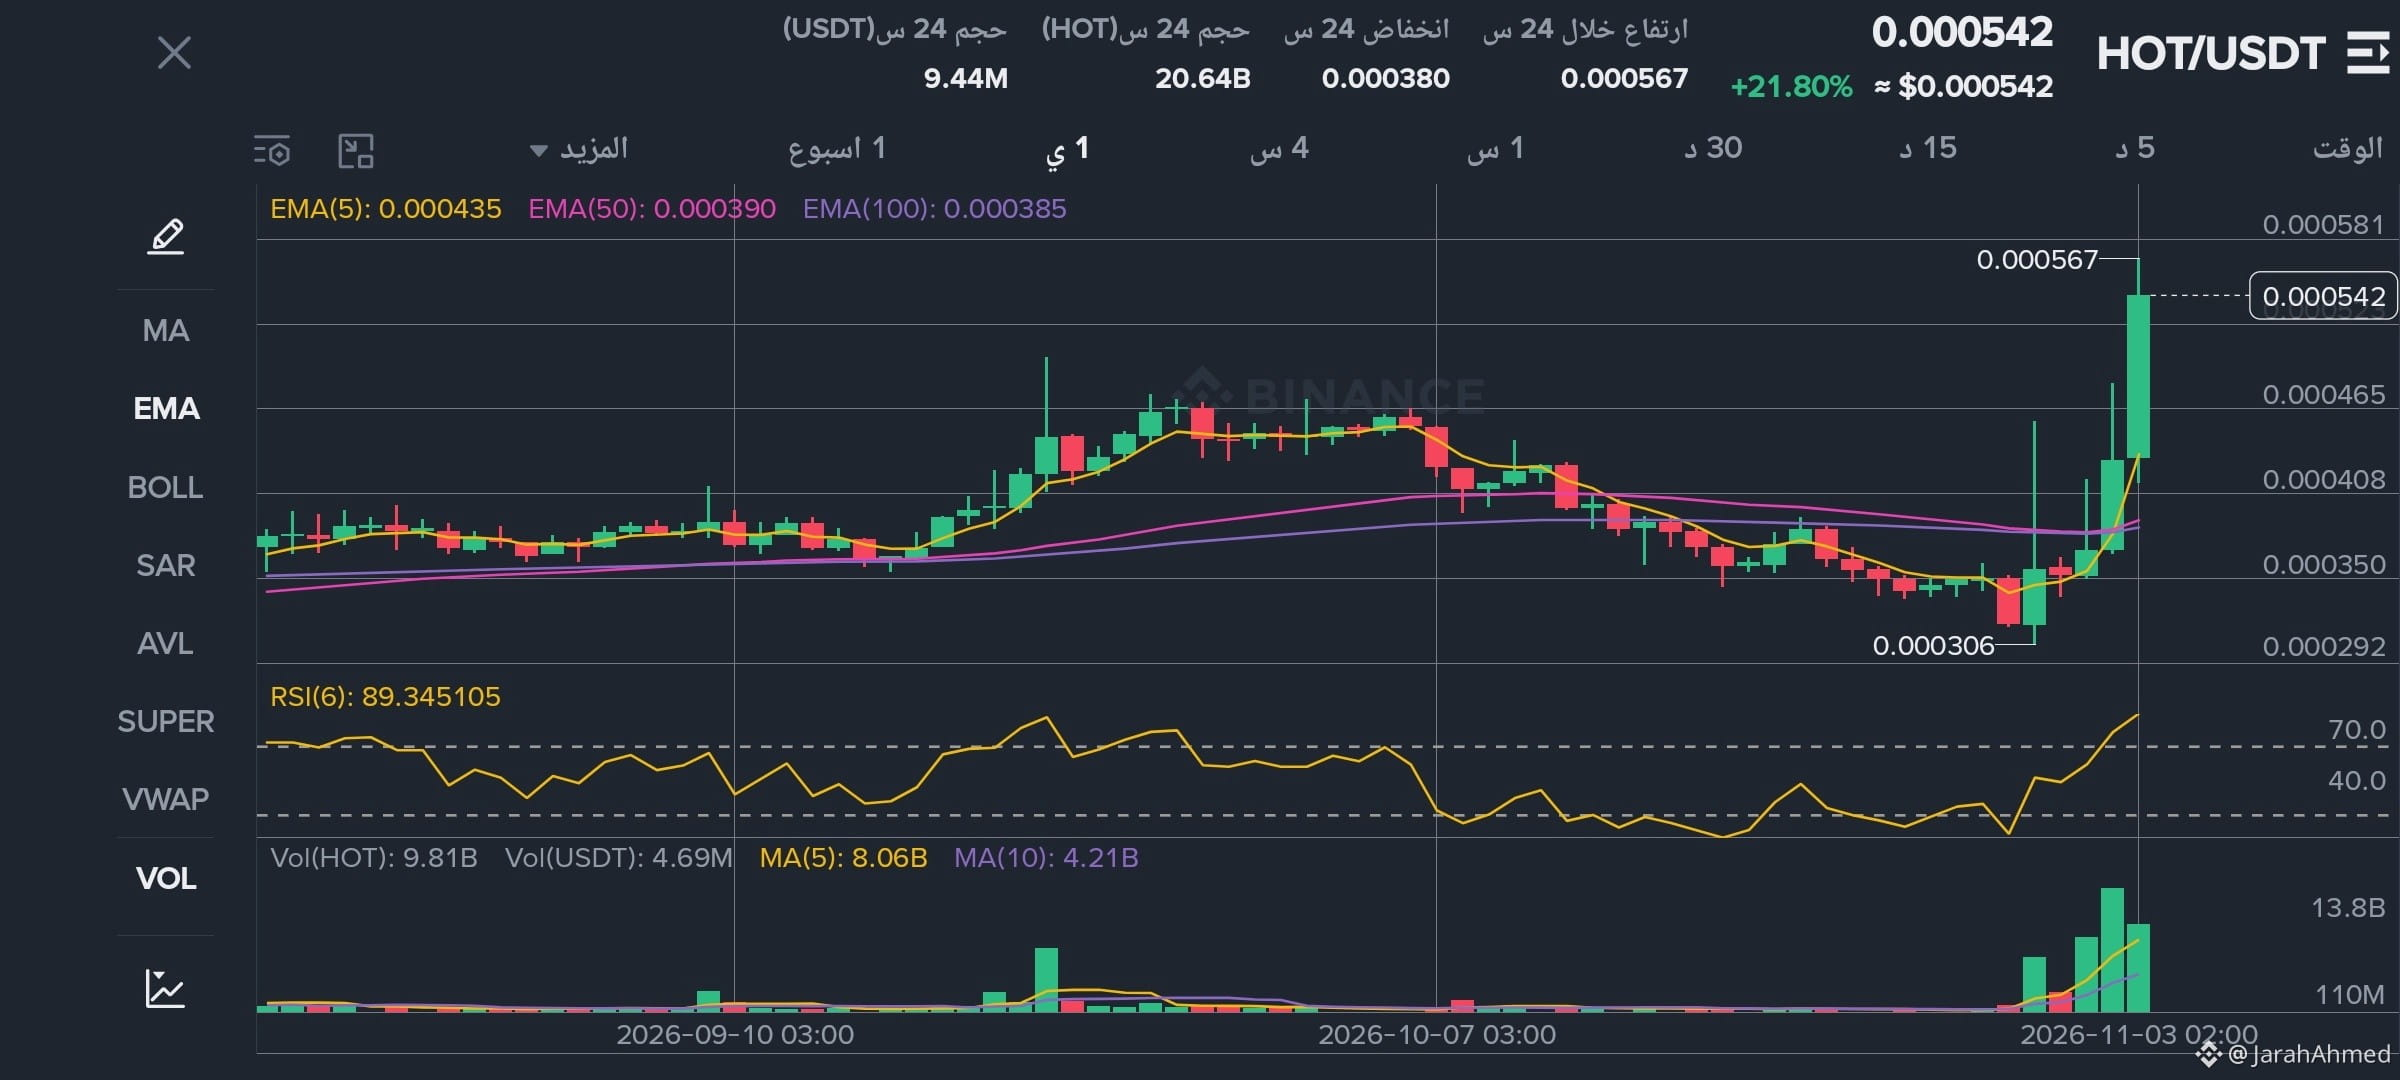
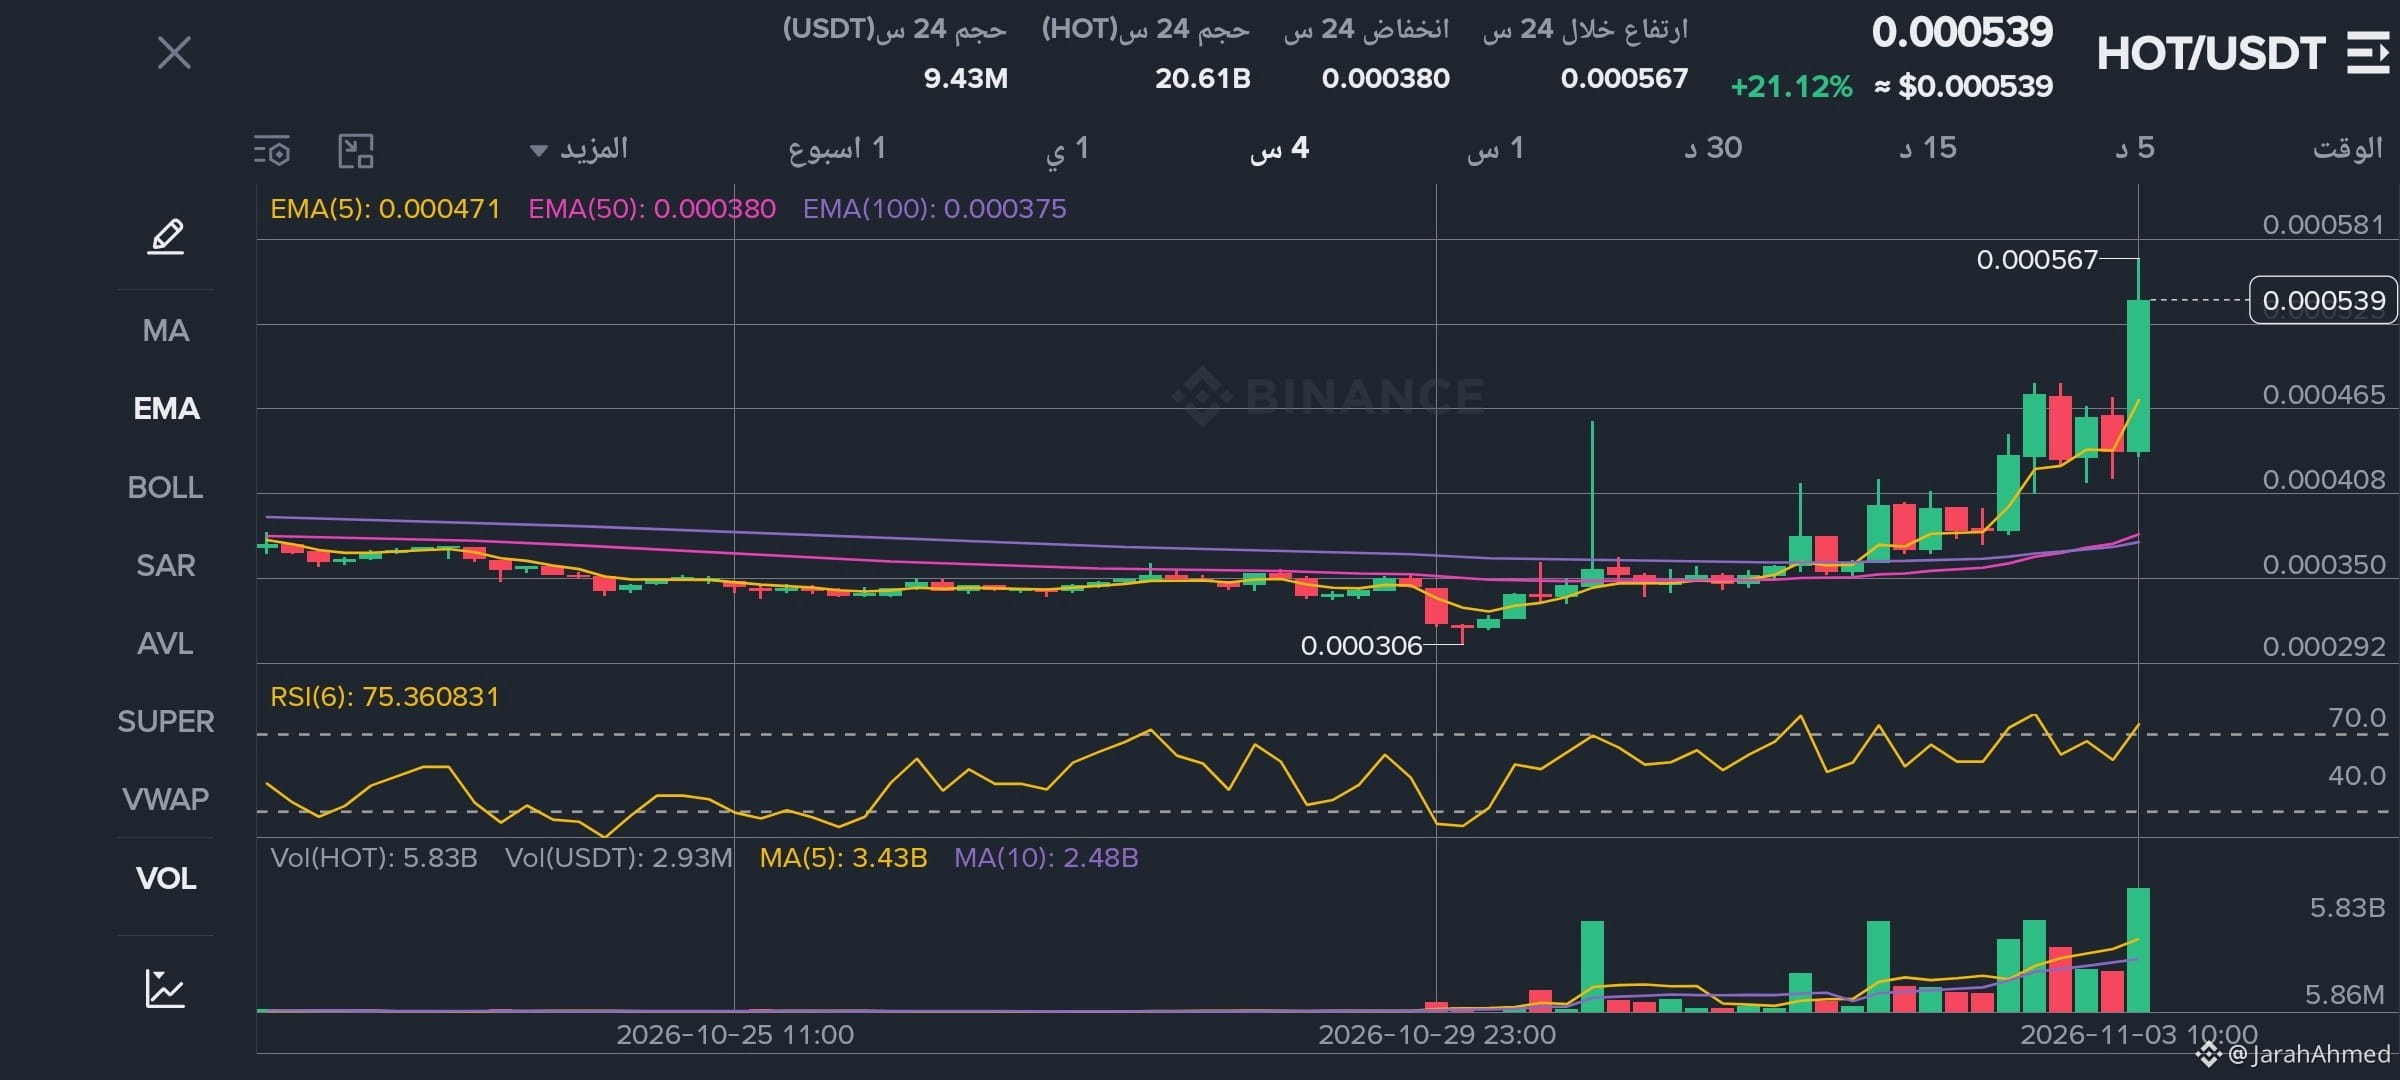
$HOT 💰 Price patterns and candlesticks
Bullish breakout from a long-term accumulation zone.
Strong green daily candle.
Impulsive 4-hour candle with a notable increase in volume.
No completed reversal pattern can be confirmed.
💸 Liquidity and target zones
Liquidity above previous highs was targeted.
Breakout above the 0.000465 zone.
The 0.000567 high represents an important test zone.
The increase in volume confirms strong buying activity.
💸 Best entry scenario
Wait for a retest of the breakout zone rather than chasing the bullish candle, because the RSI is very high.
$HOT
{future}(HOTUSDT)
🎯 Entry point
- Watchlist entry: 0.000465 – 0.000490.
🎯 Stop loss
- 0.000400 (below the 0.000408 support zone).
🎯 First target
- 0.000567.
$HOT 💰 Price patterns and candlesticks
Bullish breakout from a long-term accumulation zone.
Strong green daily candle.
Impulsive 4-hour candle with a notable increase in volume.
No completed reversal pattern can be confirmed.
💸 Liquidity and target zones
Liquidity above previous highs was targeted.
Breakout above the 0.000465 zone.
The 0.000567 high represents an important test zone.
The increase in volume confirms strong buying activity.
💸 Best entry scenario
Wait for a retest of the breakout zone rather than chasing the bullish candle, because the RSI is very high.
$HOT
🎯 Entry point
- Watchlist entry: 0.000465 – 0.000490.
🎯 Stop loss
- 0.000400 (below the 0.000408 support zone).
🎯 First target
- 0.000567.
Bullish breakout from a long-term accumulation zone.
Strong green daily candle.
Impulsive 4-hour candle with a notable increase in volume.
No completed reversal pattern can be confirmed.
💸 Liquidity and target zones
Liquidity above previous highs was targeted.
Breakout above the 0.000465 zone.
The 0.000567 high represents an important test zone.
The increase in volume confirms strong buying activity.
💸 Best entry scenario
Wait for a retest of the breakout zone rather than chasing the bullish candle, because the RSI is very high.
$HOT
🎯 Entry point
- Watchlist entry: 0.000465 – 0.000490.
🎯 Stop loss
- 0.000400 (below the 0.000408 support zone).
🎯 First target
- 0.000567.
125
·
--
$XRP Real analysis does not merely seek confirmation of expectations; it also prepares for the possibility that the expectation may be wrong.
$XRP Real analysis does not merely seek confirmation of expectations; it also prepares for the possibility that the expectation may be wrong.
147
·
--
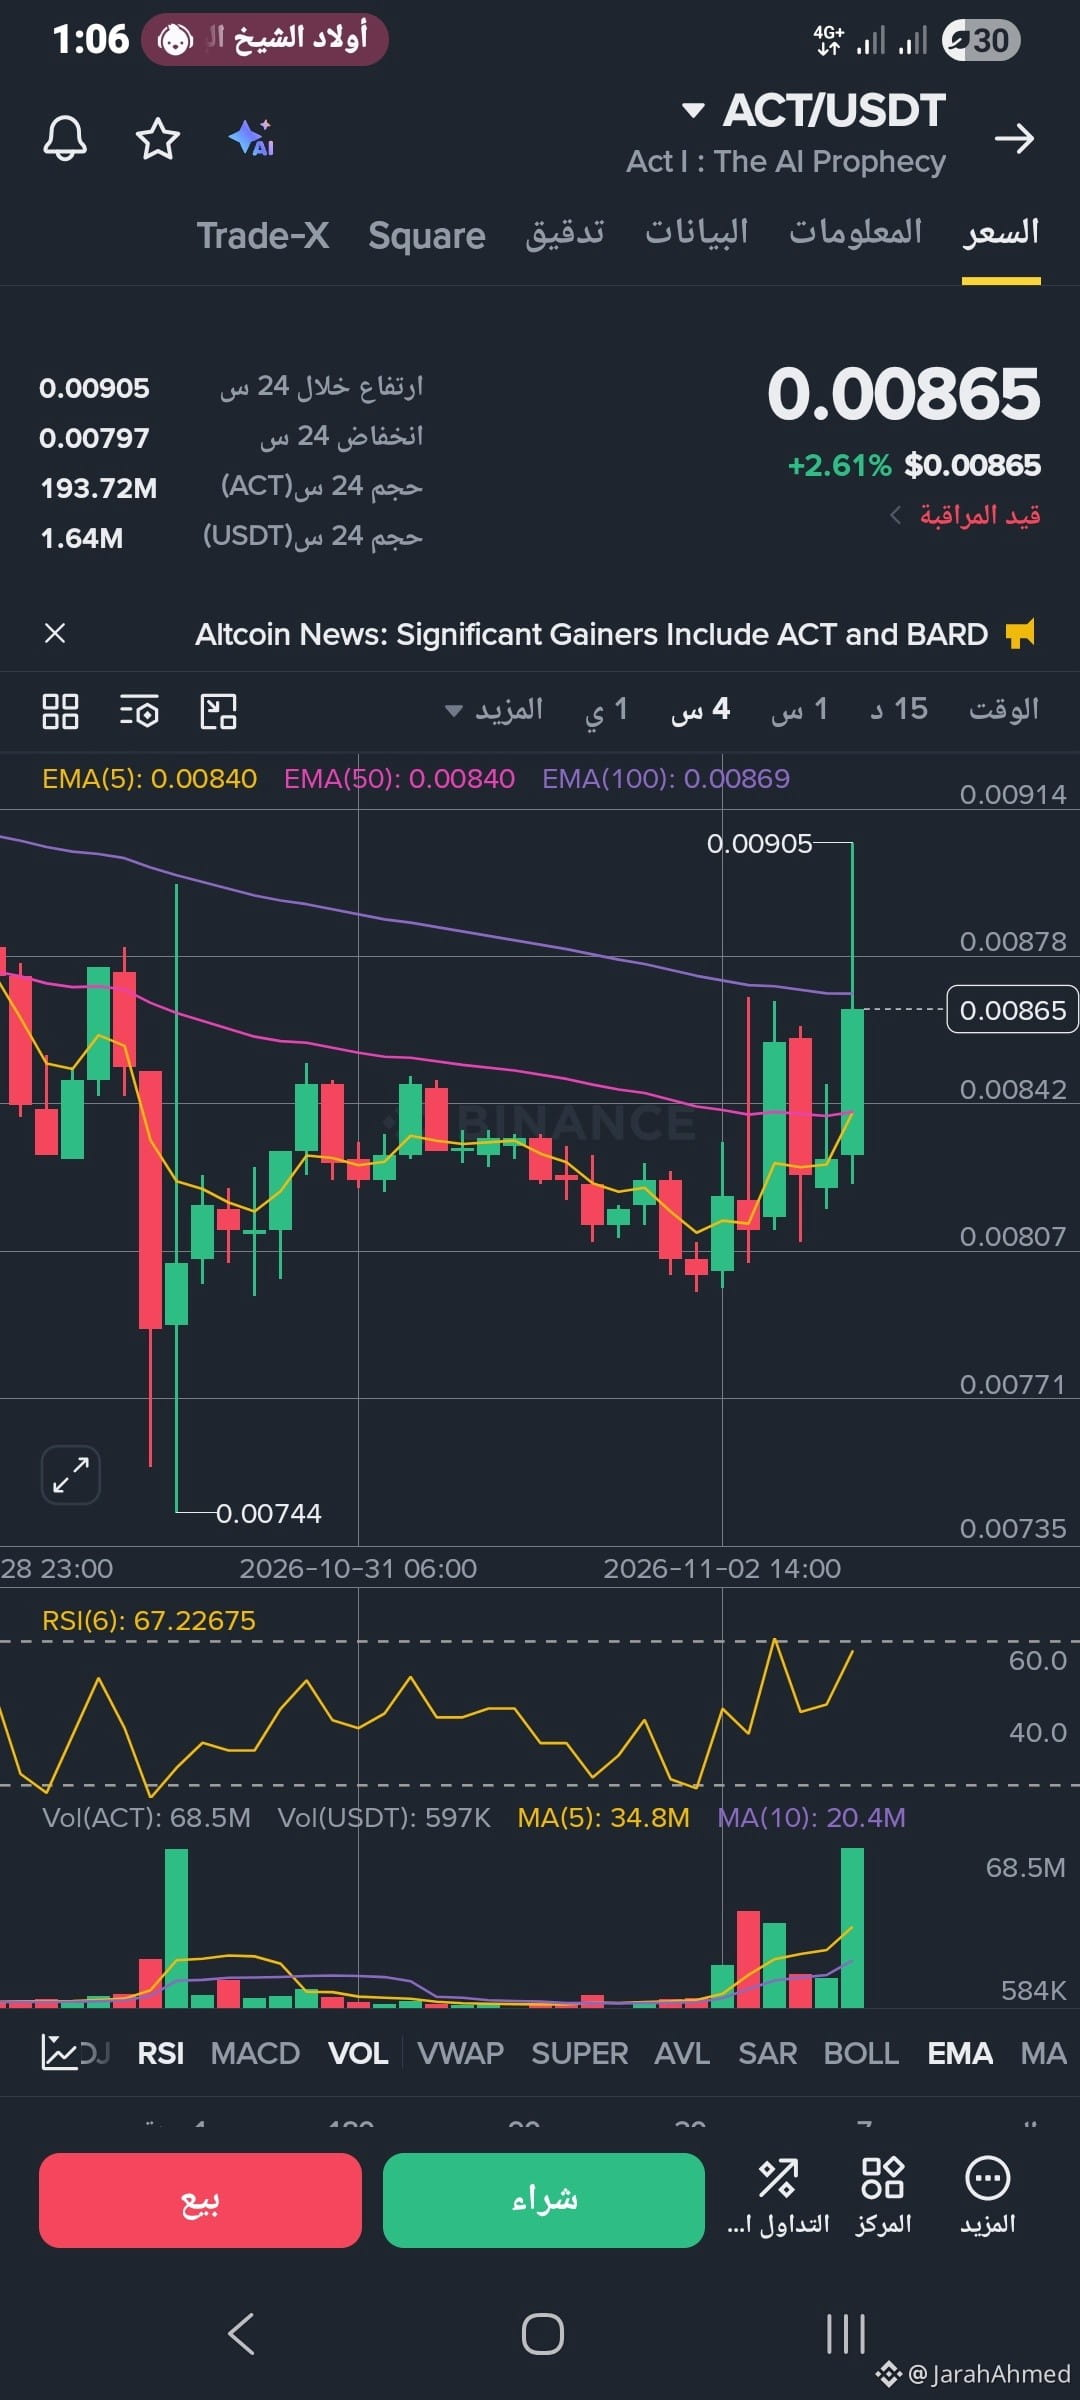
$ACT 💰 Our goal is not to chase every rising coin, but to understand the market and look for well-researched opportunities
{future}(ACTUSDT)
$ACT 💰 Our goal is not to chase every rising coin, but to understand the market and look for well-researched opportunities
145
·
--
💰 $ERA Our goal is not to chase every rising coin, but to understand the market
$RUNE
{future}(RUNEUSDT)
and look for carefully considered opportunities $BMT
💰 $ERA Our goal is not to chase every rising coin, but to understand the market
$RUNE
and look for carefully considered opportunities $BMT
$RUNE
and look for carefully considered opportunities $BMT
518
·
--
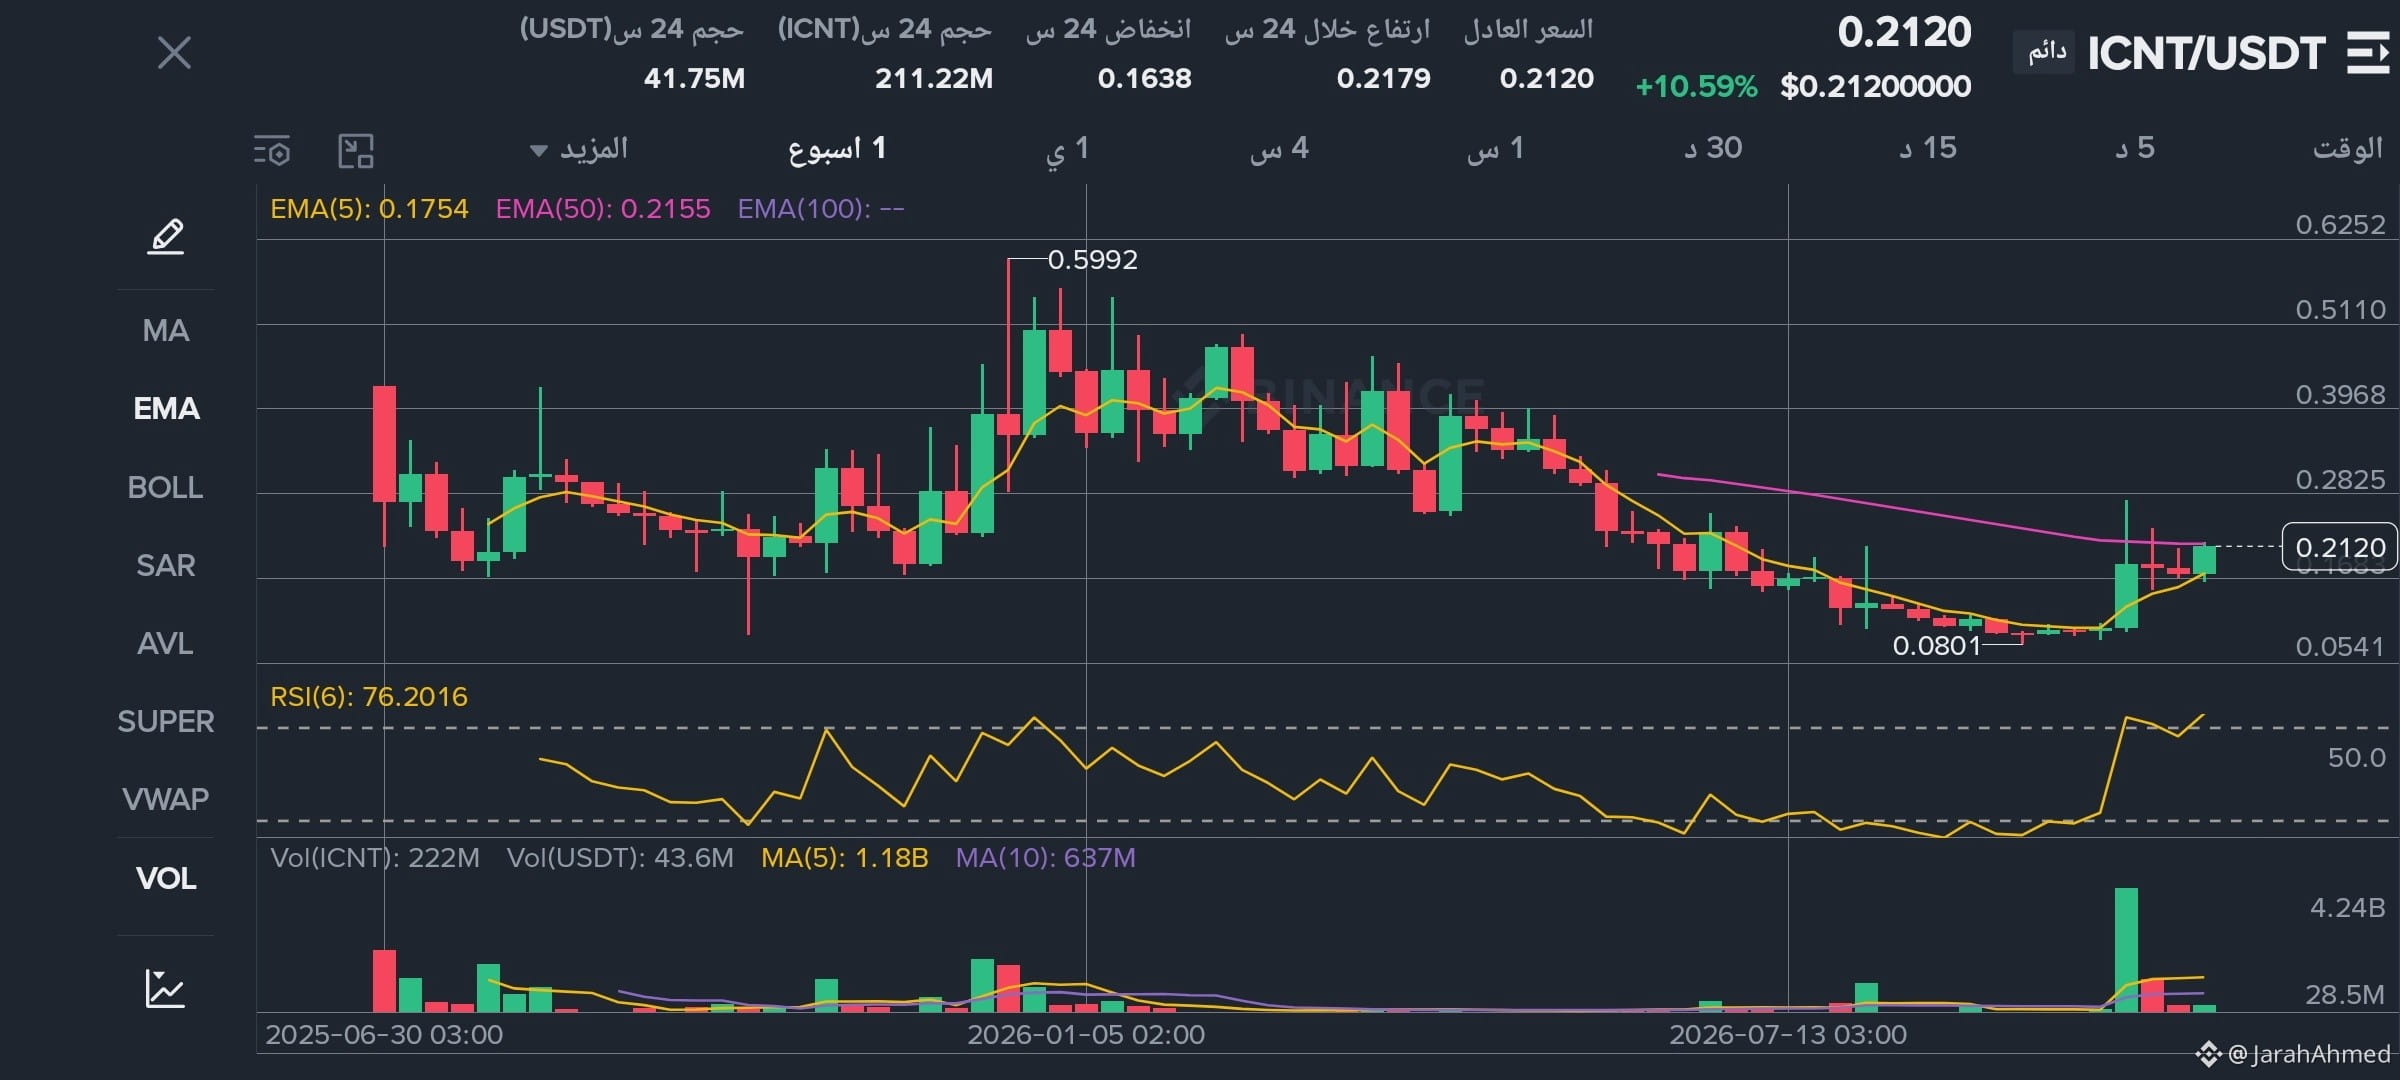
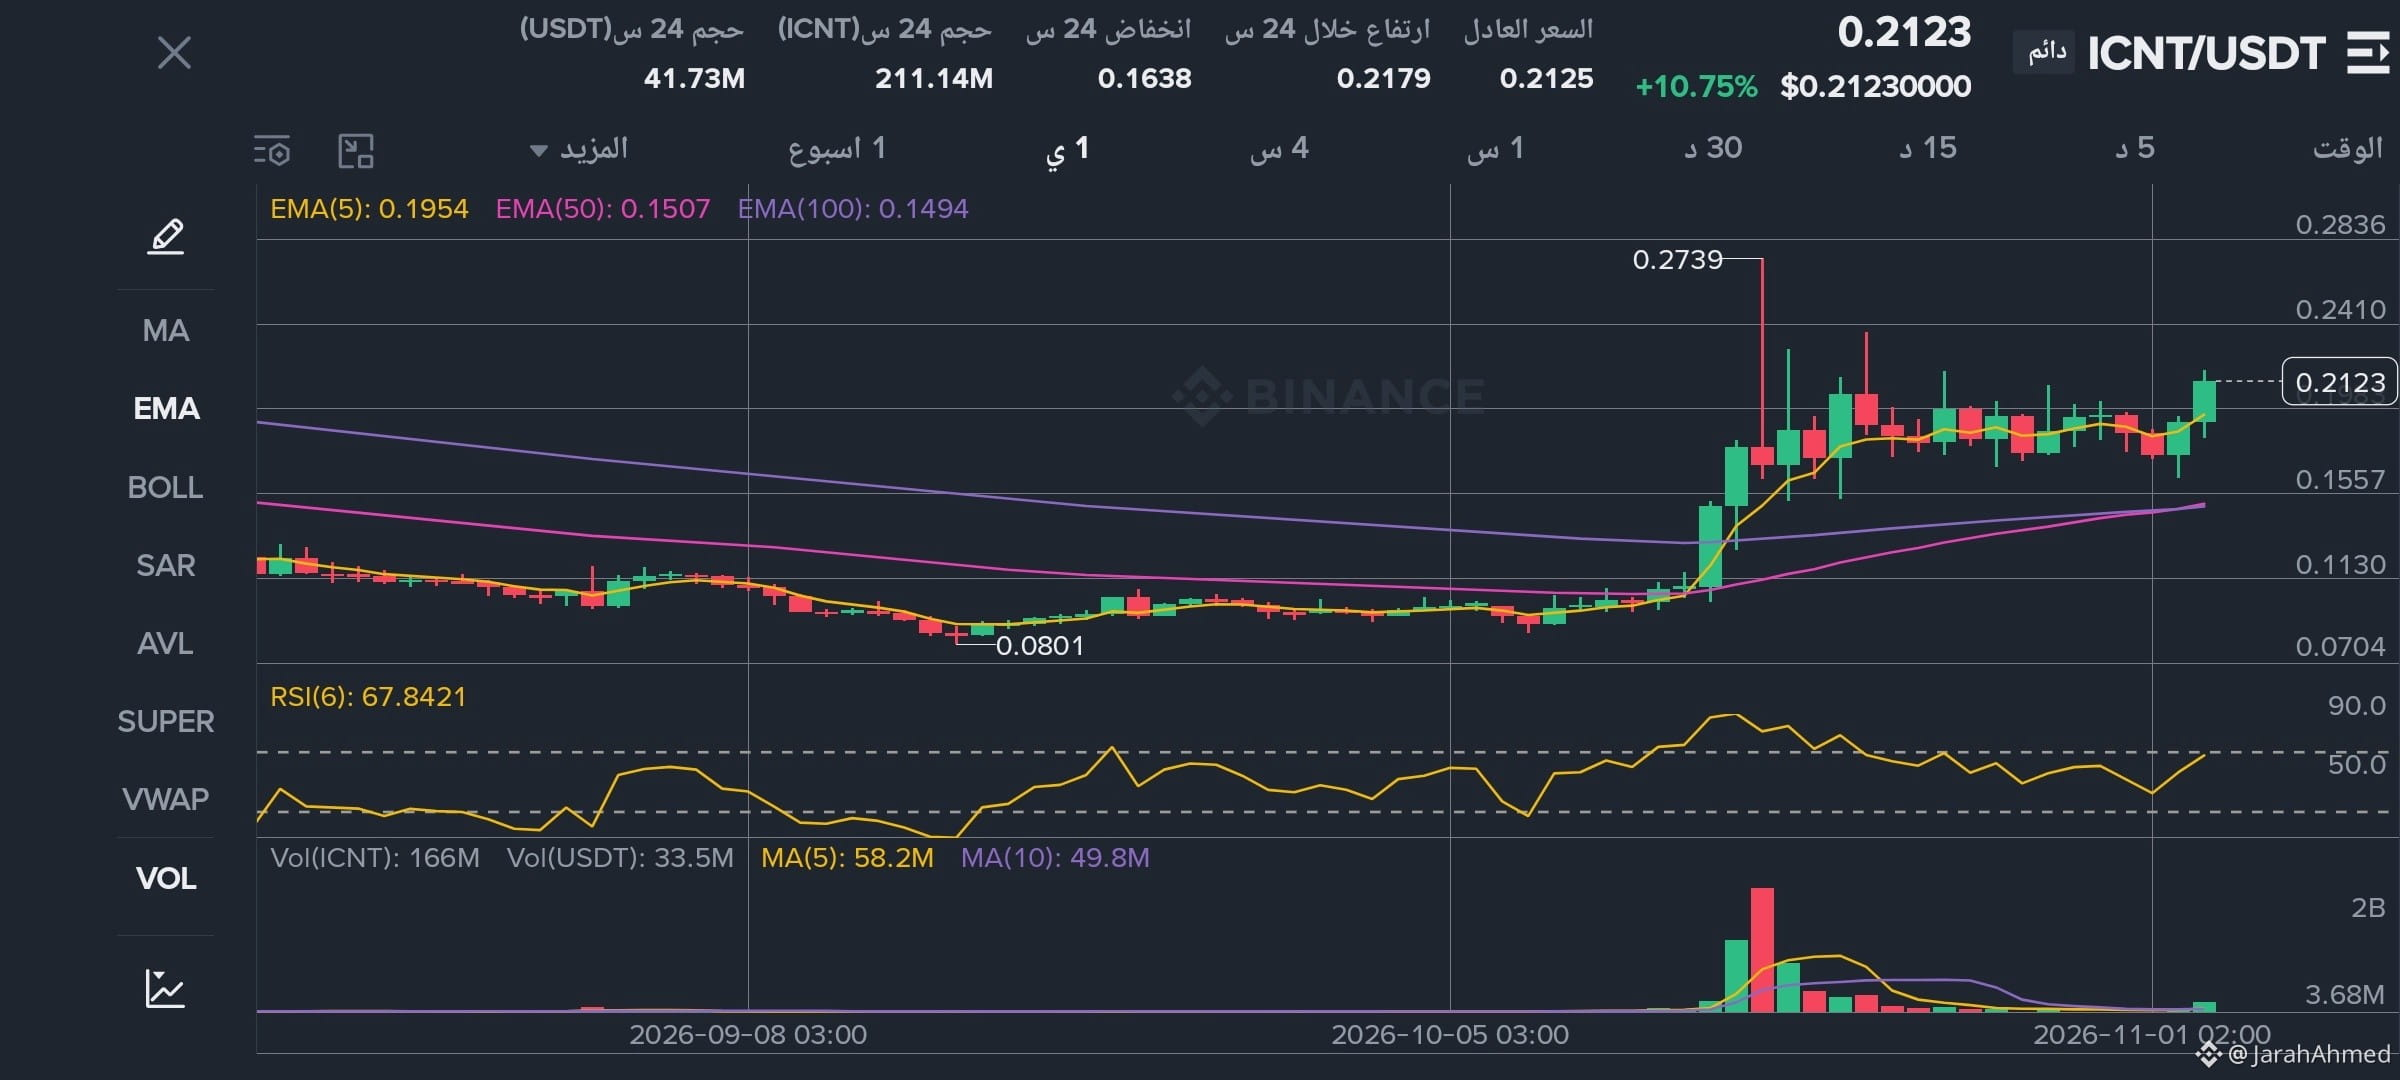
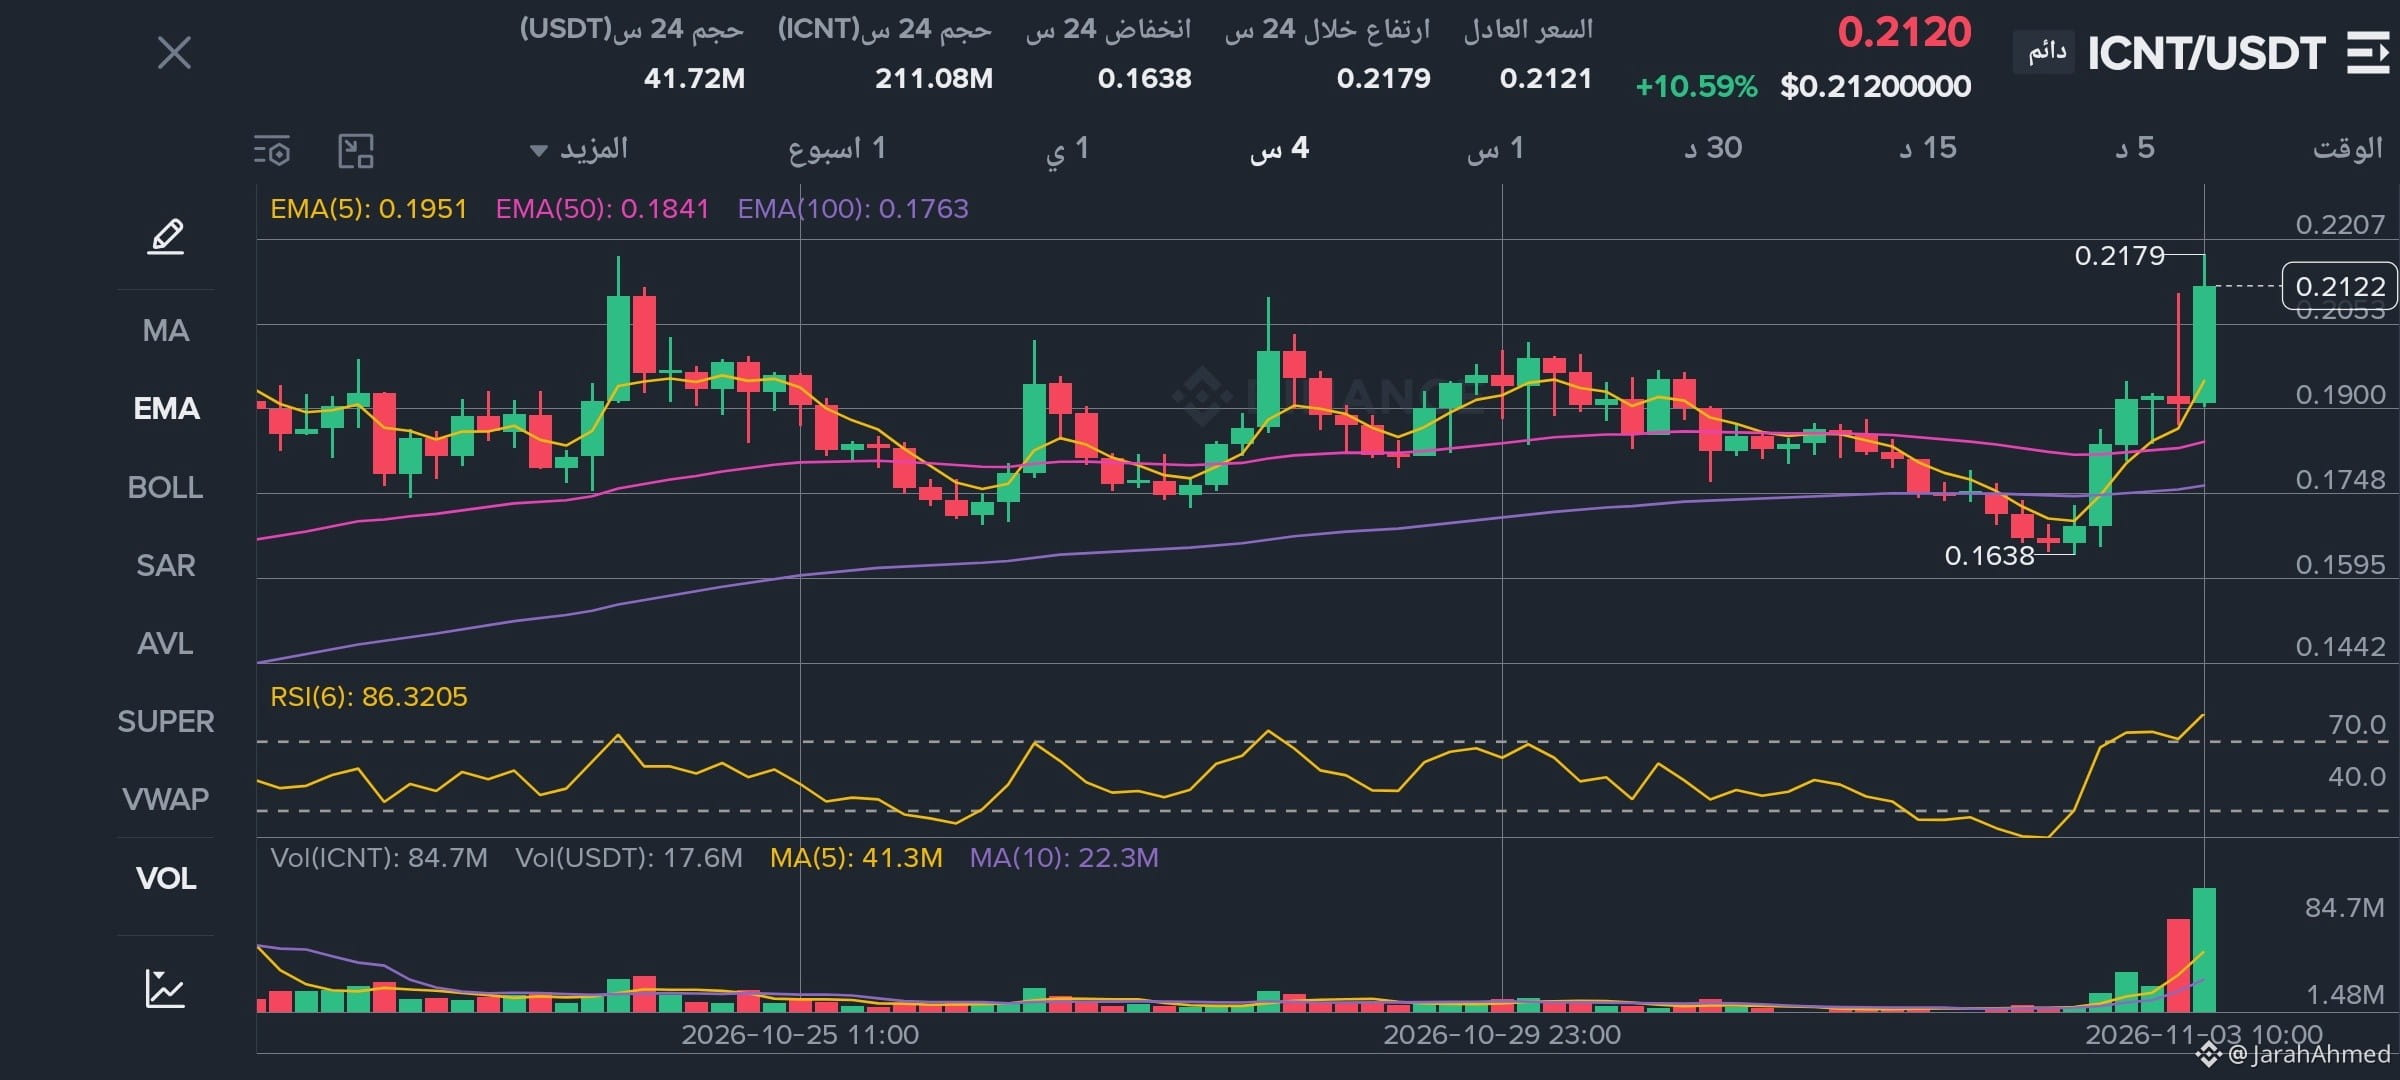
$ICNT 🚀 Opportunities in the cryptocurrency market are endless, but capital needs protection and smart management.
Conditional entry 0.1980🎯
Stop loss 0.1830🔴
First target 0.218💰🤑
$ICNT 🚀 Opportunities in the cryptocurrency market are endless, but capital needs protection and smart management.
Conditional entry 0.1980🎯
Stop loss 0.1830🔴
First target 0.218💰🤑
Conditional entry 0.1980🎯
Stop loss 0.1830🔴
First target 0.218💰🤑
211
·
--
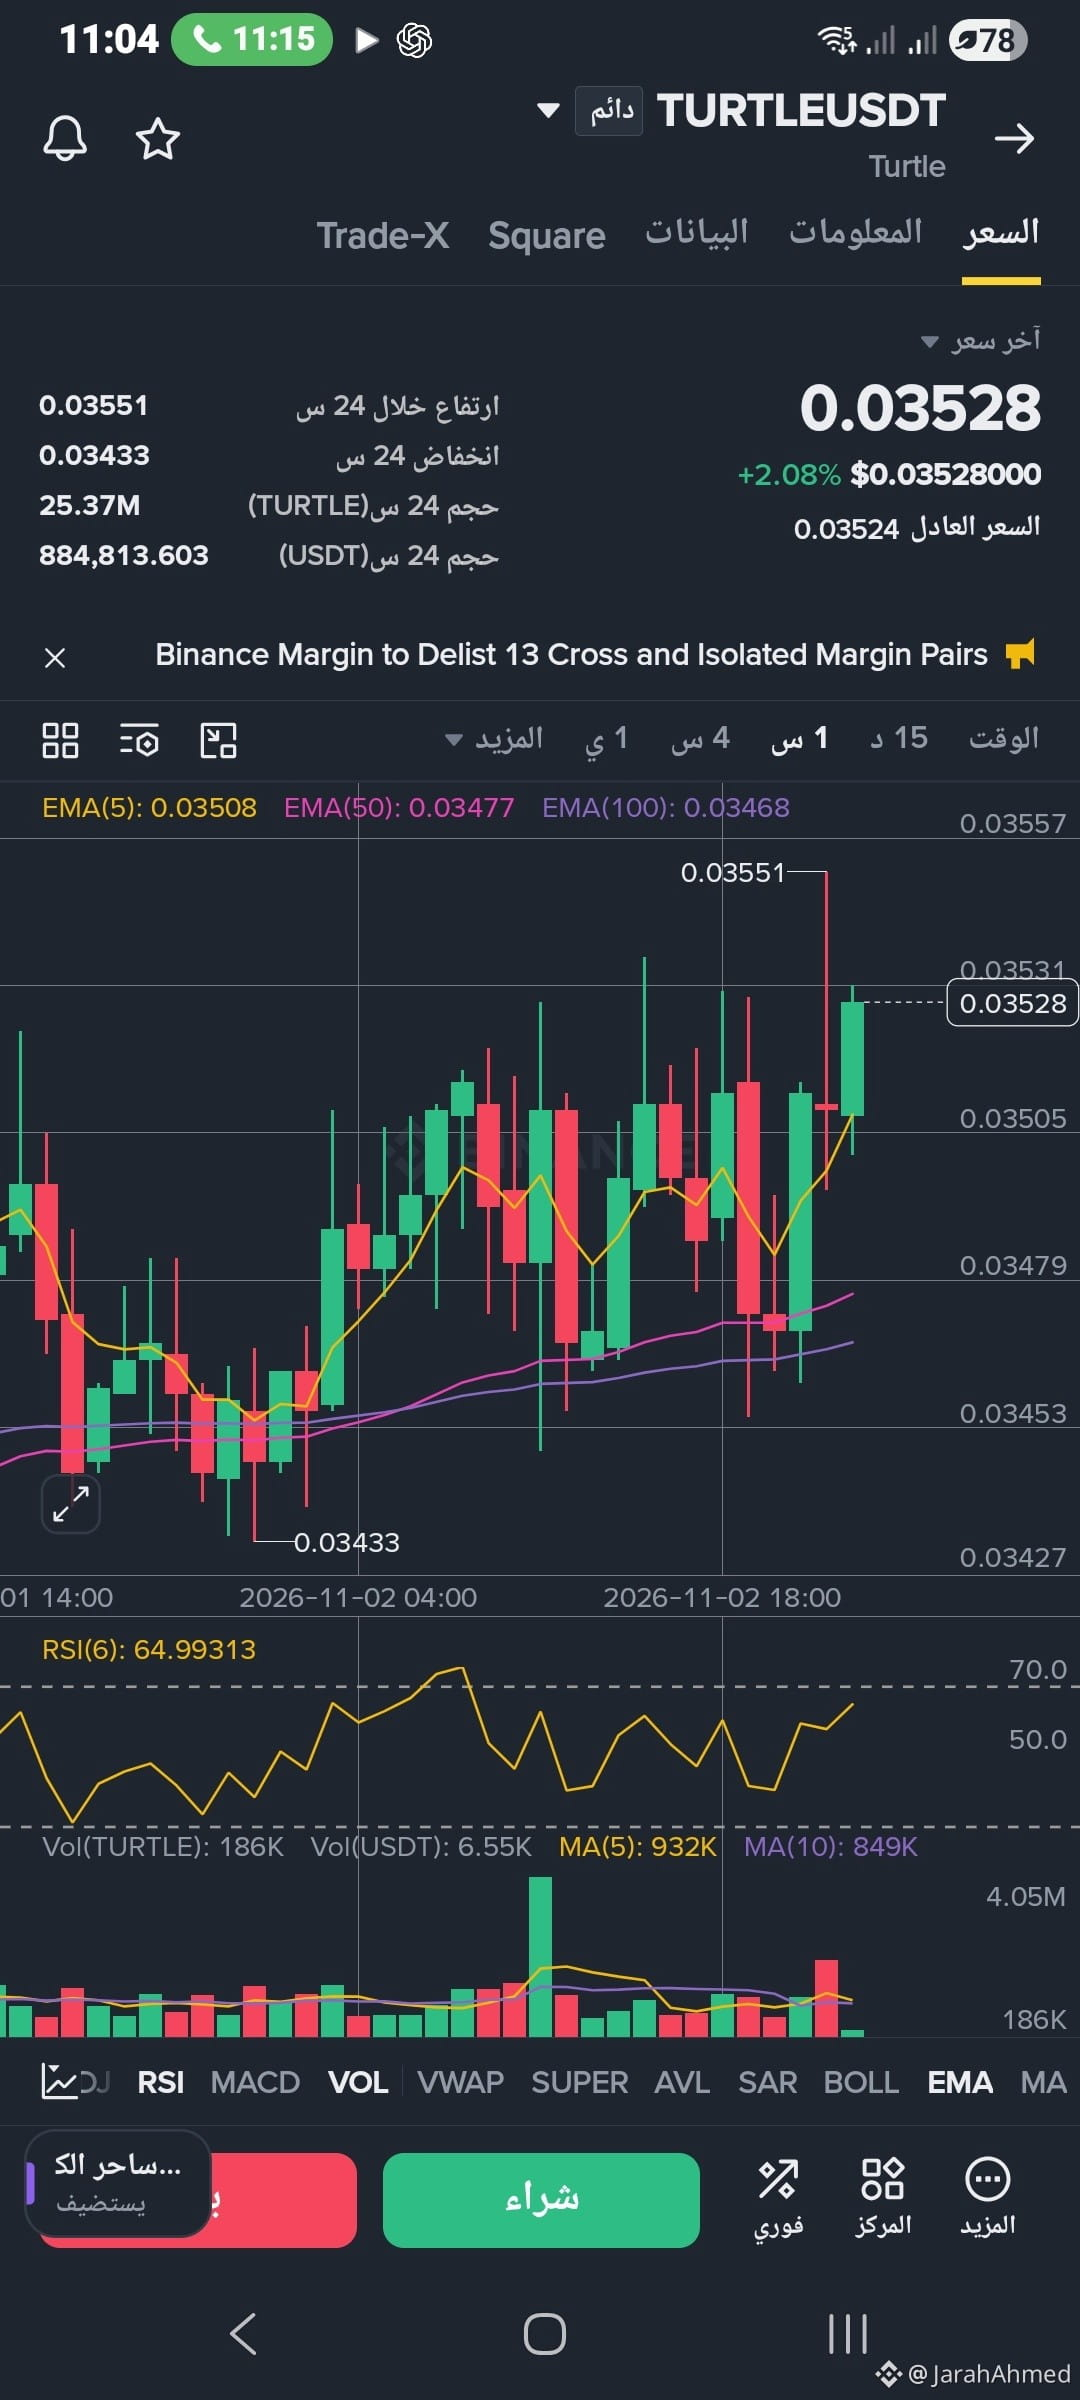
$TURTLE 🔥 There’s a difference between buying a coin because of hype and having a vision based on analysis!
$TURTLE 🔥 There’s a difference between buying a coin because of hype and having a vision based on analysis!
85
·
--
$AGT 🚀 Opportunities in the cryptocurrency market never end, but capital needs protection and smart management.
$AGT 🚀 Opportunities in the cryptocurrency market never end, but capital needs protection and smart management.

212
·
--
$XRP 🔥 There is a difference between buying a coin because of the hype and having a vision based on analysis!
$XRP 🔥 There is a difference between buying a coin because of the hype and having a vision based on analysis!
44
·
--
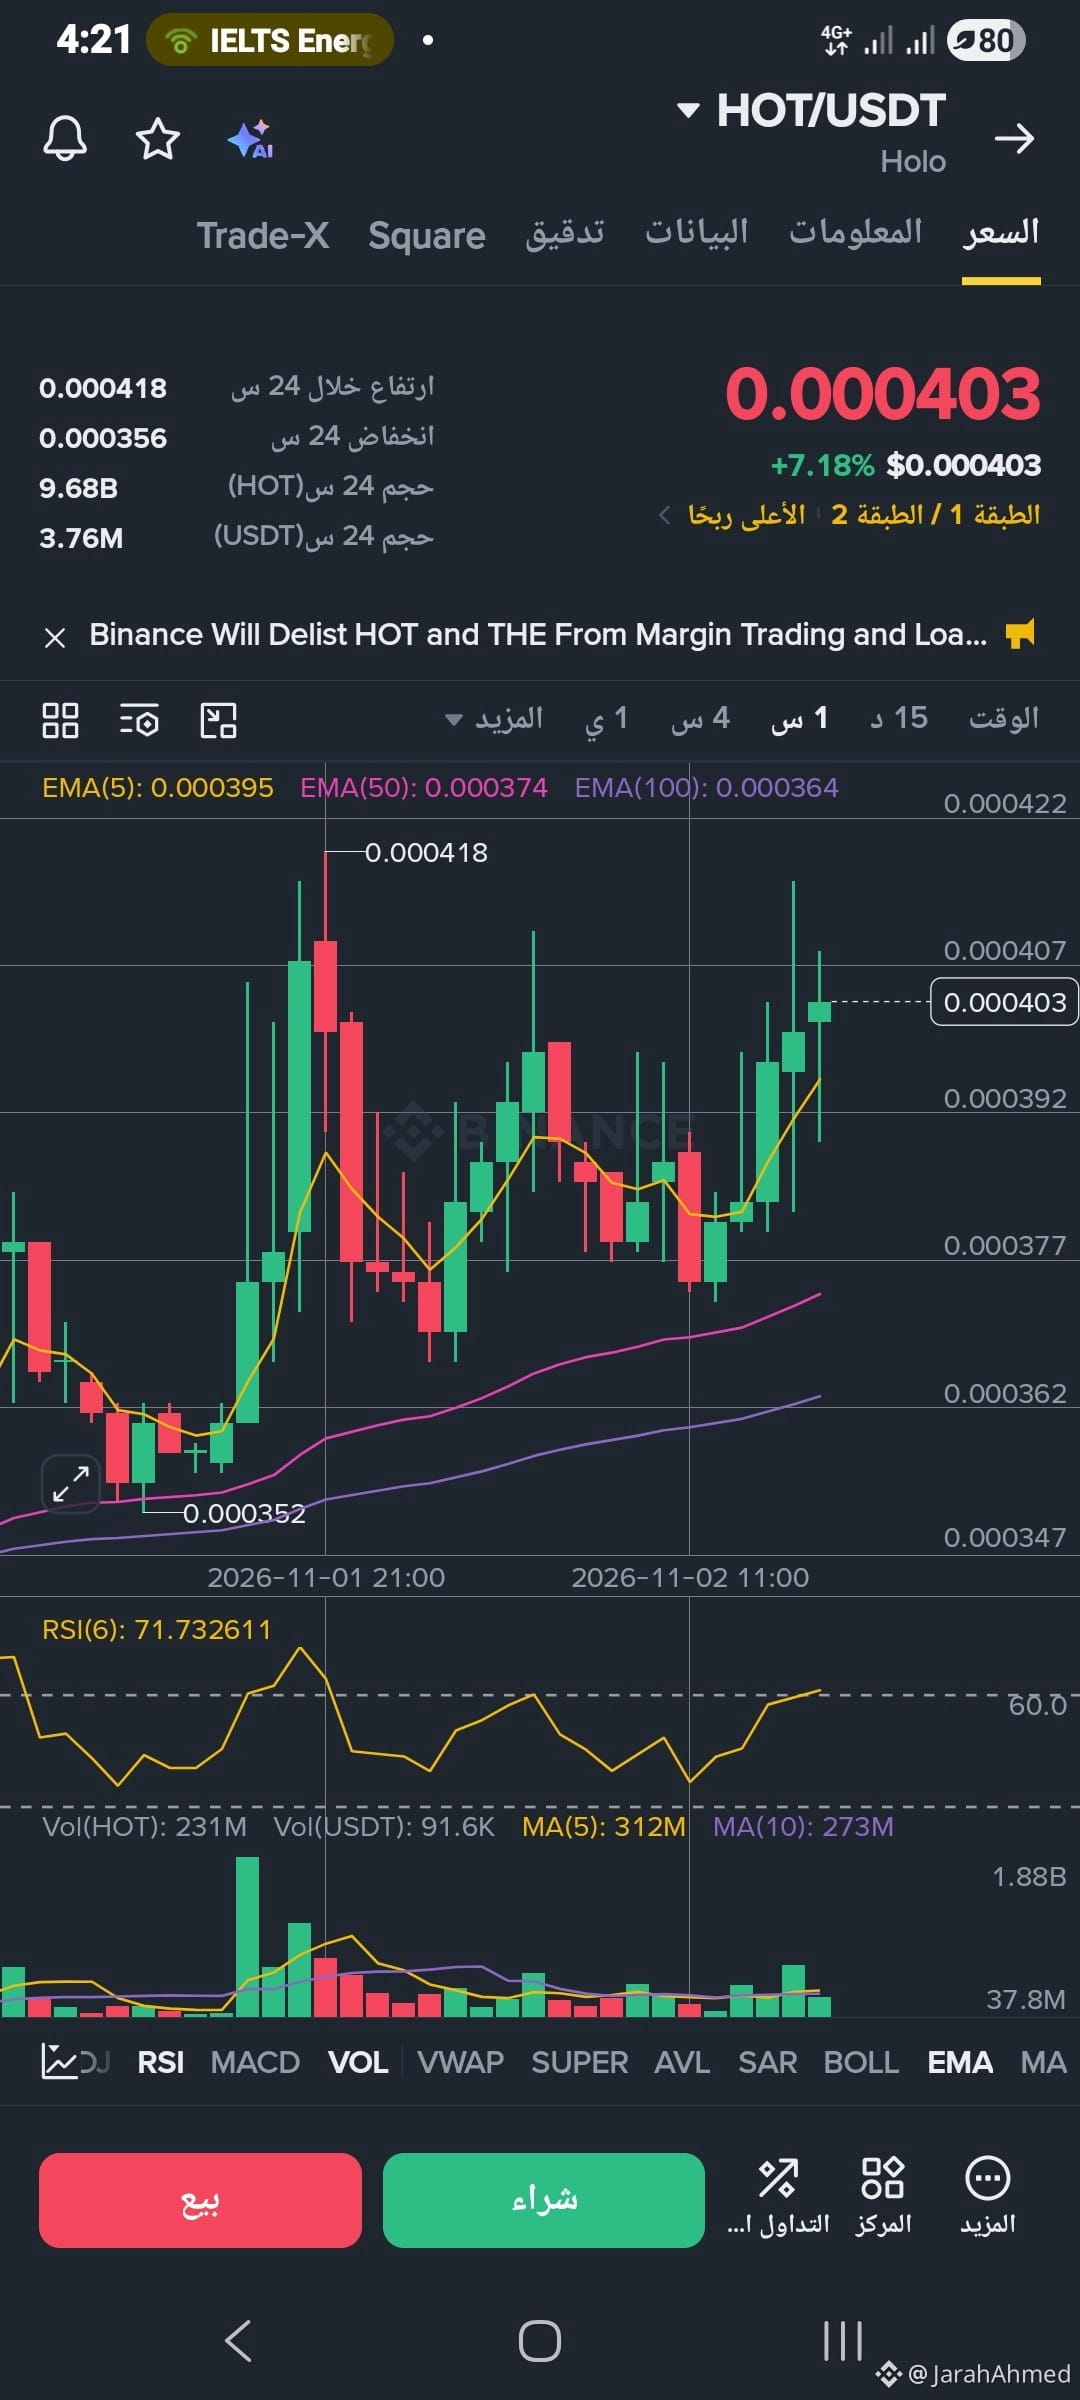
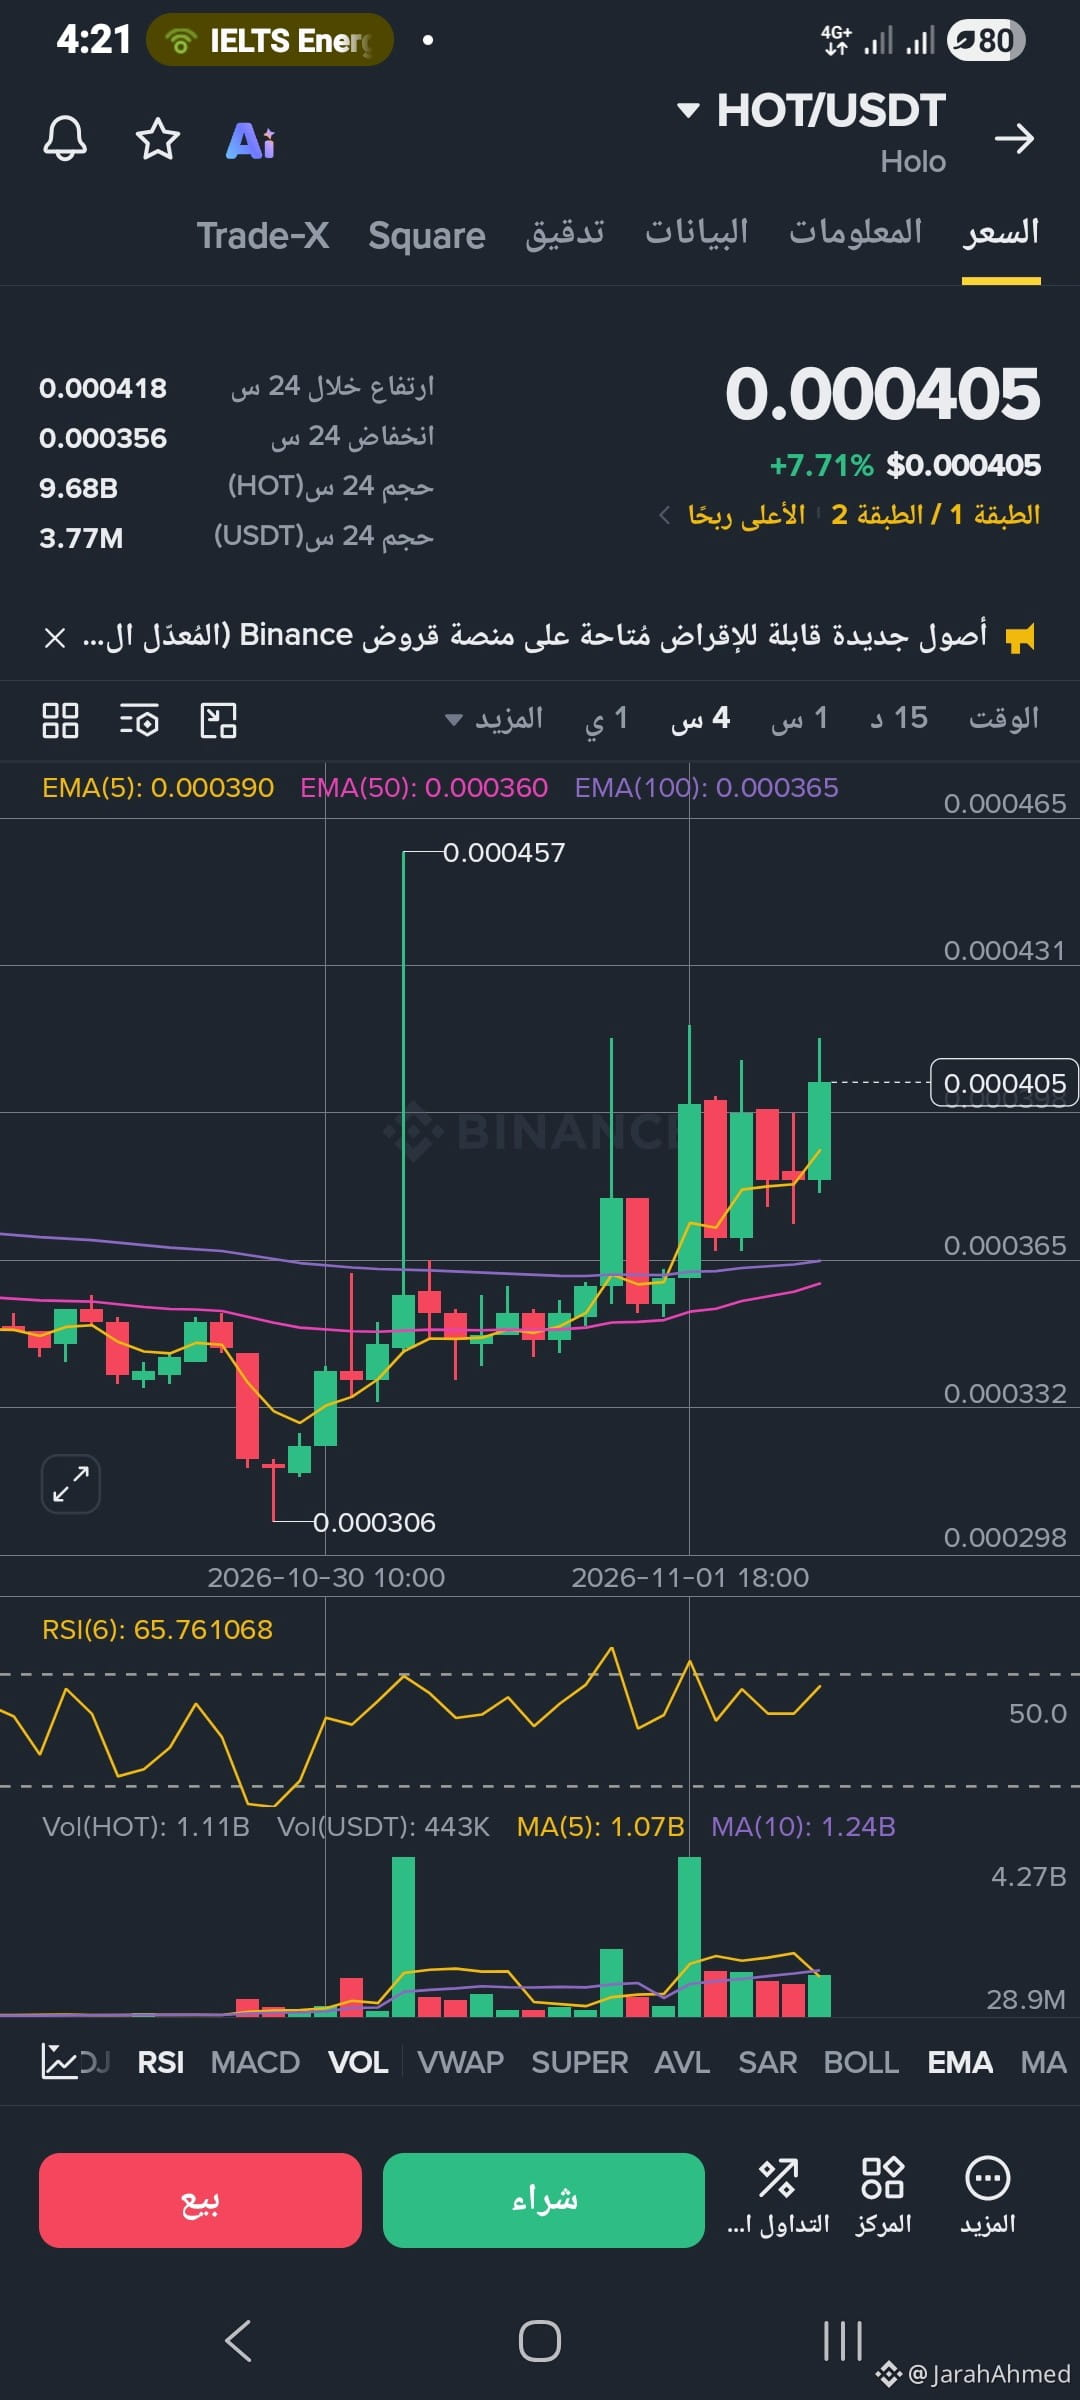
$HOT 🚀 Opportunities never end in the cryptocurrency market, but capital needs protection and smart management. The opportunity is $HOT
$HOT 🚀 Opportunities never end in the cryptocurrency market, but capital needs protection and smart management. The opportunity is $HOT
1
119
·
--
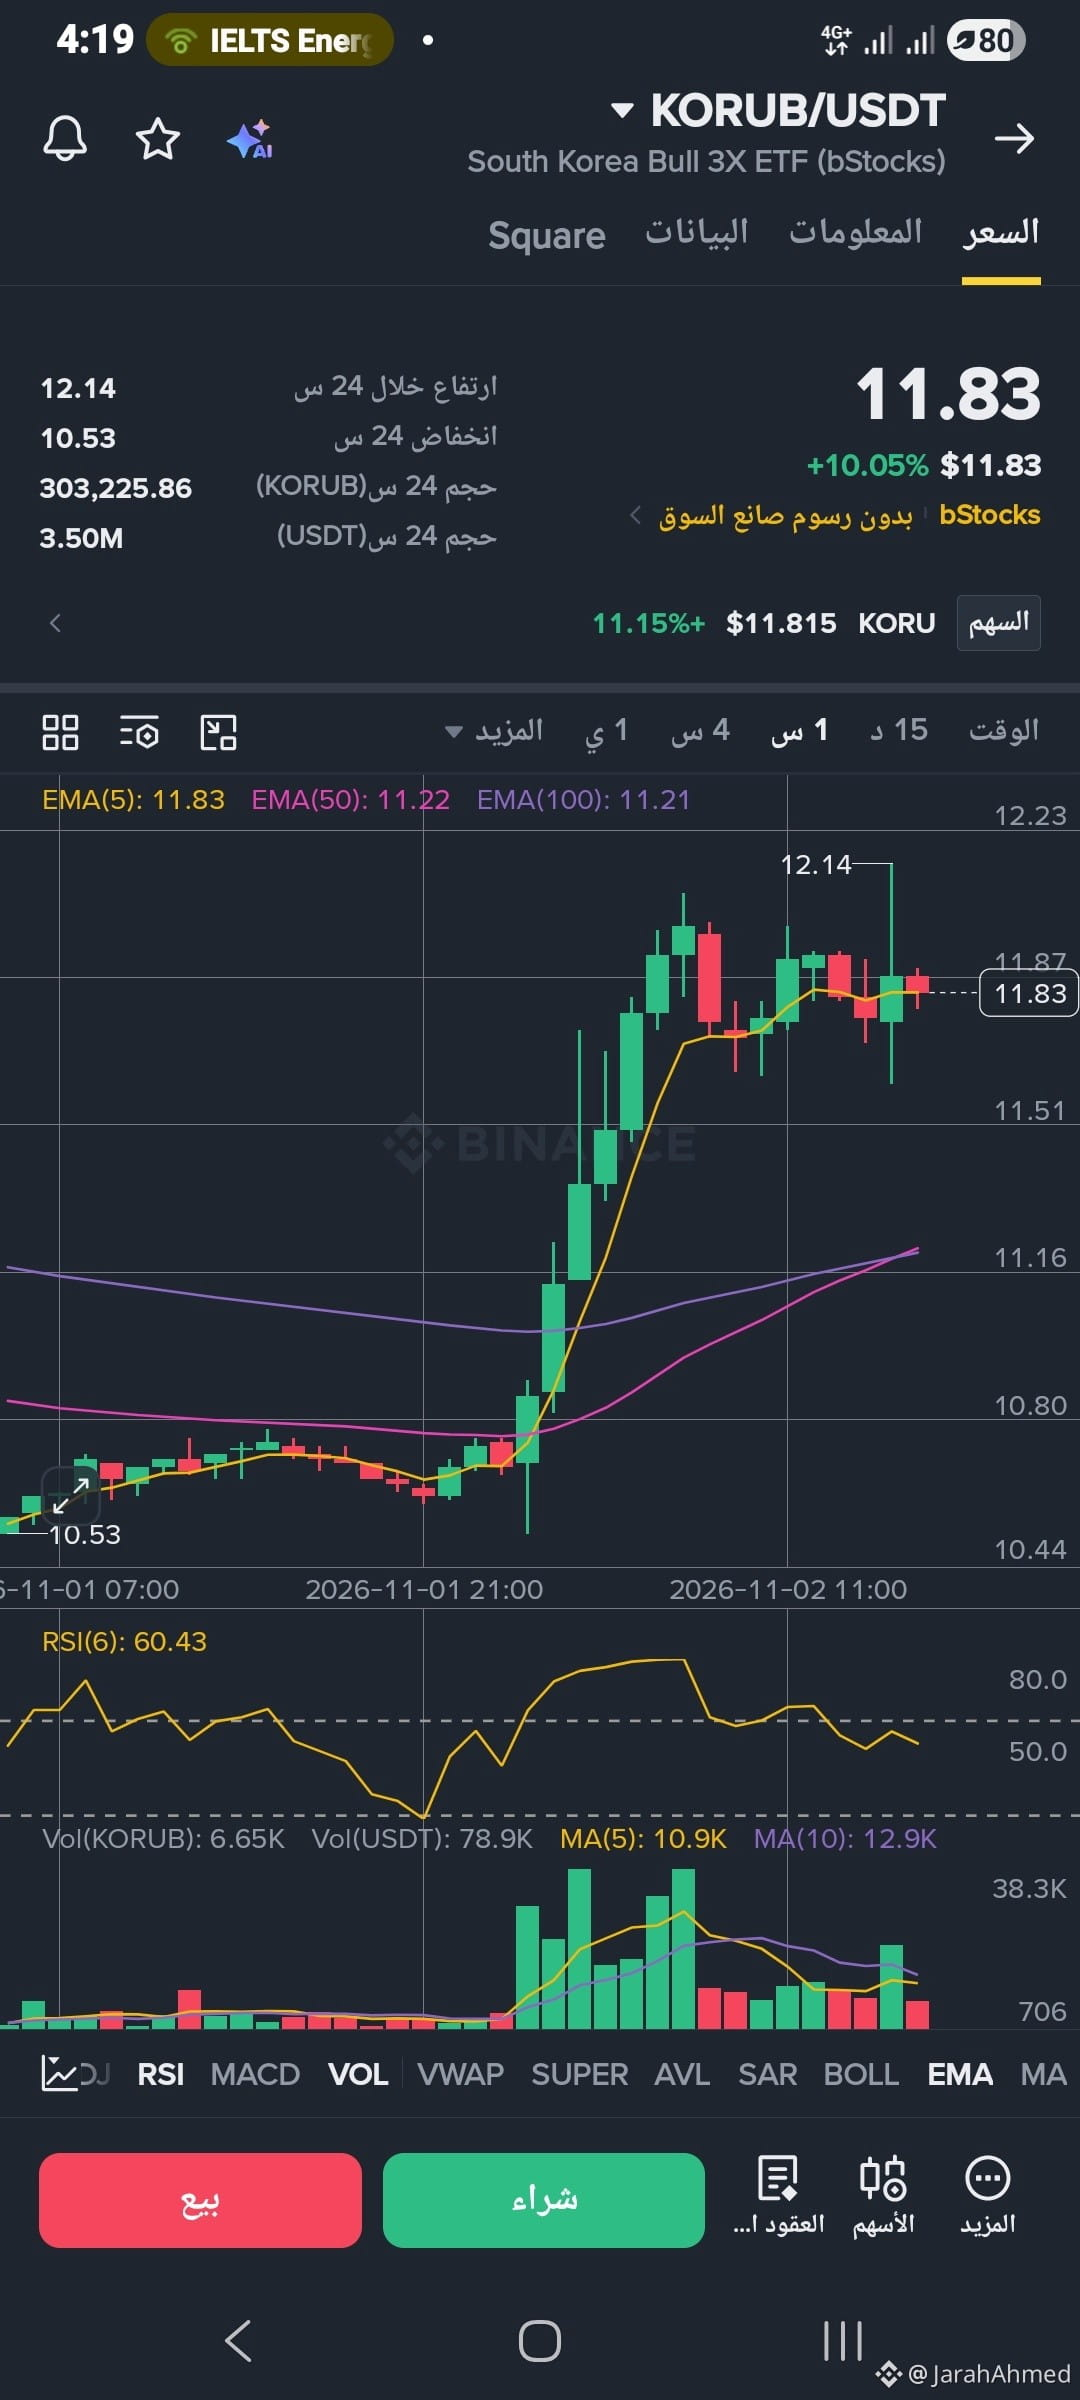
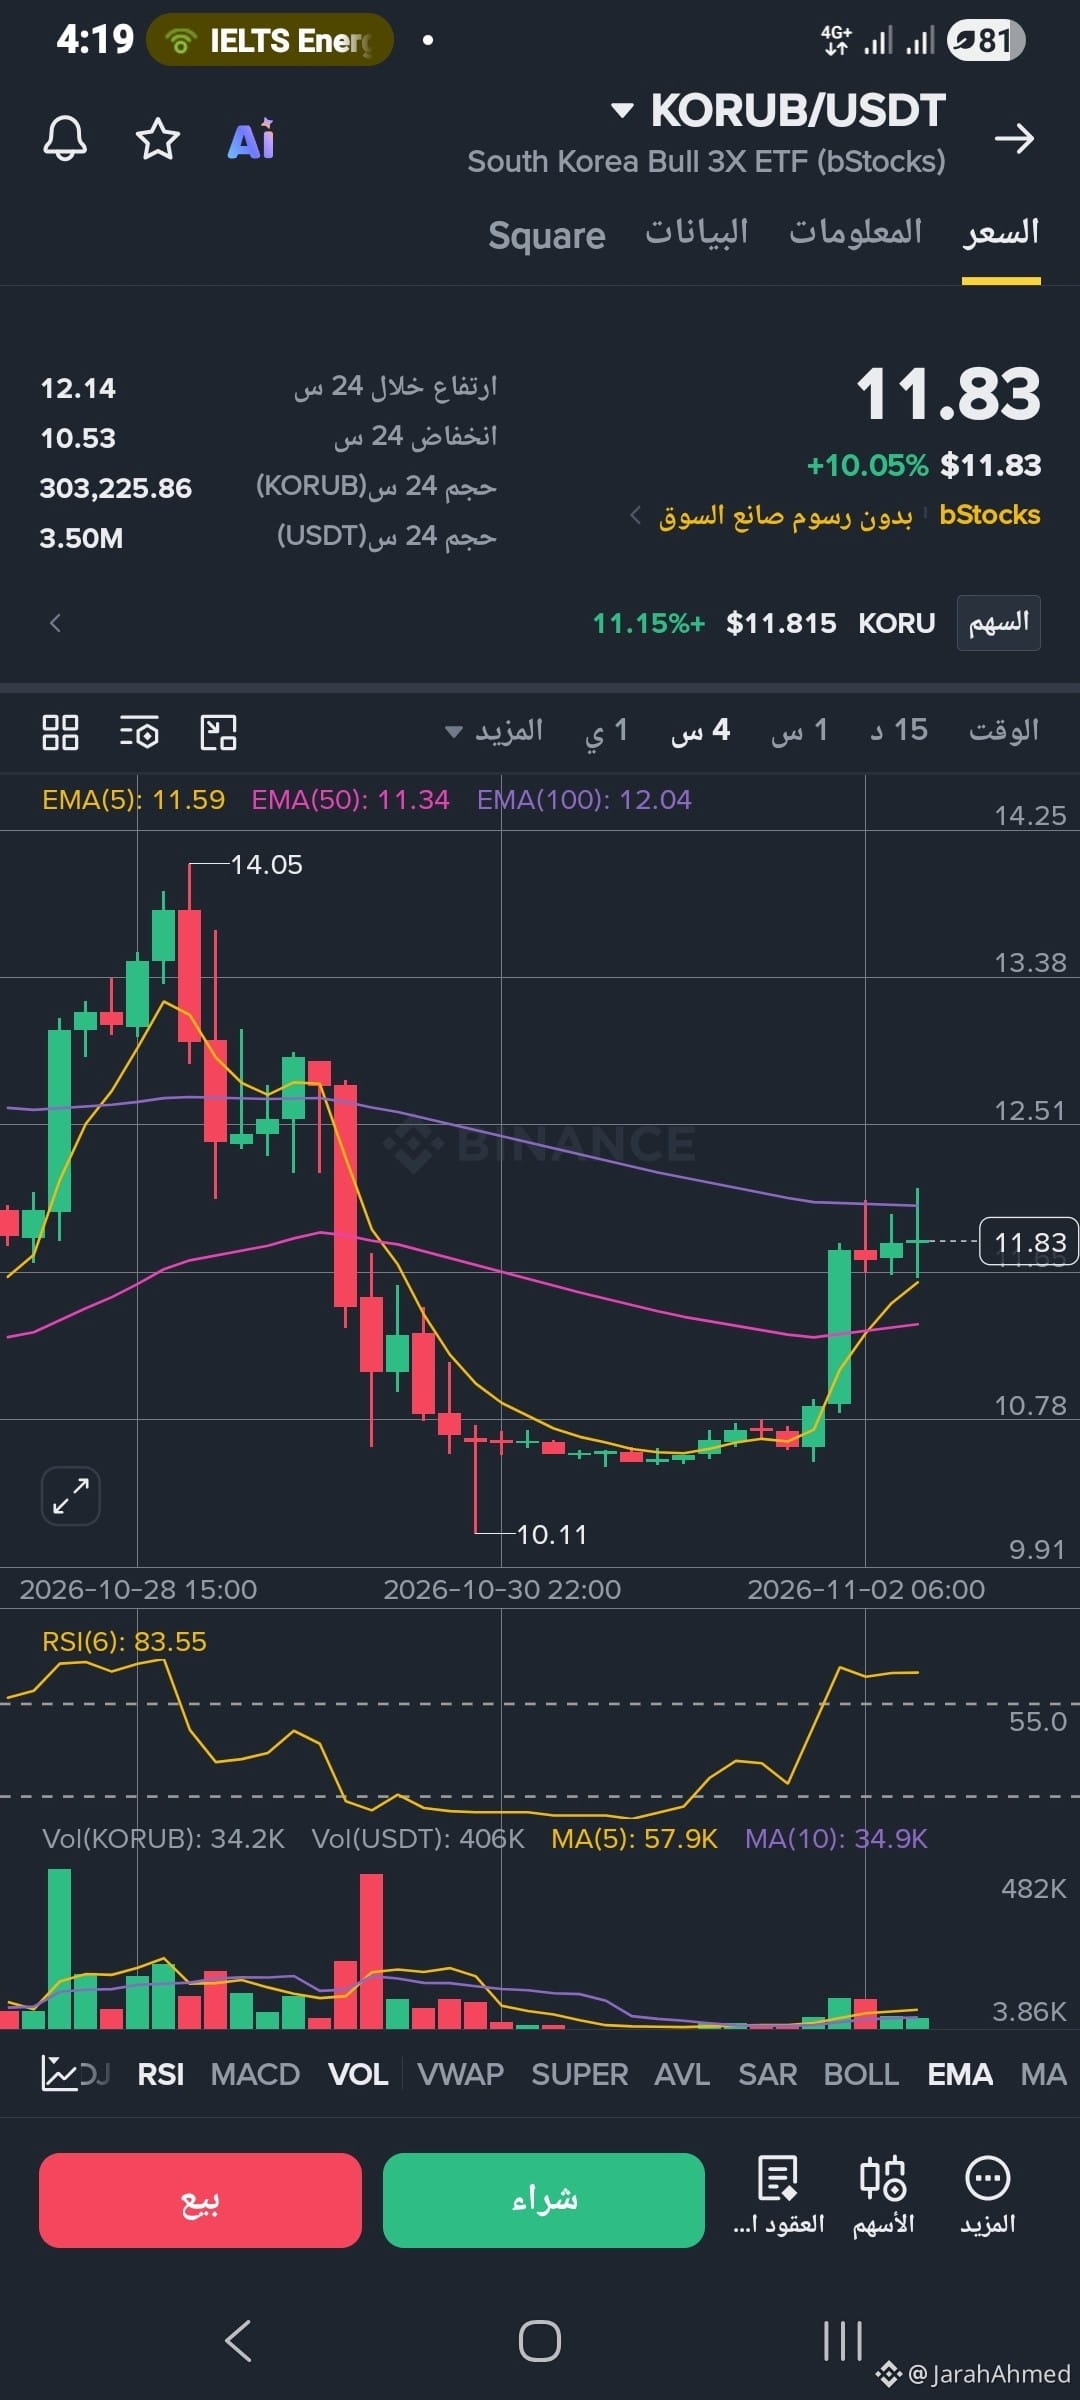
$KORUB 🚀 Opportunities in the cryptocurrency market are endless, but capital needs protection and smart management.
🎯
{spot}(KORUBUSDT)
$KORUB 🚀 Opportunities in the cryptocurrency market are endless, but capital needs protection and smart management.
🎯
🎯
69
·
--
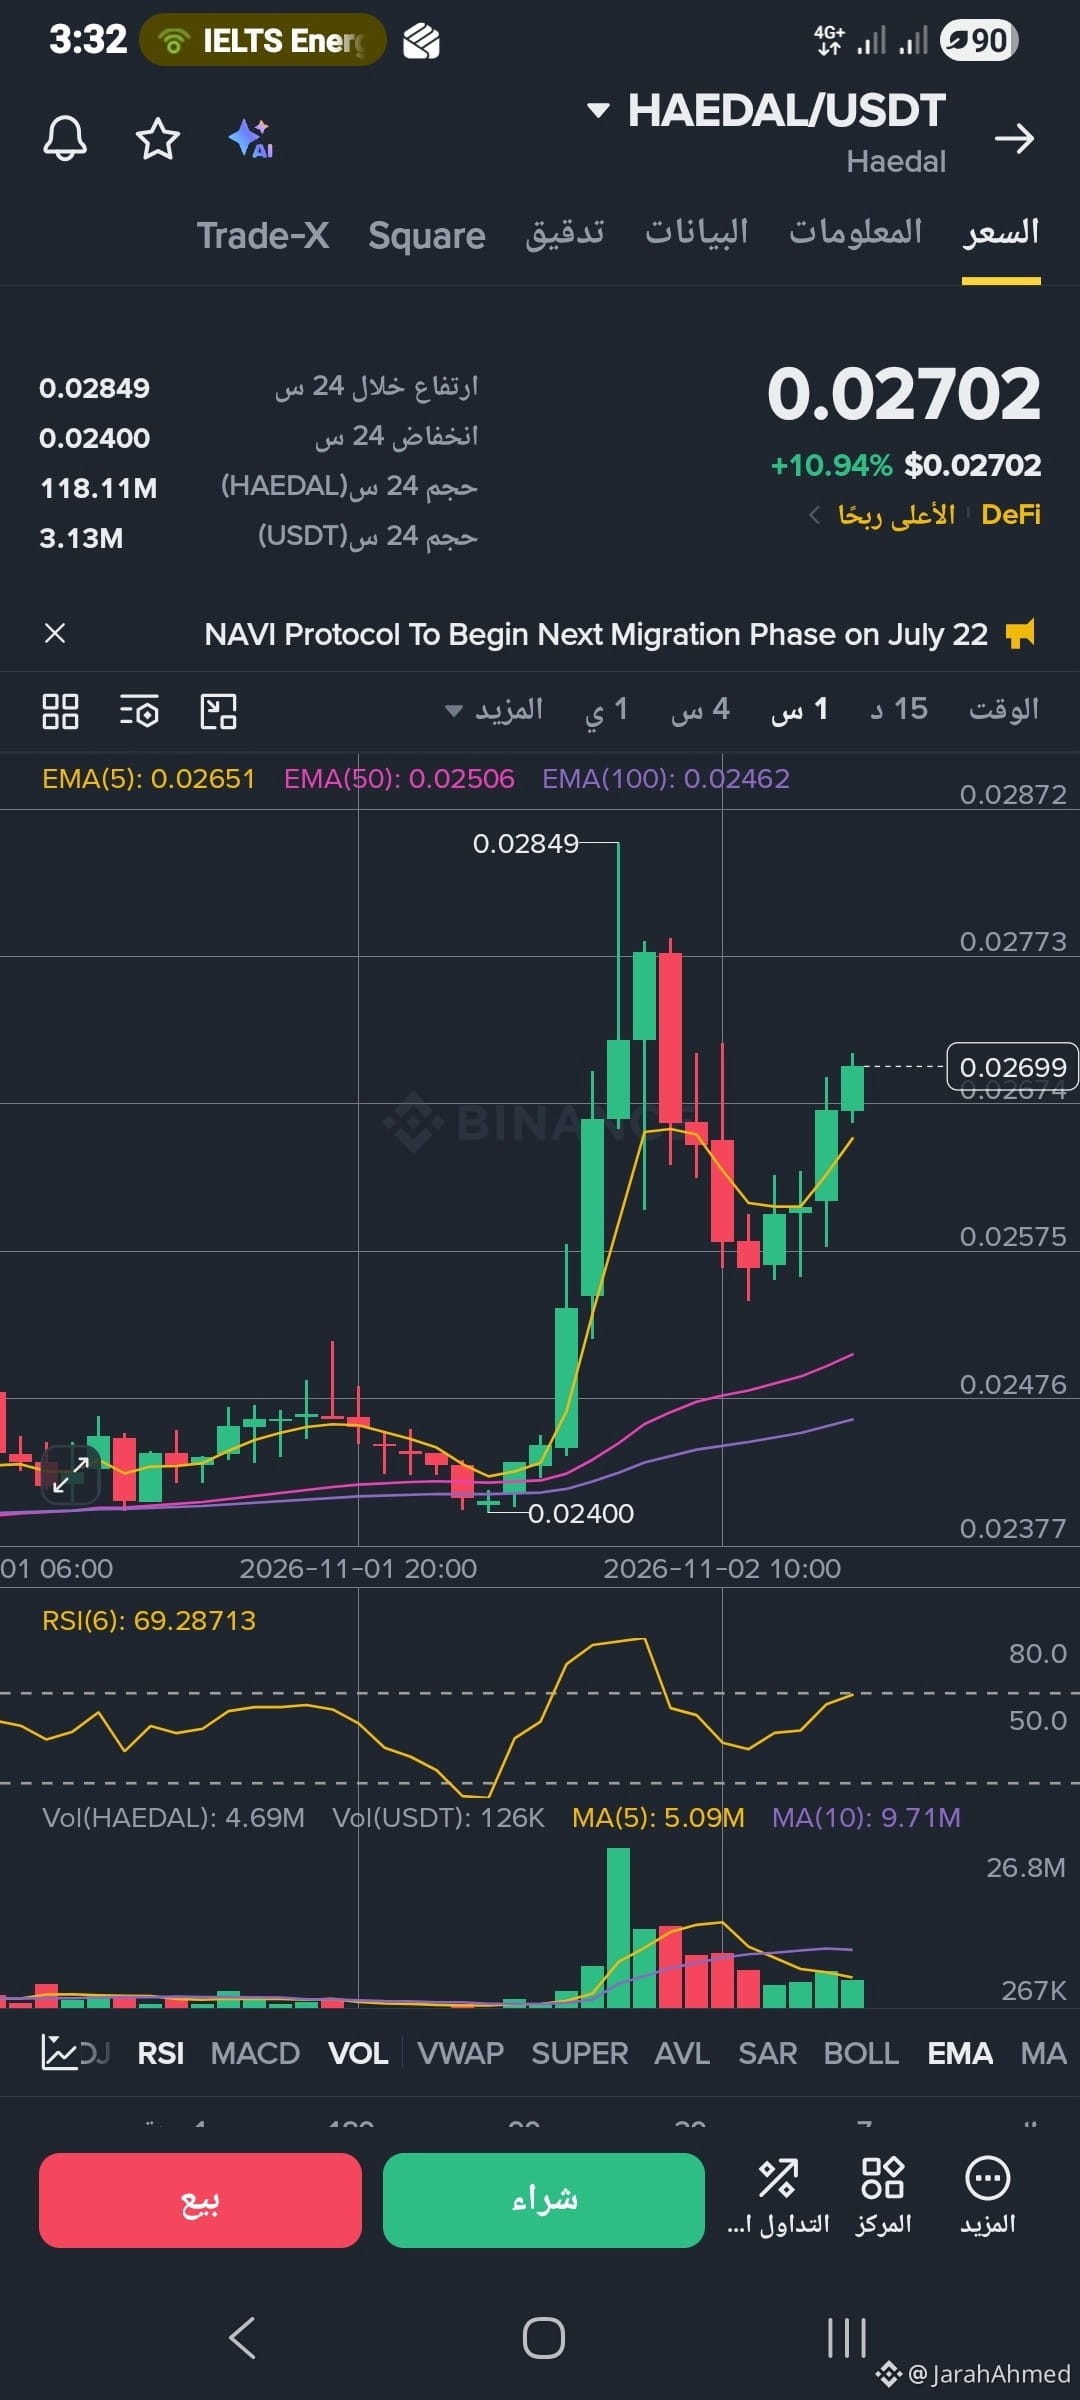
🔥 Don’t chase a price move after it takes off… learn how to spot the opportunity before everyone is talking about it!$HAEDAL
{future}(HAEDALUSDT)
🔥 Don’t chase a price move after it takes off… learn how to spot the opportunity before everyone is talking about it!$HAEDAL
166
·
--
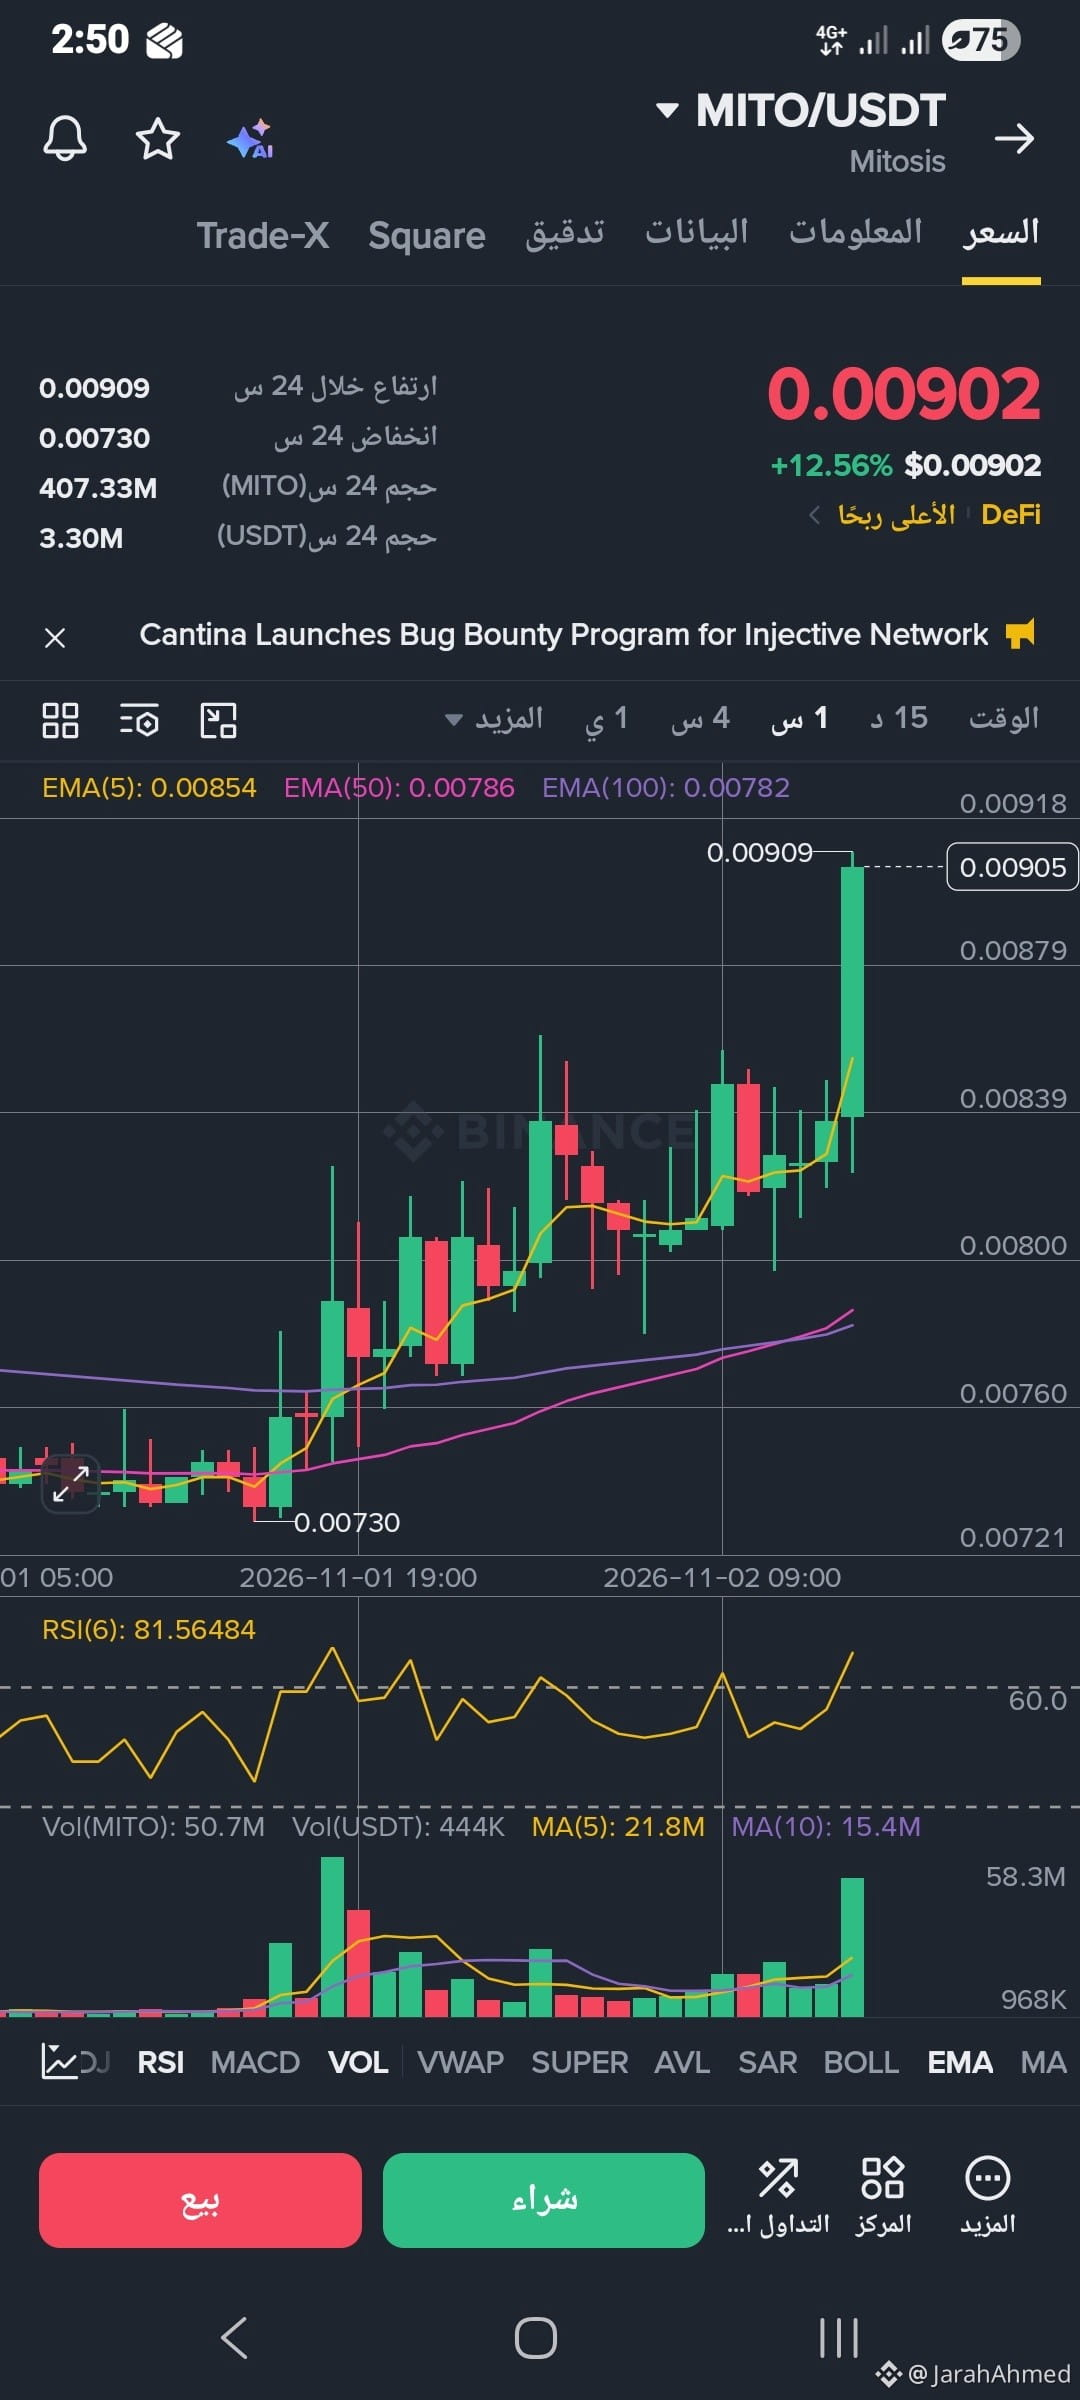
$MITO
Before making any decision regarding $MITO , watch the trend
$MITO
Before making any decision regarding $MITO , watch the trend
Before making any decision regarding $MITO , watch the trend
177
·
--
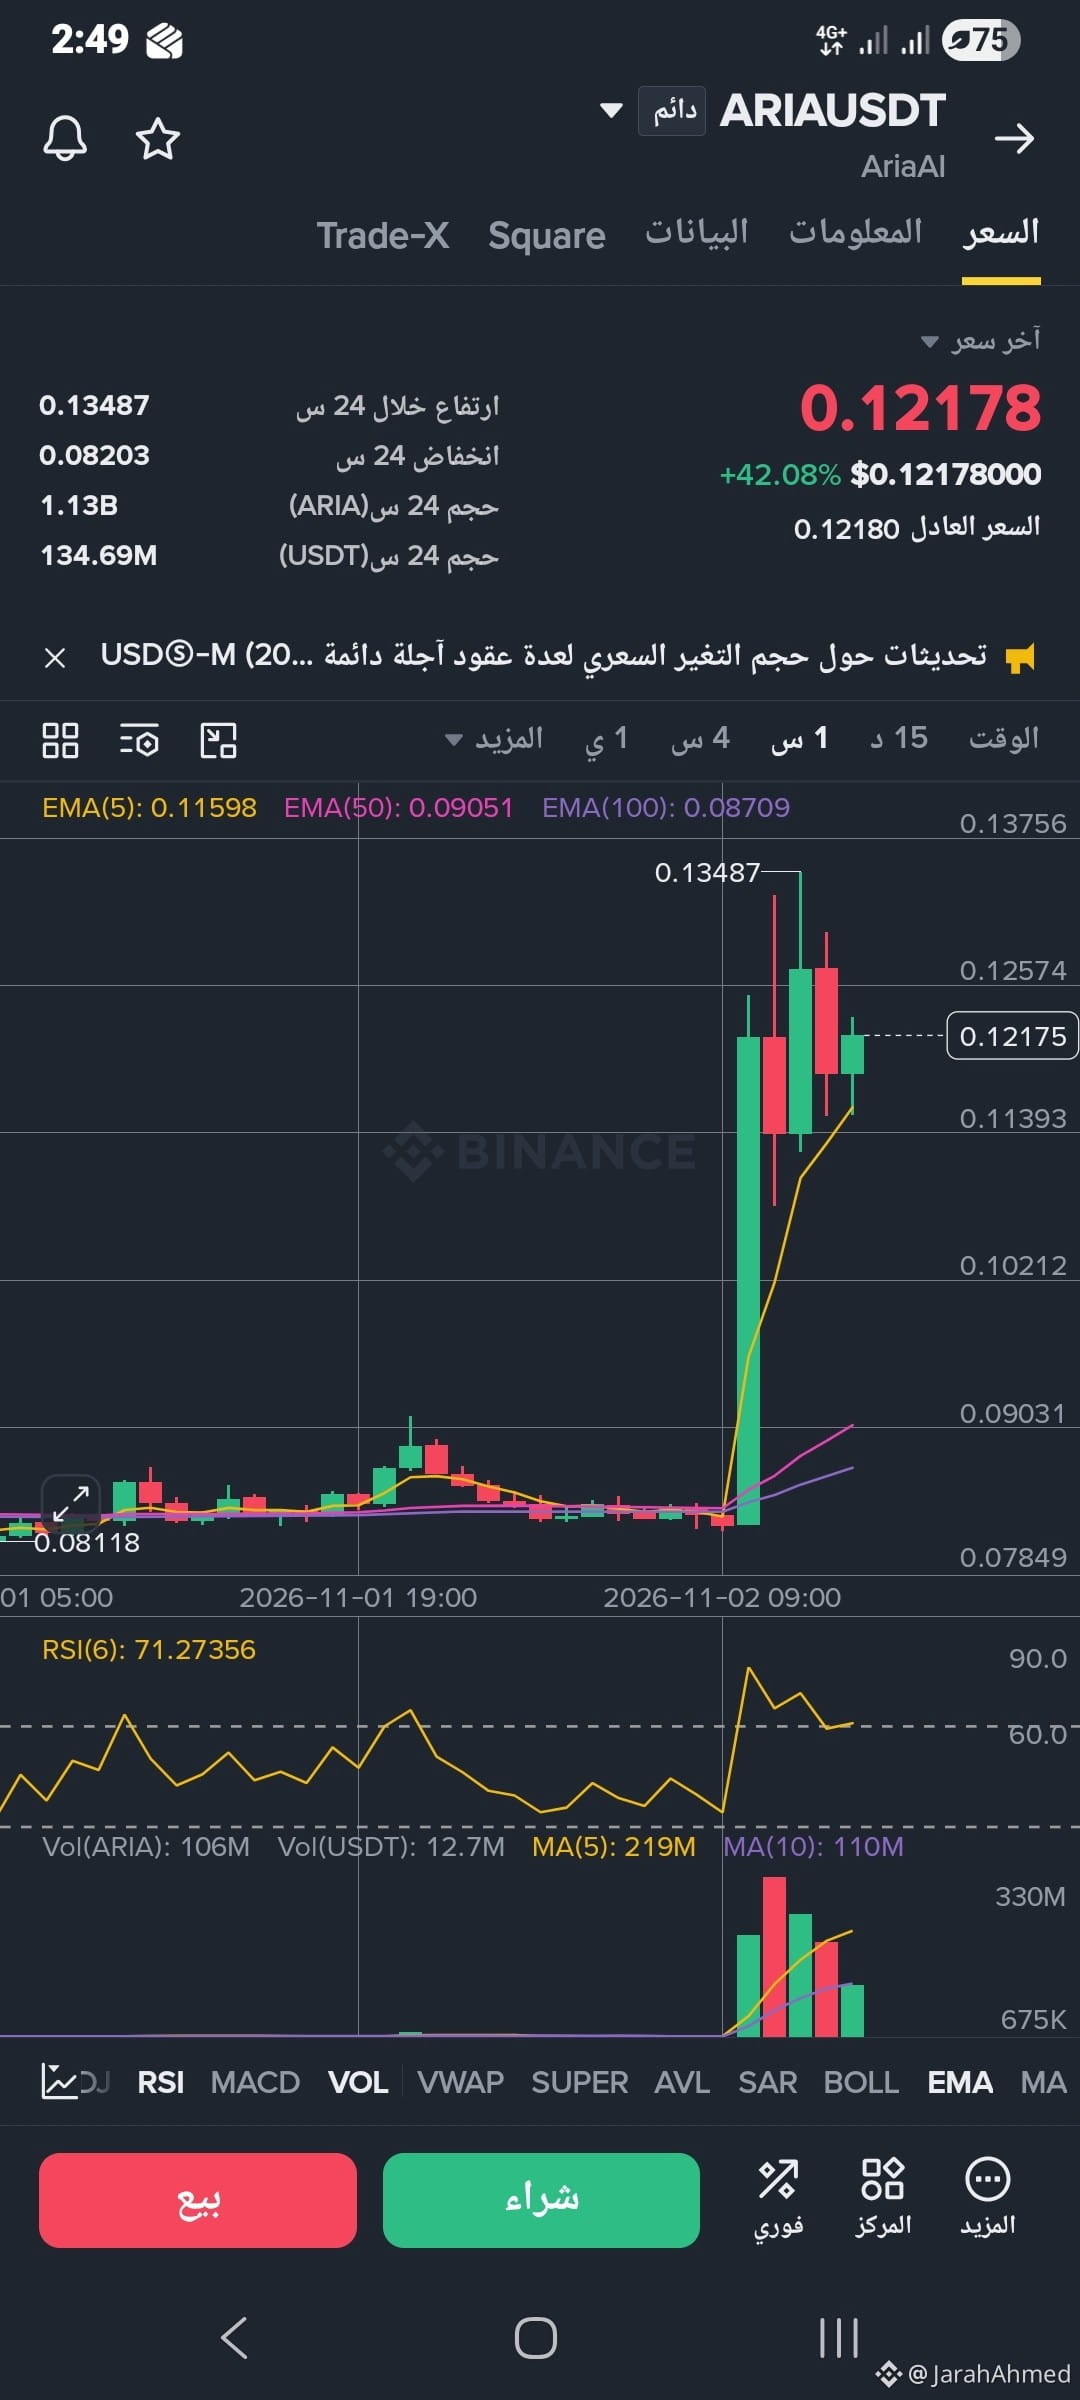
💡 A successful trader doesn’t enter every trade… but waits for the opportunity
that aligns with their plan.$ARIA
{future}(ARIAUSDT)
🎯💰This is the opportunity
💡 A successful trader doesn’t enter every trade… but waits for the opportunity
that aligns with their plan.$ARIA
🎯💰This is the opportunity
that aligns with their plan.$ARIA
🎯💰This is the opportunity
1
171
Log in to explore more content
Join global crypto users on Binance Square
⚡️ Get latest and useful information about crypto.
💬 Trusted by the world’s largest crypto exchange.
👍 Discover real insights from verified creators.
Email / Phone number
Trending Topics
BinanceReopensWithdrawalsForMoreAssets
576,375 views
2,637 Discussing
Security Incident | Recovery Update #8: Withdrawals for More Assets to Reopen (2026-11-05)
Binance Announcement
·65 Likes
·150.1k views
BTCRebounds80K
101,721 views
1,017 Discussing
Binance98PercentReplenished
56,179 views
744 Discussing