

المهندس علي الشغممي
9k Posts

المهندس علي الشغممي
Report
Block User
علي الشغممي | المايسترو المالي ، مهندس ومستثمر | محلل أسواق رقمية | متخصص في التداول الرقمي |استراتيجيات دقيقة | متابعة لحظية | تحقيق أرباح مستدامة
93 Following
8.8K+ Followers
14.1K+ Liked
Posts
All
Quotes
Videos
Live
PINNED
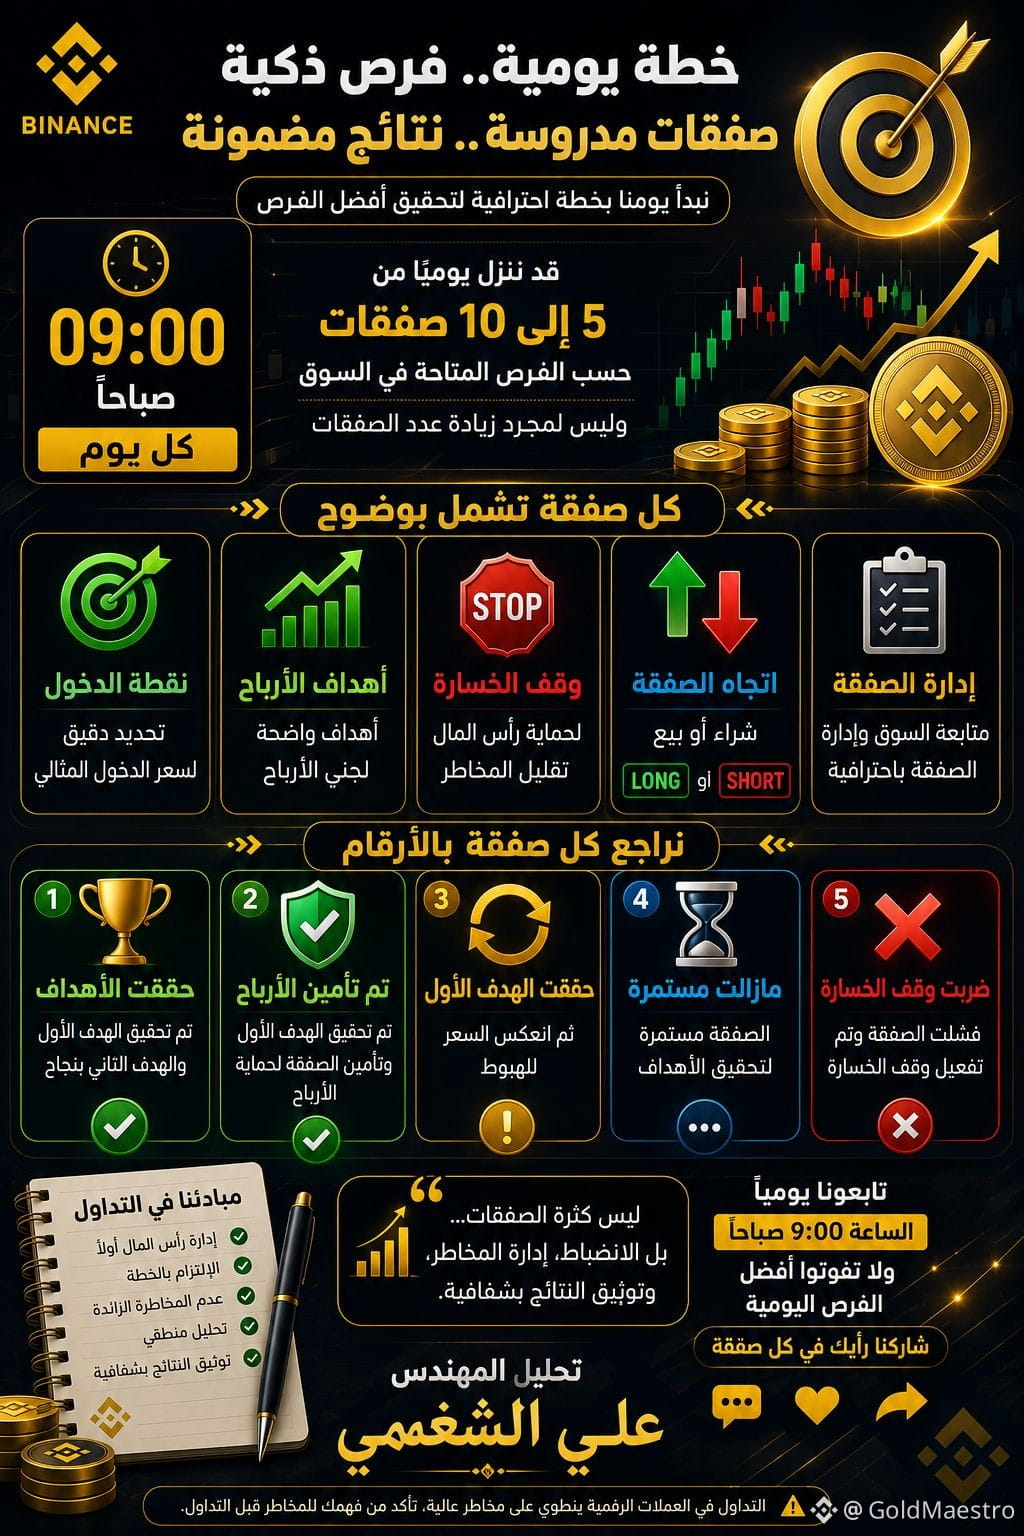
🚨🔥 From now on… we start our day with a clear trading plan! 🔥🚨
⏰ At 9:00 AM we follow the market and begin posting trading opportunities.
📊 We may place daily between 5 and 10 trades depending on available opportunities—not just to increase the number of trades.
For each trade, we will clearly define:
🟢 📍 Entry point
🎯 Profit targets
🛑 Stop loss
📈 Trade direction: buy or sell
⚠️ Trade management and monitoring of developments
And at the end of the monitoring, we will review every trade with numbers:
✅ It hit its targets
🟢 Profits were secured
🟡 It reached the first target then reversed
🔵 It is still ongoing
❌ The stop loss was triggered
🎯 Our goal is not to have many trades… but discipline, risk management, and documenting results with transparency.
📌 Follow us daily at 9:00 AM and share your opinion on every trade.
✍️ Analysis by Engineer Ali Al-Shaghmami
#Binance #crypto #صفقات
#BTC #استراتيجية_الصمود_الذهبي
$SOL $XRP $ETH
35
2
64
1.2k
PINNED
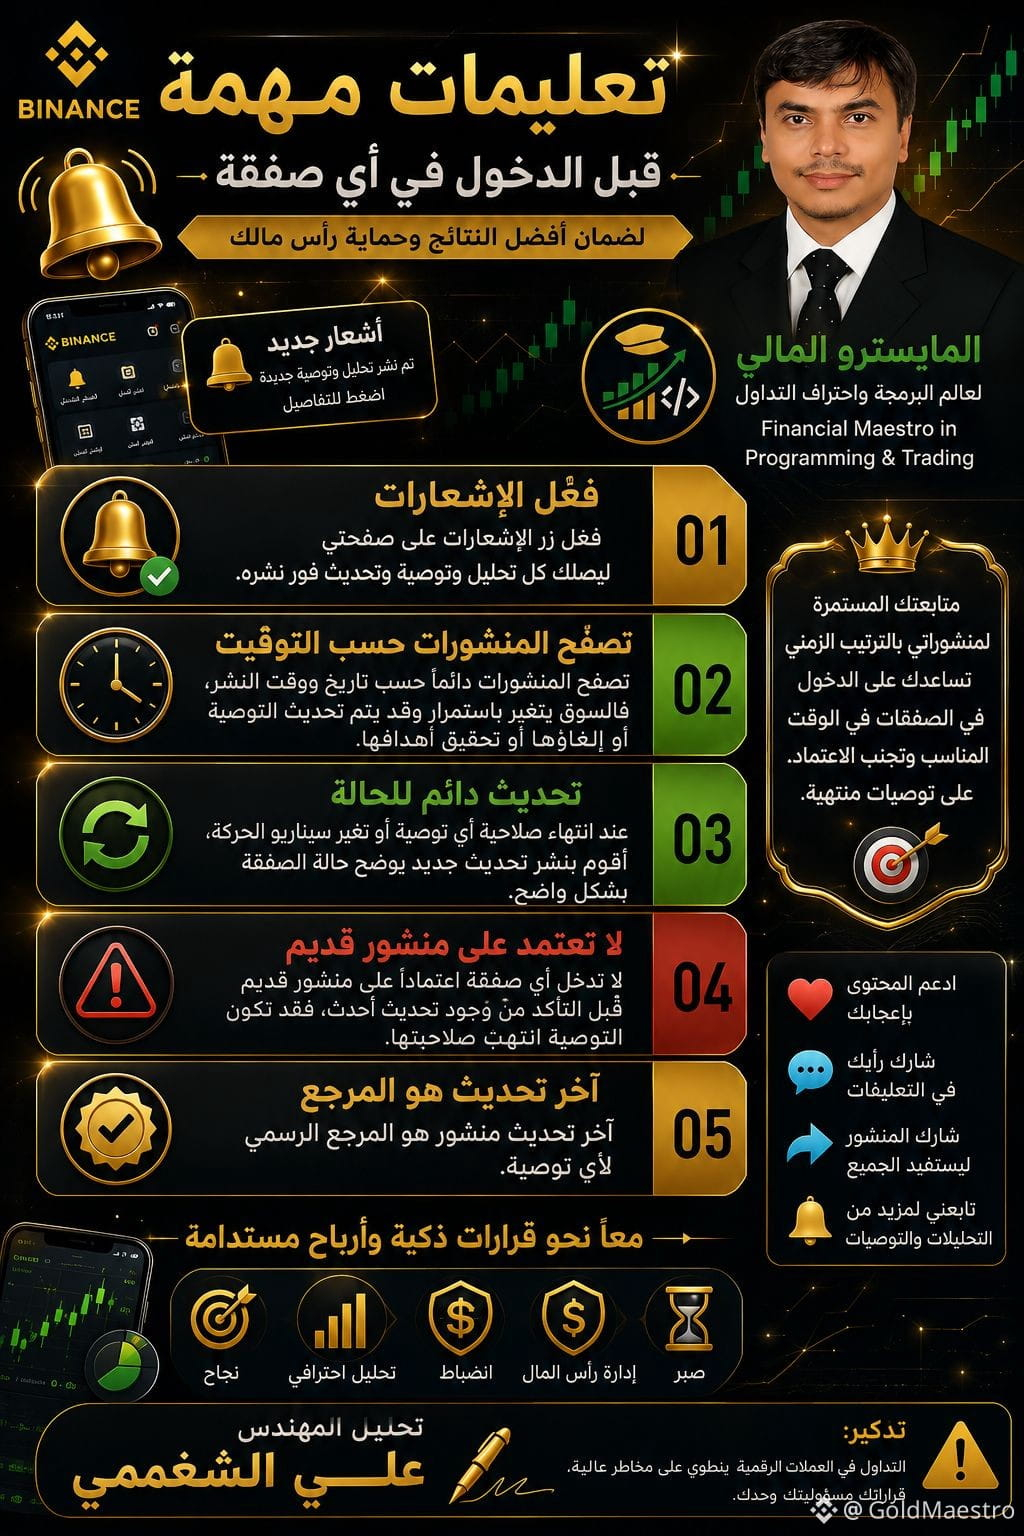
📌 Important instructions before entering any trade
🔔 Enable notifications on my page so you receive every analysis, recommendation, and update immediately upon being published.
📅 Always review posts by their publication date and time, as the market is constantly changing; the recommendation may be updated, canceled, or may have achieved its targets.
✅ When any recommendation expires or the movement scenario changes, I will publish a new update that clearly explains the trade status.
⚠️ Do not rely on any old post before confirming that there is a newer update; the recommendation may have expired.
🛡️ The latest posted update is the official reference for any recommendation.
Wishing you success in trading and wise capital management.
$BTC $XRP $SOL
#BTC #Binance #BinanceSquareTalks #TrendingTopic #استراتيجية_الصمود_الذهبي
15
52
1.2k
·
--
Bearish
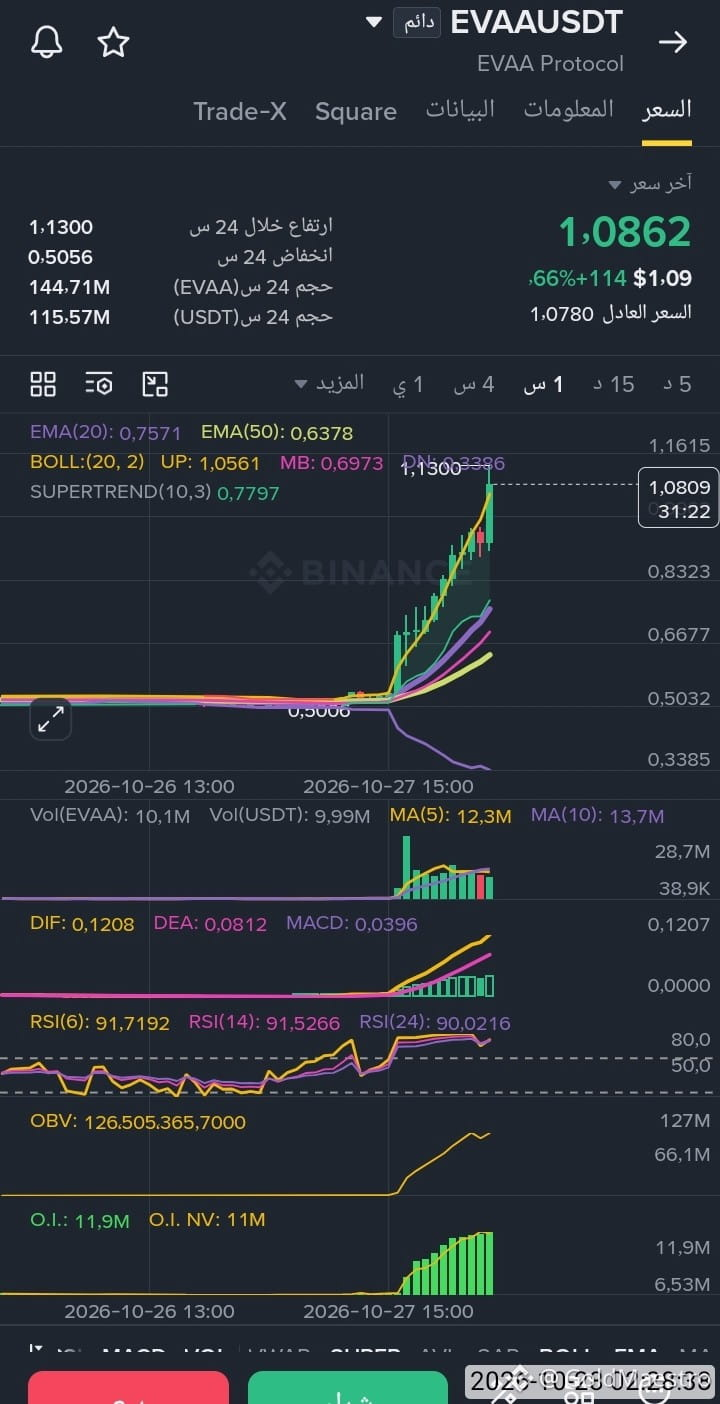
$EVAA What comes after this candle? By the way, the first profit-taking zone is from $1.2 to $1.3. If a four-hour candle closes above $0.13, it may target $2.4 to $3, but the more likely scenario is a correction near its initial levels 👇
$EVAA What comes after this candle? By the way, the first profit-taking zone is from $1.2 to $1.3. If a four-hour candle closes above $0.13, it may target $2.4 to $3, but the more likely scenario is a correction near its initial levels 👇
2
5
643
·
--
Bullish
$Q Real-time update on this coin 👇
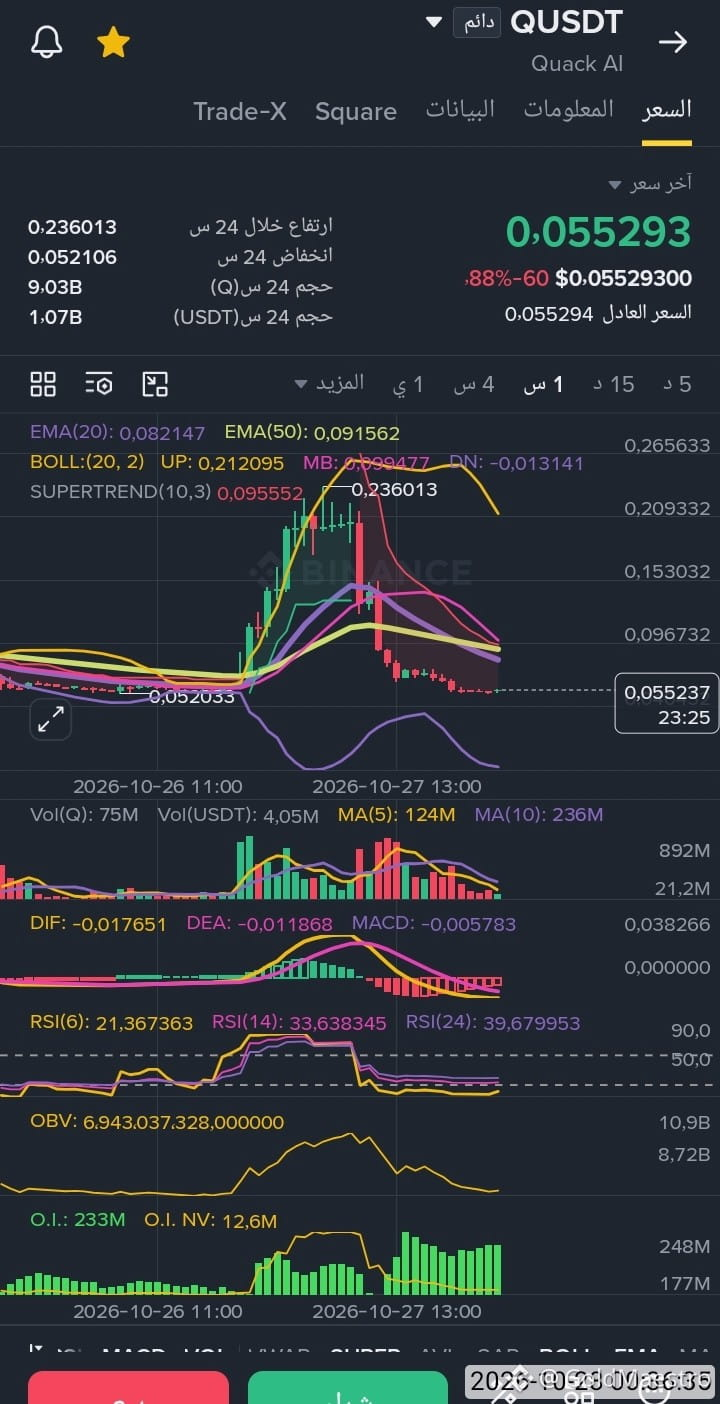
Its correction may be almost over, and it may hold its immediate support at $0.052. However, it is still entering a short-term consolidation range before regaining its previous upward momentum. The bullish scenario would be invalidated if an hourly candle closes below the immediate support at $0.052. As for its upside targets, we may identify them once buying liquidity comes in; the target will depend on the strength of that liquidity 👇
Note: Anyone wishing to enter a buy trade should avoid using leverage and enter near $0.0540. If the price breaks below the immediate support at $0.052, close the trade at the entry price or slightly higher, since the bullish scenario may fail if the coin cannot hold its immediate support 👇
3
1
470
·
--
Bearish
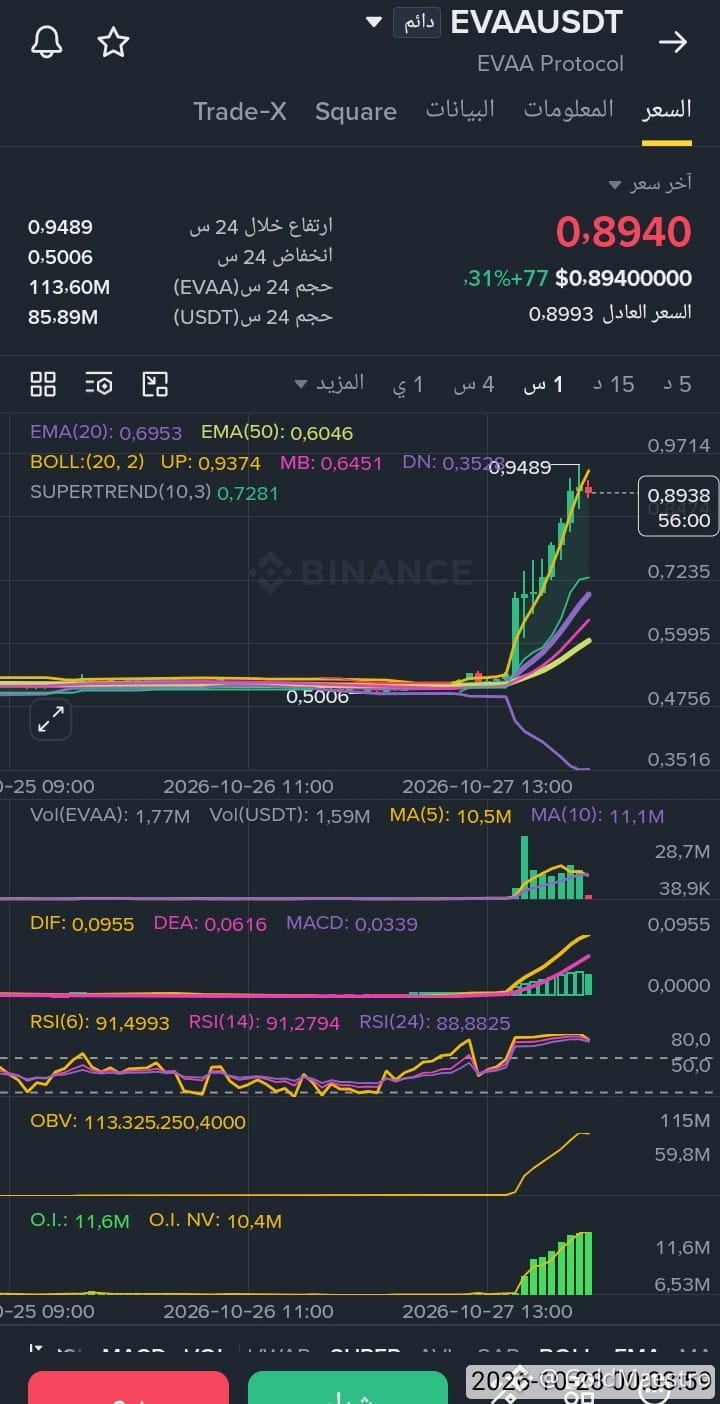
$EVAA The bottom line is that a correction is closer than ever. For sell trades, though, make quick moves: enter a sell trade on every rise, and secure your profits on every safe drop 👇
$EVAA The bottom line is that a correction is closer than ever. For sell trades, though, make quick moves: enter a sell trade on every rise, and secure your profits on every safe drop 👇
2
316
·
--
Bearish
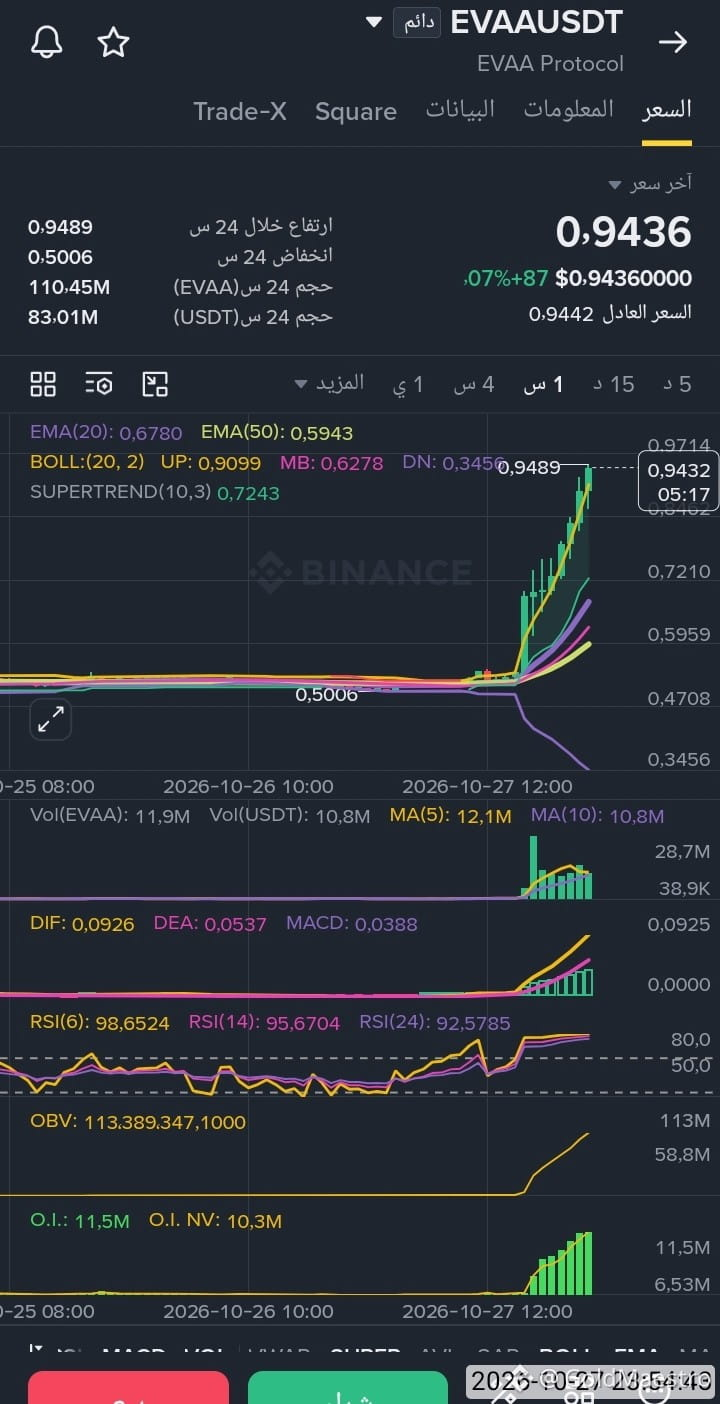
$EVAA Regarding it, if it breaks through its resistance at $0.93, its rise may not last long, and it could pull back for a correction before continuing upward if it sets its sights on rising above one 👇
In summary, it is no longer advisable to enter buy trades. As for sell trades, do not enter unless a red one-hour candle closes for it 👇
The most likely scenario, if it does not correct by today’s candle close, is that it may correct when the first four-hour candle of tomorrow, Wednesday, October 28, 2026, closes 👇
249
·
--
Bullish
Regarding the coin $CAP
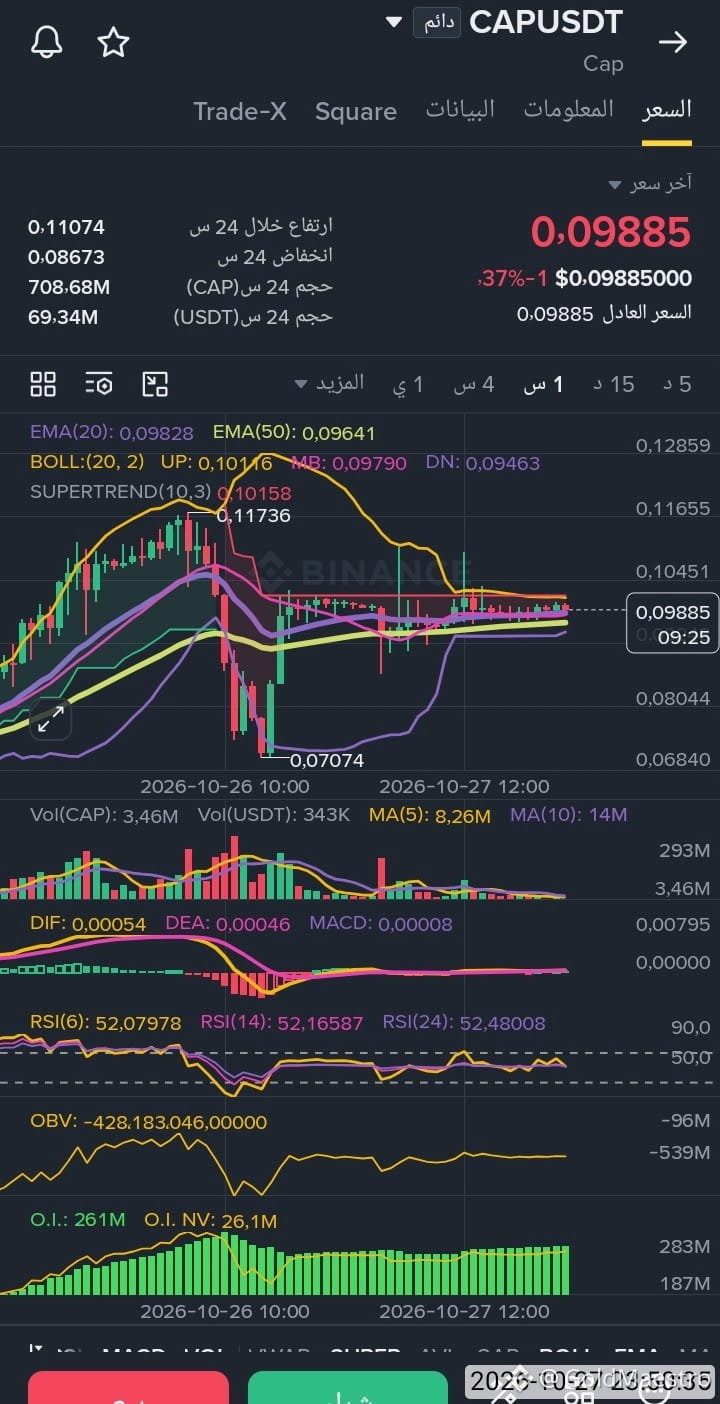
{future}(CAPUSDT), it is still maintaining its bullish outlook, but it is now trading in a tight range on the hourly timeframe. It may then make a sharp move in either direction before resuming its upward trend. However, if it makes a quick, sharp move downward, enter a buy trade after its correction ends. Its targets are the targets of last week's candle, and it may reach further targets if a daily candle closes above $0.133 👇
Regarding the coin $CAP , it is still maintaining its bullish outlook, but it is now trading in a tight range on the hourly timeframe. It may then make a sharp move in either direction before resuming its upward trend. However, if it makes a quick, sharp move downward, enter a buy trade after its correction ends. Its targets are the targets of last week's candle, and it may reach further targets if a daily candle closes above $0.133 👇
المهندس علي الشغممي
·
--
Bullish$CAP Hopefully, it will target today's high with the next hourly candle 👇
The takeaway is that what matters to us is for today's candle to close green, no matter how much they try to manipulate it 👇
The takeaway is that what matters to us is for today's candle to close green, no matter how much they try to manipulate it 👇
287
·
--
Bullish
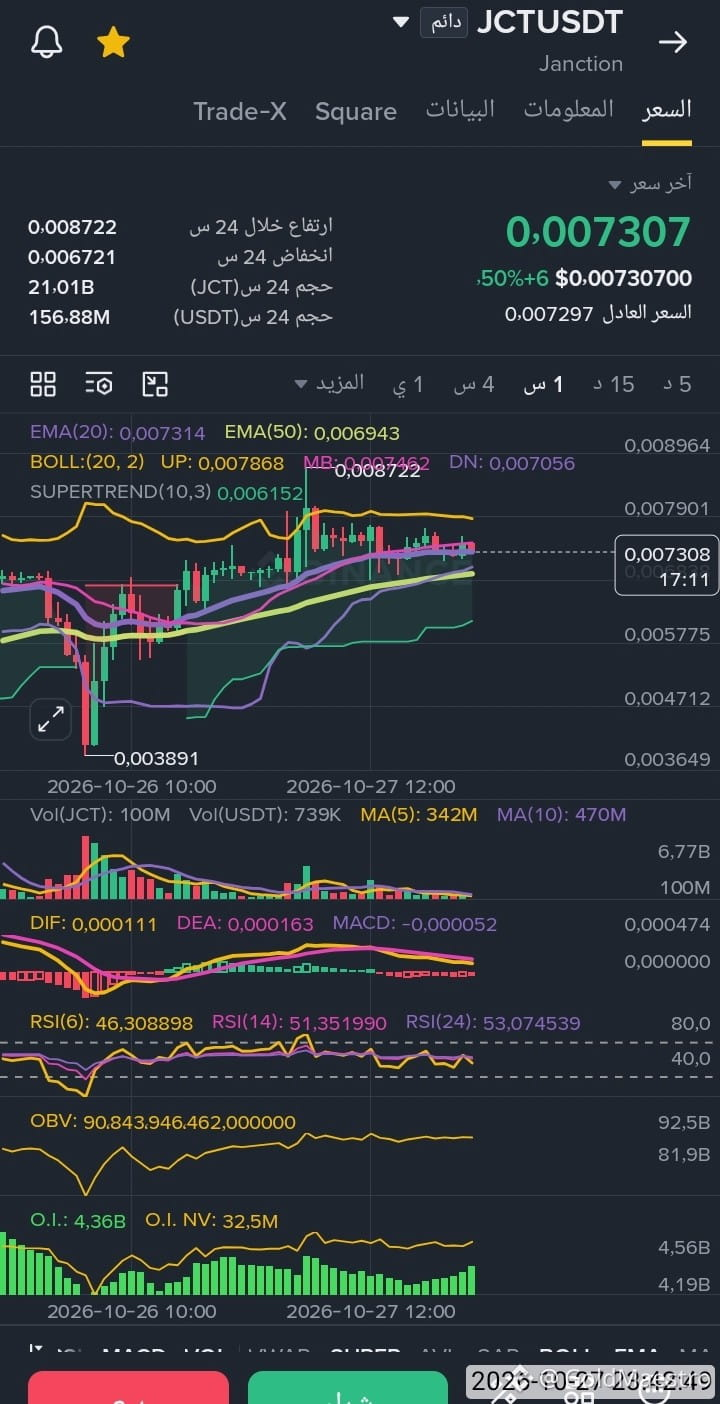
$JCT This coin is still in a period of high volatility, so it’s preferable to enter a buy position during the next pullback. Entry points may be around $0.0040, unless a green hourly candle forms near $0.006 with clear liquidity flowing in; then we could enter with a portion at this price. As for its upcoming targets, it could break its all-time high and may drop a zero during the next rally. This is likely with this week’s candle, and before the October candle closes, the price may break above $0.012 👇
$JCT This coin is still in a period of high volatility, so it’s preferable to enter a buy position during the next pullback. Entry points may be around $0.0040, unless a green hourly candle forms near $0.006 with clear liquidity flowing in; then we could enter with a portion at this price. As for its upcoming targets, it could break its all-time high and may drop a zero during the next rally. This is likely with this week’s candle, and before the October candle closes, the price may break above $0.012 👇
3
3
815
·
--
Bearish
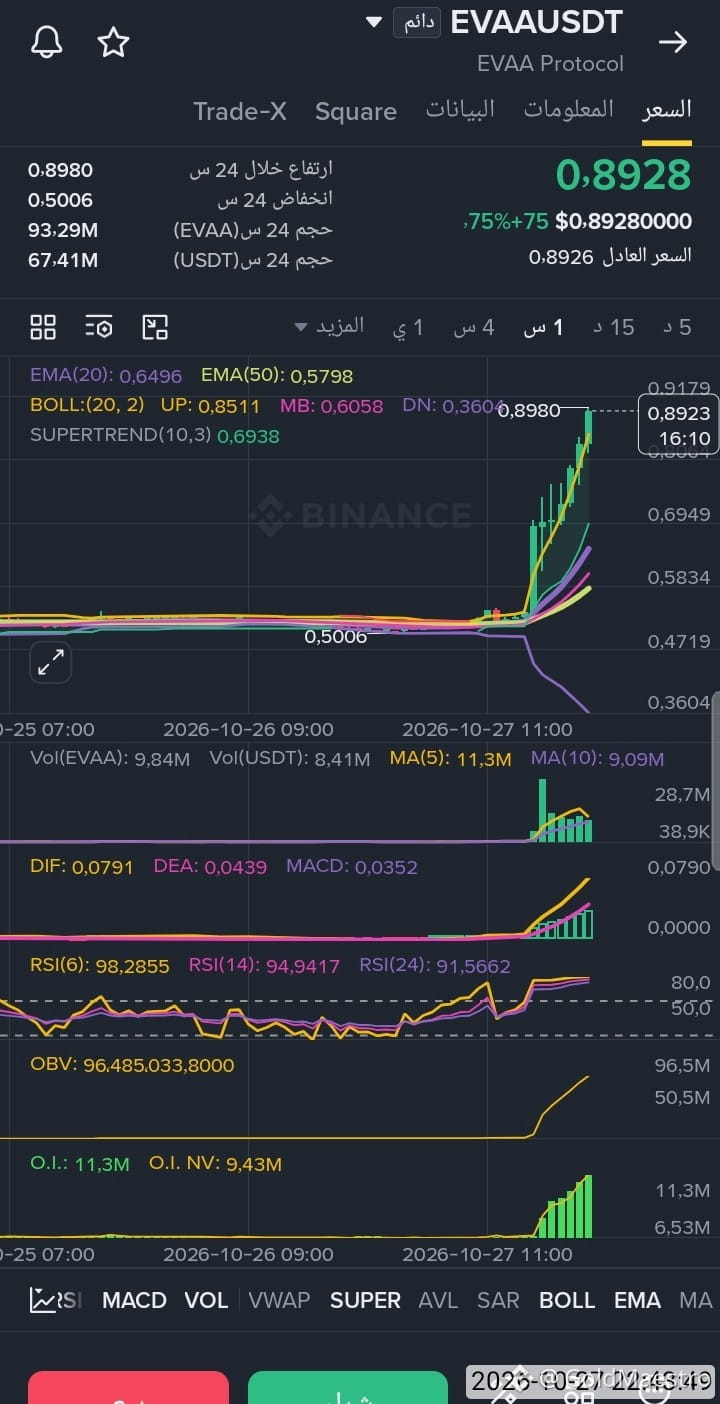
$EVAA According to the volume indicator, most of the liquidity entered all at once in a one-hour candle, which is not ideal. The liquidity entered about seven hours ago. Now, despite the price rising, the liquidity in the latest one-hour candle shows clear weakness. But as we agreed, it’s best not to enter any trade without confirmation. A bearish reversal is only confirmed when a red one-hour candle closes. Its immediate resistance is $0.93. If it fails to break through, we could enter a short trade near that level rather than waiting for the correction to be confirmed before selling 👇
{future}(EVAAUSDT)
$EVAA According to the volume indicator, most of the liquidity entered all at once in a one-hour candle, which is not ideal. The liquidity entered about seven hours ago. Now, despite the price rising, the liquidity in the latest one-hour candle shows clear weakness. But as we agreed, it’s best not to enter any trade without confirmation. A bearish reversal is only confirmed when a red one-hour candle closes. Its immediate resistance is $0.93. If it fails to break through, we could enter a short trade near that level rather than waiting for the correction to be confirmed before selling 👇
5
451
·
--
Bullish
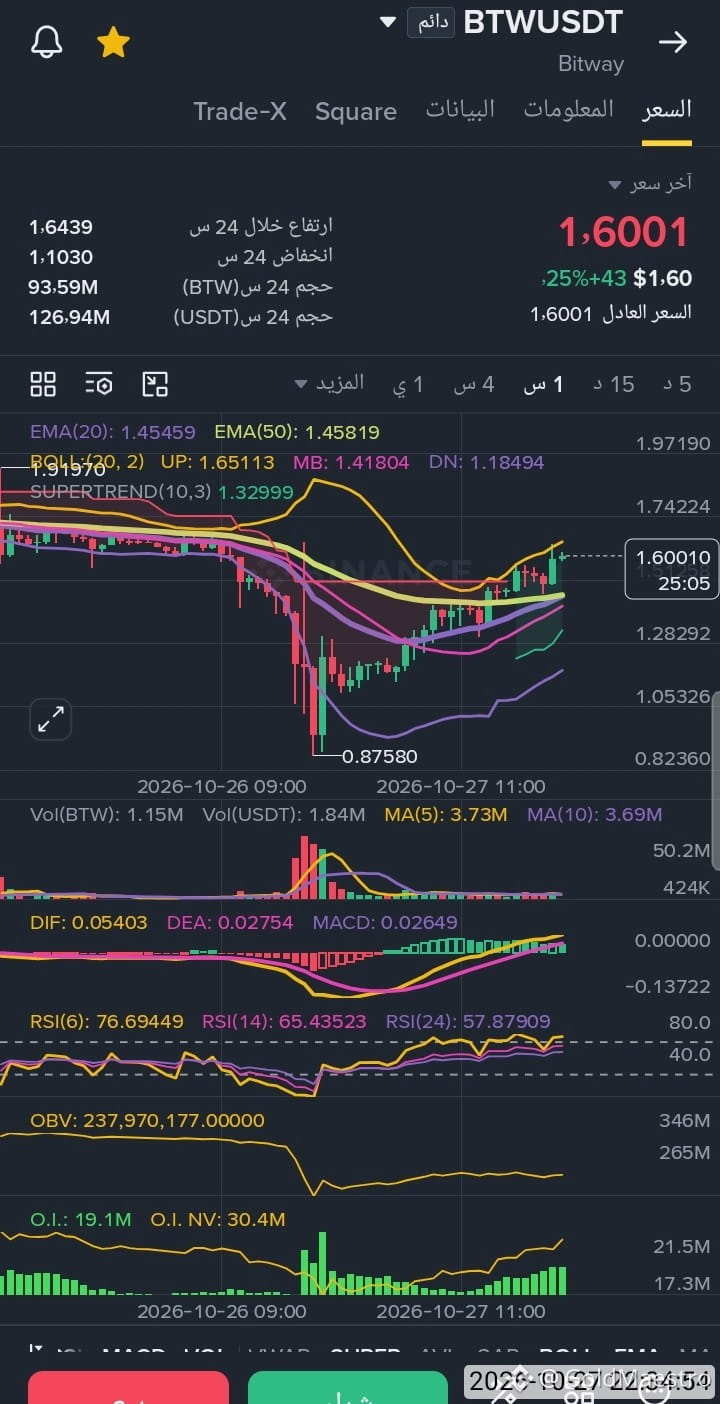
$BTW As for this currency, for those asking about it, it’s in positive territory and may target its previous peak with this week’s candle. By the way, we’re still betting on the targets we agreed on earlier 👇
A note for anyone looking to trade it: stay away from leverage, buy after every sharp drop, and secure your profits after every sharp rise. Right now, it needs to break above $2.1 before any upcoming correction 👇
{future}(BTWUSDT)
$BTW As for this currency, for those asking about it, it’s in positive territory and may target its previous peak with this week’s candle. By the way, we’re still betting on the targets we agreed on earlier 👇
A note for anyone looking to trade it: stay away from leverage, buy after every sharp drop, and secure your profits after every sharp rise. Right now, it needs to break above $2.1 before any upcoming correction 👇
A note for anyone looking to trade it: stay away from leverage, buy after every sharp drop, and secure your profits after every sharp rise. Right now, it needs to break above $2.1 before any upcoming correction 👇
11
2
577
·
--
Bearish
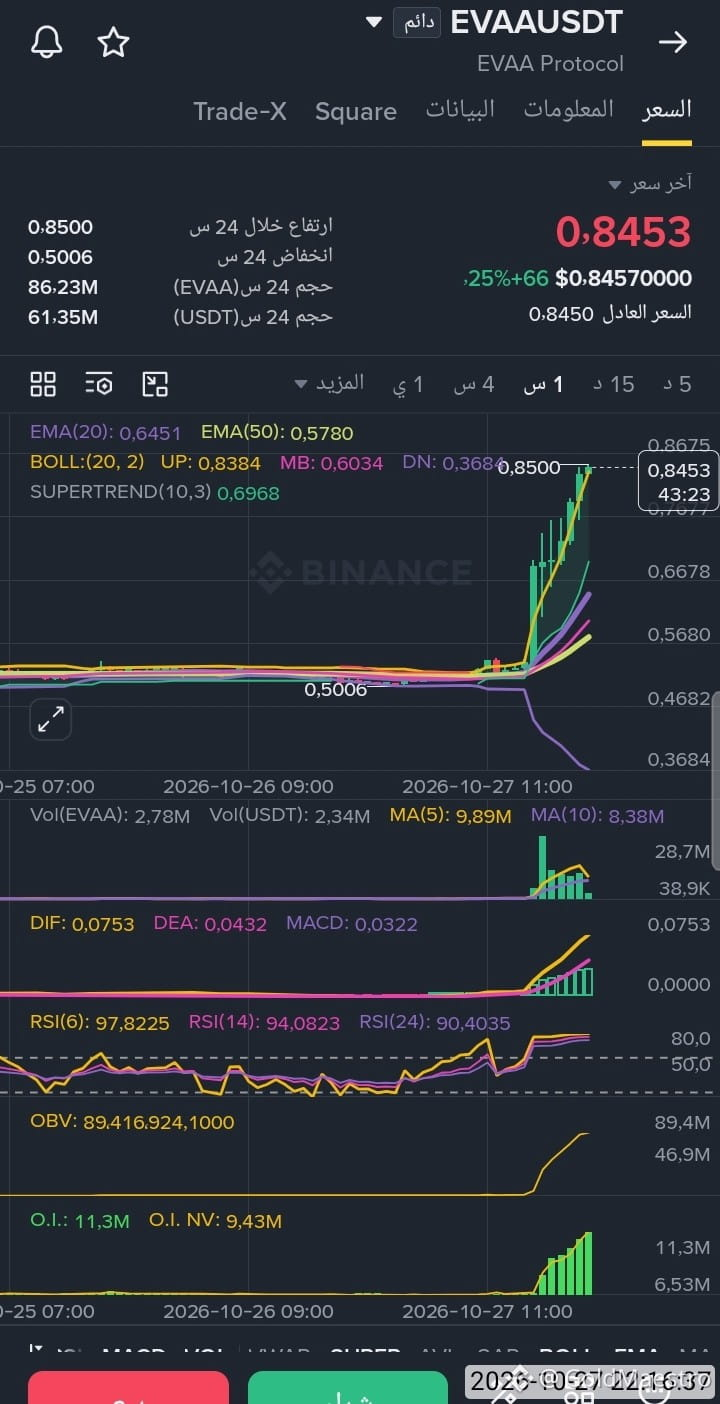
$EVAA As for this asset, it is no longer suitable for buy trades. It also has not shown any bounce from the decline that would allow us to enter a sell trade 👇
Summary: If it fails to break through the short-term resistance at $0.93, we could enter a sell trade, or wait for a red hourly candle to close before entering a sell trade 👇
Note: Do not enter a sell trade unless a red hourly candle has closed 👇
Summary: If it fails to break through the short-term resistance at $0.93, we could enter a sell trade, or wait for a red hourly candle to close before entering a sell trade 👇
Note: Do not enter a sell trade unless a red hourly candle has closed 👇
2
2
370
·
--
Bullish
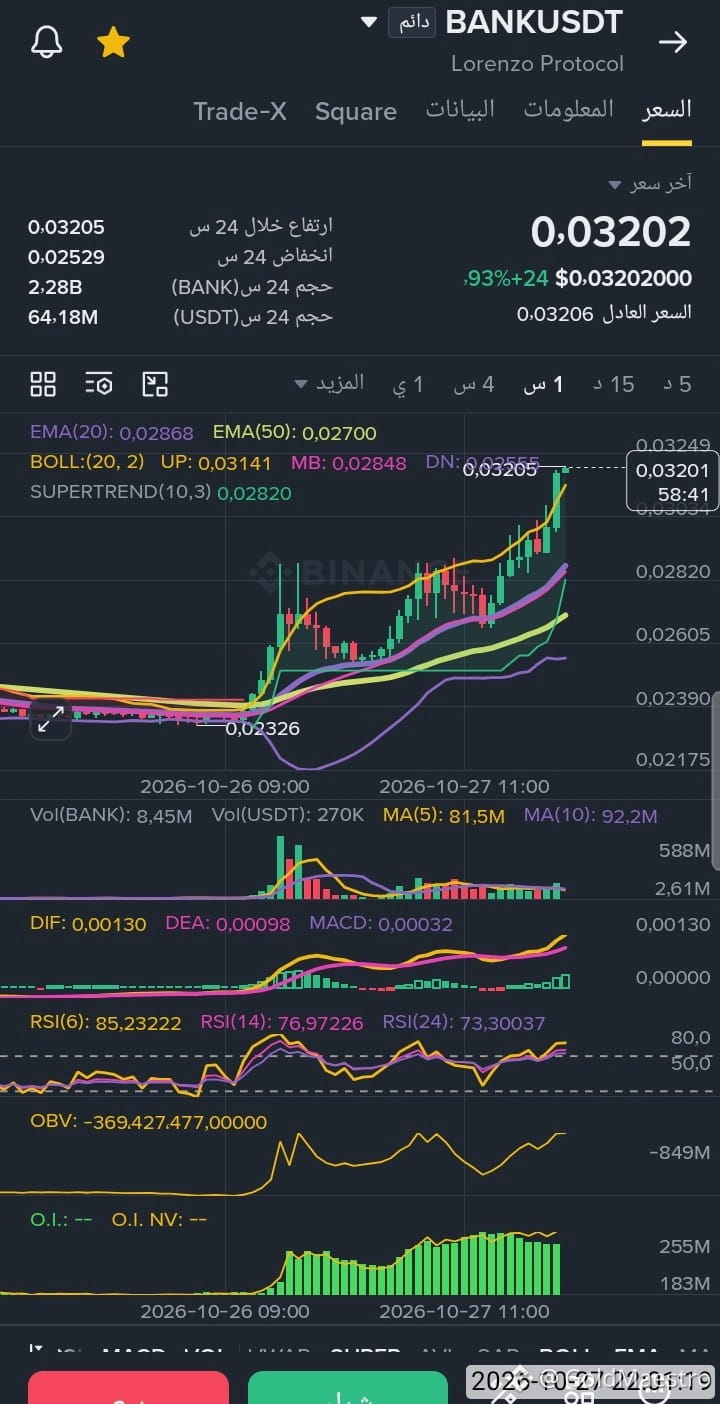
$BANK Although it saw excellent liquidity inflows today, in a gradual and steady manner, it is preferable to secure profits at the first target of $0.0380 if it fails to close a full one-hour candle above $0.042. Its second resistance is $0.063, which is the most important level for ensuring the uptrend continues. Following the same progression, a daily candle must close above $0.063 👇
Note: It is in a positive medium-term range, but it is preferable to scalp it—entering after each correction and securing profits after each upward surge 👇
{future}(BANKUSDT)
$BANK Although it saw excellent liquidity inflows today, in a gradual and steady manner, it is preferable to secure profits at the first target of $0.0380 if it fails to close a full one-hour candle above $0.042. Its second resistance is $0.063, which is the most important level for ensuring the uptrend continues. Following the same progression, a daily candle must close above $0.063 👇
Note: It is in a positive medium-term range, but it is preferable to scalp it—entering after each correction and securing profits after each upward surge 👇
Note: It is in a positive medium-term range, but it is preferable to scalp it—entering after each correction and securing profits after each upward surge 👇
300
·
--
Bearish
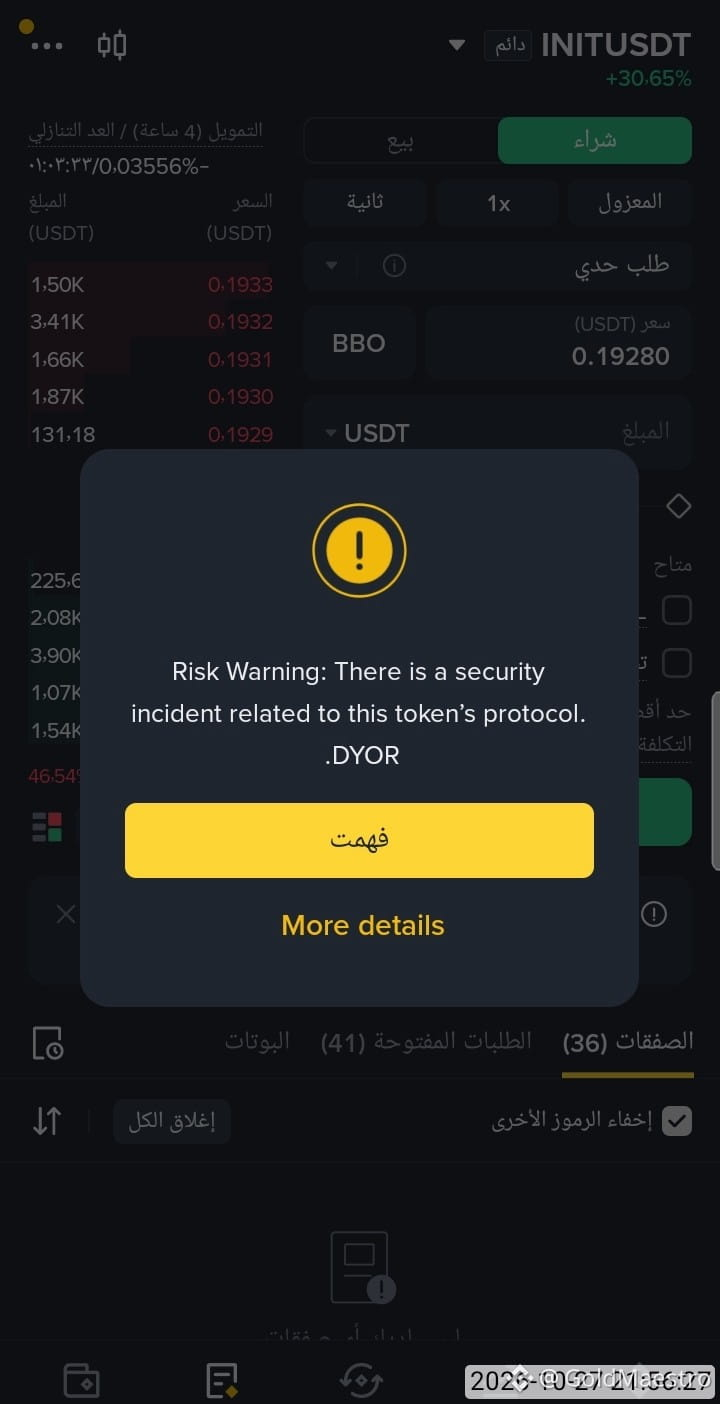
$INIT 🚨⚠️ Important warning for INIT traders... Is the rally hiding greater risks?! 📉
$INIT is showing a security warning on the Binance platform, indicating a security incident related to the coin’s protocol. 🔐
⚠️ Despite the price rising by around 30%, remember that a rally doesn’t mean the risks have disappeared, and the security issue could affect investor confidence and price movements.
📌 My advice: Don’t rush into buying, and don’t chase green candles before checking the latest official updates.
💬 Question for discussion: Do you see INIT’s rally as a trading opportunity, or does the security warning call for caution and patience?
#استراتيجية_الصمود_الذهبي
#INIT #Binance #Crypto #العملات_الرقمية
214
·
--
Bullish
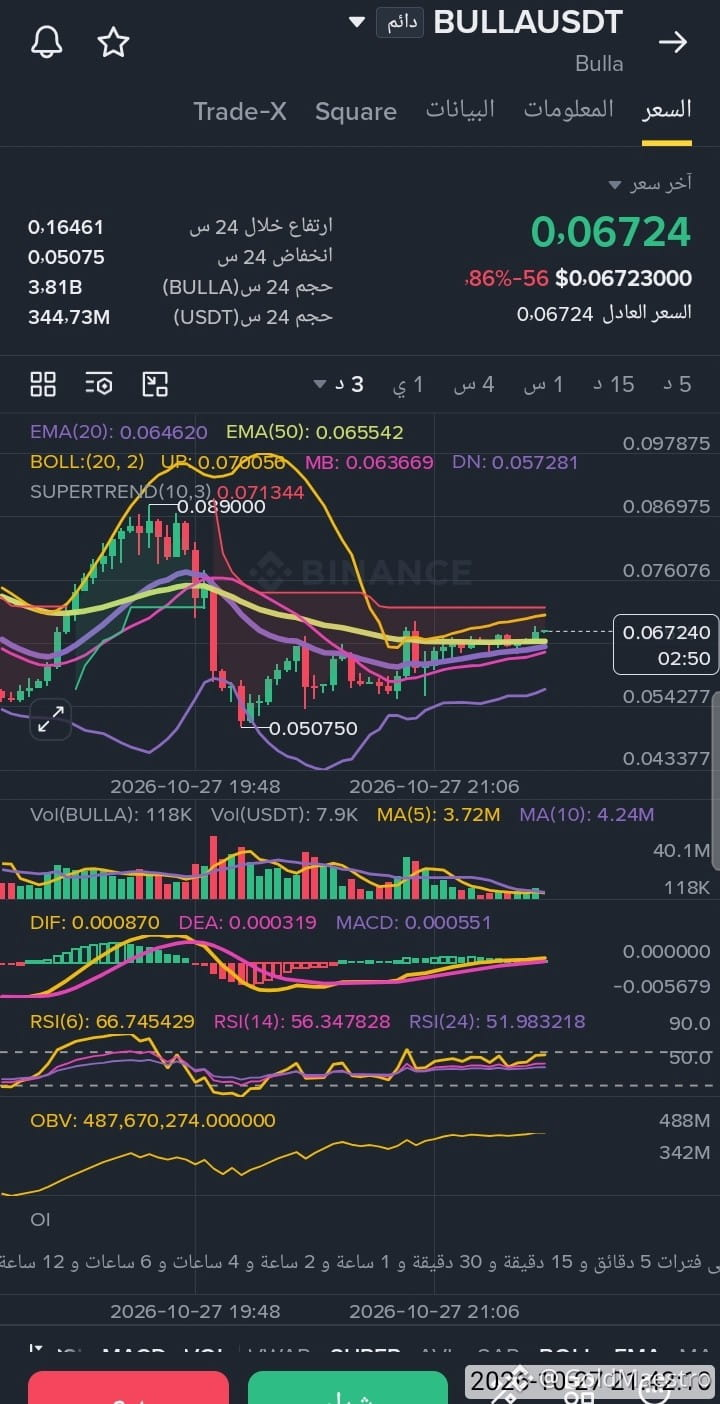
$BULLA Based on the 3m timeframe, it could target $0.077. If it fails to break above $0.077 as the hourly candle is nearing its close, we can secure our profits near $0.077, wait for the next correction, and enter a new buy trade 👇
In short, if a red 3m candle forms near $0.077, we can secure our profits there, wait for a short-term correction, and enter another buy trade near $0.046 👇
Note: If the price continues to rise, we can hold until it gets close to $0.088 👇
In short, if a red 3m candle forms near $0.077, we can secure our profits there, wait for a short-term correction, and enter another buy trade near $0.046 👇
Note: If the price continues to rise, we can hold until it gets close to $0.088 👇
304
·
--
Bearish
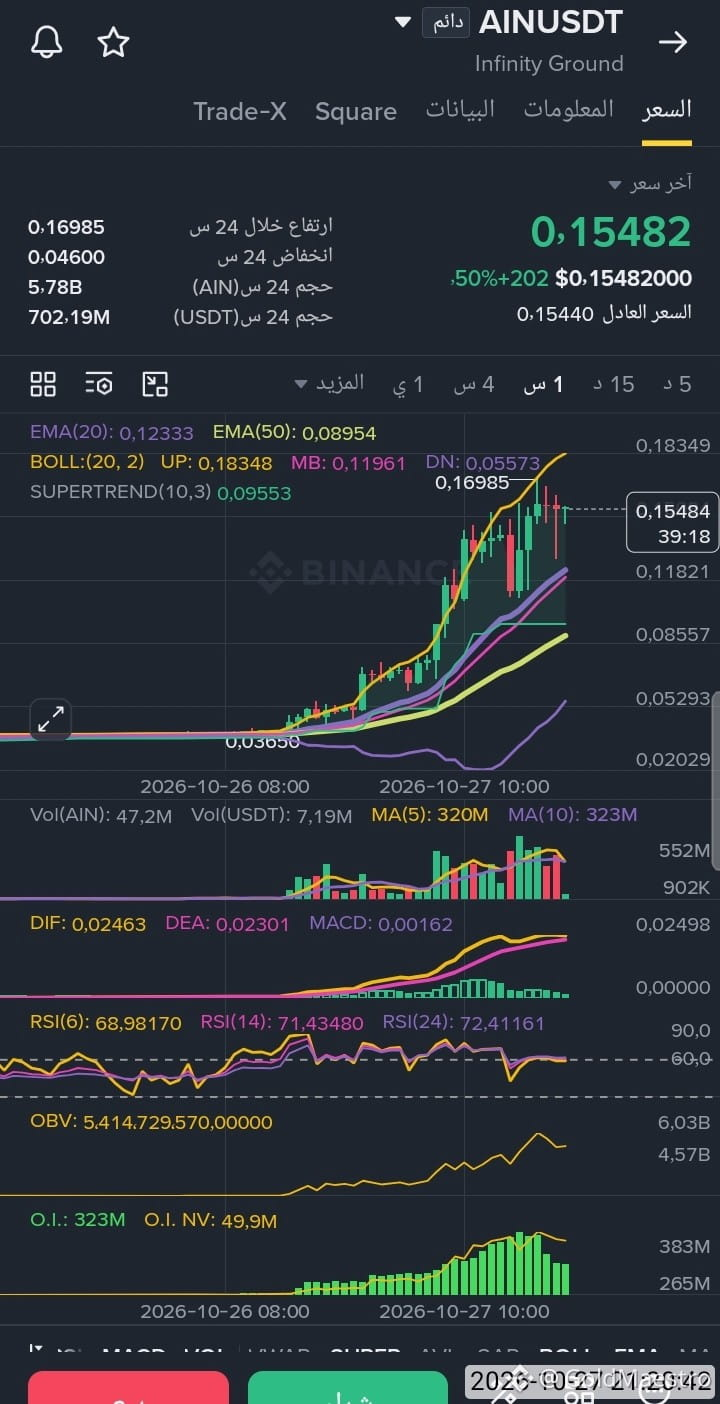
$AIN The weakness in its upward movement is clearly apparent, which makes a correction more likely. It’s best to secure profits on long positions and wait for the next correction. Do not enter a long position now—even if you notice it rising, the move may be weak or a false breakout. Its current resistance is $0.17 👇
As for me, I closed my position in it and am waiting for the next correction. We’ll see how far it corrects and decide what to do with it based on tomorrow’s candle, Wednesday, October 28, 2026.
As for me, I closed my position in it and am waiting for the next correction. We’ll see how far it corrects and decide what to do with it based on tomorrow’s candle, Wednesday, October 28, 2026.
2
212
·
--
Bearish
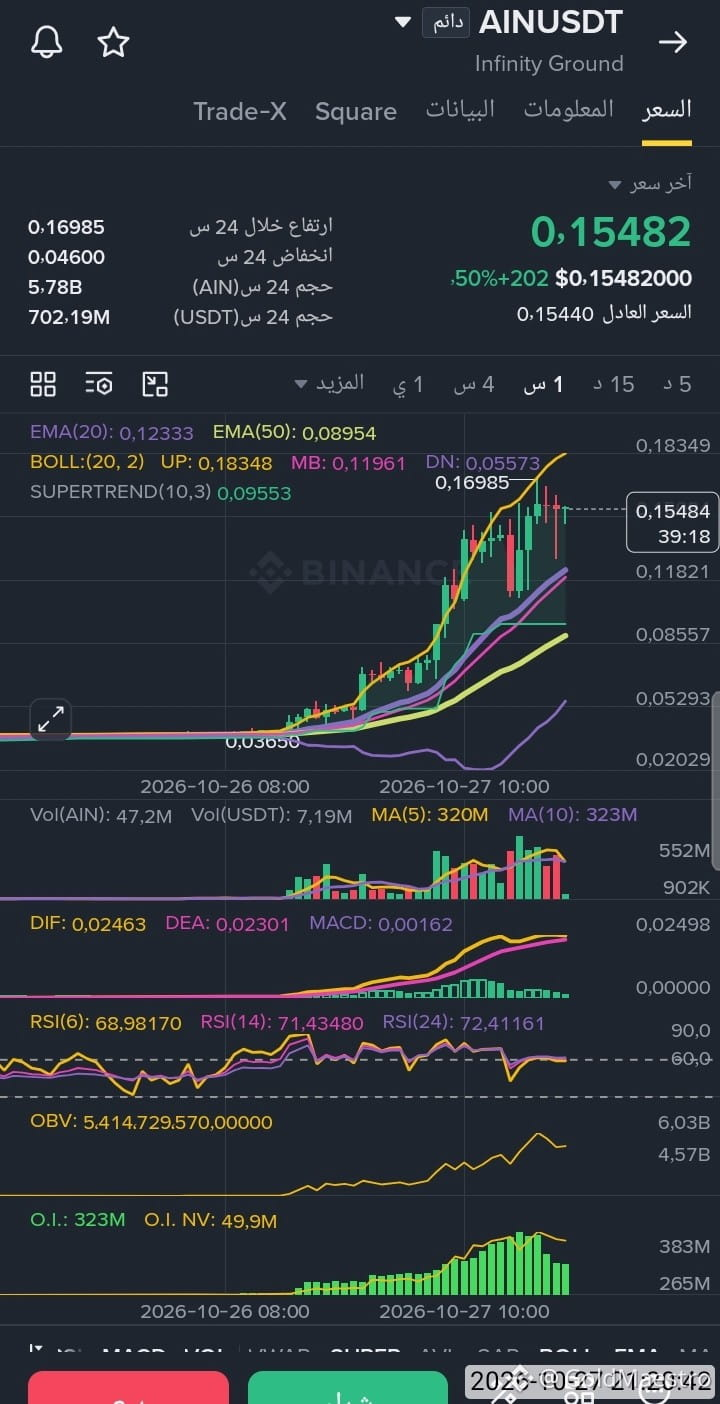
$AIN Those who entered it in a previous buy trade are advised to secure their profits and not hold on for too long, as it may enter a moderate correction phase before continuing its upward move 👇
In short, it’s preferable to secure profits above $0.155 and wait for the next correction, as it may correct around the close of the next hourly candle 👇
Its immediate resistance may be $0.17
In short, it’s preferable to secure profits above $0.155 and wait for the next correction, as it may correct around the close of the next hourly candle 👇
Its immediate resistance may be $0.17
184
·
--
Bullish
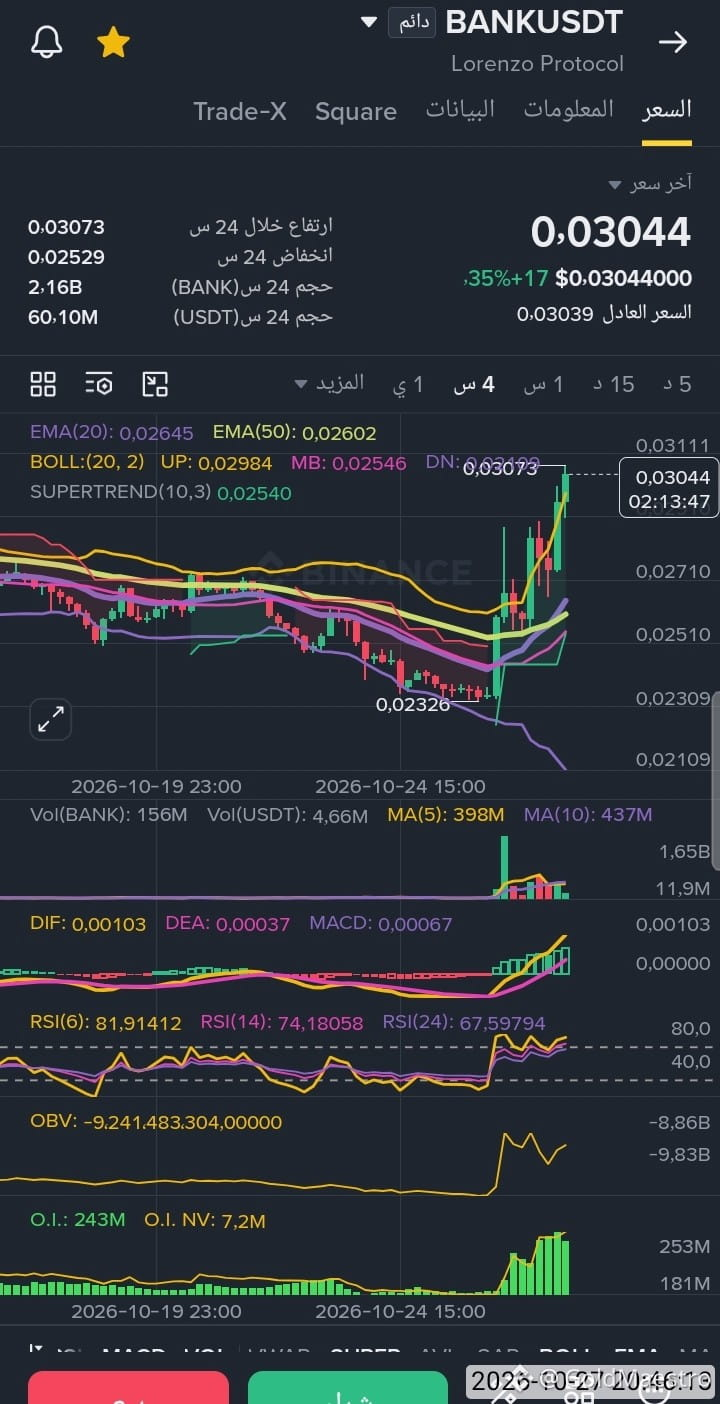
$BANK However, this coin continues to show steady short-term bullish momentum, so its first target is $0.0380, followed by a test of the $0.063 resistance, its most important resistance level 👇
Note: It is still trading in a narrow range on the daily timeframes, so its fluctuations may remain limited until a full daily candle closes above the $0.063 resistance 👇
Note: It is still trading in a narrow range on the daily timeframes, so its fluctuations may remain limited until a full daily candle closes above the $0.063 resistance 👇
3
397
·
--
Bearish
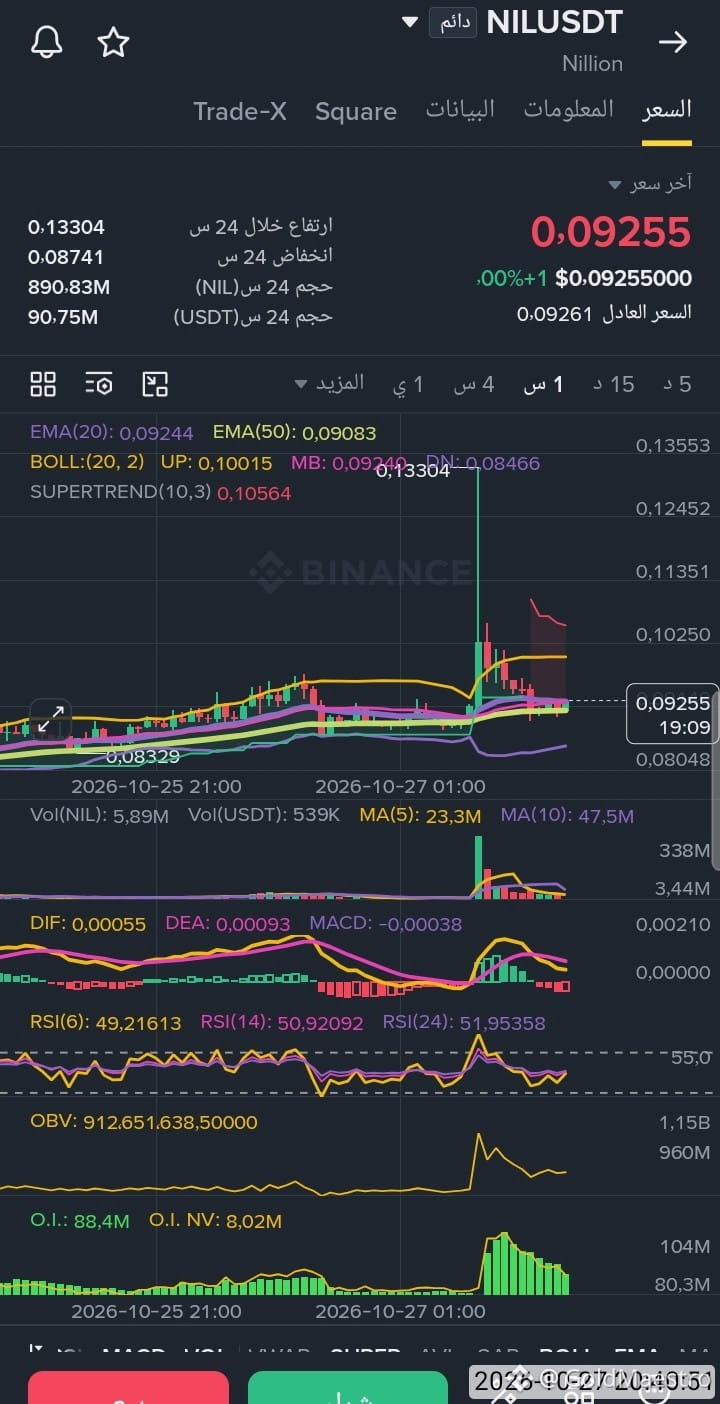
$NIL As for this coin, it’s showing clear rejection of an upward move, for those asking me about it. It may now face short-term resistance on the hourly chart near $0.103, and could also enter a narrow range with a downward bias. So it’s not advisable to enter at this point 👇
$NIL As for this coin, it’s showing clear rejection of an upward move, for those asking me about it. It may now face short-term resistance on the hourly chart near $0.103, and could also enter a narrow range with a downward bias. So it’s not advisable to enter at this point 👇
7
1
201
·
--
Bullish
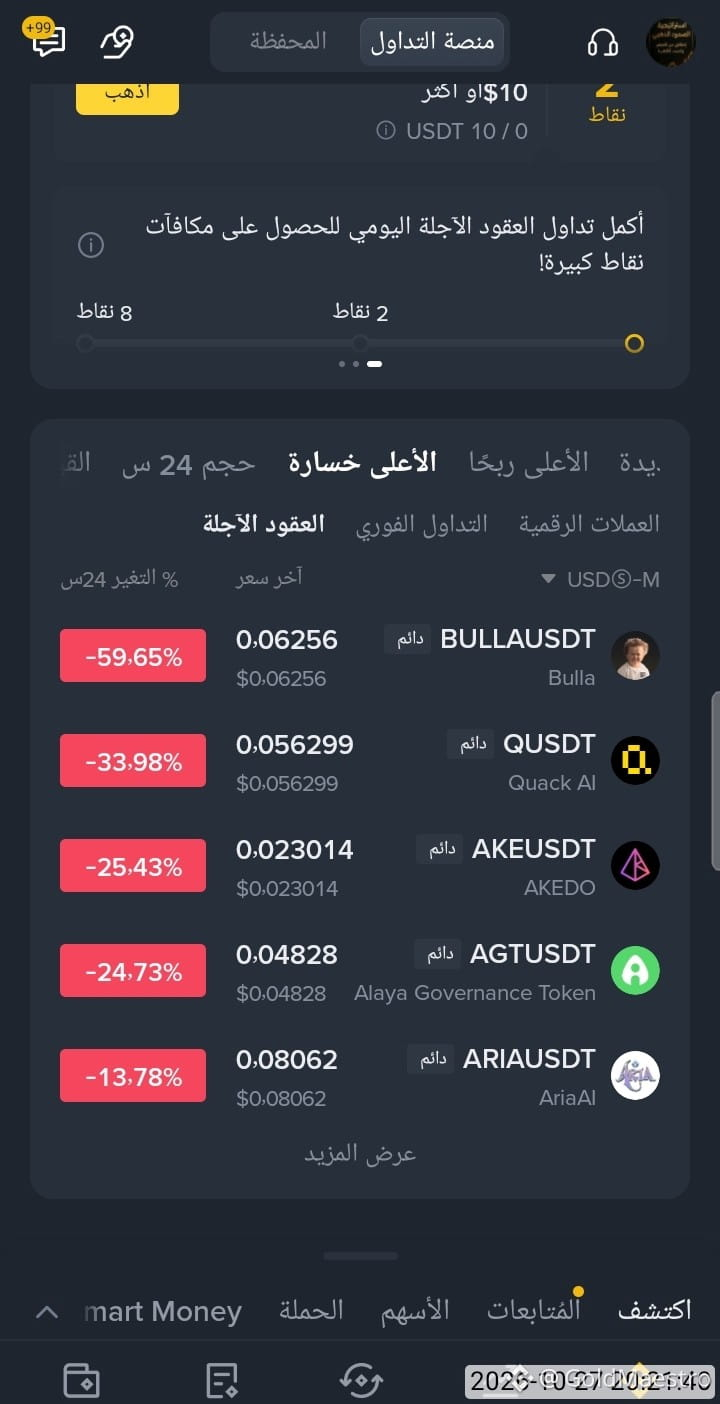
$Q , along with $BULLA , were among the top gainers twenty-four hours ago, but today it’s the exact opposite: they’re among the top losers. That’s crypto for you! Yesterday, we were anxious and hoping they’d keep falling, and today it’s the opposite—we’re hoping they’ll rise. Are we entering against the trend, or does the trend just reverse on us after we enter? 👇
The takeaway: Stick to a specific strategy and let the markets do whatever they want. The advantage of long trades is that you can manage your position if the trend turns against you. Short trades, on the other hand, force you to watch the fluctuations without being able to do anything until your position closes at a loss or with the smallest profit possible. If short trades were safe, we’d still be in them now. 👇
I wonder what the daily close will look like for these coins.
Could they close today’s candle in the green, or is that impossible? We’ll keep watching over the coming hours as the close approaches. 👇
3
4
593
·
--
Bullish
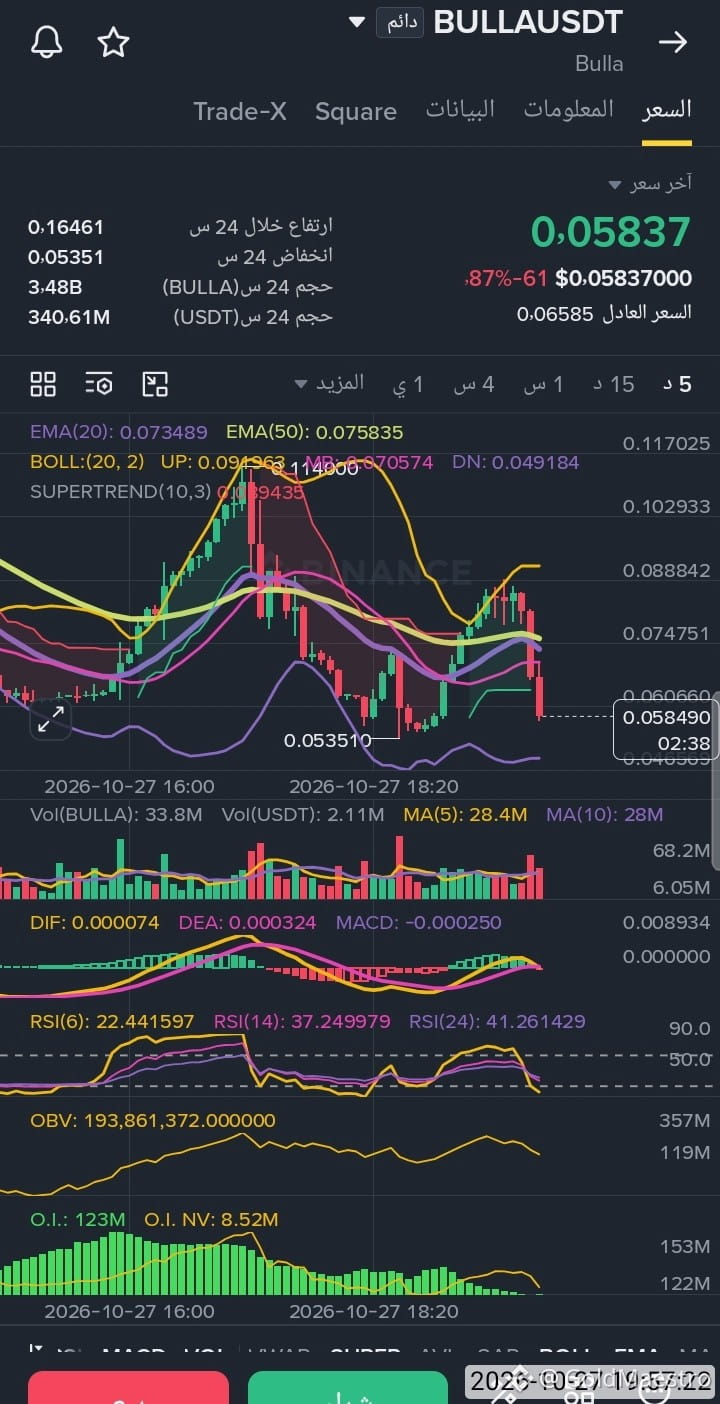
$BULLA And so the story continues. We may enter with a new buy trade after the current hourly candle closes, near $0.0506, and secure profits as the next hourly candle closes or near $0.0880 👇
$BULLA And so the story continues. We may enter with a new buy trade after the current hourly candle closes, near $0.0506, and secure profits as the next hourly candle closes or near $0.0880 👇
1
271
Log in to explore more content
Join global crypto users on Binance Square
⚡️ Get latest and useful information about crypto.
💬 Trusted by the world’s largest crypto exchange.
👍 Discover real insights from verified creators.
Email / Phone number