
god-crypto
349 Posts

god-crypto
Report
Block User
关注我每日更新最新策略,胜率高达90%
Open Trade
Frequent Trader
4 Years
128 Following
81 Followers
99 Liked
Posts
Portfolio
All
Quotes
Videos
·
--
$BREV perpetual unusual-activity alert: 24-hour trading volume surged to 34.70M (24H +75.74%, 1H -3.52%).
The current price is hovering around 0.1014. The contract order book has detected unusual strong buying activity (a rapid 1H drop of -3.52%; open interest plunged -4.6% in 1H as leveraged positions were liquidated; negative funding rate squeeze alert: -0.291%).
The contract trend is predominantly bullish: if the price holds near 0.0573 on a pullback, consider following the trend and going long, with a defensive stop-loss at 0.055008 if the setup is invalidated.
Keep a close eye on whether the price breaks through the 0.1383 resistance above. If it holds, follow the trend toward 0.15707 to 0.203462, and remember to raise your protective stops in stages as it reaches those levels.
Huge spikes in trading volume often come with sharp wick-driven shakeouts. Are you bullish or bearish on this BREVUSDT move?
Asset to watch: $MMT
#BREV合约信号 #合约交易 #Binance Square
Personal opinion only; this is not investment advice. DYOR
$BREV perpetual unusual-activity alert: 24-hour trading volume surged to 34.70M (24H +75.74%, 1H -3.52%).
The current price is hovering around 0.1014. The contract order book has detected unusual strong buying activity (a rapid 1H drop of -3.52%; open interest plunged -4.6% in 1H as leveraged positions were liquidated; negative funding rate squeeze alert: -0.291%).
The contract trend is predominantly bullish: if the price holds near 0.0573 on a pullback, consider following the trend and going long, with a defensive stop-loss at 0.055008 if the setup is invalidated.
Keep a close eye on whether the price breaks through the 0.1383 resistance above. If it holds, follow the trend toward 0.15707 to 0.203462, and remember to raise your protective stops in stages as it reaches those levels.
Huge spikes in trading volume often come with sharp wick-driven shakeouts. Are you bullish or bearish on this BREVUSDT move?
Asset to watch: $MMT
#BREV合约信号 #合约交易 #Binance Square
Personal opinion only; this is not investment advice. DYOR
The current price is hovering around 0.1014. The contract order book has detected unusual strong buying activity (a rapid 1H drop of -3.52%; open interest plunged -4.6% in 1H as leveraged positions were liquidated; negative funding rate squeeze alert: -0.291%).
The contract trend is predominantly bullish: if the price holds near 0.0573 on a pullback, consider following the trend and going long, with a defensive stop-loss at 0.055008 if the setup is invalidated.
Keep a close eye on whether the price breaks through the 0.1383 resistance above. If it holds, follow the trend toward 0.15707 to 0.203462, and remember to raise your protective stops in stages as it reaches those levels.
Huge spikes in trading volume often come with sharp wick-driven shakeouts. Are you bullish or bearish on this BREVUSDT move?
Asset to watch: $MMT
#BREV合约信号 #合约交易 #Binance Square
Personal opinion only; this is not investment advice. DYOR
69
·
--
$XRP Contract order book bullish signal triggered (high-volume breakout/pressing against 24H high resistance; 1H volatility breakout expansion 2.2x; strong confluence for a long entry (68 points) | Signal: 68 points)
Current price: 1.002 (24H +4.31%, 1H +1.63%). XRPUSDT’s volume and order book structure are tilting bullish.
Rather than blindly chasing highs, a cautious approach would be to wait for a pullback to 0.9456 to stabilize, then try a small long position, with a protective stop at 0.937075.
First watch how price handles resistance in the 1.0048–1.0799 range. If it breaks through on high volume, the next target is 1.1448.
Cut your losses if support breaks—don’t stubbornly hold on. Are you planning to place a long order in advance, or wait for a breakout before entering?
#XRP合约信号 #合约交易 #BinanceSquare
Personal opinion only; not investment advice. DYOR
$XRP Contract order book bullish signal triggered (high-volume breakout/pressing against 24H high resistance; 1H volatility breakout expansion 2.2x; strong confluence for a long entry (68 points) | Signal: 68 points)
Current price: 1.002 (24H +4.31%, 1H +1.63%). XRPUSDT’s volume and order book structure are tilting bullish.
Rather than blindly chasing highs, a cautious approach would be to wait for a pullback to 0.9456 to stabilize, then try a small long position, with a protective stop at 0.937075.
First watch how price handles resistance in the 1.0048–1.0799 range. If it breaks through on high volume, the next target is 1.1448.
Cut your losses if support breaks—don’t stubbornly hold on. Are you planning to place a long order in advance, or wait for a breakout before entering?
#XRP合约信号 #合约交易 #BinanceSquare
Personal opinion only; not investment advice. DYOR
Current price: 1.002 (24H +4.31%, 1H +1.63%). XRPUSDT’s volume and order book structure are tilting bullish.
Rather than blindly chasing highs, a cautious approach would be to wait for a pullback to 0.9456 to stabilize, then try a small long position, with a protective stop at 0.937075.
First watch how price handles resistance in the 1.0048–1.0799 range. If it breaks through on high volume, the next target is 1.1448.
Cut your losses if support breaks—don’t stubbornly hold on. Are you planning to place a long order in advance, or wait for a breakout before entering?
#XRP合约信号 #合约交易 #BinanceSquare
Personal opinion only; not investment advice. DYOR
133
·
--
$MMT Perpetual Market Alert: 24-hour trading volume hit 25.30M (24H +104.11%, 1H +6.24%)
The current price is hovering around 0.2335. The contract order book has detected a strong long-side move (1H sudden surge of +6.24%; breakout on heavy volume, hugging the 24H high resistance; unusual volume spike of 4.9x).
The contract trend is predominantly bullish: if the price holds around 0.1125 on a pullback, consider going long with the trend, with a protective stop-loss at 0.108 to cut losses if the setup fails.
Keep a close eye on the breakout at the 0.239 resistance above. If the price holds above it, the next levels to watch are 0.3841 to 0.5096. Remember to move your protection up in stages as the price reaches those levels.
Huge volume spikes often come with violent wicks and shakeouts. Are you bullish or bearish on this MMTUSDT move?
#MMT合约信号 #合约交易 # Binance Square
These are only my personal opinions and not investment advice. DYOR.
$MMT Perpetual Market Alert: 24-hour trading volume hit 25.30M (24H +104.11%, 1H +6.24%)
The current price is hovering around 0.2335. The contract order book has detected a strong long-side move (1H sudden surge of +6.24%; breakout on heavy volume, hugging the 24H high resistance; unusual volume spike of 4.9x).
The contract trend is predominantly bullish: if the price holds around 0.1125 on a pullback, consider going long with the trend, with a protective stop-loss at 0.108 to cut losses if the setup fails.
Keep a close eye on the breakout at the 0.239 resistance above. If the price holds above it, the next levels to watch are 0.3841 to 0.5096. Remember to move your protection up in stages as the price reaches those levels.
Huge volume spikes often come with violent wicks and shakeouts. Are you bullish or bearish on this MMTUSDT move?
#MMT合约信号 #合约交易 # Binance Square
These are only my personal opinions and not investment advice. DYOR.
The current price is hovering around 0.2335. The contract order book has detected a strong long-side move (1H sudden surge of +6.24%; breakout on heavy volume, hugging the 24H high resistance; unusual volume spike of 4.9x).
The contract trend is predominantly bullish: if the price holds around 0.1125 on a pullback, consider going long with the trend, with a protective stop-loss at 0.108 to cut losses if the setup fails.
Keep a close eye on the breakout at the 0.239 resistance above. If the price holds above it, the next levels to watch are 0.3841 to 0.5096. Remember to move your protection up in stages as the price reaches those levels.
Huge volume spikes often come with violent wicks and shakeouts. Are you bullish or bearish on this MMTUSDT move?
#MMT合约信号 #合约交易 # Binance Square
These are only my personal opinions and not investment advice. DYOR.
138
·
--
Article
$BREV Perpetual Futures Long Watch: Signal Details and Key Stop-Loss LevelsCreate a concise mobile-friendly $BREV (BREVUSDT) futures order book review. Skip the fluff and get straight to the key levels:
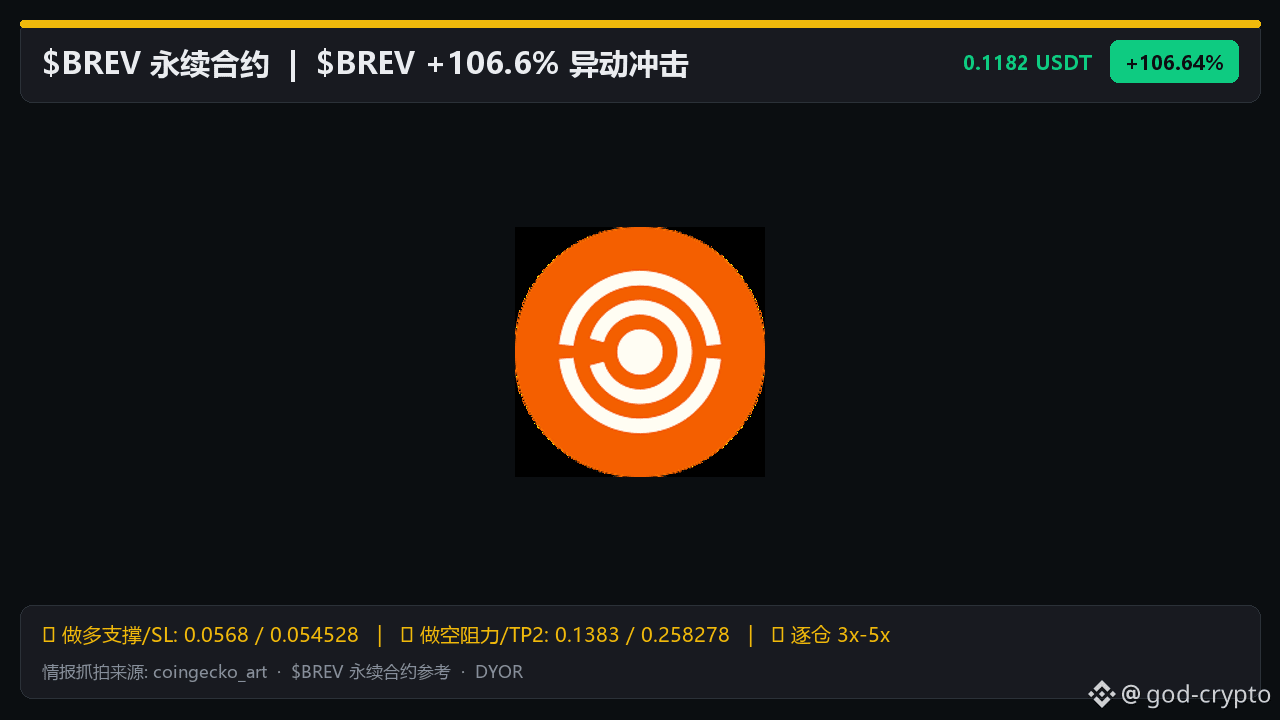
Current price 0.1182 (24H +106.64%, 1H +3.32%). The current quant and abnormal-move models give a [strong long trigger score of 99] | Abnormal-move triggers: 1H sudden surge +3.32%; 1H open interest spike +15.3%, indicating major-player accumulation; negative funding rate short-squeeze alert -0.253%. Derivatives indicators for reference: Contract long signal score 99 | 1H change +3.32% | Real-time anomaly (score 99): 1H sudden surge +3.32%; 1H open interest spike +15.3%, indicating major-player accumulation; negative funding rate short-squeeze alert -0.253% | 4H momentum +7.65% | Perpetual funding rate -0.2534% | 1H open interest change +15.26% | Taker buy/sell ratio 1.10 | Spot-futures basis -2.056% | Contract open interest 14.90M | Top trader long/short ratio 0.93.
$BREV Perpetual Futures Long Watch: Signal Details and Key Stop-Loss Levels
Create a concise mobile-friendly $BREV (BREVUSDT) futures order book review. Skip the fluff and get straight to the key levels:
Current price 0.1182 (24H +106.64%, 1H +3.32%). The current quant and abnormal-move models give a [strong long trigger score of 99] | Abnormal-move triggers: 1H sudden surge +3.32%; 1H open interest spike +15.3%, indicating major-player accumulation; negative funding rate short-squeeze alert -0.253%. Derivatives indicators for reference: Contract long signal score 99 | 1H change +3.32% | Real-time anomaly (score 99): 1H sudden surge +3.32%; 1H open interest spike +15.3%, indicating major-player accumulation; negative funding rate short-squeeze alert -0.253% | 4H momentum +7.65% | Perpetual funding rate -0.2534% | 1H open interest change +15.26% | Taker buy/sell ratio 1.10 | Spot-futures basis -2.056% | Contract open interest 14.90M | Top trader long/short ratio 0.93.
Current price 0.1182 (24H +106.64%, 1H +3.32%). The current quant and abnormal-move models give a [strong long trigger score of 99] | Abnormal-move triggers: 1H sudden surge +3.32%; 1H open interest spike +15.3%, indicating major-player accumulation; negative funding rate short-squeeze alert -0.253%. Derivatives indicators for reference: Contract long signal score 99 | 1H change +3.32% | Real-time anomaly (score 99): 1H sudden surge +3.32%; 1H open interest spike +15.3%, indicating major-player accumulation; negative funding rate short-squeeze alert -0.253% | 4H momentum +7.65% | Perpetual funding rate -0.2534% | 1H open interest change +15.26% | Taker buy/sell ratio 1.10 | Spot-futures basis -2.056% | Contract open interest 14.90M | Top trader long/short ratio 0.93.
34
·
--
$SUI Contract order book bullish signal triggered
Current price: 0.7279 (24H +0.28%). SUIUSDT’s volume and order book structure are tilting toward the bulls.
Don’t chase the price blindly. A cautious approach would be to wait for a pullback to 0.706 to stabilize, then try a small long position, with a stop-loss at 0.69772.
First, watch for resistance absorption in the 0.7446–0.764116 range. If the price breaks through on strong volume, the next target is 0.794296.
If support breaks, take the loss—don’t stubbornly hold on. Are you planning to place a long order in advance, or wait for a breakout before entering?
Asset to watch: $MMT
#SUI合约信号 #合约交易 #Binance Square
Personal opinion only; not investment advice. DYOR
$SUI Contract order book bullish signal triggered
Current price: 0.7279 (24H +0.28%). SUIUSDT’s volume and order book structure are tilting toward the bulls.
Don’t chase the price blindly. A cautious approach would be to wait for a pullback to 0.706 to stabilize, then try a small long position, with a stop-loss at 0.69772.
First, watch for resistance absorption in the 0.7446–0.764116 range. If the price breaks through on strong volume, the next target is 0.794296.
If support breaks, take the loss—don’t stubbornly hold on. Are you planning to place a long order in advance, or wait for a breakout before entering?
Asset to watch: $MMT
#SUI合约信号 #合约交易 #Binance Square
Personal opinion only; not investment advice. DYOR
Current price: 0.7279 (24H +0.28%). SUIUSDT’s volume and order book structure are tilting toward the bulls.
Don’t chase the price blindly. A cautious approach would be to wait for a pullback to 0.706 to stabilize, then try a small long position, with a stop-loss at 0.69772.
First, watch for resistance absorption in the 0.7446–0.764116 range. If the price breaks through on strong volume, the next target is 0.794296.
If support breaks, take the loss—don’t stubbornly hold on. Are you planning to place a long order in advance, or wait for a breakout before entering?
Asset to watch: $MMT
#SUI合约信号 #合约交易 #Binance Square
Personal opinion only; not investment advice. DYOR
304
·
--
Article
$BREV Perpetual Contract Long Watch: Signal Details and Boundary Stop-Loss LevelsA concise mobile-friendly $BREV (BREVUSDT) contract order-book review, straight to the key boundaries with no filler:
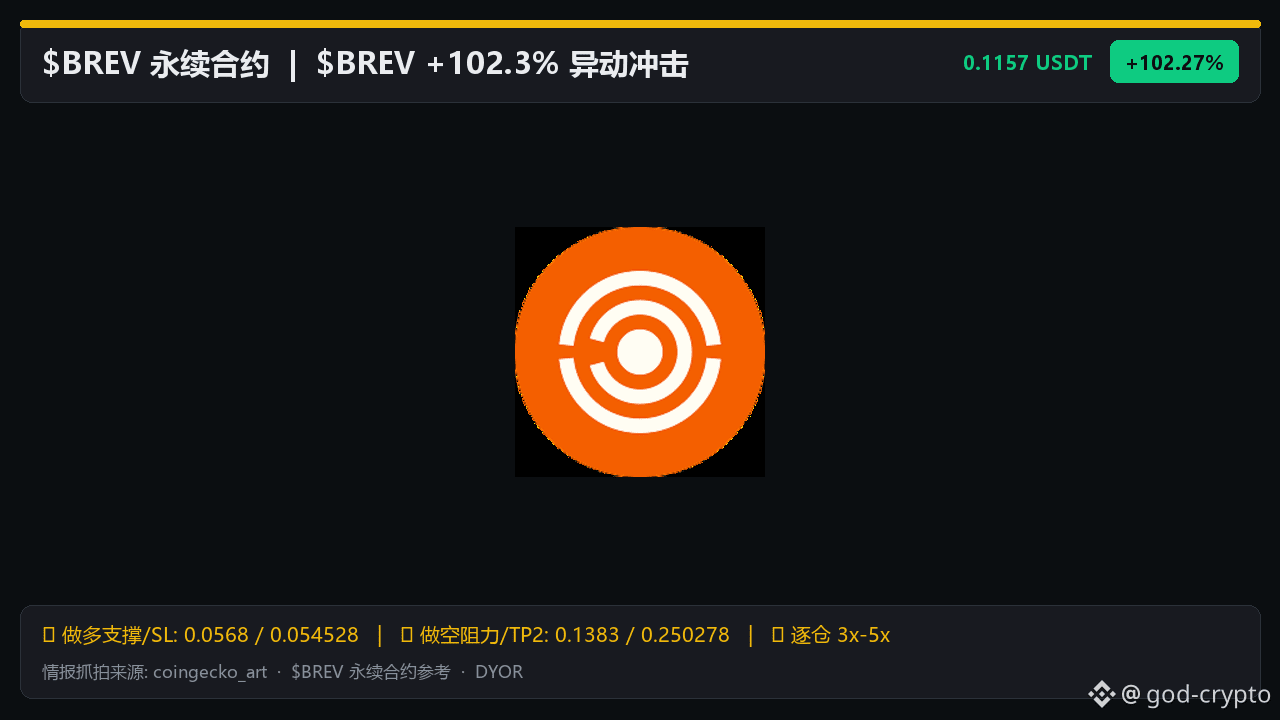
Current price 0.1157 (24H +102.27%); quantitative and anomaly models currently show [Strong Long Trigger: 99 points] | Anomaly triggers: 1H open interest surged +3.2%, indicating major-player accumulation; negative funding rate squeeze alert -0.409%; futures-spot basis anomaly -3.66%. Derivatives indicators for reference: contract long signal 91 points | 1H change +0.78% | Real-time anomaly (99 points): 1H open interest surged +3.2%, indicating major-player accumulation; negative funding rate squeeze alert -0.409%; futures-spot basis anomaly -3.66% | 4H momentum +3.49% | Perpetual funding rate -0.4088% | 1H open interest change +3.25% | Taker buy/sell ratio 1.06 | Futures-spot basis -3.655% | Contract open interest 13.17M | Top trader long/short ratio 0.99.
$BREV Perpetual Contract Long Watch: Signal Details and Boundary Stop-Loss Levels
A concise mobile-friendly $BREV (BREVUSDT) contract order-book review, straight to the key boundaries with no filler:
Current price 0.1157 (24H +102.27%); quantitative and anomaly models currently show [Strong Long Trigger: 99 points] | Anomaly triggers: 1H open interest surged +3.2%, indicating major-player accumulation; negative funding rate squeeze alert -0.409%; futures-spot basis anomaly -3.66%. Derivatives indicators for reference: contract long signal 91 points | 1H change +0.78% | Real-time anomaly (99 points): 1H open interest surged +3.2%, indicating major-player accumulation; negative funding rate squeeze alert -0.409%; futures-spot basis anomaly -3.66% | 4H momentum +3.49% | Perpetual funding rate -0.4088% | 1H open interest change +3.25% | Taker buy/sell ratio 1.06 | Futures-spot basis -3.655% | Contract open interest 13.17M | Top trader long/short ratio 0.99.
Current price 0.1157 (24H +102.27%); quantitative and anomaly models currently show [Strong Long Trigger: 99 points] | Anomaly triggers: 1H open interest surged +3.2%, indicating major-player accumulation; negative funding rate squeeze alert -0.409%; futures-spot basis anomaly -3.66%. Derivatives indicators for reference: contract long signal 91 points | 1H change +0.78% | Real-time anomaly (99 points): 1H open interest surged +3.2%, indicating major-player accumulation; negative funding rate squeeze alert -0.409%; futures-spot basis anomaly -3.66% | 4H momentum +3.49% | Perpetual funding rate -0.4088% | 1H open interest change +3.25% | Taker buy/sell ratio 1.06 | Futures-spot basis -3.655% | Contract open interest 13.17M | Top trader long/short ratio 0.99.
214
·
--
Article
$MMT Perpetual Futures Long Watch: Signal Details and Stop-Loss BoundariesA concise mobile-friendly $MMT (MMTUSDT) futures order book review, getting straight to the key levels without padding:
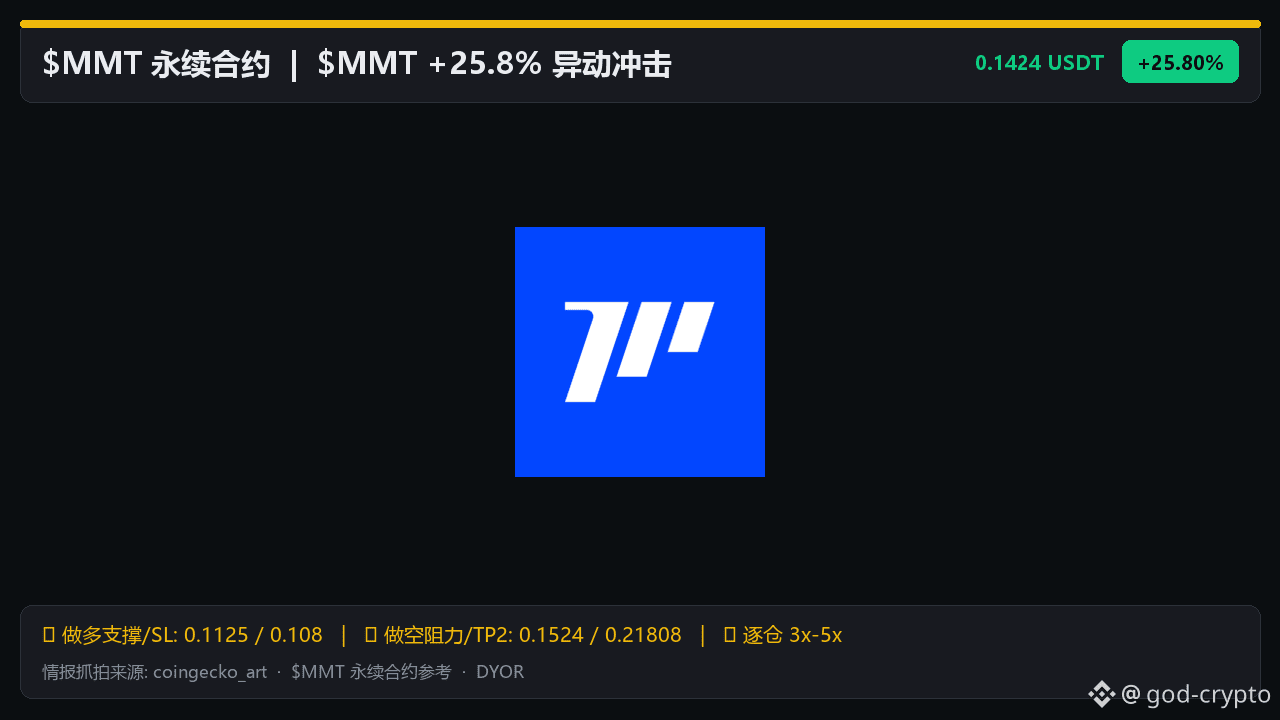
Current price 0.1424 (24H +25.80%). The current quantitative and anomaly models give a [Strong Long Trigger: 72 points]. | Anomaly triggers: aggressive buy orders sweeping the book, Taker=1.32; spot-futures basis anomaly -0.27%; 1H long lower-wick spike swept stops and recovered (lower wick accounts for 69%). Derivatives indicators for reference: futures long signal 58 points | 1H change +0.78% | Real-time anomaly (72 points): aggressive buy orders sweeping the book, Taker=1.32; spot-futures basis anomaly -0.27%; 1H long lower-wick spike swept stops and recovered (lower wick accounts for 69%) | Perpetual funding rate +0.0039% | Aggressive buy/sell ratio 1.32 | Spot-futures basis -0.267% | Futures open interest 9.44M | Top trader long/short ratio 1.74.
$MMT Perpetual Futures Long Watch: Signal Details and Stop-Loss Boundaries
A concise mobile-friendly $MMT (MMTUSDT) futures order book review, getting straight to the key levels without padding:
Current price 0.1424 (24H +25.80%). The current quantitative and anomaly models give a [Strong Long Trigger: 72 points]. | Anomaly triggers: aggressive buy orders sweeping the book, Taker=1.32; spot-futures basis anomaly -0.27%; 1H long lower-wick spike swept stops and recovered (lower wick accounts for 69%). Derivatives indicators for reference: futures long signal 58 points | 1H change +0.78% | Real-time anomaly (72 points): aggressive buy orders sweeping the book, Taker=1.32; spot-futures basis anomaly -0.27%; 1H long lower-wick spike swept stops and recovered (lower wick accounts for 69%) | Perpetual funding rate +0.0039% | Aggressive buy/sell ratio 1.32 | Spot-futures basis -0.267% | Futures open interest 9.44M | Top trader long/short ratio 1.74.
Current price 0.1424 (24H +25.80%). The current quantitative and anomaly models give a [Strong Long Trigger: 72 points]. | Anomaly triggers: aggressive buy orders sweeping the book, Taker=1.32; spot-futures basis anomaly -0.27%; 1H long lower-wick spike swept stops and recovered (lower wick accounts for 69%). Derivatives indicators for reference: futures long signal 58 points | 1H change +0.78% | Real-time anomaly (72 points): aggressive buy orders sweeping the book, Taker=1.32; spot-futures basis anomaly -0.27%; 1H long lower-wick spike swept stops and recovered (lower wick accounts for 69%) | Perpetual funding rate +0.0039% | Aggressive buy/sell ratio 1.32 | Spot-futures basis -0.267% | Futures open interest 9.44M | Top trader long/short ratio 1.74.
101
·
--
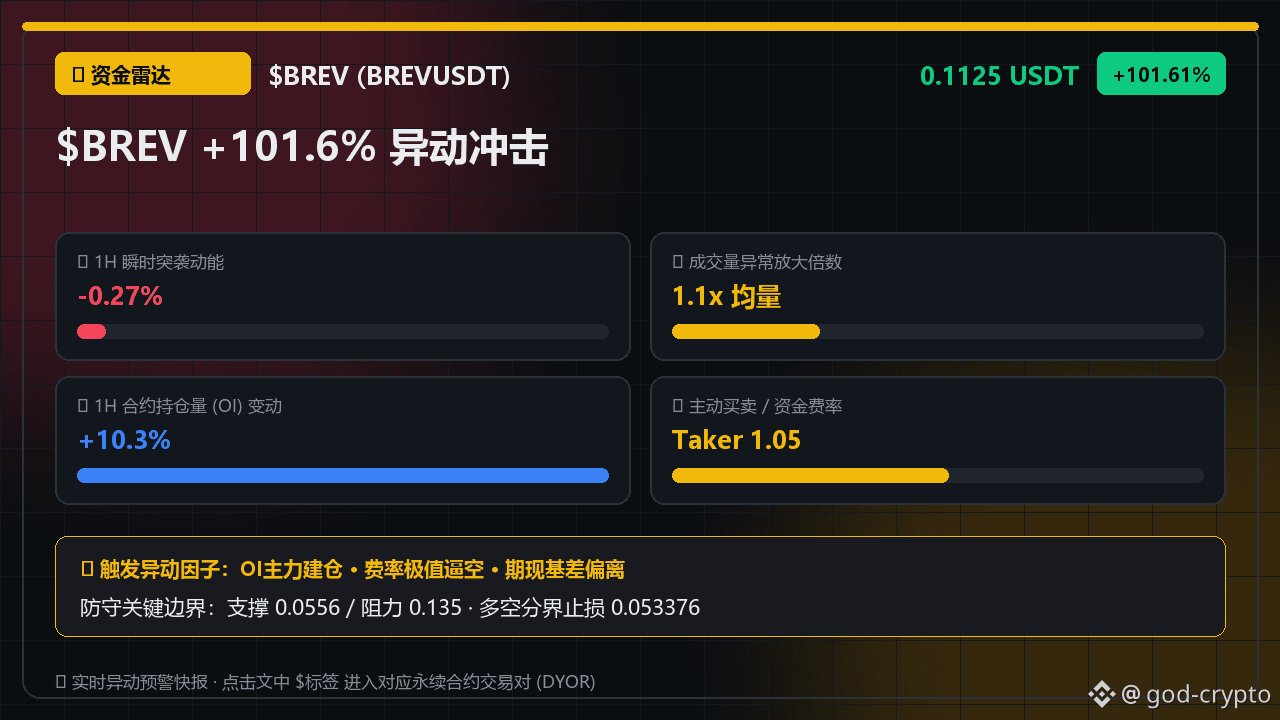
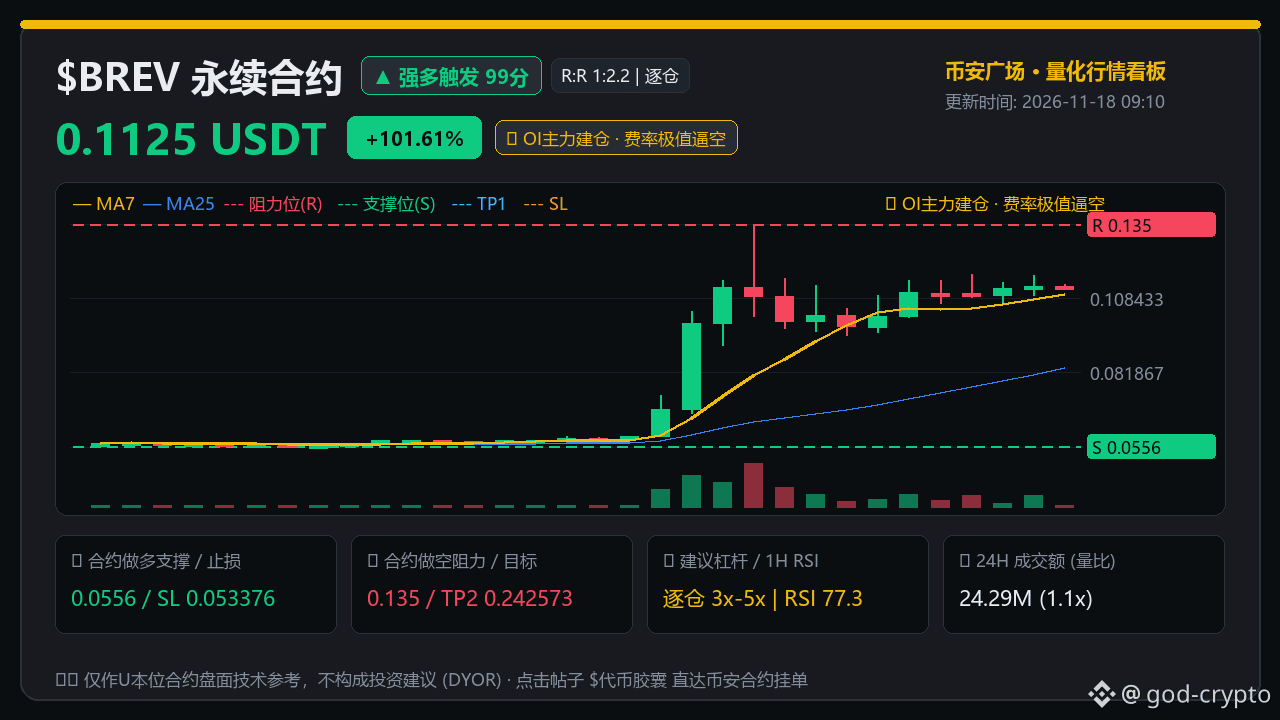
$BREV Perpetual Market Anomaly Alert: 24-hour trading volume hit 24.29M (24H +101.61%)
The current price is hovering around 0.1125. The contract order book has detected strong long-side anomalies (1H open interest surged +10.3%, indicating major players are building positions; negative funding rate squeeze alert at -0.416%; spot-perpetual basis anomaly at -3.80%).
The contract market is being led by bullish momentum: if a pullback to around 0.0556 holds, consider entering long with the trend, placing a defensive stop loss at 0.053376 in case the setup fails.
Keep a close eye on whether price breaks through the key resistance at 0.135. If it holds above that level, the next targets are 0.183449 to 0.242573. Remember to move your stop to protect profits in stages as price reaches those levels.
Heavy volume often comes with sharp wicks and stop-hunting. Are you bullish or bearish on this BREVUSDT move?
#BREV合约信号 #合约交易 #BinanceSquare
These are my personal opinions only and do not constitute investment advice. DYOR
$BREV Perpetual Market Anomaly Alert: 24-hour trading volume hit 24.29M (24H +101.61%)
The current price is hovering around 0.1125. The contract order book has detected strong long-side anomalies (1H open interest surged +10.3%, indicating major players are building positions; negative funding rate squeeze alert at -0.416%; spot-perpetual basis anomaly at -3.80%).
The contract market is being led by bullish momentum: if a pullback to around 0.0556 holds, consider entering long with the trend, placing a defensive stop loss at 0.053376 in case the setup fails.
Keep a close eye on whether price breaks through the key resistance at 0.135. If it holds above that level, the next targets are 0.183449 to 0.242573. Remember to move your stop to protect profits in stages as price reaches those levels.
Heavy volume often comes with sharp wicks and stop-hunting. Are you bullish or bearish on this BREVUSDT move?
#BREV合约信号 #合约交易 #BinanceSquare
These are my personal opinions only and do not constitute investment advice. DYOR
The current price is hovering around 0.1125. The contract order book has detected strong long-side anomalies (1H open interest surged +10.3%, indicating major players are building positions; negative funding rate squeeze alert at -0.416%; spot-perpetual basis anomaly at -3.80%).
The contract market is being led by bullish momentum: if a pullback to around 0.0556 holds, consider entering long with the trend, placing a defensive stop loss at 0.053376 in case the setup fails.
Keep a close eye on whether price breaks through the key resistance at 0.135. If it holds above that level, the next targets are 0.183449 to 0.242573. Remember to move your stop to protect profits in stages as price reaches those levels.
Heavy volume often comes with sharp wicks and stop-hunting. Are you bullish or bearish on this BREVUSDT move?
#BREV合约信号 #合约交易 #BinanceSquare
These are my personal opinions only and do not constitute investment advice. DYOR
273
·
--
Watching $HUMA : A negative funding rate alert—why are funds suddenly reversing course and pulling out?
I just took a quick look at the order book, and the data is a bit contradictory. Over the past hour, contract open interest has plunged by nearly 8%, suggesting that leveraged positions that chased the price higher are now being liquidated en masse.
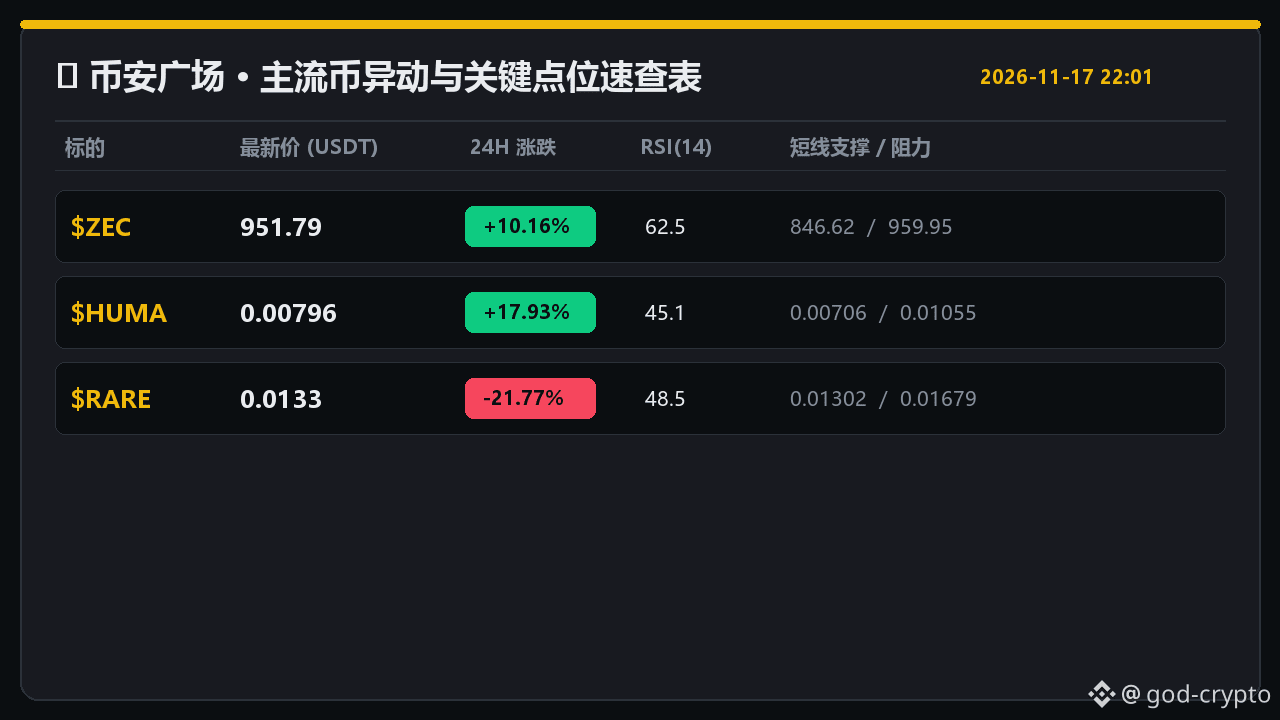
The funding rate is now down to around -0.09%, while the top trader long/short ratio is still skewed long at 1.35—so in theory, there’s potential for a short squeeze. But the taker buy/sell ratio is only 0.88, and the contracts are trading at a discount. Buyers simply can’t absorb the selling pressure overhead. With funds pulling out, I’m bearish on the $HUMA contract for now, and would use isolated margin with 3–5x leverage only to guard against wicks.
Entry trigger: If the price around 0.0078 rebounds weakly and taker buying fails to pick up, consider a small short position.
Risk management: Resistance is around 0.01055. If price breaks above 0.011068 on rising volume and approaches the short liquidation zone, exit immediately according to plan.
Downside to watch: First, keep an eye on the concentrated long liquidation zone near 0.00706. Assess the buying support there before deciding whether to stay in or exit.
With extreme fear and negative funding rates, would you take a small short on a rebound, or wait for a short squeeze and a liquidation wick before acting?
Asset to watch: $ZEC
#HUMA合约信号 #合约交易 #Binance Square
These are my personal views only and do not constitute investment advice. DYOR
Watching $HUMA : A negative funding rate alert—why are funds suddenly reversing course and pulling out?
I just took a quick look at the order book, and the data is a bit contradictory. Over the past hour, contract open interest has plunged by nearly 8%, suggesting that leveraged positions that chased the price higher are now being liquidated en masse.
The funding rate is now down to around -0.09%, while the top trader long/short ratio is still skewed long at 1.35—so in theory, there’s potential for a short squeeze. But the taker buy/sell ratio is only 0.88, and the contracts are trading at a discount. Buyers simply can’t absorb the selling pressure overhead. With funds pulling out, I’m bearish on the $HUMA contract for now, and would use isolated margin with 3–5x leverage only to guard against wicks.
Entry trigger: If the price around 0.0078 rebounds weakly and taker buying fails to pick up, consider a small short position.
Risk management: Resistance is around 0.01055. If price breaks above 0.011068 on rising volume and approaches the short liquidation zone, exit immediately according to plan.
Downside to watch: First, keep an eye on the concentrated long liquidation zone near 0.00706. Assess the buying support there before deciding whether to stay in or exit.
With extreme fear and negative funding rates, would you take a small short on a rebound, or wait for a short squeeze and a liquidation wick before acting?
Asset to watch: $ZEC
#HUMA合约信号 #合约交易 #Binance Square
These are my personal views only and do not constitute investment advice. DYOR
I just took a quick look at the order book, and the data is a bit contradictory. Over the past hour, contract open interest has plunged by nearly 8%, suggesting that leveraged positions that chased the price higher are now being liquidated en masse.
The funding rate is now down to around -0.09%, while the top trader long/short ratio is still skewed long at 1.35—so in theory, there’s potential for a short squeeze. But the taker buy/sell ratio is only 0.88, and the contracts are trading at a discount. Buyers simply can’t absorb the selling pressure overhead. With funds pulling out, I’m bearish on the $HUMA contract for now, and would use isolated margin with 3–5x leverage only to guard against wicks.
Entry trigger: If the price around 0.0078 rebounds weakly and taker buying fails to pick up, consider a small short position.
Risk management: Resistance is around 0.01055. If price breaks above 0.011068 on rising volume and approaches the short liquidation zone, exit immediately according to plan.
Downside to watch: First, keep an eye on the concentrated long liquidation zone near 0.00706. Assess the buying support there before deciding whether to stay in or exit.
With extreme fear and negative funding rates, would you take a small short on a rebound, or wait for a short squeeze and a liquidation wick before acting?
Asset to watch: $ZEC
#HUMA合约信号 #合约交易 #Binance Square
These are my personal views only and do not constitute investment advice. DYOR
141
·
--
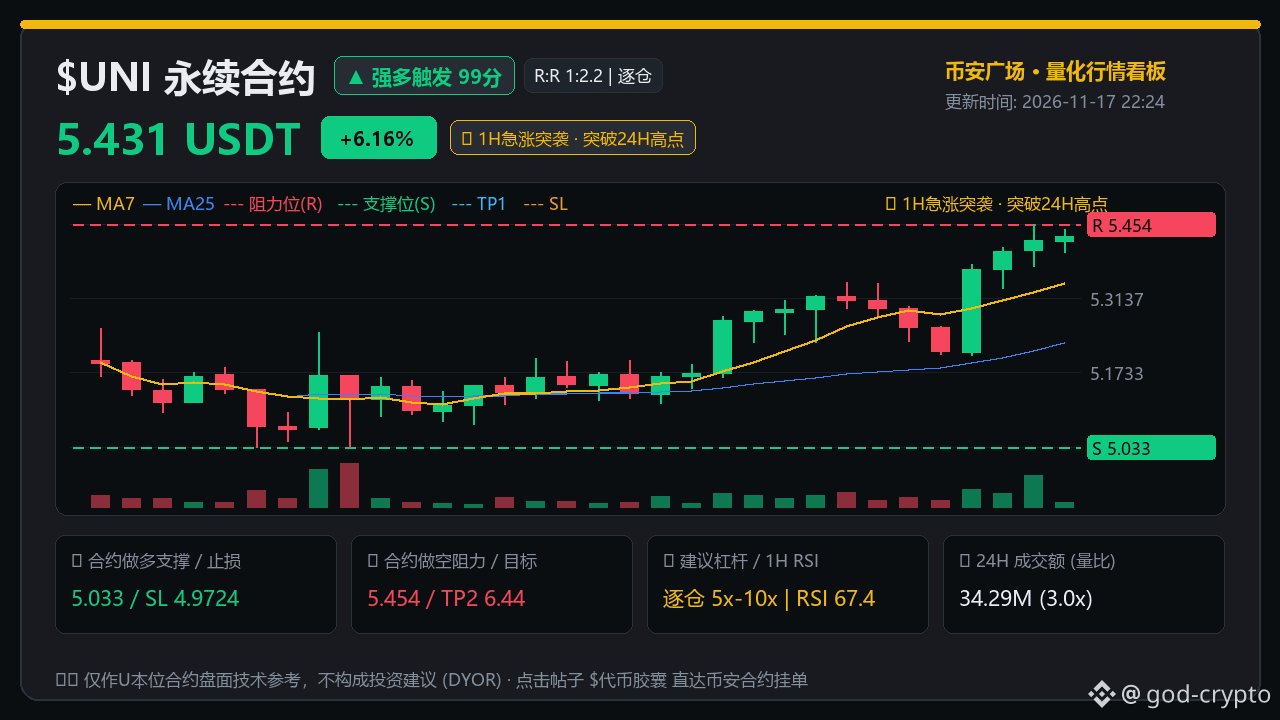
Amid extreme fear, $UNI saw volume explode to 3x, yet the funding rate is still negative
Market sentiment is still hovering near the lows, but the order book is already flashing a clear bullish signal. Over the past hour, trading volume has expanded to 3x its average, the 4-hour gain has exceeded 4%, nearly $100 million in open contract positions remains firmly on the books, and the large-trader long/short ratio has reached 2.22.
More importantly, the market is showing divergence: the current price is already hovering near the intraday high, while perpetual funding rates and the futures-spot basis are still negative. Aggressive buyers are also starting to take the lead. This suggests that bears are still betting on a pullback below resistance. If a surge in volume breaks through the ceiling, the dense liquidation zone above could provide fuel for further upside. For now, the overall outlook remains bullish.
Watch these two trading levels for $UNI :
Breakout entry: If price holds above 5.454 on increased volume, consider testing a long position with low leverage and isolated margin. If momentum continues, the next area to watch is around 5.98. If price spikes and then falls back below the breakout level, exit immediately.
Buy the dip: If price doesn’t break through right away and instead pulls back on declining volume, you could cautiously enter near the 5.033 support. If it decisively breaks below 4.972, take the planned loss and exit.
With funding rates negative and price nearing its previous high, would you wait for a confirmed breakout before entering, or do you think volume is overextended and want to short instead?
#UNI合约信号 #合约交易 #Binance Square
Personal opinion only, not investment advice. DYOR.
Amid extreme fear, $UNI saw volume explode to 3x, yet the funding rate is still negative
Market sentiment is still hovering near the lows, but the order book is already flashing a clear bullish signal. Over the past hour, trading volume has expanded to 3x its average, the 4-hour gain has exceeded 4%, nearly $100 million in open contract positions remains firmly on the books, and the large-trader long/short ratio has reached 2.22.
More importantly, the market is showing divergence: the current price is already hovering near the intraday high, while perpetual funding rates and the futures-spot basis are still negative. Aggressive buyers are also starting to take the lead. This suggests that bears are still betting on a pullback below resistance. If a surge in volume breaks through the ceiling, the dense liquidation zone above could provide fuel for further upside. For now, the overall outlook remains bullish.
Watch these two trading levels for $UNI :
Breakout entry: If price holds above 5.454 on increased volume, consider testing a long position with low leverage and isolated margin. If momentum continues, the next area to watch is around 5.98. If price spikes and then falls back below the breakout level, exit immediately.
Buy the dip: If price doesn’t break through right away and instead pulls back on declining volume, you could cautiously enter near the 5.033 support. If it decisively breaks below 4.972, take the planned loss and exit.
With funding rates negative and price nearing its previous high, would you wait for a confirmed breakout before entering, or do you think volume is overextended and want to short instead?
#UNI合约信号 #合约交易 #Binance Square
Personal opinion only, not investment advice. DYOR.
Market sentiment is still hovering near the lows, but the order book is already flashing a clear bullish signal. Over the past hour, trading volume has expanded to 3x its average, the 4-hour gain has exceeded 4%, nearly $100 million in open contract positions remains firmly on the books, and the large-trader long/short ratio has reached 2.22.
More importantly, the market is showing divergence: the current price is already hovering near the intraday high, while perpetual funding rates and the futures-spot basis are still negative. Aggressive buyers are also starting to take the lead. This suggests that bears are still betting on a pullback below resistance. If a surge in volume breaks through the ceiling, the dense liquidation zone above could provide fuel for further upside. For now, the overall outlook remains bullish.
Watch these two trading levels for $UNI :
Breakout entry: If price holds above 5.454 on increased volume, consider testing a long position with low leverage and isolated margin. If momentum continues, the next area to watch is around 5.98. If price spikes and then falls back below the breakout level, exit immediately.
Buy the dip: If price doesn’t break through right away and instead pulls back on declining volume, you could cautiously enter near the 5.033 support. If it decisively breaks below 4.972, take the planned loss and exit.
With funding rates negative and price nearing its previous high, would you wait for a confirmed breakout before entering, or do you think volume is overextended and want to short instead?
#UNI合约信号 #合约交易 #Binance Square
Personal opinion only, not investment advice. DYOR.
1
2k
·
--
Article
The Fear & Greed Index Drops to 12—Why Is INJ Gaining Against the Trend? The Order Book Has the AnswerToday, the crypto Fear & Greed Index has fallen to 12, putting it firmly in the extreme fear zone. Most retail traders are hesitating over whether to sell at a loss near the bottom.
But the market is showing an unusual signal: while sentiment is broadly bearish, $INJ has risen 10.17% against the trend in 24 hours, and the live order book is also showing a confluence of long-entry signals across multiple timeframes.
Many people are asking: Is this move driven by real money entering to buy the dip, or is it a bull trap rebound during a downtrend? Let’s break down the order book structure and contract data.
First, let’s look at the short-term chart. Over the past 4 hours, its momentum accelerated upward by 2.63%, and the 1-hour moving averages formed a bullish alignment on rising volume. The slight 0.71% dip over the past hour is just a normal pause after a sharp rally; the price action hasn’t disrupted the upward trend.
The Fear & Greed Index Drops to 12—Why Is INJ Gaining Against the Trend? The Order Book Has the Answer
Today, the crypto Fear & Greed Index has fallen to 12, putting it firmly in the extreme fear zone. Most retail traders are hesitating over whether to sell at a loss near the bottom.
But the market is showing an unusual signal: while sentiment is broadly bearish, $INJ has risen 10.17% against the trend in 24 hours, and the live order book is also showing a confluence of long-entry signals across multiple timeframes.
Many people are asking: Is this move driven by real money entering to buy the dip, or is it a bull trap rebound during a downtrend? Let’s break down the order book structure and contract data.
First, let’s look at the short-term chart. Over the past 4 hours, its momentum accelerated upward by 2.63%, and the 1-hour moving averages formed a bullish alignment on rising volume. The slight 0.71% dip over the past hour is just a normal pause after a sharp rally; the price action hasn’t disrupted the upward trend.
But the market is showing an unusual signal: while sentiment is broadly bearish, $INJ has risen 10.17% against the trend in 24 hours, and the live order book is also showing a confluence of long-entry signals across multiple timeframes.
Many people are asking: Is this move driven by real money entering to buy the dip, or is it a bull trap rebound during a downtrend? Let’s break down the order book structure and contract data.
First, let’s look at the short-term chart. Over the past 4 hours, its momentum accelerated upward by 2.63%, and the 1-hour moving averages formed a bullish alignment on rising volume. The slight 0.71% dip over the past hour is just a normal pause after a sharp rally; the price action hasn’t disrupted the upward trend.
·
--
Amid extreme panic, the large-trader long/short ratio for $HYPE has surged to 2.44
The market-wide sentiment index has fallen to 12. Many people are afraid to act, but the order book’s taker buy ratio is as high as 1.12, and 359 million in open interest is steadily providing support. Large investors are clearly accumulating at lower levels. Even more unusually, the funding rate is just 0.0028%, and long-side positioning is far from crowded—the trade isn’t overloaded.
The market is now building momentum around the 70 level, with a dense short liquidation zone above 72.4. Keep an eye on these two levels when making your move, $HYPE :
If buying support appears on a pullback near 65.7, consider a small long position. If price breaks below 64.9 on strong volume, exit decisively to avoid the long liquidation zone below.
If price breaks above 71.05 on strong volume and holds there, follow through with a long position. First watch how selling pressure behaves near 76.1.
With large traders heavily positioned long and funding rates extremely low, would you start with a small long position here, or wait for a confirmed breakout before acting?
#HYPE合约信号 #合约交易 #Binance Square
These are solely my personal views and do not constitute investment advice. DYOR
Amid extreme panic, the large-trader long/short ratio for $HYPE has surged to 2.44
The market-wide sentiment index has fallen to 12. Many people are afraid to act, but the order book’s taker buy ratio is as high as 1.12, and 359 million in open interest is steadily providing support. Large investors are clearly accumulating at lower levels. Even more unusually, the funding rate is just 0.0028%, and long-side positioning is far from crowded—the trade isn’t overloaded.
The market is now building momentum around the 70 level, with a dense short liquidation zone above 72.4. Keep an eye on these two levels when making your move, $HYPE :
If buying support appears on a pullback near 65.7, consider a small long position. If price breaks below 64.9 on strong volume, exit decisively to avoid the long liquidation zone below.
If price breaks above 71.05 on strong volume and holds there, follow through with a long position. First watch how selling pressure behaves near 76.1.
With large traders heavily positioned long and funding rates extremely low, would you start with a small long position here, or wait for a confirmed breakout before acting?
#HYPE合约信号 #合约交易 #Binance Square
These are solely my personal views and do not constitute investment advice. DYOR
The market-wide sentiment index has fallen to 12. Many people are afraid to act, but the order book’s taker buy ratio is as high as 1.12, and 359 million in open interest is steadily providing support. Large investors are clearly accumulating at lower levels. Even more unusually, the funding rate is just 0.0028%, and long-side positioning is far from crowded—the trade isn’t overloaded.
The market is now building momentum around the 70 level, with a dense short liquidation zone above 72.4. Keep an eye on these two levels when making your move, $HYPE :
If buying support appears on a pullback near 65.7, consider a small long position. If price breaks below 64.9 on strong volume, exit decisively to avoid the long liquidation zone below.
If price breaks above 71.05 on strong volume and holds there, follow through with a long position. First watch how selling pressure behaves near 76.1.
With large traders heavily positioned long and funding rates extremely low, would you start with a small long position here, or wait for a confirmed breakout before acting?
#HYPE合约信号 #合约交易 #Binance Square
These are solely my personal views and do not constitute investment advice. DYOR
112
·
--
The market is in extreme fear, yet the bid volume on the $SOL order book has surged to 1.8 times its previous level.
A **strong bullish buy-point confluence** has just been triggered. The top traders' long/short ratio has risen to 1.65, and the taker buy/sell ratio is 1.14. The funding rate remains neutral, indicating a healthy bullish structure rather than a crowd of retail traders chasing the highs.
The current price of 73.68 USDT is consolidating, just one step away from the intraday resistance, with a dense short liquidation zone right above.
Current $SOL order-book watch plan (isolated margin, 10x–15x):
- **Buy the dip**: If bids provide support on a pullback to 69.93 -> test a long position with a small size; exit if the price decisively breaks below 69.32.
- **Enter on a breakout**: If the price holds above 74.15 on increased volume -> follow the trend, using short covering near 75.36 to propel the move higher; exit if the price falls back below resistance.
- **Take profits in stages**: After a confirmed breakout, watch the 78.91 ~ 83.27 range for staggered profit-taking.
We’re just one final push away from key resistance. Would you test the waters with a small position at the current price, or wait for breakout confirmation before entering?
#SOL合约信号 #合约交易 #Binance Square
Personal opinion only; this is not investment advice. DYOR
The market is in extreme fear, yet the bid volume on the $SOL order book has surged to 1.8 times its previous level.
A **strong bullish buy-point confluence** has just been triggered. The top traders' long/short ratio has risen to 1.65, and the taker buy/sell ratio is 1.14. The funding rate remains neutral, indicating a healthy bullish structure rather than a crowd of retail traders chasing the highs.
The current price of 73.68 USDT is consolidating, just one step away from the intraday resistance, with a dense short liquidation zone right above.
Current $SOL order-book watch plan (isolated margin, 10x–15x):
- **Buy the dip**: If bids provide support on a pullback to 69.93 -> test a long position with a small size; exit if the price decisively breaks below 69.32.
- **Enter on a breakout**: If the price holds above 74.15 on increased volume -> follow the trend, using short covering near 75.36 to propel the move higher; exit if the price falls back below resistance.
- **Take profits in stages**: After a confirmed breakout, watch the 78.91 ~ 83.27 range for staggered profit-taking.
We’re just one final push away from key resistance. Would you test the waters with a small position at the current price, or wait for breakout confirmation before entering?
#SOL合约信号 #合约交易 #Binance Square
Personal opinion only; this is not investment advice. DYOR
A **strong bullish buy-point confluence** has just been triggered. The top traders' long/short ratio has risen to 1.65, and the taker buy/sell ratio is 1.14. The funding rate remains neutral, indicating a healthy bullish structure rather than a crowd of retail traders chasing the highs.
The current price of 73.68 USDT is consolidating, just one step away from the intraday resistance, with a dense short liquidation zone right above.
Current $SOL order-book watch plan (isolated margin, 10x–15x):
- **Buy the dip**: If bids provide support on a pullback to 69.93 -> test a long position with a small size; exit if the price decisively breaks below 69.32.
- **Enter on a breakout**: If the price holds above 74.15 on increased volume -> follow the trend, using short covering near 75.36 to propel the move higher; exit if the price falls back below resistance.
- **Take profits in stages**: After a confirmed breakout, watch the 78.91 ~ 83.27 range for staggered profit-taking.
We’re just one final push away from key resistance. Would you test the waters with a small position at the current price, or wait for breakout confirmation before entering?
#SOL合约信号 #合约交易 #Binance Square
Personal opinion only; this is not investment advice. DYOR
55
·
--
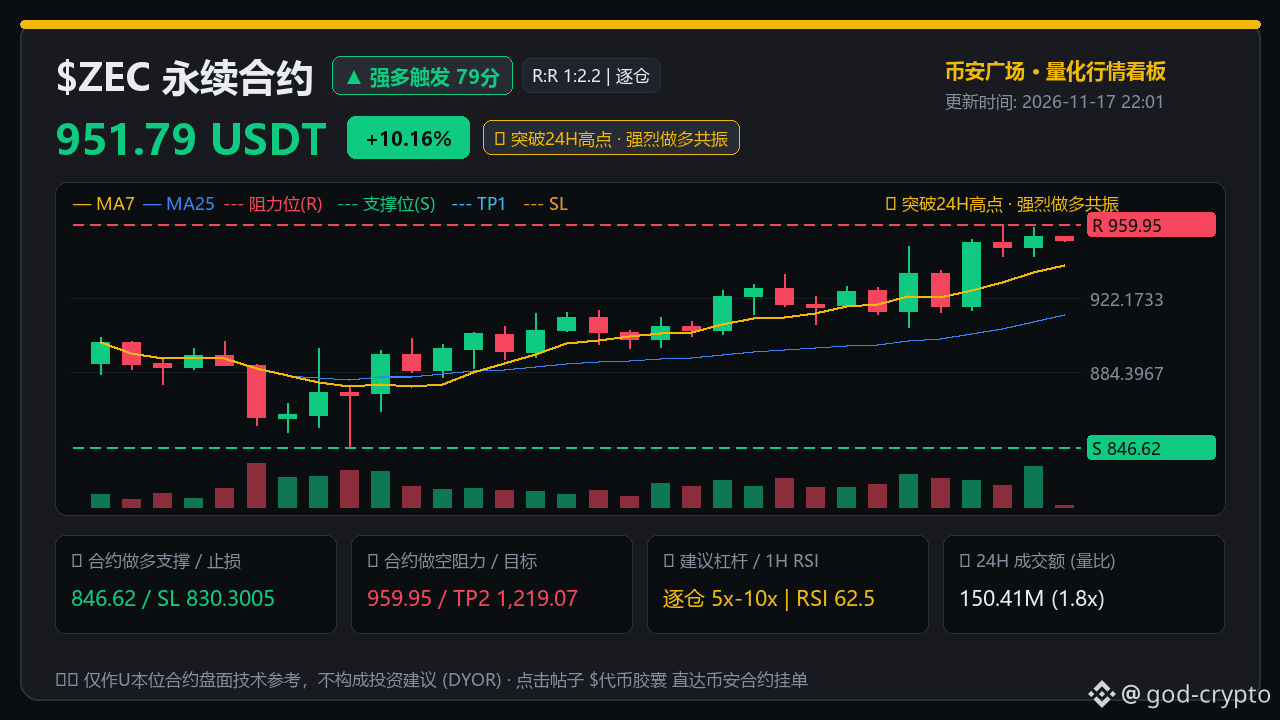
The market is gripped by extreme fear, yet $ZEC is approaching its previous high on rising volume, suggesting a bullish bias.
The Fear Index has fallen to 12, but the market is showing a 79-point bullish confluence. Volume over the past hour has increased 1.8x, the large-trader long/short ratio is 1.65, and funds are actively buying near 951.79.
Selling pressure is still being tested around 959.95. A breakout on rising volume could get a boost from the short liquidation cluster at 984.0797.
Trading plan: $ZEC **Isolated margin, 5x–10x leverage — entry triggers**
- **Breakout follow-through**: If price breaks above and holds 959.95 on rising volume -\u003e consider a trend-following long, with 1,097.58 as an upside level to watch; exit if price falls back below that level.
- **Buy the dip**: If price pulls back to 846.62 and stabilizes -\u003e consider scaling into a long; cut losses decisively if it breaks below 830.3005.
With sentiment at extreme fear levels, would you wait for a breakout above the previous high before entering, or buy the pullback to support?
#ZEC合约信号 #合约交易 #Binance Square
Personal opinion only; this is not investment advice. DYOR.
The market is gripped by extreme fear, yet $ZEC is approaching its previous high on rising volume, suggesting a bullish bias.
The Fear Index has fallen to 12, but the market is showing a 79-point bullish confluence. Volume over the past hour has increased 1.8x, the large-trader long/short ratio is 1.65, and funds are actively buying near 951.79.
Selling pressure is still being tested around 959.95. A breakout on rising volume could get a boost from the short liquidation cluster at 984.0797.
Trading plan: $ZEC **Isolated margin, 5x–10x leverage — entry triggers**
- **Breakout follow-through**: If price breaks above and holds 959.95 on rising volume -\u003e consider a trend-following long, with 1,097.58 as an upside level to watch; exit if price falls back below that level.
- **Buy the dip**: If price pulls back to 846.62 and stabilizes -\u003e consider scaling into a long; cut losses decisively if it breaks below 830.3005.
With sentiment at extreme fear levels, would you wait for a breakout above the previous high before entering, or buy the pullback to support?
#ZEC合约信号 #合约交易 #Binance Square
Personal opinion only; this is not investment advice. DYOR.
The Fear Index has fallen to 12, but the market is showing a 79-point bullish confluence. Volume over the past hour has increased 1.8x, the large-trader long/short ratio is 1.65, and funds are actively buying near 951.79.
Selling pressure is still being tested around 959.95. A breakout on rising volume could get a boost from the short liquidation cluster at 984.0797.
Trading plan: $ZEC **Isolated margin, 5x–10x leverage — entry triggers**
- **Breakout follow-through**: If price breaks above and holds 959.95 on rising volume -\u003e consider a trend-following long, with 1,097.58 as an upside level to watch; exit if price falls back below that level.
- **Buy the dip**: If price pulls back to 846.62 and stabilizes -\u003e consider scaling into a long; cut losses decisively if it breaks below 830.3005.
With sentiment at extreme fear levels, would you wait for a breakout above the previous high before entering, or buy the pullback to support?
#ZEC合约信号 #合约交易 #Binance Square
Personal opinion only; this is not investment advice. DYOR.
200
·
--
$UNI perpetual contract alert: 24-hour trading volume has surged to 32.02M (24H +6.80%).
The current price is hovering around 5.402. The futures order book has detected a strong bullish signal (volume-backed breakout / holding close to the 24H high resistance; strong confluence of long entry signals (score: 66)).
Futures momentum is predominantly bullish: if the price holds near 5.033 on a pullback, consider going long with the trend, placing a defensive stop-loss at 4.9741 to cut losses if the setup fails.
Keep a close eye on the resistance at 5.5198 and whether it breaks. If the price holds above it, the next targets are 5.9155 to 6.3434. Remember to move your stop to protect profits as the price reaches these levels.
Heavy trading volume often comes with sharp wicks and shakeouts. Are you bullish or bearish on this UNIUSDT move?
#UNI合约信号 #合约交易 #Binance Square
Personal opinion only; not investment advice. DYOR
🕒 Live monitoring (20:54): $UNI price $5.402 | Trend: strong bullish futures signal confluence
$UNI perpetual contract alert: 24-hour trading volume has surged to 32.02M (24H +6.80%).
The current price is hovering around 5.402. The futures order book has detected a strong bullish signal (volume-backed breakout / holding close to the 24H high resistance; strong confluence of long entry signals (score: 66)).
Futures momentum is predominantly bullish: if the price holds near 5.033 on a pullback, consider going long with the trend, placing a defensive stop-loss at 4.9741 to cut losses if the setup fails.
Keep a close eye on the resistance at 5.5198 and whether it breaks. If the price holds above it, the next targets are 5.9155 to 6.3434. Remember to move your stop to protect profits as the price reaches these levels.
Heavy trading volume often comes with sharp wicks and shakeouts. Are you bullish or bearish on this UNIUSDT move?
#UNI合约信号 #合约交易 #Binance Square
Personal opinion only; not investment advice. DYOR
🕒 Live monitoring (20:54): $UNI price $5.402 | Trend: strong bullish futures signal confluence
The current price is hovering around 5.402. The futures order book has detected a strong bullish signal (volume-backed breakout / holding close to the 24H high resistance; strong confluence of long entry signals (score: 66)).
Futures momentum is predominantly bullish: if the price holds near 5.033 on a pullback, consider going long with the trend, placing a defensive stop-loss at 4.9741 to cut losses if the setup fails.
Keep a close eye on the resistance at 5.5198 and whether it breaks. If the price holds above it, the next targets are 5.9155 to 6.3434. Remember to move your stop to protect profits as the price reaches these levels.
Heavy trading volume often comes with sharp wicks and shakeouts. Are you bullish or bearish on this UNIUSDT move?
#UNI合约信号 #合约交易 #Binance Square
Personal opinion only; not investment advice. DYOR
🕒 Live monitoring (20:54): $UNI price $5.402 | Trend: strong bullish futures signal confluence
307
·
--
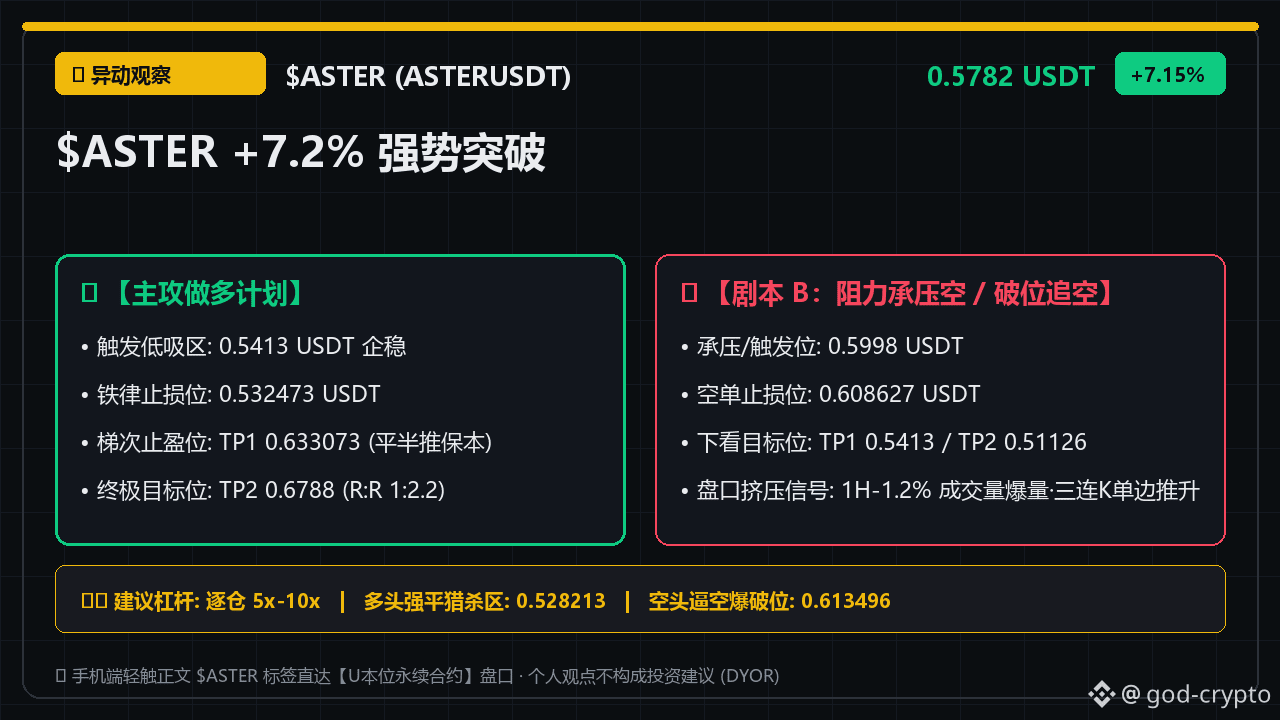
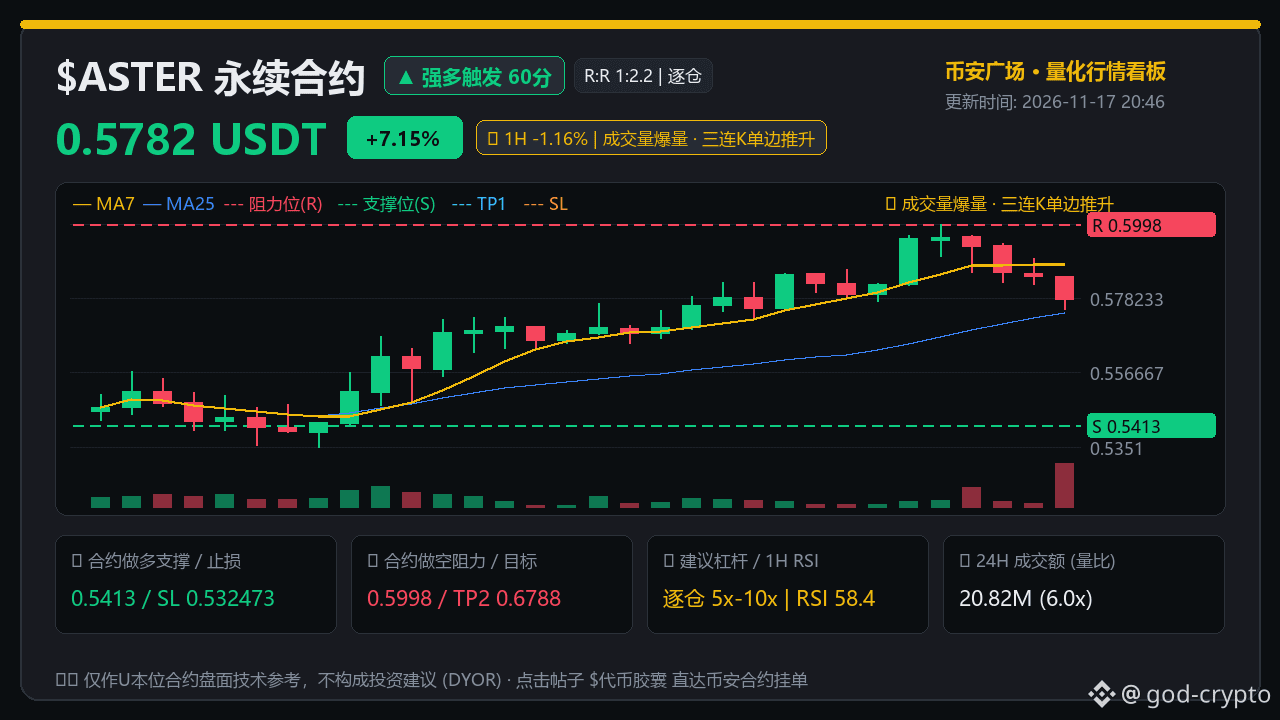
$ASTER Perpetual Market Anomaly Alert: 24-hour trading volume hit 20.82M (24H +7.15%, 1H -1.16%)
The price is hovering around 0.5782. The contract order book has detected a strong long-side anomaly (volume surged to 6.0x; three consecutive bearish 1H candles pushed the price down -2.61%).
The contract trend is being led by bullish momentum: if the price holds near 0.5413 on a pullback, consider following the trend with a long position, and place a defensive stop-loss at 0.532473 to cut losses if the setup fails.
Keep a close eye on the breakout at the key resistance of 0.5998. If the price holds above it, follow the trend and watch for 0.633073 to 0.6788. Remember to move your protective stops in stages as those levels are reached.
Heavy volume often comes with sharp wick-driven shakeouts. Are you bullish or bearish on this ASTERUSDT move?
Asset to watch: $INJ
#ASTER合约信号 #合约交易 #Binance Square
These are my personal views only and do not constitute investment advice. DYOR
$ASTER Perpetual Market Anomaly Alert: 24-hour trading volume hit 20.82M (24H +7.15%, 1H -1.16%)
The price is hovering around 0.5782. The contract order book has detected a strong long-side anomaly (volume surged to 6.0x; three consecutive bearish 1H candles pushed the price down -2.61%).
The contract trend is being led by bullish momentum: if the price holds near 0.5413 on a pullback, consider following the trend with a long position, and place a defensive stop-loss at 0.532473 to cut losses if the setup fails.
Keep a close eye on the breakout at the key resistance of 0.5998. If the price holds above it, follow the trend and watch for 0.633073 to 0.6788. Remember to move your protective stops in stages as those levels are reached.
Heavy volume often comes with sharp wick-driven shakeouts. Are you bullish or bearish on this ASTERUSDT move?
Asset to watch: $INJ
#ASTER合约信号 #合约交易 #Binance Square
These are my personal views only and do not constitute investment advice. DYOR
The price is hovering around 0.5782. The contract order book has detected a strong long-side anomaly (volume surged to 6.0x; three consecutive bearish 1H candles pushed the price down -2.61%).
The contract trend is being led by bullish momentum: if the price holds near 0.5413 on a pullback, consider following the trend with a long position, and place a defensive stop-loss at 0.532473 to cut losses if the setup fails.
Keep a close eye on the breakout at the key resistance of 0.5998. If the price holds above it, follow the trend and watch for 0.633073 to 0.6788. Remember to move your protective stops in stages as those levels are reached.
Heavy volume often comes with sharp wick-driven shakeouts. Are you bullish or bearish on this ASTERUSDT move?
Asset to watch: $INJ
#ASTER合约信号 #合约交易 #Binance Square
These are my personal views only and do not constitute investment advice. DYOR
9
·
--
The Fear Index is only 12, yet $NEAR has seen a surge in aggressive buying.
Market sentiment is still hovering near its lows, but trading volume over the past hour has already risen to 1.5 times the average. The aggressive buy ratio is 1.36, and open interest is climbing at the same time. The large-trader long/short ratio has reached 2.28, with order-book flows already leaning bullish.
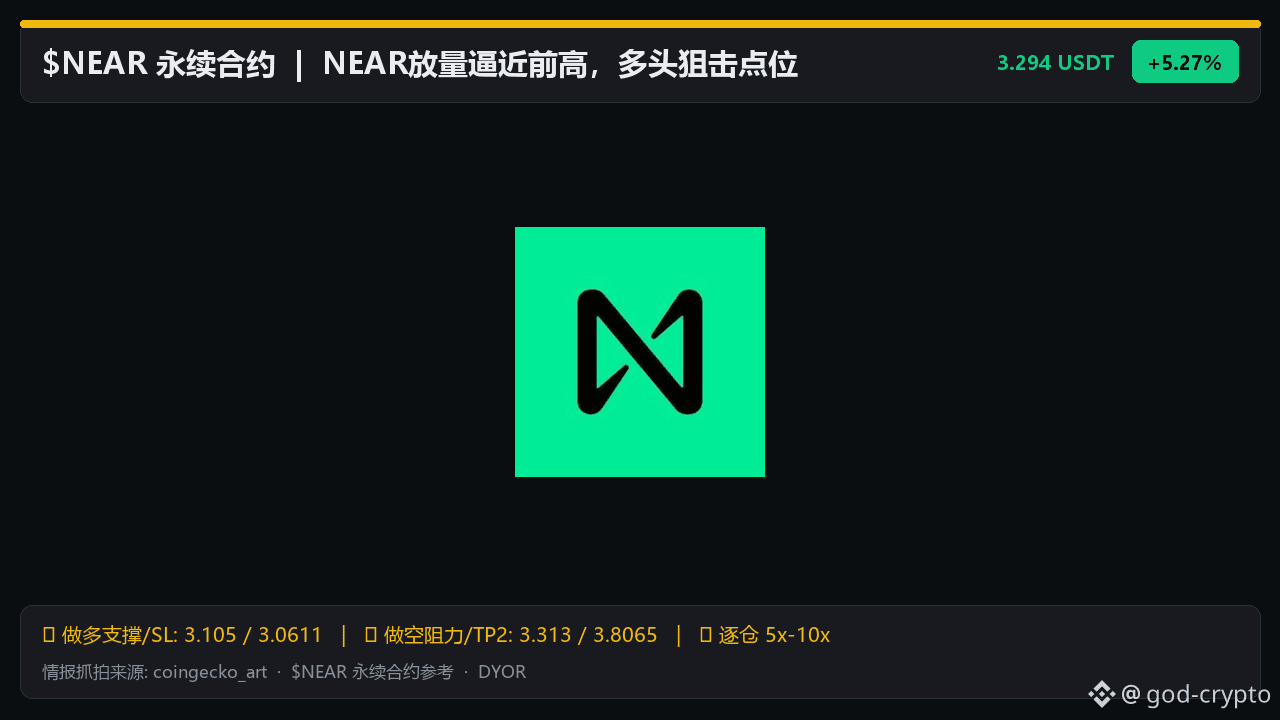
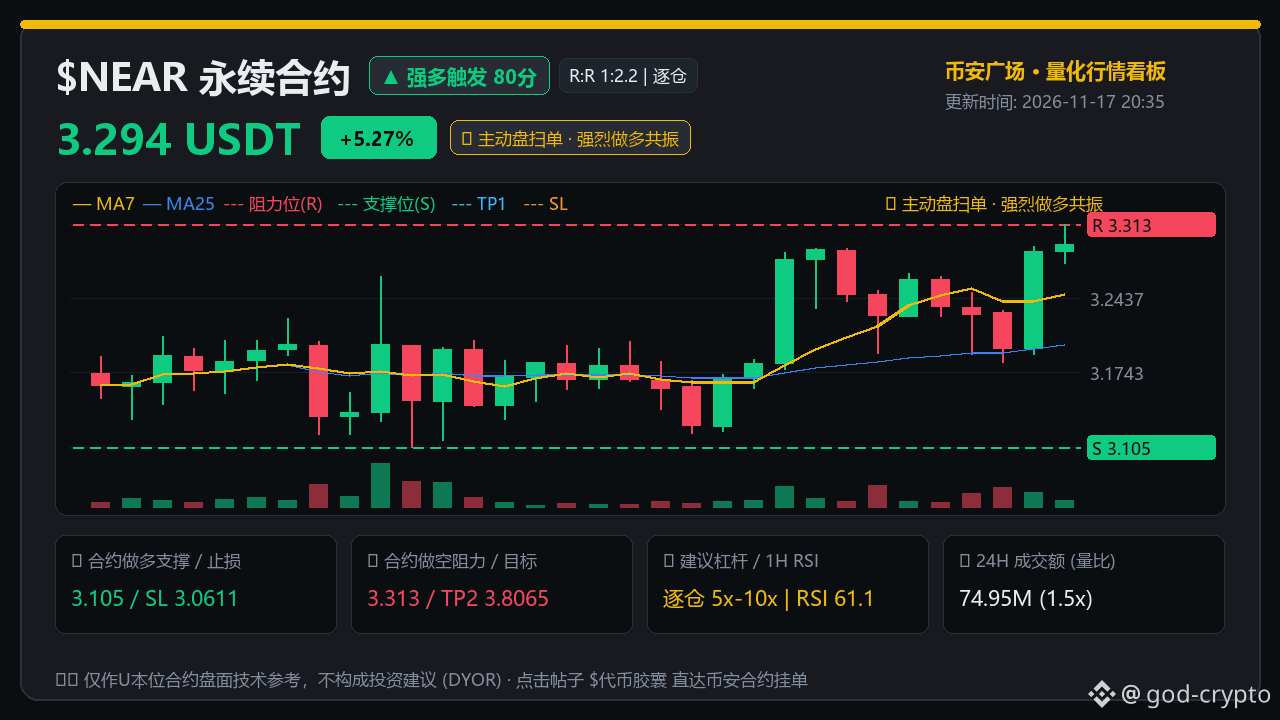
With $NEAR trading around 3.294, there are only two conditions for the next move:
- Breakout and hold: If price breaks above 3.313 on strong volume and holds, consider going long with the trend. First, watch the short liquidation cluster around 3.3838.
- Buy the dip: If price first pulls back to test support at 3.105 and holds, consider a small long position. If it breaks below 3.0611, stop out immediately.
Price is right at the resistance level now. Would you take an early position on the left side, or wait for it to hold above 3.313 before entering?
#NEAR合约信号 #合约交易 #Binance Square
Personal opinion only, not investment advice. DYOR
The Fear Index is only 12, yet $NEAR has seen a surge in aggressive buying.
Market sentiment is still hovering near its lows, but trading volume over the past hour has already risen to 1.5 times the average. The aggressive buy ratio is 1.36, and open interest is climbing at the same time. The large-trader long/short ratio has reached 2.28, with order-book flows already leaning bullish.
With $NEAR trading around 3.294, there are only two conditions for the next move:
- Breakout and hold: If price breaks above 3.313 on strong volume and holds, consider going long with the trend. First, watch the short liquidation cluster around 3.3838.
- Buy the dip: If price first pulls back to test support at 3.105 and holds, consider a small long position. If it breaks below 3.0611, stop out immediately.
Price is right at the resistance level now. Would you take an early position on the left side, or wait for it to hold above 3.313 before entering?
#NEAR合约信号 #合约交易 #Binance Square
Personal opinion only, not investment advice. DYOR
Market sentiment is still hovering near its lows, but trading volume over the past hour has already risen to 1.5 times the average. The aggressive buy ratio is 1.36, and open interest is climbing at the same time. The large-trader long/short ratio has reached 2.28, with order-book flows already leaning bullish.
With $NEAR trading around 3.294, there are only two conditions for the next move:
- Breakout and hold: If price breaks above 3.313 on strong volume and holds, consider going long with the trend. First, watch the short liquidation cluster around 3.3838.
- Buy the dip: If price first pulls back to test support at 3.105 and holds, consider a small long position. If it breaks below 3.0611, stop out immediately.
Price is right at the resistance level now. Would you take an early position on the left side, or wait for it to hold above 3.313 before entering?
#NEAR合约信号 #合约交易 #Binance Square
Personal opinion only, not investment advice. DYOR
111
·
--
Article
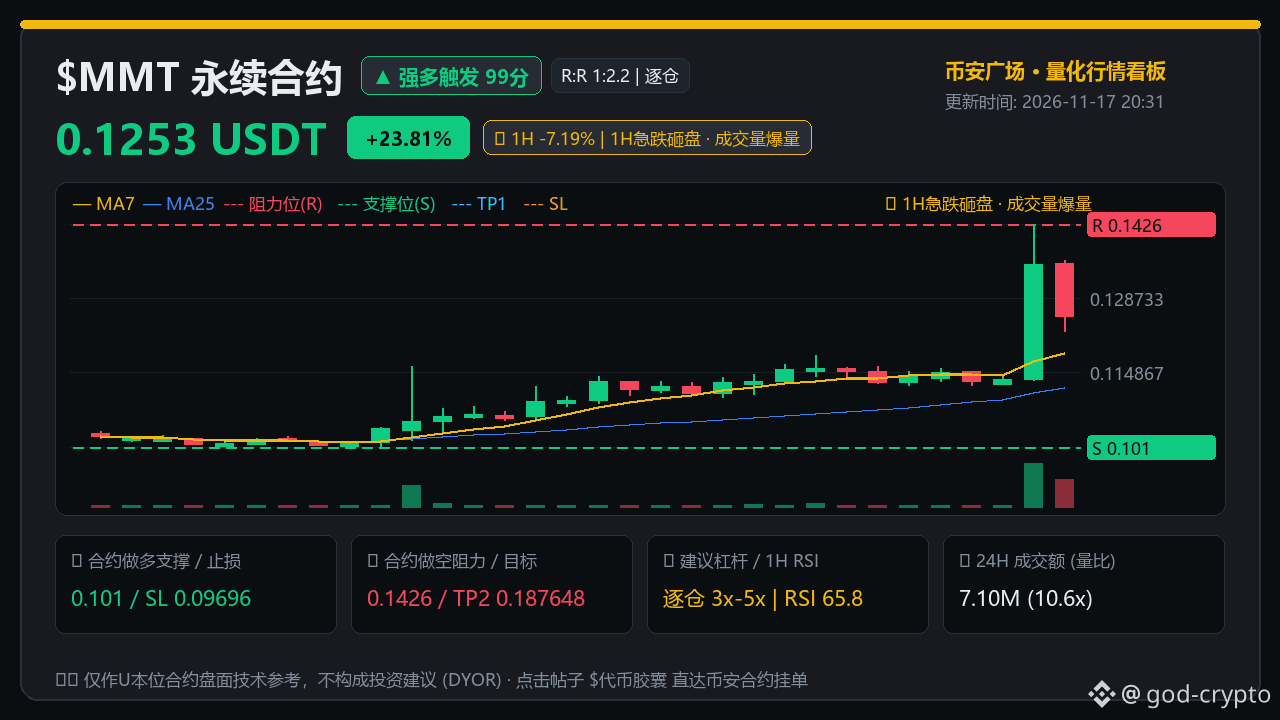
The market fear index is just 12—what signal lies behind this 7% plunge on 10x volume?The market fear index fell to 12, leaving the market frozen with fear, while $MMT surged 23.8% in 24 hours against the trend.
But just within the past hour, it suddenly saw a 10.6-fold spike in trading volume and plunged more than 7%, while volatility nearly tripled in an instant.
Many people panic when they see a huge red candle like this, thinking the rally is over. But seasoned traders looking at derivatives order books can spot some interesting details behind this sharp drop.
On the one hand, four-hour momentum had just accelerated, surging more than 9%, so short-term holders had a clear incentive to take profits.
On the other hand, although spot led the gains, its perpetual funding rate remained negative (-0.0169%), as did the futures-spot basis (-0.202%).
The market fear index is just 12—what signal lies behind this 7% plunge on 10x volume?
The market fear index fell to 12, leaving the market frozen with fear, while $MMT surged 23.8% in 24 hours against the trend.
But just within the past hour, it suddenly saw a 10.6-fold spike in trading volume and plunged more than 7%, while volatility nearly tripled in an instant.
Many people panic when they see a huge red candle like this, thinking the rally is over. But seasoned traders looking at derivatives order books can spot some interesting details behind this sharp drop.
On the one hand, four-hour momentum had just accelerated, surging more than 9%, so short-term holders had a clear incentive to take profits.
On the other hand, although spot led the gains, its perpetual funding rate remained negative (-0.0169%), as did the futures-spot basis (-0.202%).
But just within the past hour, it suddenly saw a 10.6-fold spike in trading volume and plunged more than 7%, while volatility nearly tripled in an instant.
Many people panic when they see a huge red candle like this, thinking the rally is over. But seasoned traders looking at derivatives order books can spot some interesting details behind this sharp drop.
On the one hand, four-hour momentum had just accelerated, surging more than 9%, so short-term holders had a clear incentive to take profits.
On the other hand, although spot led the gains, its perpetual funding rate remained negative (-0.0169%), as did the futures-spot basis (-0.202%).
5
·
--
Bearish on $RARE ; beware a rebound from the futures discount
Funding rate as low as -0.922%: shorts are overly crowded, making a rebound more likely. The futures contract is trading at a 1.85% discount to spot, and selling pressure in the derivatives market remains heavy.
- If the current price of 0.01366 loses 0.01302: try a small short position (isolated margin, 3–5x); exit if price recovers above that level. Downside target: 0.00683.
- If a rebound to 0.01834 meets resistance: enter a short on confirmation; exit if price breaks above 0.019186. Look to the previous low as the downside target.
- If price retests the previous low and holds: try a small, short-term long; exit if it breaks below. Look to the resistance level as the upside target.
With the negative funding rate alert for $RARE , would you first try a small position to catch a rebound, or wait for confirmed resistance before acting?
Watchlist: $HUMA
#RARE合约信号 #合约交易 #Binance Square
Personal opinion only; not investment advice. DYOR.
Bearish on $RARE ; beware a rebound from the futures discount
Funding rate as low as -0.922%: shorts are overly crowded, making a rebound more likely. The futures contract is trading at a 1.85% discount to spot, and selling pressure in the derivatives market remains heavy.
- If the current price of 0.01366 loses 0.01302: try a small short position (isolated margin, 3–5x); exit if price recovers above that level. Downside target: 0.00683.
- If a rebound to 0.01834 meets resistance: enter a short on confirmation; exit if price breaks above 0.019186. Look to the previous low as the downside target.
- If price retests the previous low and holds: try a small, short-term long; exit if it breaks below. Look to the resistance level as the upside target.
With the negative funding rate alert for $RARE , would you first try a small position to catch a rebound, or wait for confirmed resistance before acting?
Watchlist: $HUMA
#RARE合约信号 #合约交易 #Binance Square
Personal opinion only; not investment advice. DYOR.
Funding rate as low as -0.922%: shorts are overly crowded, making a rebound more likely. The futures contract is trading at a 1.85% discount to spot, and selling pressure in the derivatives market remains heavy.
- If the current price of 0.01366 loses 0.01302: try a small short position (isolated margin, 3–5x); exit if price recovers above that level. Downside target: 0.00683.
- If a rebound to 0.01834 meets resistance: enter a short on confirmation; exit if price breaks above 0.019186. Look to the previous low as the downside target.
- If price retests the previous low and holds: try a small, short-term long; exit if it breaks below. Look to the resistance level as the upside target.
With the negative funding rate alert for $RARE , would you first try a small position to catch a rebound, or wait for confirmed resistance before acting?
Watchlist: $HUMA
#RARE合约信号 #合约交易 #Binance Square
Personal opinion only; not investment advice. DYOR.
113
·
--
Volume explosion! $INJ bulls are making their move
Just now, $INJ surged on 2.4x hourly volume, while open interest in futures contracts jumped by over 4.2%. Aggressive buying is overwhelming selling. The negative basis combined with low funding rates suggests bears are still stubbornly holding on, and the market could trigger a short squeeze at any moment.
At 7.47 USDT, the price is hovering just below the previous high of 7.554. For entries, watch for a volume-backed breakout above 7.47–7.554, or buy the dip if the price retests support at 6.616 and holds. If it breaks through and stays above, the short liquidation zone at 7.7506 could be taken out quickly, with trend-following targets at 8.6569–9.646.
The risk management plan is clear: keep a hard stop at 6.4809. If the price falls below that level, admit the trade is wrong and exit without hesitation. Consider using isolated margin, and don't get carried away.
With $INJ about to hit resistance at 7.554 head-on, would you jump in at the current price and bet on a short squeeze, or wait for a rally and then short it?
#INJ合约信号 #合约交易 #Binance Square
Personal opinion only; this is not investment advice. DYOR
Volume explosion! $INJ bulls are making their move
Just now, $INJ surged on 2.4x hourly volume, while open interest in futures contracts jumped by over 4.2%. Aggressive buying is overwhelming selling. The negative basis combined with low funding rates suggests bears are still stubbornly holding on, and the market could trigger a short squeeze at any moment.
At 7.47 USDT, the price is hovering just below the previous high of 7.554. For entries, watch for a volume-backed breakout above 7.47–7.554, or buy the dip if the price retests support at 6.616 and holds. If it breaks through and stays above, the short liquidation zone at 7.7506 could be taken out quickly, with trend-following targets at 8.6569–9.646.
The risk management plan is clear: keep a hard stop at 6.4809. If the price falls below that level, admit the trade is wrong and exit without hesitation. Consider using isolated margin, and don't get carried away.
With $INJ about to hit resistance at 7.554 head-on, would you jump in at the current price and bet on a short squeeze, or wait for a rally and then short it?
#INJ合约信号 #合约交易 #Binance Square
Personal opinion only; this is not investment advice. DYOR
Just now, $INJ surged on 2.4x hourly volume, while open interest in futures contracts jumped by over 4.2%. Aggressive buying is overwhelming selling. The negative basis combined with low funding rates suggests bears are still stubbornly holding on, and the market could trigger a short squeeze at any moment.
At 7.47 USDT, the price is hovering just below the previous high of 7.554. For entries, watch for a volume-backed breakout above 7.47–7.554, or buy the dip if the price retests support at 6.616 and holds. If it breaks through and stays above, the short liquidation zone at 7.7506 could be taken out quickly, with trend-following targets at 8.6569–9.646.
The risk management plan is clear: keep a hard stop at 6.4809. If the price falls below that level, admit the trade is wrong and exit without hesitation. Consider using isolated margin, and don't get carried away.
With $INJ about to hit resistance at 7.554 head-on, would you jump in at the current price and bet on a short squeeze, or wait for a rally and then short it?
#INJ合约信号 #合约交易 #Binance Square
Personal opinion only; this is not investment advice. DYOR
185
Log in to explore more content
Join global crypto users on Binance Square
⚡️ Get latest and useful information about crypto.
💬 Trusted by the world’s largest crypto exchange.
👍 Discover real insights from verified creators.
Email / Phone number
Trending Topics
NvidiaBeatsEstimatesWith$130BQ4Outlook
7,459 views
119 Discussing
Nvidia Beats With $115.8 Billion in Revenue, Guides to $130 Billion and Adds $150 Billion Buyback
Binance News
·39 Likes
·38.2k views
AnthropicIPOPriceCouldExceed$80
13,688 views
117 Discussing
CanNvidia’sDataCenterGrowthContinue?
39,448 views
556 Discussing