
奔跑财经-FinaceRun
7.7k Posts

奔跑财经-FinaceRun
 Square Verified+
Report
Block User
区块链深度服务媒体

原创之星

Level 1 Creator
Frequent Trader
5.7 Years
31 Following
31.9K+ Followers
86.6K+ Liked
2 Badges
Posts
All
Quotes
Videos
Early Thursday morning! The Fed may welcome the first rate hike of the “Vaush era”
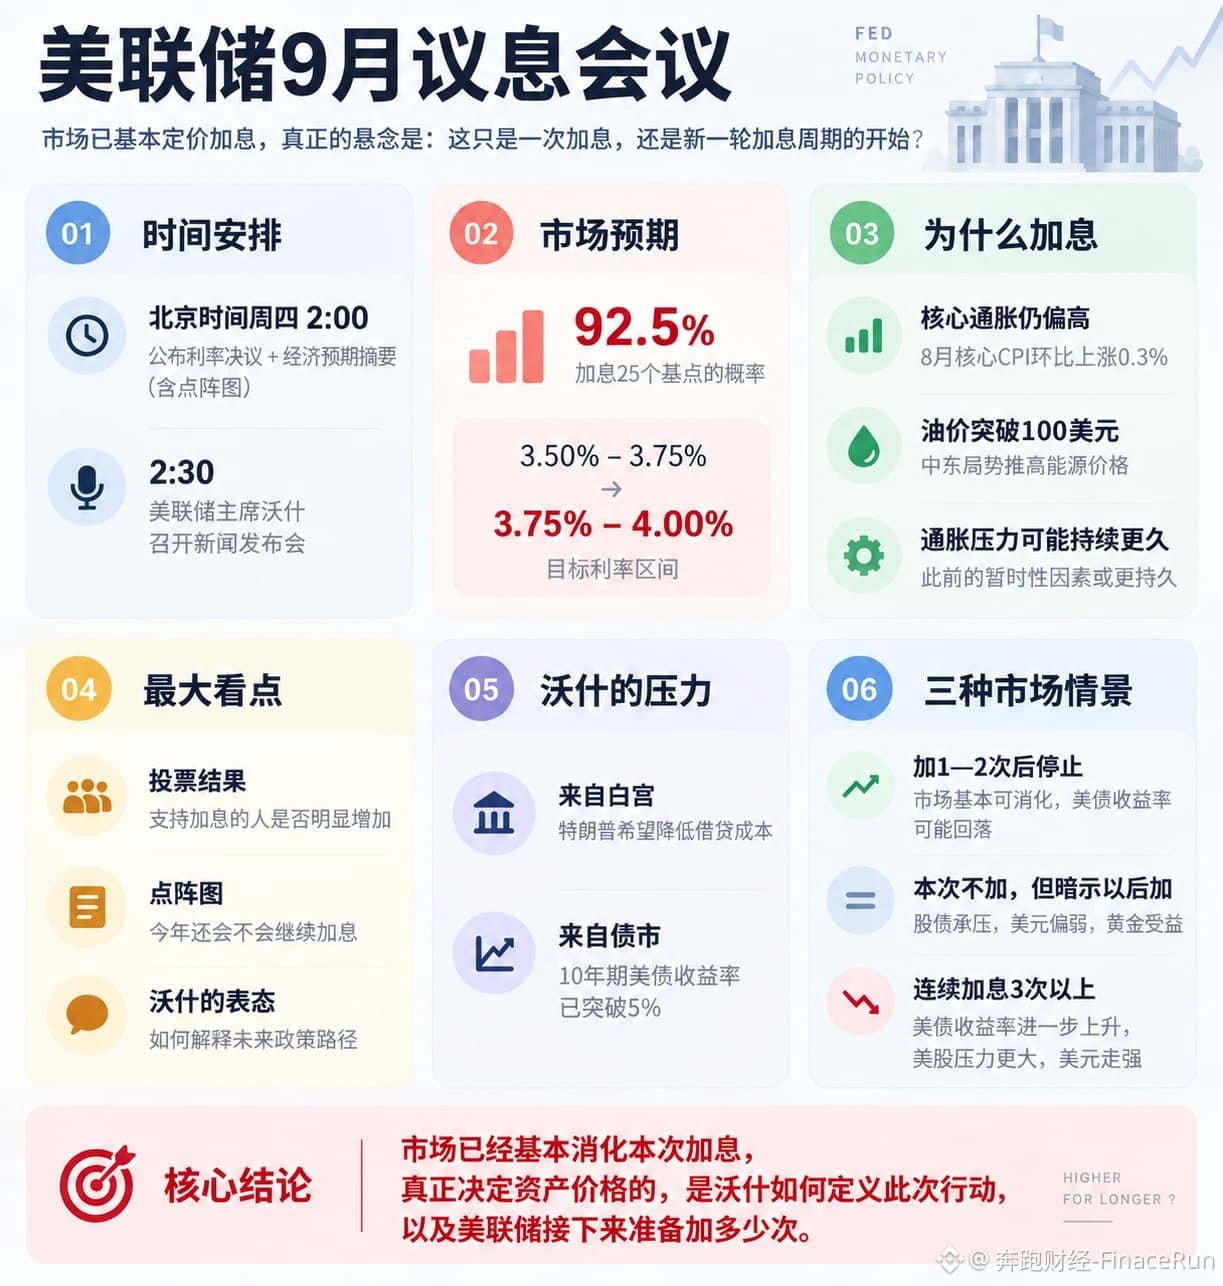
At 2:00 a.m. Beijing time on Thursday, September 17, the FOMC will release its Federal Funds Rate decision and the Summary of Economic Projections. Half an hour later, Fed Chair Kevin Vaush will hold a press conference to explain the outlook for the economy and inflation expectations.
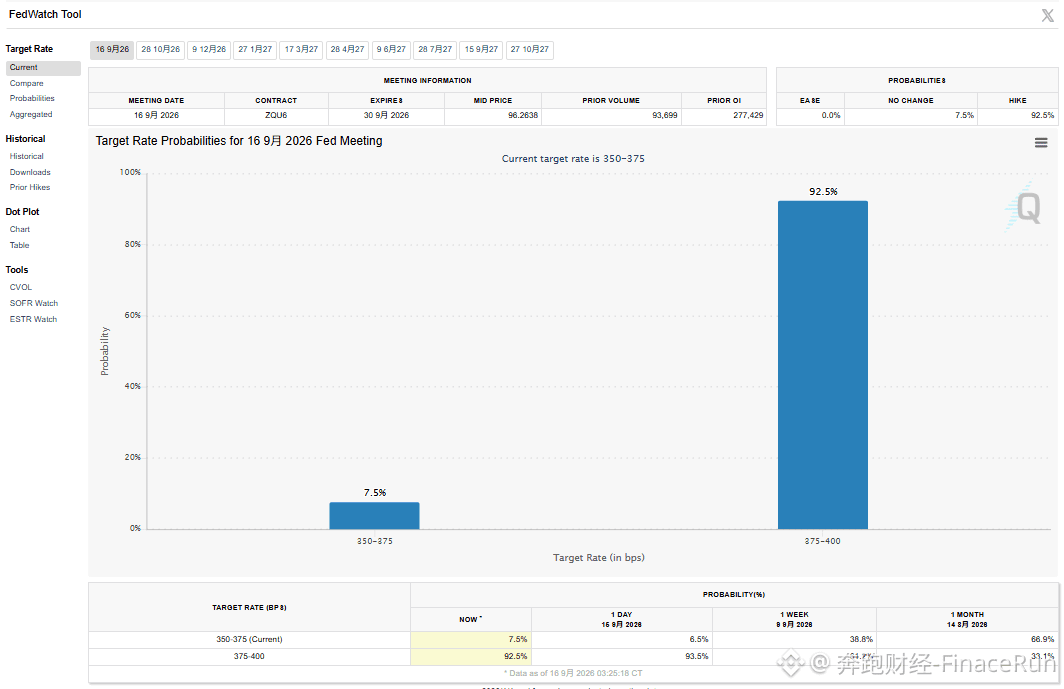
Currently, the market has priced in a 92.5% probability of a 25-basis-point hike. The market’s focus has shifted from “whether to hike” to “how many more times to hike afterward.”
But what is truly worth watching is not the nearly certain hike itself, but whether Vaush can use it to regain control of the policy narrative.
The market has already made the Fed’s first choice in advance. Next, Vaush must send the market’s key signal: why a rate hike is necessary now, and what will happen in the market after the hike?
Analysts believe that if Vaush only signals one or two modest hikes, U.S. equities and the Treasury market may be able to digest the impact. Equities may experience volatility in the short term, but not spiral out of control;
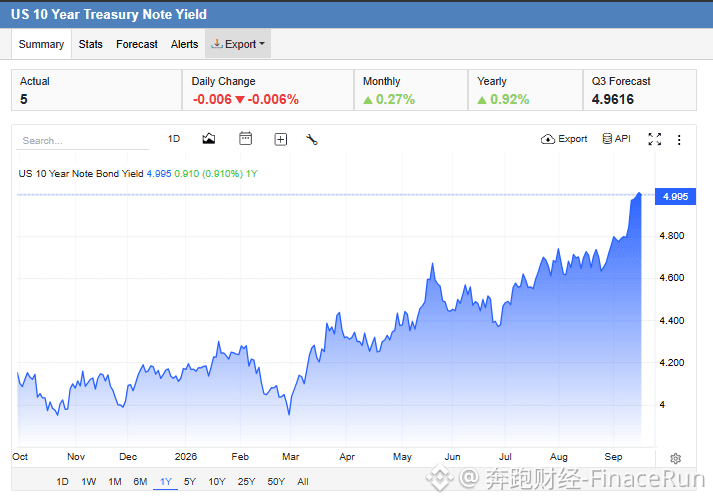
however, if Vaush signals a series of consecutive hikes, the yield on the 10-year U.S. Treasury is likely to hold above 5%. At that point, U.S. stocks and dollar-denominated assets will face intense volatility.
In addition, Vaush is also dealing with the pressure from Trump to keep global borrowing costs at the lowest levels, as well as the reality that the 10-year Treasury yield has broken above 5%.
In other words, a rate hike would conflict with the White House’s desire for rate cuts; if there is no hike, Vaush would need to explain when the earlier hawkish remarks can be delivered.
Even more difficult is that Vaush has consistently argued against providing forward-looking policy guidance, and this time the market is sure to ask: is this rate-hike move a one-off action, or the start of a series?
In summary, Wall Street has laid out three scenario projections. If the Fed’s hiking path is “one to two hikes and then ends,” U.S. stocks and Treasuries are considered capable of absorbing it, and the 10-year yield could potentially fall slightly;
by contrast, if the Fed stays put but signals that hikes will occur within the year, long-end yields may rise, currency-depreciation trades may heat up again, and gold would benefit;
but if it signals three or more consecutive hikes, the 10-year Treasury yield could clearly break above 5%, U.S. stocks would be under pressure and fall, and the dollar would strengthen significantly.
No matter which rate-path scenario emerges, Vaush’s press conference may have a bigger impact on the market than the rate decision itself.
#美联储利率决议
Early Thursday morning! The Fed may welcome the first rate hike of the “Vaush era”
At 2:00 a.m. Beijing time on Thursday, September 17, the FOMC will release its Federal Funds Rate decision and the Summary of Economic Projections. Half an hour later, Fed Chair Kevin Vaush will hold a press conference to explain the outlook for the economy and inflation expectations.
Currently, the market has priced in a 92.5% probability of a 25-basis-point hike. The market’s focus has shifted from “whether to hike” to “how many more times to hike afterward.”
But what is truly worth watching is not the nearly certain hike itself, but whether Vaush can use it to regain control of the policy narrative.
The market has already made the Fed’s first choice in advance. Next, Vaush must send the market’s key signal: why a rate hike is necessary now, and what will happen in the market after the hike?
Analysts believe that if Vaush only signals one or two modest hikes, U.S. equities and the Treasury market may be able to digest the impact. Equities may experience volatility in the short term, but not spiral out of control;
however, if Vaush signals a series of consecutive hikes, the yield on the 10-year U.S. Treasury is likely to hold above 5%. At that point, U.S. stocks and dollar-denominated assets will face intense volatility.
In addition, Vaush is also dealing with the pressure from Trump to keep global borrowing costs at the lowest levels, as well as the reality that the 10-year Treasury yield has broken above 5%.
In other words, a rate hike would conflict with the White House’s desire for rate cuts; if there is no hike, Vaush would need to explain when the earlier hawkish remarks can be delivered.
Even more difficult is that Vaush has consistently argued against providing forward-looking policy guidance, and this time the market is sure to ask: is this rate-hike move a one-off action, or the start of a series?
In summary, Wall Street has laid out three scenario projections. If the Fed’s hiking path is “one to two hikes and then ends,” U.S. stocks and Treasuries are considered capable of absorbing it, and the 10-year yield could potentially fall slightly;
by contrast, if the Fed stays put but signals that hikes will occur within the year, long-end yields may rise, currency-depreciation trades may heat up again, and gold would benefit;
but if it signals three or more consecutive hikes, the 10-year Treasury yield could clearly break above 5%, U.S. stocks would be under pressure and fall, and the dollar would strengthen significantly.
No matter which rate-path scenario emerges, Vaush’s press conference may have a bigger impact on the market than the rate decision itself.
#美联储利率决议
At 2:00 a.m. Beijing time on Thursday, September 17, the FOMC will release its Federal Funds Rate decision and the Summary of Economic Projections. Half an hour later, Fed Chair Kevin Vaush will hold a press conference to explain the outlook for the economy and inflation expectations.
Currently, the market has priced in a 92.5% probability of a 25-basis-point hike. The market’s focus has shifted from “whether to hike” to “how many more times to hike afterward.”
But what is truly worth watching is not the nearly certain hike itself, but whether Vaush can use it to regain control of the policy narrative.
The market has already made the Fed’s first choice in advance. Next, Vaush must send the market’s key signal: why a rate hike is necessary now, and what will happen in the market after the hike?
Analysts believe that if Vaush only signals one or two modest hikes, U.S. equities and the Treasury market may be able to digest the impact. Equities may experience volatility in the short term, but not spiral out of control;
however, if Vaush signals a series of consecutive hikes, the yield on the 10-year U.S. Treasury is likely to hold above 5%. At that point, U.S. stocks and dollar-denominated assets will face intense volatility.
In addition, Vaush is also dealing with the pressure from Trump to keep global borrowing costs at the lowest levels, as well as the reality that the 10-year Treasury yield has broken above 5%.
In other words, a rate hike would conflict with the White House’s desire for rate cuts; if there is no hike, Vaush would need to explain when the earlier hawkish remarks can be delivered.
Even more difficult is that Vaush has consistently argued against providing forward-looking policy guidance, and this time the market is sure to ask: is this rate-hike move a one-off action, or the start of a series?
In summary, Wall Street has laid out three scenario projections. If the Fed’s hiking path is “one to two hikes and then ends,” U.S. stocks and Treasuries are considered capable of absorbing it, and the 10-year yield could potentially fall slightly;
by contrast, if the Fed stays put but signals that hikes will occur within the year, long-end yields may rise, currency-depreciation trades may heat up again, and gold would benefit;
but if it signals three or more consecutive hikes, the 10-year Treasury yield could clearly break above 5%, U.S. stocks would be under pressure and fall, and the dollar would strengthen significantly.
No matter which rate-path scenario emerges, Vaush’s press conference may have a bigger impact on the market than the rate decision itself.
#美联储利率决议
441
After the “CLARITY Act” procedural vote failed, Tim Scott turned his sights on the Democrats
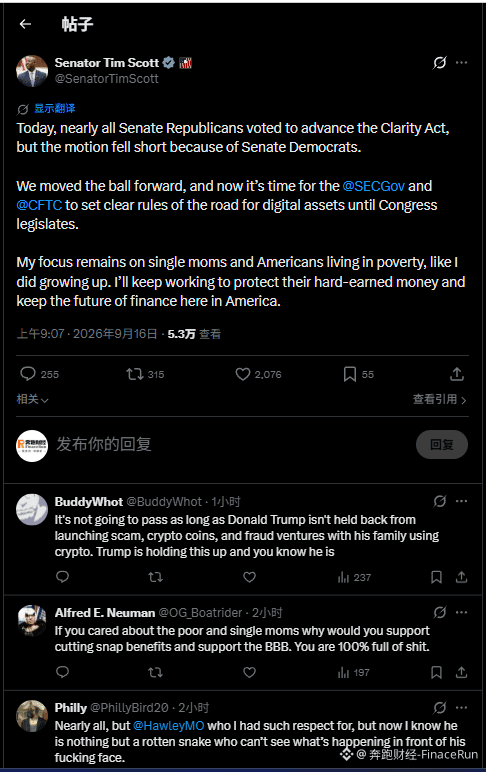
On September 16, U.S. Senator Tim Scott spoke out publicly after the procedural vote on the “CLARITY Act” failed, directing his criticism at Senate Democrats.
In a post on X, he said that on that day nearly all Senate Republicans voted in favor of moving the bill forward, but it failed to reach the required threshold due to opposition from the Democratic side.
Scott said this vote had pushed the legislative process forward, and that the next step should be for the SEC and the CFTC to first develop clear regulatory rules for digital assets, until Congress completes the relevant legislation.
He emphasized that his work focus remains helping single mothers and other low-income Americans like him—protecting the money they’ve earned through hard work, and ensuring the future of American finance.
Reactions in the comments section were intense. Some users criticized the Trump family for profiting from crypto projects, arguing that as long as such conflicts of interest exist, investment in the bill would be difficult to get passed;
Others questioned whether, if someone truly cared about low-income groups, they should support policies that cut benefits such as food stamps. Still others tagged Republican Senator Josh Hawley, expressing disappointment with his stance against advancing the bill.
What do you think of Tim Scott’s statement? Do you think there’s a possibility the bill could be revived this year? Leave your views in the comments!
#CLARITY法案
After the “CLARITY Act” procedural vote failed, Tim Scott turned his sights on the Democrats
On September 16, U.S. Senator Tim Scott spoke out publicly after the procedural vote on the “CLARITY Act” failed, directing his criticism at Senate Democrats.
In a post on X, he said that on that day nearly all Senate Republicans voted in favor of moving the bill forward, but it failed to reach the required threshold due to opposition from the Democratic side.
Scott said this vote had pushed the legislative process forward, and that the next step should be for the SEC and the CFTC to first develop clear regulatory rules for digital assets, until Congress completes the relevant legislation.
He emphasized that his work focus remains helping single mothers and other low-income Americans like him—protecting the money they’ve earned through hard work, and ensuring the future of American finance.
Reactions in the comments section were intense. Some users criticized the Trump family for profiting from crypto projects, arguing that as long as such conflicts of interest exist, investment in the bill would be difficult to get passed;
Others questioned whether, if someone truly cared about low-income groups, they should support policies that cut benefits such as food stamps. Still others tagged Republican Senator Josh Hawley, expressing disappointment with his stance against advancing the bill.
What do you think of Tim Scott’s statement? Do you think there’s a possibility the bill could be revived this year? Leave your views in the comments!
#CLARITY法案
On September 16, U.S. Senator Tim Scott spoke out publicly after the procedural vote on the “CLARITY Act” failed, directing his criticism at Senate Democrats.
In a post on X, he said that on that day nearly all Senate Republicans voted in favor of moving the bill forward, but it failed to reach the required threshold due to opposition from the Democratic side.
Scott said this vote had pushed the legislative process forward, and that the next step should be for the SEC and the CFTC to first develop clear regulatory rules for digital assets, until Congress completes the relevant legislation.
He emphasized that his work focus remains helping single mothers and other low-income Americans like him—protecting the money they’ve earned through hard work, and ensuring the future of American finance.
Reactions in the comments section were intense. Some users criticized the Trump family for profiting from crypto projects, arguing that as long as such conflicts of interest exist, investment in the bill would be difficult to get passed;
Others questioned whether, if someone truly cared about low-income groups, they should support policies that cut benefits such as food stamps. Still others tagged Republican Senator Josh Hawley, expressing disappointment with his stance against advancing the bill.
What do you think of Tim Scott’s statement? Do you think there’s a possibility the bill could be revived this year? Leave your views in the comments!
#CLARITY法案
1.6k
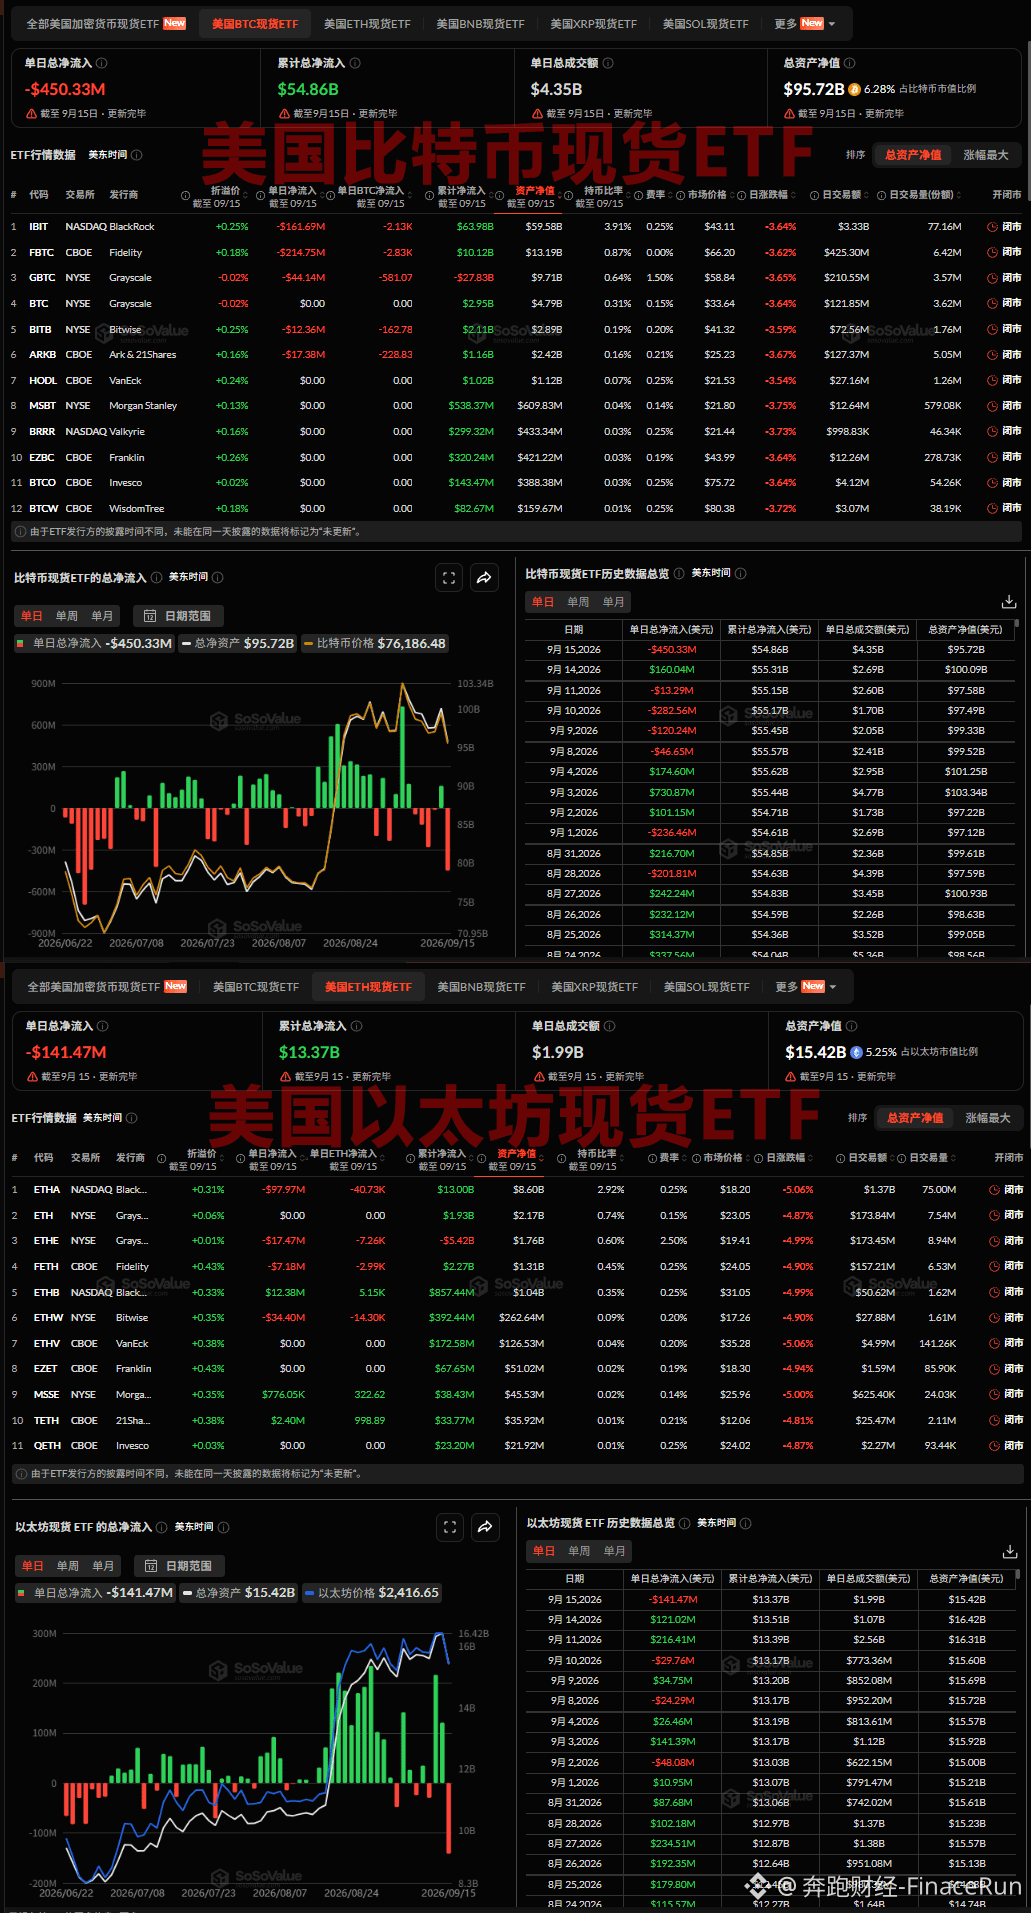
US BTC and ETH Spot ETF See $592 Million Cumulative Net Outflows on Tuesday
September 16 report: According to SoSovalue data, US BTC spot ETFs saw nearly $450 million in net outflows yesterday, marking the first day of total net outflows since the start of the week;
Among them, Fidelity’s FBTC and BlackRock’s IBIT recorded the largest and second-largest net outflows, with nearly $215 million (about 2,830 BTC) and $162 million (about 2,130 BTC), respectively;
Next were Grayscale’s GBTC, Ark&21Shares’ ARKB, and Bitwise’s BITB, which recorded daily net outflows of $44.14 million (581.07 BTC), $17.38 million (228.83 BTC), and $12.36 million (162.78 BTC), respectively;
As of now, the total net asset value of Bitcoin spot ETFs is $95.72 billion, accounting for 6.28% of Bitcoin’s total market capitalization, with cumulative total net inflows of $54.86 billion.
On the same day, US Ethereum spot ETFs recorded $141 million, also logging the first day of total net outflows since the start of the week;
Among them, BlackRock’s ETHA and Bitwise’s ETHW recorded daily net outflows of $97.97 million (about 40,730 ETH) and $34.40 million (about 14,300 ETH), respectively;
Next were Grayscale’s ETHE and Fidelity’s FETH, with daily net outflows of $17.47 million (about 7,260 ETH) and $7.18 million (about 2,990 ETH), respectively;
Meanwhile, BlackRock’s ETHB, 21Shares’ TETH, and Morgan Stanley’s MSSE recorded daily net inflows of $12.38 million (about 5,150 ETH), $2.40 million (998.89 ETH), and $0.776 million (322.62 ETH), respectively;
As of now, the total net asset value of Ethereum spot ETFs is $15.42 billion, accounting for 5.25% of Ethereum’s total market capitalization, with cumulative total net inflows of $13.37 billion.
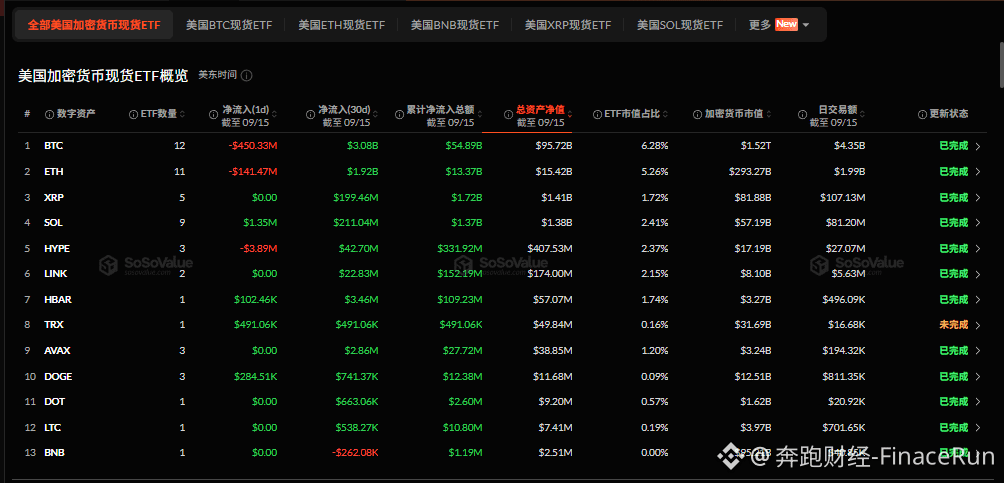
Across other categories of crypto ETFs, besides the HYPE ETF which recorded total net outflows of $3.89 million yesterday, the SOL, TRX, DOGE, and HBAR ETFs all recorded total net inflows to varying degrees on a daily basis.
#比特币ETF #以太坊ETF
US BTC and ETH Spot ETF See $592 Million Cumulative Net Outflows on Tuesday
September 16 report: According to SoSovalue data, US BTC spot ETFs saw nearly $450 million in net outflows yesterday, marking the first day of total net outflows since the start of the week;
Among them, Fidelity’s FBTC and BlackRock’s IBIT recorded the largest and second-largest net outflows, with nearly $215 million (about 2,830 BTC) and $162 million (about 2,130 BTC), respectively;
Next were Grayscale’s GBTC, Ark&21Shares’ ARKB, and Bitwise’s BITB, which recorded daily net outflows of $44.14 million (581.07 BTC), $17.38 million (228.83 BTC), and $12.36 million (162.78 BTC), respectively;
As of now, the total net asset value of Bitcoin spot ETFs is $95.72 billion, accounting for 6.28% of Bitcoin’s total market capitalization, with cumulative total net inflows of $54.86 billion.
On the same day, US Ethereum spot ETFs recorded $141 million, also logging the first day of total net outflows since the start of the week;
Among them, BlackRock’s ETHA and Bitwise’s ETHW recorded daily net outflows of $97.97 million (about 40,730 ETH) and $34.40 million (about 14,300 ETH), respectively;
Next were Grayscale’s ETHE and Fidelity’s FETH, with daily net outflows of $17.47 million (about 7,260 ETH) and $7.18 million (about 2,990 ETH), respectively;
Meanwhile, BlackRock’s ETHB, 21Shares’ TETH, and Morgan Stanley’s MSSE recorded daily net inflows of $12.38 million (about 5,150 ETH), $2.40 million (998.89 ETH), and $0.776 million (322.62 ETH), respectively;
As of now, the total net asset value of Ethereum spot ETFs is $15.42 billion, accounting for 5.25% of Ethereum’s total market capitalization, with cumulative total net inflows of $13.37 billion.
Across other categories of crypto ETFs, besides the HYPE ETF which recorded total net outflows of $3.89 million yesterday, the SOL, TRX, DOGE, and HBAR ETFs all recorded total net inflows to varying degrees on a daily basis.
#比特币ETF #以太坊ETF
September 16 report: According to SoSovalue data, US BTC spot ETFs saw nearly $450 million in net outflows yesterday, marking the first day of total net outflows since the start of the week;
Among them, Fidelity’s FBTC and BlackRock’s IBIT recorded the largest and second-largest net outflows, with nearly $215 million (about 2,830 BTC) and $162 million (about 2,130 BTC), respectively;
Next were Grayscale’s GBTC, Ark&21Shares’ ARKB, and Bitwise’s BITB, which recorded daily net outflows of $44.14 million (581.07 BTC), $17.38 million (228.83 BTC), and $12.36 million (162.78 BTC), respectively;
As of now, the total net asset value of Bitcoin spot ETFs is $95.72 billion, accounting for 6.28% of Bitcoin’s total market capitalization, with cumulative total net inflows of $54.86 billion.
On the same day, US Ethereum spot ETFs recorded $141 million, also logging the first day of total net outflows since the start of the week;
Among them, BlackRock’s ETHA and Bitwise’s ETHW recorded daily net outflows of $97.97 million (about 40,730 ETH) and $34.40 million (about 14,300 ETH), respectively;
Next were Grayscale’s ETHE and Fidelity’s FETH, with daily net outflows of $17.47 million (about 7,260 ETH) and $7.18 million (about 2,990 ETH), respectively;
Meanwhile, BlackRock’s ETHB, 21Shares’ TETH, and Morgan Stanley’s MSSE recorded daily net inflows of $12.38 million (about 5,150 ETH), $2.40 million (998.89 ETH), and $0.776 million (322.62 ETH), respectively;
As of now, the total net asset value of Ethereum spot ETFs is $15.42 billion, accounting for 5.25% of Ethereum’s total market capitalization, with cumulative total net inflows of $13.37 billion.
Across other categories of crypto ETFs, besides the HYPE ETF which recorded total net outflows of $3.89 million yesterday, the SOL, TRX, DOGE, and HBAR ETFs all recorded total net inflows to varying degrees on a daily basis.
#比特币ETF #以太坊ETF
1
1
453
Verified
U.S. Treasury Secretary Bessent: No long-term Treasury yield target set; repo operations show notable effectiveness
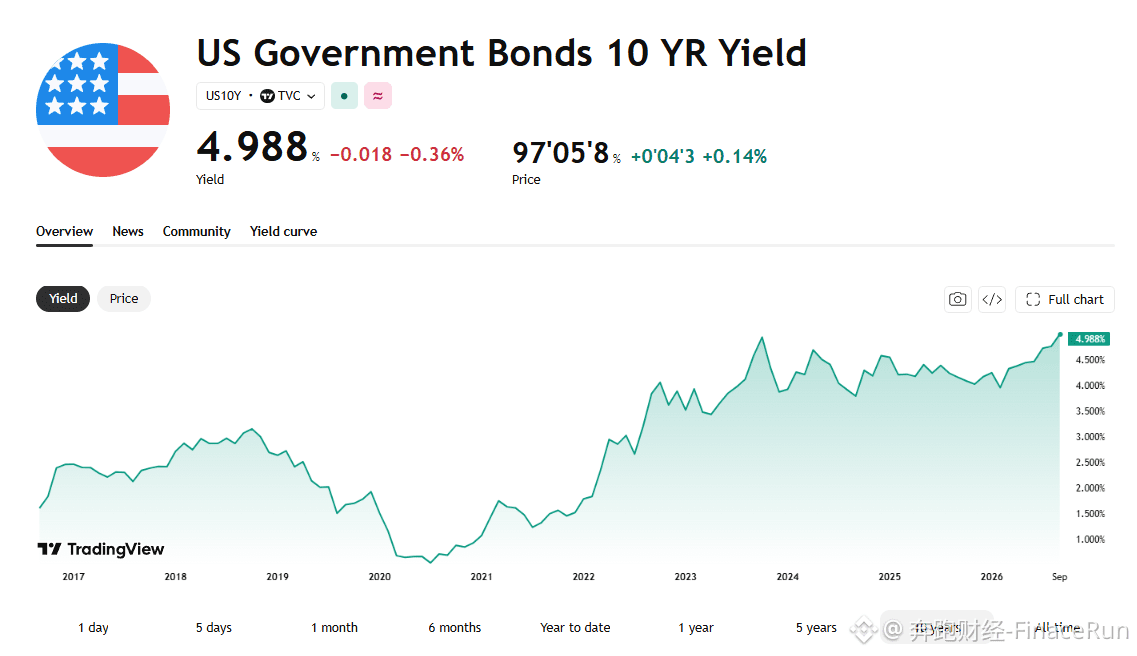
September 16 — U.S. Treasury Secretary Scott Bessent said that the U.S. Treasury will not set a “target price” for long-term Treasury yields or endorse an official equilibrium level, and acknowledged that administrative force cannot determine market pricing.
Bessent disclosed that the Treasury’s recent repurchase (repo) actions for long-term U.S. Treasuries have achieved significant results. The two Treasury auctions held after the intervention both showed strong market demand.
However, despite the Treasury’s largest-scale repurchase last week, U.S. Treasury yields continued to rise. Bessent previously viewed repurchases as a way to inject liquidity and curb the rise in yields, because higher yields increase the government’s debt-servicing costs.
In response to this development, Bessent told a congressional hearing: “We can imagine what would have happened if we hadn’t taken these steps, and yet we subsequently managed to complete the two most successful Treasury auctions in 20 years.”
Bessent also emphasized that since Trump took office, the U.S. bond market has performed best among developed countries. This statement was intended to address outside doubts about the rise in yields, indicating that current volatility in the bond market remains within a controllable range and that the repurchase operations have not failed.
Overall, the Treasury is unwilling to directly intervene in market pricing, yet it uses tools such as repurchases to ease debt-servicing pressure—highlighting the dilemma the Treasury faces in balancing market principles with fiscal realities.
Although he stressed that the bond market performance is strong, yields have continued to climb, leaving market participants doubtful about the actual effectiveness of the Treasury’s policies.
#国债收益率
U.S. Treasury Secretary Bessent: No long-term Treasury yield target set; repo operations show notable effectiveness
September 16 — U.S. Treasury Secretary Scott Bessent said that the U.S. Treasury will not set a “target price” for long-term Treasury yields or endorse an official equilibrium level, and acknowledged that administrative force cannot determine market pricing.
Bessent disclosed that the Treasury’s recent repurchase (repo) actions for long-term U.S. Treasuries have achieved significant results. The two Treasury auctions held after the intervention both showed strong market demand.
However, despite the Treasury’s largest-scale repurchase last week, U.S. Treasury yields continued to rise. Bessent previously viewed repurchases as a way to inject liquidity and curb the rise in yields, because higher yields increase the government’s debt-servicing costs.
In response to this development, Bessent told a congressional hearing: “We can imagine what would have happened if we hadn’t taken these steps, and yet we subsequently managed to complete the two most successful Treasury auctions in 20 years.”
Bessent also emphasized that since Trump took office, the U.S. bond market has performed best among developed countries. This statement was intended to address outside doubts about the rise in yields, indicating that current volatility in the bond market remains within a controllable range and that the repurchase operations have not failed.
Overall, the Treasury is unwilling to directly intervene in market pricing, yet it uses tools such as repurchases to ease debt-servicing pressure—highlighting the dilemma the Treasury faces in balancing market principles with fiscal realities.
Although he stressed that the bond market performance is strong, yields have continued to climb, leaving market participants doubtful about the actual effectiveness of the Treasury’s policies.
#国债收益率
September 16 — U.S. Treasury Secretary Scott Bessent said that the U.S. Treasury will not set a “target price” for long-term Treasury yields or endorse an official equilibrium level, and acknowledged that administrative force cannot determine market pricing.
Bessent disclosed that the Treasury’s recent repurchase (repo) actions for long-term U.S. Treasuries have achieved significant results. The two Treasury auctions held after the intervention both showed strong market demand.
However, despite the Treasury’s largest-scale repurchase last week, U.S. Treasury yields continued to rise. Bessent previously viewed repurchases as a way to inject liquidity and curb the rise in yields, because higher yields increase the government’s debt-servicing costs.
In response to this development, Bessent told a congressional hearing: “We can imagine what would have happened if we hadn’t taken these steps, and yet we subsequently managed to complete the two most successful Treasury auctions in 20 years.”
Bessent also emphasized that since Trump took office, the U.S. bond market has performed best among developed countries. This statement was intended to address outside doubts about the rise in yields, indicating that current volatility in the bond market remains within a controllable range and that the repurchase operations have not failed.
Overall, the Treasury is unwilling to directly intervene in market pricing, yet it uses tools such as repurchases to ease debt-servicing pressure—highlighting the dilemma the Treasury faces in balancing market principles with fiscal realities.
Although he stressed that the bond market performance is strong, yields have continued to climb, leaving market participants doubtful about the actual effectiveness of the Treasury’s policies.
#国债收益率
1
785
OpenAI weighs additional financing before its IPO, valuation may reach $1.2 trillion
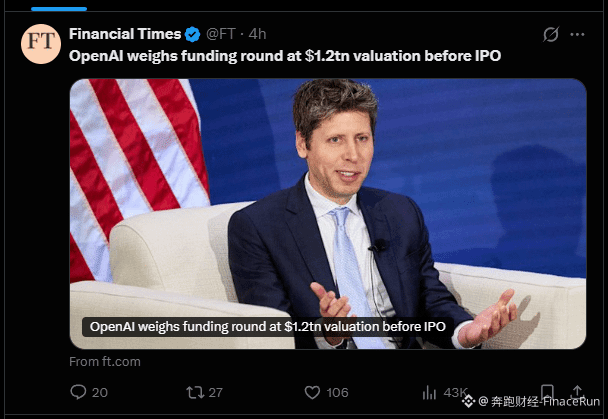
According to a report by the Financial Times in the UK, OpenAI is planning a new round of private financing ahead of its IPO and has already begun preliminary discussions with investors.
The target valuation for this round is about $1.2 trillion. This figure represents a significant increase of roughly 41% from the $8.52 billion valuation reported when the company completed a financing round in March of this year.
Insiders say that this round of outreach was initiated by investors rather than driven by OpenAI. As a result, the final amount raised may change over the coming months, and the specific timing will depend on OpenAI’s IPO schedule.
Last Saturday, OpenAI CEO Sam Altman also said externally that the company’s IPO timing is "unlikely to be earlier than 2027." This suggests that OpenAI still has ample time to complete this round of financing before going public.
From a financial performance perspective, OpenAI’s rapidly expanding business fundamentals are what support its high valuation. Data shows that the company spent about $34 billion last year, indicating large-scale investment in research and development and infrastructure;
After entering 2026, revenue growth has continued to accelerate. With the release of GPT-5.6 last month, OpenAI’s annualized revenue growth is 20%, and it has already surpassed the $40 billion mark.
Taken together, these financial figures provide strong support for OpenAI’s high-valuation financing goal, and also reflect investors’ confidence in the long-term outlook for the AI industry.
Finally, with annualized revenue above $40 billion and a valuation of $1.2 trillion, what do you think about OpenAI’s revenue-to-valuation ratio? Do you believe this round of financing will change the competitive landscape in the AI race?
#OpenAI再融资
OpenAI weighs additional financing before its IPO, valuation may reach $1.2 trillion
According to a report by the Financial Times in the UK, OpenAI is planning a new round of private financing ahead of its IPO and has already begun preliminary discussions with investors.
The target valuation for this round is about $1.2 trillion. This figure represents a significant increase of roughly 41% from the $8.52 billion valuation reported when the company completed a financing round in March of this year.
Insiders say that this round of outreach was initiated by investors rather than driven by OpenAI. As a result, the final amount raised may change over the coming months, and the specific timing will depend on OpenAI’s IPO schedule.
Last Saturday, OpenAI CEO Sam Altman also said externally that the company’s IPO timing is "unlikely to be earlier than 2027." This suggests that OpenAI still has ample time to complete this round of financing before going public.
From a financial performance perspective, OpenAI’s rapidly expanding business fundamentals are what support its high valuation. Data shows that the company spent about $34 billion last year, indicating large-scale investment in research and development and infrastructure;
After entering 2026, revenue growth has continued to accelerate. With the release of GPT-5.6 last month, OpenAI’s annualized revenue growth is 20%, and it has already surpassed the $40 billion mark.
Taken together, these financial figures provide strong support for OpenAI’s high-valuation financing goal, and also reflect investors’ confidence in the long-term outlook for the AI industry.
Finally, with annualized revenue above $40 billion and a valuation of $1.2 trillion, what do you think about OpenAI’s revenue-to-valuation ratio? Do you believe this round of financing will change the competitive landscape in the AI race?
#OpenAI再融资
According to a report by the Financial Times in the UK, OpenAI is planning a new round of private financing ahead of its IPO and has already begun preliminary discussions with investors.
The target valuation for this round is about $1.2 trillion. This figure represents a significant increase of roughly 41% from the $8.52 billion valuation reported when the company completed a financing round in March of this year.
Insiders say that this round of outreach was initiated by investors rather than driven by OpenAI. As a result, the final amount raised may change over the coming months, and the specific timing will depend on OpenAI’s IPO schedule.
Last Saturday, OpenAI CEO Sam Altman also said externally that the company’s IPO timing is "unlikely to be earlier than 2027." This suggests that OpenAI still has ample time to complete this round of financing before going public.
From a financial performance perspective, OpenAI’s rapidly expanding business fundamentals are what support its high valuation. Data shows that the company spent about $34 billion last year, indicating large-scale investment in research and development and infrastructure;
After entering 2026, revenue growth has continued to accelerate. With the release of GPT-5.6 last month, OpenAI’s annualized revenue growth is 20%, and it has already surpassed the $40 billion mark.
Taken together, these financial figures provide strong support for OpenAI’s high-valuation financing goal, and also reflect investors’ confidence in the long-term outlook for the AI industry.
Finally, with annualized revenue above $40 billion and a valuation of $1.2 trillion, what do you think about OpenAI’s revenue-to-valuation ratio? Do you believe this round of financing will change the competitive landscape in the AI race?
#OpenAI再融资
1
3.6k
The U.S. Senate rejects the CLARITY Act, casting a shadow over prospects for crypto legislation; markets fall in response
On September 15, local time, the U.S. Senate held a key procedural vote on the Digital Asset Market Clarity Act (CLARITY Act). It ultimately failed to pass, with 49 votes in favor and 50 against—far short of the 60-vote threshold needed to advance the bill.
The vote failure sent Bitcoin down about 4% in the short term, while crypto-related stocks such as Coinbase and Circle fell even more sharply. Prediction market platform Kalshi also cut its probability estimate that the bill would become law within 2026 to single digits.
The voting results show that, aside from Democratic Senator Chris Coons not participating, all Democratic senators present and all independent senators voted against the bill.
In addition, fractures also emerged within the Republican camp: four Republican lawmakers—Susan Collins, Josh Hawley, Jerry Moran, and Thom Tillis—joined the ranks voting against.
Although Senator Thom Tillis later proposed a motion for reconsideration, keeping the possibility of revisiting the matter, this setback undoubtedly deals a major blow to the bill’s prospects.
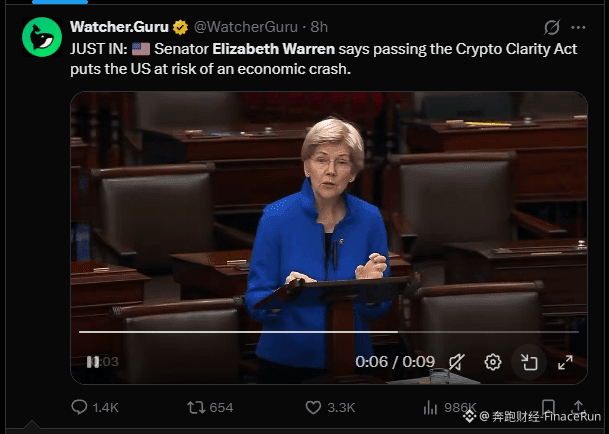
After the results were announced, Democratic Senator Elizabeth Warren clearly stated that although she remains determined to push crypto legislation forward, she does not support the current version of the CLARITY Act.
Warren emphasized that the bill is Washington’s “first substantive opportunity for crypto regulation,” but that the final version must include rules for crypto investments by public officials, provisions on national security and consumer protection, and stronger measures to combat illegal financing and terrorism.
Notably, Warren’s influence in the crypto legislative process may grow further. Kalshi, a prediction market, shows a 52% probability that Democrats will regain control of the Senate in the midterm elections in November.
If this prediction comes true, Warren could become chair of the Senate Banking Committee. She has said she would be willing to lead consultations with lawmakers from both parties and industry participants to craft a “workable and effective crypto-currency bill.”
However, Warren also acknowledged that for the bill to truly meet her requirements, the condition is that Republicans are “willing to step up and confront the Trump administration,” and she is well aware that this “is far from easy.”
#CLARITY法案投票未通过
The U.S. Senate rejects the CLARITY Act, casting a shadow over prospects for crypto legislation; markets fall in response
On September 15, local time, the U.S. Senate held a key procedural vote on the Digital Asset Market Clarity Act (CLARITY Act). It ultimately failed to pass, with 49 votes in favor and 50 against—far short of the 60-vote threshold needed to advance the bill.
The vote failure sent Bitcoin down about 4% in the short term, while crypto-related stocks such as Coinbase and Circle fell even more sharply. Prediction market platform Kalshi also cut its probability estimate that the bill would become law within 2026 to single digits.
The voting results show that, aside from Democratic Senator Chris Coons not participating, all Democratic senators present and all independent senators voted against the bill.
In addition, fractures also emerged within the Republican camp: four Republican lawmakers—Susan Collins, Josh Hawley, Jerry Moran, and Thom Tillis—joined the ranks voting against.
Although Senator Thom Tillis later proposed a motion for reconsideration, keeping the possibility of revisiting the matter, this setback undoubtedly deals a major blow to the bill’s prospects.
After the results were announced, Democratic Senator Elizabeth Warren clearly stated that although she remains determined to push crypto legislation forward, she does not support the current version of the CLARITY Act.
Warren emphasized that the bill is Washington’s “first substantive opportunity for crypto regulation,” but that the final version must include rules for crypto investments by public officials, provisions on national security and consumer protection, and stronger measures to combat illegal financing and terrorism.
Notably, Warren’s influence in the crypto legislative process may grow further. Kalshi, a prediction market, shows a 52% probability that Democrats will regain control of the Senate in the midterm elections in November.
If this prediction comes true, Warren could become chair of the Senate Banking Committee. She has said she would be willing to lead consultations with lawmakers from both parties and industry participants to craft a “workable and effective crypto-currency bill.”
However, Warren also acknowledged that for the bill to truly meet her requirements, the condition is that Republicans are “willing to step up and confront the Trump administration,” and she is well aware that this “is far from easy.”
#CLARITY法案投票未通过
On September 15, local time, the U.S. Senate held a key procedural vote on the Digital Asset Market Clarity Act (CLARITY Act). It ultimately failed to pass, with 49 votes in favor and 50 against—far short of the 60-vote threshold needed to advance the bill.
The vote failure sent Bitcoin down about 4% in the short term, while crypto-related stocks such as Coinbase and Circle fell even more sharply. Prediction market platform Kalshi also cut its probability estimate that the bill would become law within 2026 to single digits.
The voting results show that, aside from Democratic Senator Chris Coons not participating, all Democratic senators present and all independent senators voted against the bill.
In addition, fractures also emerged within the Republican camp: four Republican lawmakers—Susan Collins, Josh Hawley, Jerry Moran, and Thom Tillis—joined the ranks voting against.
Although Senator Thom Tillis later proposed a motion for reconsideration, keeping the possibility of revisiting the matter, this setback undoubtedly deals a major blow to the bill’s prospects.
After the results were announced, Democratic Senator Elizabeth Warren clearly stated that although she remains determined to push crypto legislation forward, she does not support the current version of the CLARITY Act.
Warren emphasized that the bill is Washington’s “first substantive opportunity for crypto regulation,” but that the final version must include rules for crypto investments by public officials, provisions on national security and consumer protection, and stronger measures to combat illegal financing and terrorism.
Notably, Warren’s influence in the crypto legislative process may grow further. Kalshi, a prediction market, shows a 52% probability that Democrats will regain control of the Senate in the midterm elections in November.
If this prediction comes true, Warren could become chair of the Senate Banking Committee. She has said she would be willing to lead consultations with lawmakers from both parties and industry participants to craft a “workable and effective crypto-currency bill.”
However, Warren also acknowledged that for the bill to truly meet her requirements, the condition is that Republicans are “willing to step up and confront the Trump administration,” and she is well aware that this “is far from easy.”
#CLARITY法案投票未通过

454
The Federal Reserve’s interest rate decision meeting begins today, with the market betting that the probability of a rate hike this week is over 90%
#美联储议息会议
The Federal Reserve’s interest rate decision meeting begins today, with the market betting that the probability of a rate hike this week is over 90%
#美联储议息会议
#美联储议息会议
627
CryptoQuant Analyst: Bitcoin Breaks Out of the Bottom Consolidation Range, and a New Uptrend Is Being Set in Motion
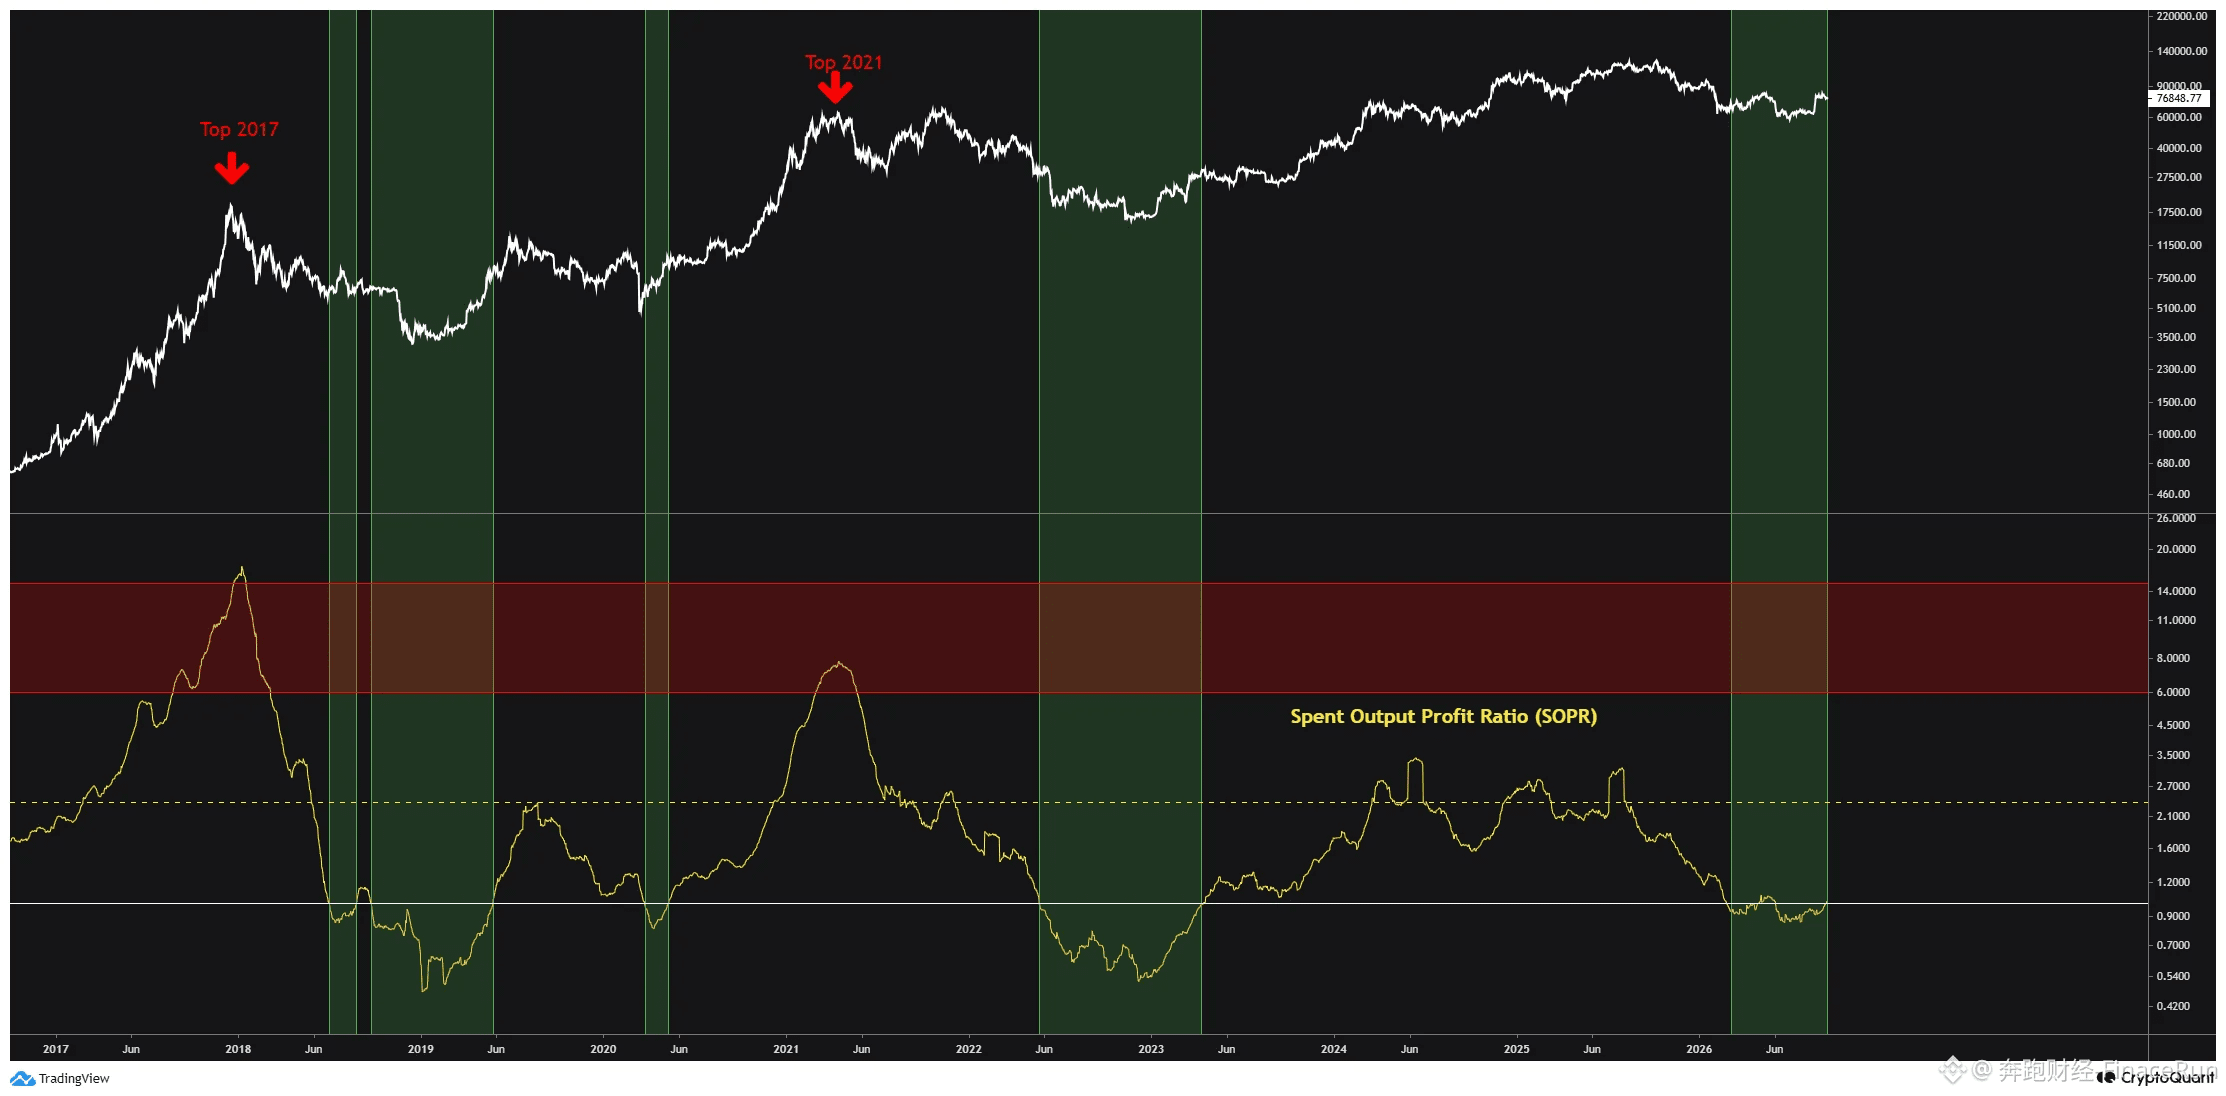
On September 15, according to CryptoQuant analyst CW8900’s latest remarks, Bitcoin is breaking out of the bottom range and is starting a new rebound phase.
On-chain data shows that the Spend Output Profit Ratio (SOPR) of long-term holders (LTH) has risen to above 1, indicating that the market is shifting from a bearish phase to a neutral state, and a full uptrend is already underway.
The analyst specifically emphasized that during this cycle, SOPR has not yet broken above 6, while historical cycle peak values are typically formed within that range. However, in the current cycle, there has not yet been a stage where long-term holders take profits, meaning a true bull market has not arrived.
CW8900 noted that the market’s previous movements were essentially preparing for the current round of price increase. Data shows that the amount of Bitcoin held by long-term holders has reached an all-time high, and these investors have been steadily adding recently.
Based on this trend analysis, he believes the upward rally has officially started. If following historical patterns—when LTH’s Spend Output Profit Ratio (SOPR) breaks above 6, signaling the arrival of the subsequent profit-taking phase—that would be the position of this cycle’s peak.
#SOPR
CryptoQuant Analyst: Bitcoin Breaks Out of the Bottom Consolidation Range, and a New Uptrend Is Being Set in Motion
On September 15, according to CryptoQuant analyst CW8900’s latest remarks, Bitcoin is breaking out of the bottom range and is starting a new rebound phase.
On-chain data shows that the Spend Output Profit Ratio (SOPR) of long-term holders (LTH) has risen to above 1, indicating that the market is shifting from a bearish phase to a neutral state, and a full uptrend is already underway.
The analyst specifically emphasized that during this cycle, SOPR has not yet broken above 6, while historical cycle peak values are typically formed within that range. However, in the current cycle, there has not yet been a stage where long-term holders take profits, meaning a true bull market has not arrived.
CW8900 noted that the market’s previous movements were essentially preparing for the current round of price increase. Data shows that the amount of Bitcoin held by long-term holders has reached an all-time high, and these investors have been steadily adding recently.
Based on this trend analysis, he believes the upward rally has officially started. If following historical patterns—when LTH’s Spend Output Profit Ratio (SOPR) breaks above 6, signaling the arrival of the subsequent profit-taking phase—that would be the position of this cycle’s peak.
#SOPR
On September 15, according to CryptoQuant analyst CW8900’s latest remarks, Bitcoin is breaking out of the bottom range and is starting a new rebound phase.
On-chain data shows that the Spend Output Profit Ratio (SOPR) of long-term holders (LTH) has risen to above 1, indicating that the market is shifting from a bearish phase to a neutral state, and a full uptrend is already underway.
The analyst specifically emphasized that during this cycle, SOPR has not yet broken above 6, while historical cycle peak values are typically formed within that range. However, in the current cycle, there has not yet been a stage where long-term holders take profits, meaning a true bull market has not arrived.
CW8900 noted that the market’s previous movements were essentially preparing for the current round of price increase. Data shows that the amount of Bitcoin held by long-term holders has reached an all-time high, and these investors have been steadily adding recently.
Based on this trend analysis, he believes the upward rally has officially started. If following historical patterns—when LTH’s Spend Output Profit Ratio (SOPR) breaks above 6, signaling the arrival of the subsequent profit-taking phase—that would be the position of this cycle’s peak.
#SOPR
366
The U.S. House of Representatives will review a crypto tax bill on Wednesday, but it does not include provisions on taxing mining or staking rewards
On September 15, according to the latest X post by Cointelegraph, the U.S. House Ways and Means Committee will review a 114-page crypto tax proposal on Wednesday. However, it does not address the core issue of how taxes on mining and staking rewards should be applied.
The bill, titled the “Digital Asset Tax Clarity Act of 2026” (H.R. 10357), is intended to clarify the tax treatment of digital assets. But the timing and method for calculating tax on mining and staking income are not included in this 114-page legislation.
This seems to mean that two of the most controversial areas in U.S. crypto taxation will remain in a state of regulatory ambiguity. Tax treatment may be left to future supplementary measures or clarified separately by the Treasury Department, making it difficult for market participants’ uncertainty to be eliminated in the short term.
For miners and stakers, as long as the tax treatment is not clarified, compliance costs and uncertainty will not go away. While the bill’s advancement is progress, a legislative approach that sidesteps key issues may also leave the industry hanging in the very areas where rules are most needed.
Finally, the 114-page crypto tax proposal mentions everything except how mining and staking should be taxed. Do you think this is a cautious way to move forward, or a deliberate evasion? Leave your thoughts in the comments.
#数字资产税收
The U.S. House of Representatives will review a crypto tax bill on Wednesday, but it does not include provisions on taxing mining or staking rewards
On September 15, according to the latest X post by Cointelegraph, the U.S. House Ways and Means Committee will review a 114-page crypto tax proposal on Wednesday. However, it does not address the core issue of how taxes on mining and staking rewards should be applied.
The bill, titled the “Digital Asset Tax Clarity Act of 2026” (H.R. 10357), is intended to clarify the tax treatment of digital assets. But the timing and method for calculating tax on mining and staking income are not included in this 114-page legislation.
This seems to mean that two of the most controversial areas in U.S. crypto taxation will remain in a state of regulatory ambiguity. Tax treatment may be left to future supplementary measures or clarified separately by the Treasury Department, making it difficult for market participants’ uncertainty to be eliminated in the short term.
For miners and stakers, as long as the tax treatment is not clarified, compliance costs and uncertainty will not go away. While the bill’s advancement is progress, a legislative approach that sidesteps key issues may also leave the industry hanging in the very areas where rules are most needed.
Finally, the 114-page crypto tax proposal mentions everything except how mining and staking should be taxed. Do you think this is a cautious way to move forward, or a deliberate evasion? Leave your thoughts in the comments.
#数字资产税收
On September 15, according to the latest X post by Cointelegraph, the U.S. House Ways and Means Committee will review a 114-page crypto tax proposal on Wednesday. However, it does not address the core issue of how taxes on mining and staking rewards should be applied.
The bill, titled the “Digital Asset Tax Clarity Act of 2026” (H.R. 10357), is intended to clarify the tax treatment of digital assets. But the timing and method for calculating tax on mining and staking income are not included in this 114-page legislation.
This seems to mean that two of the most controversial areas in U.S. crypto taxation will remain in a state of regulatory ambiguity. Tax treatment may be left to future supplementary measures or clarified separately by the Treasury Department, making it difficult for market participants’ uncertainty to be eliminated in the short term.
For miners and stakers, as long as the tax treatment is not clarified, compliance costs and uncertainty will not go away. While the bill’s advancement is progress, a legislative approach that sidesteps key issues may also leave the industry hanging in the very areas where rules are most needed.
Finally, the 114-page crypto tax proposal mentions everything except how mining and staking should be taxed. Do you think this is a cautious way to move forward, or a deliberate evasion? Leave your thoughts in the comments.
#数字资产税收

375
Encrypted ETF sees full-suite inflows on Monday: U.S. BTC and ETH spot ETF cumulative net inflows of $281 million
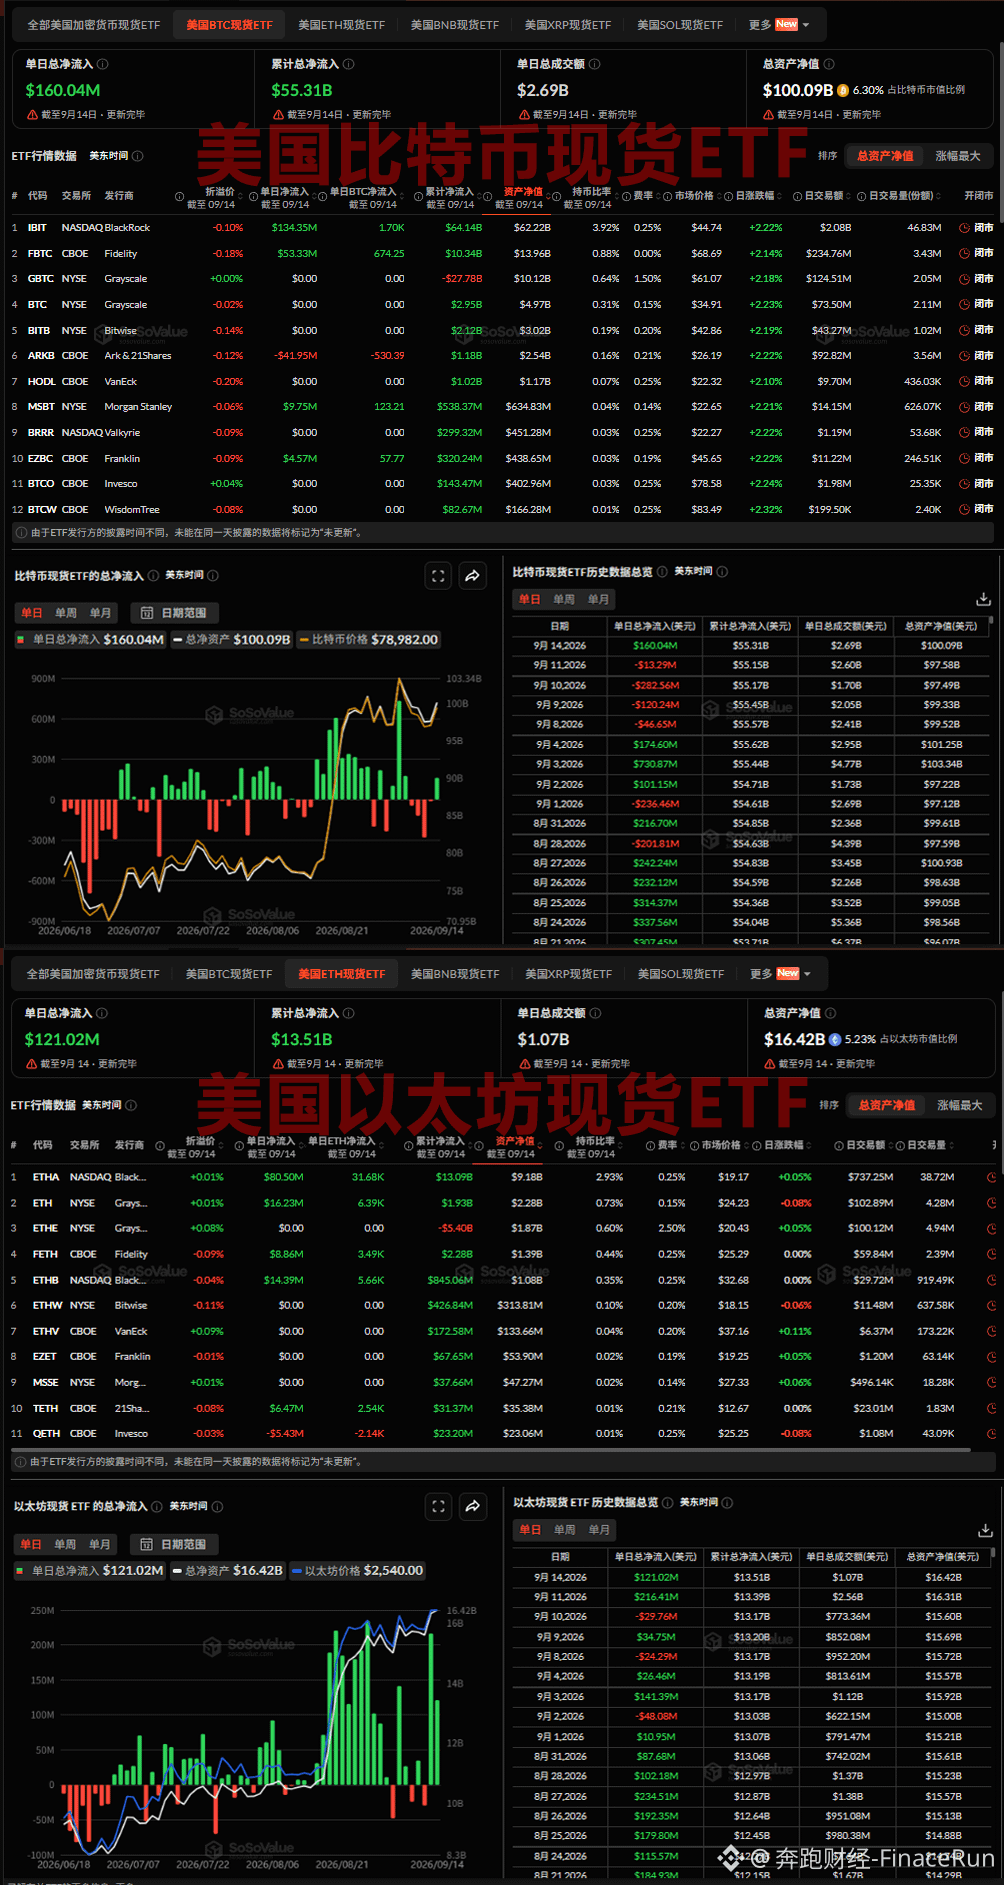
September 15, according to SoSovalue data: U.S. BTC spot ETFs saw a total net inflow of nearly $160 million yesterday, recording the first day of net inflows after four consecutive days of net outflows;
Among them, BlackRock’s IBIT and Fidelity’s FBTC ranked first and second in yesterday’s net inflow table, with $134 million (about 1,700 BTC) and $53.33 million (574.25 BTC), respectively;
Next were Morgan Stanley’s MSBT and Franklin’s EZBC, with single-day net inflows of $9.75 million (123.21 BTC) and $4.57 million (57.77 BTC), respectively;
Meanwhile, Ark&21Shares’ ARKB became the only BTC ETF to record net outflows yesterday, at $41.95 million (530.39 BTC);
As of now, the total net asset value of Bitcoin spot ETFs is $100.09 billion, accounting for 6.30% of Bitcoin’s total market capitalization, with cumulative total net inflows of $55.31 billion.
On the same day, U.S. Ethereum spot ETFs recorded a total net inflow of $121 million, marking the second consecutive day of total net inflows;
Among them, BlackRock’s ETHA and ETHB and Grayscale’s ETH ranked among the top three in yesterday’s net inflow list, with $80.50 million (about 31,680 ETH) and $14.39 million (about 5,660 ETH), and $16.23 million (about 6,390 ETH), respectively;
Next were Fidelity’s FETH and 21Shares’ TETH, with single-day net inflows of $8.86 million (about 3,490 ETH) and $6.47 million (about 2,540 ETH), respectively;
Invesco QETH was the only ETH ETF to see net outflows of spot funding yesterday, at $5.43 million (about 2,140 ETH);
As of now, the total net asset value of Ethereum spot ETFs is $16.42 billion, accounting for 5.23% of Ethereum’s total market capitalization, with cumulative total net inflows of $13.51 billion.
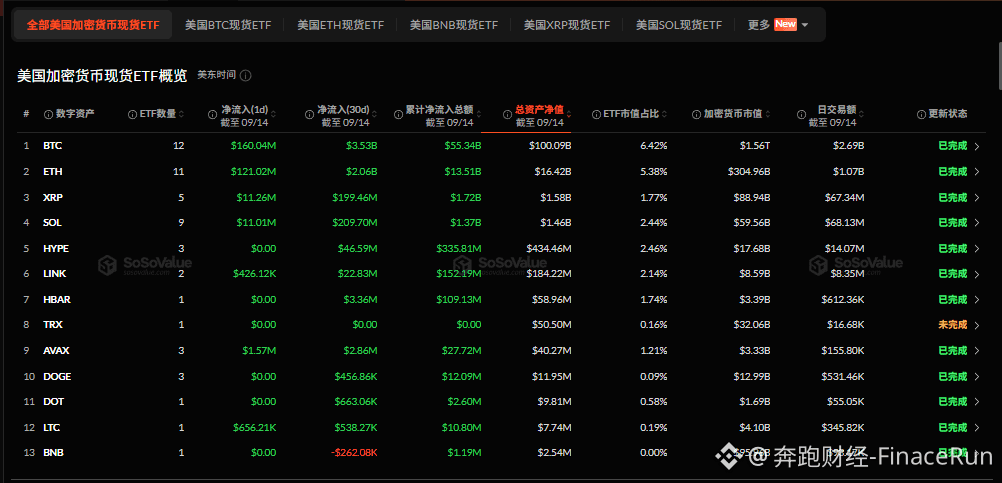
Among other crypto ETFs across all asset classes, XRP, SOL, AVAX, LTC, and LINK ETFs recorded total daily net inflows of $11.26 million, $11.01 million, $1.57 million, nearly $0.66 million, and nearly $0.43 million, respectively.
#比特币ETF #以太坊ETF
Encrypted ETF sees full-suite inflows on Monday: U.S. BTC and ETH spot ETF cumulative net inflows of $281 million
September 15, according to SoSovalue data: U.S. BTC spot ETFs saw a total net inflow of nearly $160 million yesterday, recording the first day of net inflows after four consecutive days of net outflows;
Among them, BlackRock’s IBIT and Fidelity’s FBTC ranked first and second in yesterday’s net inflow table, with $134 million (about 1,700 BTC) and $53.33 million (574.25 BTC), respectively;
Next were Morgan Stanley’s MSBT and Franklin’s EZBC, with single-day net inflows of $9.75 million (123.21 BTC) and $4.57 million (57.77 BTC), respectively;
Meanwhile, Ark&21Shares’ ARKB became the only BTC ETF to record net outflows yesterday, at $41.95 million (530.39 BTC);
As of now, the total net asset value of Bitcoin spot ETFs is $100.09 billion, accounting for 6.30% of Bitcoin’s total market capitalization, with cumulative total net inflows of $55.31 billion.
On the same day, U.S. Ethereum spot ETFs recorded a total net inflow of $121 million, marking the second consecutive day of total net inflows;
Among them, BlackRock’s ETHA and ETHB and Grayscale’s ETH ranked among the top three in yesterday’s net inflow list, with $80.50 million (about 31,680 ETH) and $14.39 million (about 5,660 ETH), and $16.23 million (about 6,390 ETH), respectively;
Next were Fidelity’s FETH and 21Shares’ TETH, with single-day net inflows of $8.86 million (about 3,490 ETH) and $6.47 million (about 2,540 ETH), respectively;
Invesco QETH was the only ETH ETF to see net outflows of spot funding yesterday, at $5.43 million (about 2,140 ETH);
As of now, the total net asset value of Ethereum spot ETFs is $16.42 billion, accounting for 5.23% of Ethereum’s total market capitalization, with cumulative total net inflows of $13.51 billion.
Among other crypto ETFs across all asset classes, XRP, SOL, AVAX, LTC, and LINK ETFs recorded total daily net inflows of $11.26 million, $11.01 million, $1.57 million, nearly $0.66 million, and nearly $0.43 million, respectively.
#比特币ETF #以太坊ETF
September 15, according to SoSovalue data: U.S. BTC spot ETFs saw a total net inflow of nearly $160 million yesterday, recording the first day of net inflows after four consecutive days of net outflows;
Among them, BlackRock’s IBIT and Fidelity’s FBTC ranked first and second in yesterday’s net inflow table, with $134 million (about 1,700 BTC) and $53.33 million (574.25 BTC), respectively;
Next were Morgan Stanley’s MSBT and Franklin’s EZBC, with single-day net inflows of $9.75 million (123.21 BTC) and $4.57 million (57.77 BTC), respectively;
Meanwhile, Ark&21Shares’ ARKB became the only BTC ETF to record net outflows yesterday, at $41.95 million (530.39 BTC);
As of now, the total net asset value of Bitcoin spot ETFs is $100.09 billion, accounting for 6.30% of Bitcoin’s total market capitalization, with cumulative total net inflows of $55.31 billion.
On the same day, U.S. Ethereum spot ETFs recorded a total net inflow of $121 million, marking the second consecutive day of total net inflows;
Among them, BlackRock’s ETHA and ETHB and Grayscale’s ETH ranked among the top three in yesterday’s net inflow list, with $80.50 million (about 31,680 ETH) and $14.39 million (about 5,660 ETH), and $16.23 million (about 6,390 ETH), respectively;
Next were Fidelity’s FETH and 21Shares’ TETH, with single-day net inflows of $8.86 million (about 3,490 ETH) and $6.47 million (about 2,540 ETH), respectively;
Invesco QETH was the only ETH ETF to see net outflows of spot funding yesterday, at $5.43 million (about 2,140 ETH);
As of now, the total net asset value of Ethereum spot ETFs is $16.42 billion, accounting for 5.23% of Ethereum’s total market capitalization, with cumulative total net inflows of $13.51 billion.
Among other crypto ETFs across all asset classes, XRP, SOL, AVAX, LTC, and LINK ETFs recorded total daily net inflows of $11.26 million, $11.01 million, $1.57 million, nearly $0.66 million, and nearly $0.43 million, respectively.
#比特币ETF #以太坊ETF
1
3
818
More than half of Uniswap v4 Hooks involve malicious behavior—it's urgent to uphold the bottom line of protecting users' interests
September 15, according to an analysis report published by the DEX infrastructure and protocols team 0x, the Hooks mechanism in Uniswap v4 has been found to involve malicious manipulation. While it enhances the protocol's extensibility, it is also being massively abused by some bad pools.
Data shows that over the past 18 months, the team analyzed 84,163 hooks across 6 chains. Of these, only 19.4% were deemed safe, 54.2% involved malicious behavior, and another 26.4% posed potential risks.
Specifically, malicious Hooks harm users' interests through tactics such as quote manipulation and price deception. According to 0x's data analysis, for trades routed through these pools, the actual execution price may be 50% lower than the price quoted to users.
These malicious hooks don't need to build a brand or direct users to a new interface. As long as the pools appear attractive to the aggregation system, fraud can be carried out by leveraging users' trust in the existing infrastructure.
The report details two typical cases on Base and the BNB Chain, involving thousands of transactions. Through real case analysis, one can understand more intuitively how malicious Hooks operate and the actual losses they cause.
In addition, the 0x team has taken measures such as improving detection technology and strengthening pool review, aiming to prevent such malicious pools from entering routes. It also advises route operators to ensure that quoted prices match execution, and that they should have mechanisms to quickly remove suspicious routes.
In summary, this incident once again highlights the challenge of balancing innovation and security in DeFi. The industry needs to establish more effective regulatory mechanisms and security standards so that, while pursuing extensibility, it can still protect users' interests.
#报价操纵 #价格欺骗
More than half of Uniswap v4 Hooks involve malicious behavior—it's urgent to uphold the bottom line of protecting users' interests
September 15, according to an analysis report published by the DEX infrastructure and protocols team 0x, the Hooks mechanism in Uniswap v4 has been found to involve malicious manipulation. While it enhances the protocol's extensibility, it is also being massively abused by some bad pools.
Data shows that over the past 18 months, the team analyzed 84,163 hooks across 6 chains. Of these, only 19.4% were deemed safe, 54.2% involved malicious behavior, and another 26.4% posed potential risks.
Specifically, malicious Hooks harm users' interests through tactics such as quote manipulation and price deception. According to 0x's data analysis, for trades routed through these pools, the actual execution price may be 50% lower than the price quoted to users.
These malicious hooks don't need to build a brand or direct users to a new interface. As long as the pools appear attractive to the aggregation system, fraud can be carried out by leveraging users' trust in the existing infrastructure.
The report details two typical cases on Base and the BNB Chain, involving thousands of transactions. Through real case analysis, one can understand more intuitively how malicious Hooks operate and the actual losses they cause.
In addition, the 0x team has taken measures such as improving detection technology and strengthening pool review, aiming to prevent such malicious pools from entering routes. It also advises route operators to ensure that quoted prices match execution, and that they should have mechanisms to quickly remove suspicious routes.
In summary, this incident once again highlights the challenge of balancing innovation and security in DeFi. The industry needs to establish more effective regulatory mechanisms and security standards so that, while pursuing extensibility, it can still protect users' interests.
#报价操纵 #价格欺骗
September 15, according to an analysis report published by the DEX infrastructure and protocols team 0x, the Hooks mechanism in Uniswap v4 has been found to involve malicious manipulation. While it enhances the protocol's extensibility, it is also being massively abused by some bad pools.
Data shows that over the past 18 months, the team analyzed 84,163 hooks across 6 chains. Of these, only 19.4% were deemed safe, 54.2% involved malicious behavior, and another 26.4% posed potential risks.
Specifically, malicious Hooks harm users' interests through tactics such as quote manipulation and price deception. According to 0x's data analysis, for trades routed through these pools, the actual execution price may be 50% lower than the price quoted to users.
These malicious hooks don't need to build a brand or direct users to a new interface. As long as the pools appear attractive to the aggregation system, fraud can be carried out by leveraging users' trust in the existing infrastructure.
The report details two typical cases on Base and the BNB Chain, involving thousands of transactions. Through real case analysis, one can understand more intuitively how malicious Hooks operate and the actual losses they cause.
In addition, the 0x team has taken measures such as improving detection technology and strengthening pool review, aiming to prevent such malicious pools from entering routes. It also advises route operators to ensure that quoted prices match execution, and that they should have mechanisms to quickly remove suspicious routes.
In summary, this incident once again highlights the challenge of balancing innovation and security in DeFi. The industry needs to establish more effective regulatory mechanisms and security standards so that, while pursuing extensibility, it can still protect users' interests.
#报价操纵 #价格欺骗

287
Senator Lummis: A key vote is imminent this Tuesday. Democrats demand endless concessions, and negotiations on the <CLARITY Act> have no end
On September 15, according to CoinDesk, the U.S. Senate will hold a crucial procedural vote this Tuesday on the Digital Assets Market Transparency Act (the <CLARITY Act>), and partisan maneuvering over the bill continues to intensify.
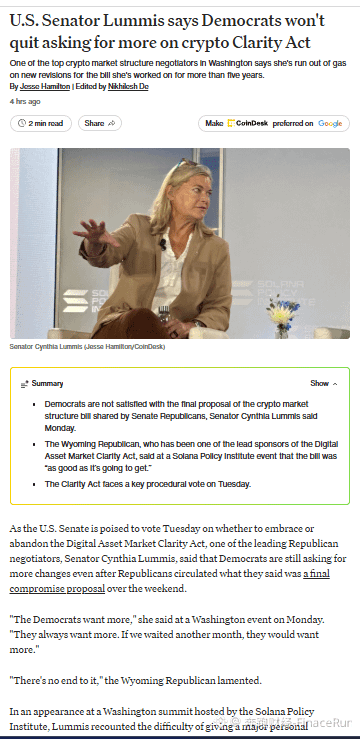
At a summit in Washington on Monday, Cynthia Lummis, the top Republican negotiator and a senator from Wyoming, said that although Republicans unveiled what they claim is a so-called final compromise package over the weekend, Democrats are still pushing for further revisions.
Lummis said bluntly that Democrats always want more; even if they wait another month, they will continue to make new demands—demands that are never-ending.
As one of the main sponsors of the <CLARITY Act>, Lummis has been deeply involved in negotiations on the bill for more than five years. In the latest draft, she made significant personal concessions regarding legal protections for DeFi developers. The bill includes 114 specific policy provisions.
One key provision is designed to limit private commercial ties between government officials and the crypto industry, mainly targeting President Trump. Lummis said that when this moral-constraint provision was revised a second time, Trump agreed to make concessions, which she found surprising.
Lummis admitted she is not sure whether Tuesday’s vote can secure the at least 60 votes in favor needed in the Senate. She said this is already the best available version of the bill and urged Democrats to accept the current text, while also acknowledging that she is completely exhausted.
Overall, at the Monday industry event, even if she is the most optimistic observer and believes the odds of passage are not high, the industry is still anxiously waiting for any signals that could influence the bill’s final outcome.
#CLARITY法案
Senator Lummis: A key vote is imminent this Tuesday. Democrats demand endless concessions, and negotiations on the <CLARITY Act> have no end
On September 15, according to CoinDesk, the U.S. Senate will hold a crucial procedural vote this Tuesday on the Digital Assets Market Transparency Act (the <CLARITY Act>), and partisan maneuvering over the bill continues to intensify.
At a summit in Washington on Monday, Cynthia Lummis, the top Republican negotiator and a senator from Wyoming, said that although Republicans unveiled what they claim is a so-called final compromise package over the weekend, Democrats are still pushing for further revisions.
Lummis said bluntly that Democrats always want more; even if they wait another month, they will continue to make new demands—demands that are never-ending.
As one of the main sponsors of the <CLARITY Act>, Lummis has been deeply involved in negotiations on the bill for more than five years. In the latest draft, she made significant personal concessions regarding legal protections for DeFi developers. The bill includes 114 specific policy provisions.
One key provision is designed to limit private commercial ties between government officials and the crypto industry, mainly targeting President Trump. Lummis said that when this moral-constraint provision was revised a second time, Trump agreed to make concessions, which she found surprising.
Lummis admitted she is not sure whether Tuesday’s vote can secure the at least 60 votes in favor needed in the Senate. She said this is already the best available version of the bill and urged Democrats to accept the current text, while also acknowledging that she is completely exhausted.
Overall, at the Monday industry event, even if she is the most optimistic observer and believes the odds of passage are not high, the industry is still anxiously waiting for any signals that could influence the bill’s final outcome.
#CLARITY法案
On September 15, according to CoinDesk, the U.S. Senate will hold a crucial procedural vote this Tuesday on the Digital Assets Market Transparency Act (the <CLARITY Act>), and partisan maneuvering over the bill continues to intensify.
At a summit in Washington on Monday, Cynthia Lummis, the top Republican negotiator and a senator from Wyoming, said that although Republicans unveiled what they claim is a so-called final compromise package over the weekend, Democrats are still pushing for further revisions.
Lummis said bluntly that Democrats always want more; even if they wait another month, they will continue to make new demands—demands that are never-ending.
As one of the main sponsors of the <CLARITY Act>, Lummis has been deeply involved in negotiations on the bill for more than five years. In the latest draft, she made significant personal concessions regarding legal protections for DeFi developers. The bill includes 114 specific policy provisions.
One key provision is designed to limit private commercial ties between government officials and the crypto industry, mainly targeting President Trump. Lummis said that when this moral-constraint provision was revised a second time, Trump agreed to make concessions, which she found surprising.
Lummis admitted she is not sure whether Tuesday’s vote can secure the at least 60 votes in favor needed in the Senate. She said this is already the best available version of the bill and urged Democrats to accept the current text, while also acknowledging that she is completely exhausted.
Overall, at the Monday industry event, even if she is the most optimistic observer and believes the odds of passage are not high, the industry is still anxiously waiting for any signals that could influence the bill’s final outcome.
#CLARITY法案
1.3k
During a closed-door sharing session, Huang Renxun suddenly received a call from Trump
At the opening, Trump first joked that Huang Renxun wouldn’t put it on speaker, then quickly pivoted to talk about AI—what exactly did he say?
#特朗普谈AI
During a closed-door sharing session, Huang Renxun suddenly received a call from Trump
At the opening, Trump first joked that Huang Renxun wouldn’t put it on speaker, then quickly pivoted to talk about AI—what exactly did he say?
#特朗普谈AI
At the opening, Trump first joked that Huang Renxun wouldn’t put it on speaker, then quickly pivoted to talk about AI—what exactly did he say?
#特朗普谈AI
871
Bitcoin Faces a Pivotal Week: The Fed Decision and the <CLARITY Act> Vote Are Key Market Focus
On September 14, investors in Bitcoin are entering the most critical week so far in 2026. Two major events may shape the near-term direction of the cryptocurrency market.
Although multiple economic data releases are scheduled for this week, the two core events most likely to significantly impact the market are the Federal Reserve’s interest-rate decision and the U.S. Senate’s vote on the <CLARITY Act>.
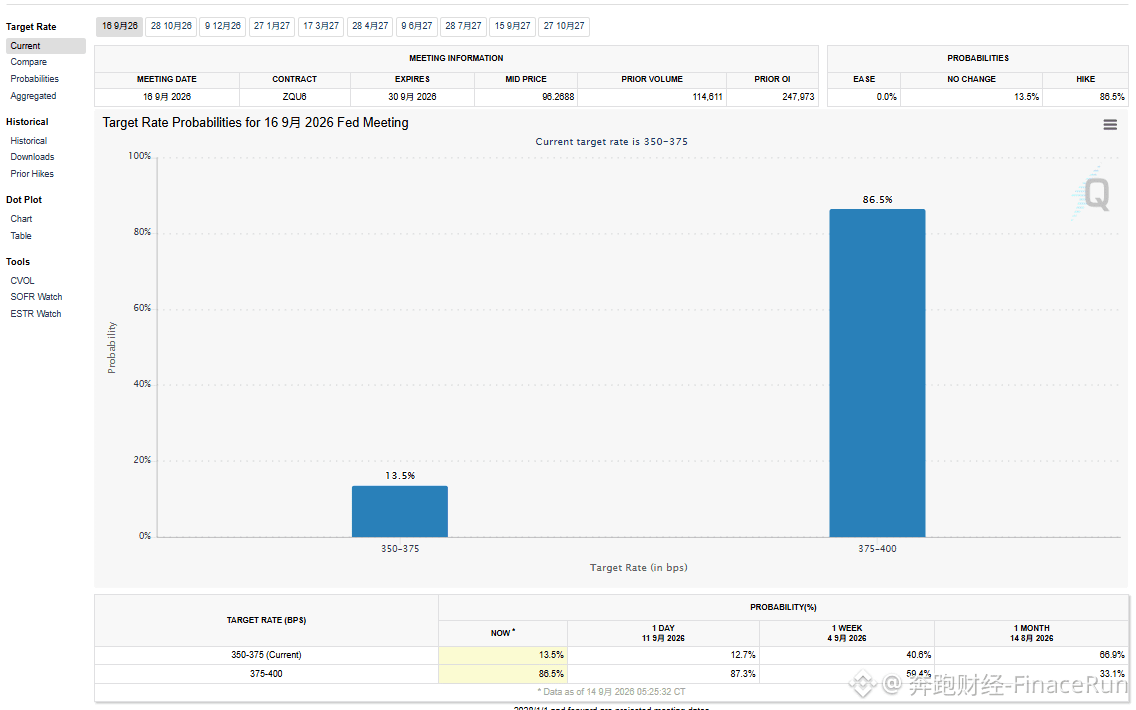
At present, market consensus expects the Fed to announce a 25-basis-point rate hike on Wednesday, with a probability as high as 85% to 90%. This expectation is not without basis; several recently released data points have reinforced this view;
Specifically, in August, new jobs rose by 162,000, far exceeding expectations by three times; the Producer Price Index accelerated to 5.4%; and core CPI monthly data was also slightly above expectations.
In addition, with oil prices continuing to stay above $100 per barrel and diesel prices setting new records, these factors together provide ample justification for the Fed to tighten monetary policy.
Driven by rate-hike expectations, the BTC price has fallen from $82,400 to around $78,000. Market focus has shifted to whether the hike has already been priced in, and whether what Waller signals in his press conference represents a one-time adjustment or the start of a new tightening cycle.
However, before the Fed’s decision, on Tuesday the Senate will hold a debate-ending vote on the <CLARITY Act>, which requires 60 votes for the measure to advance. The bill aims to establish a U.S. crypto market structure framework and clarify the scope of regulatory responsibilities between the SEC and the CFTC.
Last week, Republicans released an updated bill text that adds regulatory rules for non–decentralized DeFi protocols and specifies the rules for credit unions to conduct crypto-asset trading.
Even more importantly, a “final, best, final draft” released on Sunday includes a moral-standards proposal backed by the president, adding a new variable to the bill’s chances of passage.
In summary, this week’s Fed interest-rate decision and the <CLARITY Act> voting result may become key turning points for Bitcoin and the broader cryptocurrency market in the near term.
Investors should closely monitor the progress of these events and the potential far-reaching impact they could have on market liquidity and the regulatory environment.
#CLARITY法案 #9月利率决议
Bitcoin Faces a Pivotal Week: The Fed Decision and the <CLARITY Act> Vote Are Key Market Focus
On September 14, investors in Bitcoin are entering the most critical week so far in 2026. Two major events may shape the near-term direction of the cryptocurrency market.
Although multiple economic data releases are scheduled for this week, the two core events most likely to significantly impact the market are the Federal Reserve’s interest-rate decision and the U.S. Senate’s vote on the <CLARITY Act>.
At present, market consensus expects the Fed to announce a 25-basis-point rate hike on Wednesday, with a probability as high as 85% to 90%. This expectation is not without basis; several recently released data points have reinforced this view;
Specifically, in August, new jobs rose by 162,000, far exceeding expectations by three times; the Producer Price Index accelerated to 5.4%; and core CPI monthly data was also slightly above expectations.
In addition, with oil prices continuing to stay above $100 per barrel and diesel prices setting new records, these factors together provide ample justification for the Fed to tighten monetary policy.
Driven by rate-hike expectations, the BTC price has fallen from $82,400 to around $78,000. Market focus has shifted to whether the hike has already been priced in, and whether what Waller signals in his press conference represents a one-time adjustment or the start of a new tightening cycle.
However, before the Fed’s decision, on Tuesday the Senate will hold a debate-ending vote on the <CLARITY Act>, which requires 60 votes for the measure to advance. The bill aims to establish a U.S. crypto market structure framework and clarify the scope of regulatory responsibilities between the SEC and the CFTC.
Last week, Republicans released an updated bill text that adds regulatory rules for non–decentralized DeFi protocols and specifies the rules for credit unions to conduct crypto-asset trading.
Even more importantly, a “final, best, final draft” released on Sunday includes a moral-standards proposal backed by the president, adding a new variable to the bill’s chances of passage.
In summary, this week’s Fed interest-rate decision and the <CLARITY Act> voting result may become key turning points for Bitcoin and the broader cryptocurrency market in the near term.
Investors should closely monitor the progress of these events and the potential far-reaching impact they could have on market liquidity and the regulatory environment.
#CLARITY法案 #9月利率决议
On September 14, investors in Bitcoin are entering the most critical week so far in 2026. Two major events may shape the near-term direction of the cryptocurrency market.
Although multiple economic data releases are scheduled for this week, the two core events most likely to significantly impact the market are the Federal Reserve’s interest-rate decision and the U.S. Senate’s vote on the <CLARITY Act>.
At present, market consensus expects the Fed to announce a 25-basis-point rate hike on Wednesday, with a probability as high as 85% to 90%. This expectation is not without basis; several recently released data points have reinforced this view;
Specifically, in August, new jobs rose by 162,000, far exceeding expectations by three times; the Producer Price Index accelerated to 5.4%; and core CPI monthly data was also slightly above expectations.
In addition, with oil prices continuing to stay above $100 per barrel and diesel prices setting new records, these factors together provide ample justification for the Fed to tighten monetary policy.
Driven by rate-hike expectations, the BTC price has fallen from $82,400 to around $78,000. Market focus has shifted to whether the hike has already been priced in, and whether what Waller signals in his press conference represents a one-time adjustment or the start of a new tightening cycle.
However, before the Fed’s decision, on Tuesday the Senate will hold a debate-ending vote on the <CLARITY Act>, which requires 60 votes for the measure to advance. The bill aims to establish a U.S. crypto market structure framework and clarify the scope of regulatory responsibilities between the SEC and the CFTC.
Last week, Republicans released an updated bill text that adds regulatory rules for non–decentralized DeFi protocols and specifies the rules for credit unions to conduct crypto-asset trading.
Even more importantly, a “final, best, final draft” released on Sunday includes a moral-standards proposal backed by the president, adding a new variable to the bill’s chances of passage.
In summary, this week’s Fed interest-rate decision and the <CLARITY Act> voting result may become key turning points for Bitcoin and the broader cryptocurrency market in the near term.
Investors should closely monitor the progress of these events and the potential far-reaching impact they could have on market liquidity and the regulatory environment.
#CLARITY法案 #9月利率决议

1
2.9k
The U.S. Republican Party in the Senate has released a new version of the “Clarity Act,” and Trump has agreed to revise the code of ethics provisions
On September 14, according to Eleanor Terrett’s latest post, Senate Republicans released the full text of a new version of the “CLARITY Act,” which includes revised ethics provisions approved by President Trump.
Republicans say this is their “final, best, and ultimately” proposal presented to Democrats ahead of a key vote on Tuesday, intended to demonstrate good faith to Democrats before the debate-ending vote.
The revised text adjusts the ethics provisions. Trump agreed to a plan Republicans call the “80% Tillis-Gallego ethics proposal,” which includes stripping “substantial” encryption-related financial interests or placing them into a trust for isolation.
At the same time, the bill also allows state attorneys general to play a role in enforcing the ethics provisions, although this provision had previously been opposed by the White House.
In addition, the scope of the Blockchain Regulatory Certainty Act (BRCA) has been narrowed: it only retains protections related to the Bank Secrecy Act and civil enforcement, and deletes provisions involving criminal cases.
Regarding stablecoin earnings, new “circuit breaker clause” language has been added. It allows federal regulators to step in if there is evidence that large volumes of bank deposits are flowing into stablecoins, with final arbitration authority belonging to Treasury Secretary Scott Bessent.
Furthermore, the updated text adds more stringent restrictions addressing issues related to vertical integration, related-party transactions, and conflicts of interest involving digital asset exchanges, brokers, and dealers.
The bill also makes clear that the updated text still applies to state consumer protection laws, and that the developer protection measures clause does not exempt compliance with the regulatory requirements under the derivatives law, nor does it affect prediction markets.
Overall, whether this package can win enough support from Democrats in Tuesday’s procedural vote remains unclear.
However, Republicans have also framed the updated text as a final concession, meaning the room for further concessions by both sides is likely limited.
#CLARITY法案
The U.S. Republican Party in the Senate has released a new version of the “Clarity Act,” and Trump has agreed to revise the code of ethics provisions
On September 14, according to Eleanor Terrett’s latest post, Senate Republicans released the full text of a new version of the “CLARITY Act,” which includes revised ethics provisions approved by President Trump.
Republicans say this is their “final, best, and ultimately” proposal presented to Democrats ahead of a key vote on Tuesday, intended to demonstrate good faith to Democrats before the debate-ending vote.
The revised text adjusts the ethics provisions. Trump agreed to a plan Republicans call the “80% Tillis-Gallego ethics proposal,” which includes stripping “substantial” encryption-related financial interests or placing them into a trust for isolation.
At the same time, the bill also allows state attorneys general to play a role in enforcing the ethics provisions, although this provision had previously been opposed by the White House.
In addition, the scope of the Blockchain Regulatory Certainty Act (BRCA) has been narrowed: it only retains protections related to the Bank Secrecy Act and civil enforcement, and deletes provisions involving criminal cases.
Regarding stablecoin earnings, new “circuit breaker clause” language has been added. It allows federal regulators to step in if there is evidence that large volumes of bank deposits are flowing into stablecoins, with final arbitration authority belonging to Treasury Secretary Scott Bessent.
Furthermore, the updated text adds more stringent restrictions addressing issues related to vertical integration, related-party transactions, and conflicts of interest involving digital asset exchanges, brokers, and dealers.
The bill also makes clear that the updated text still applies to state consumer protection laws, and that the developer protection measures clause does not exempt compliance with the regulatory requirements under the derivatives law, nor does it affect prediction markets.
Overall, whether this package can win enough support from Democrats in Tuesday’s procedural vote remains unclear.
However, Republicans have also framed the updated text as a final concession, meaning the room for further concessions by both sides is likely limited.
#CLARITY法案
On September 14, according to Eleanor Terrett’s latest post, Senate Republicans released the full text of a new version of the “CLARITY Act,” which includes revised ethics provisions approved by President Trump.
Republicans say this is their “final, best, and ultimately” proposal presented to Democrats ahead of a key vote on Tuesday, intended to demonstrate good faith to Democrats before the debate-ending vote.
The revised text adjusts the ethics provisions. Trump agreed to a plan Republicans call the “80% Tillis-Gallego ethics proposal,” which includes stripping “substantial” encryption-related financial interests or placing them into a trust for isolation.
At the same time, the bill also allows state attorneys general to play a role in enforcing the ethics provisions, although this provision had previously been opposed by the White House.
In addition, the scope of the Blockchain Regulatory Certainty Act (BRCA) has been narrowed: it only retains protections related to the Bank Secrecy Act and civil enforcement, and deletes provisions involving criminal cases.
Regarding stablecoin earnings, new “circuit breaker clause” language has been added. It allows federal regulators to step in if there is evidence that large volumes of bank deposits are flowing into stablecoins, with final arbitration authority belonging to Treasury Secretary Scott Bessent.
Furthermore, the updated text adds more stringent restrictions addressing issues related to vertical integration, related-party transactions, and conflicts of interest involving digital asset exchanges, brokers, and dealers.
The bill also makes clear that the updated text still applies to state consumer protection laws, and that the developer protection measures clause does not exempt compliance with the regulatory requirements under the derivatives law, nor does it affect prediction markets.
Overall, whether this package can win enough support from Democrats in Tuesday’s procedural vote remains unclear.
However, Republicans have also framed the updated text as a final concession, meaning the room for further concessions by both sides is likely limited.
#CLARITY法案
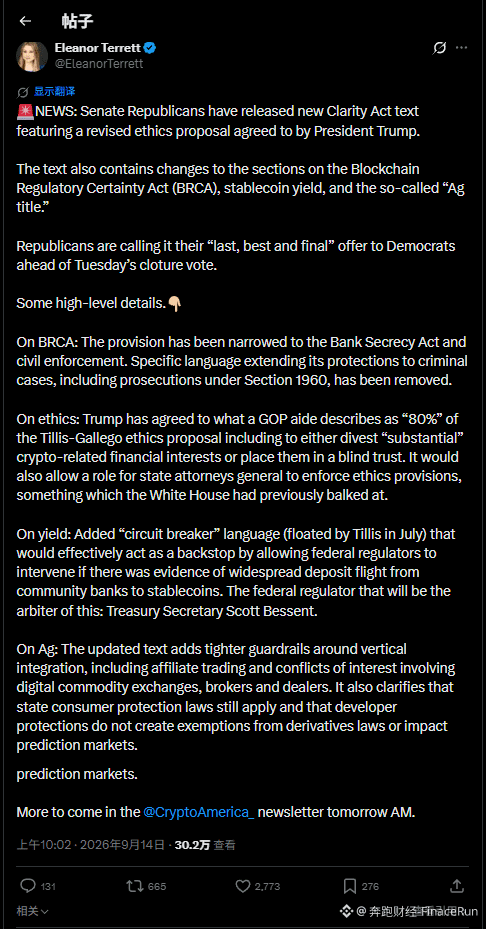
2
1.9k
Tax dispute over South Korea’s virtual assets continues to intensify; petition for a two-year extension gains support from over 50,000
On September 14, according to Digitalasset, following the tax petition that was abolished in May this year and surpassed the 50,000-supporter threshold, the “Two-Year Extension for Virtual Asset Taxation” petition also reached 57,649 approvals on the 14th, successfully meeting the 50,000 mark and formally being handed over for deliberation by the relevant standing committee.
The core demand of this petition is to postpone the implementation date of digital asset taxation by two years. The petitioners argue that if the tax policy is implemented directly, the revenue of cryptocurrency exchanges could see a significant decline, which would in turn lead to a sharp drop in corporate tax income—making it not worth the cost.
Of note is that this is the second digital-asset-tax-related petition to enter the standing committee review process in Congress. In May, another petition calling for a complete abolition of digital asset taxation was also formally submitted for deliberation after its number of supporters exceeded 50,000.
Overall, the South Korean government and the ruling party still have substantial differences on the issue of taxing digital assets. The government, on its side, insists on the existing plan and intends to officially begin collecting the tax in January 2027;
Meanwhile, the People Power Party firmly opposes imposing taxes on schedule on digital assets, citing reasons such as supporting infrastructure not yet being in place, and the two sides’ positions may be difficult to reconcile in the short term.
In summary, one side is the ruling party’s insistence on starting the digital asset tax in January 2027, while the other side is a petition supported by more than 50,000 people calling for a two-year delay. Which tax timetable do you support? Leave your views in the comments section!
#韩国虚拟资产征税延期请愿
Tax dispute over South Korea’s virtual assets continues to intensify; petition for a two-year extension gains support from over 50,000
On September 14, according to Digitalasset, following the tax petition that was abolished in May this year and surpassed the 50,000-supporter threshold, the “Two-Year Extension for Virtual Asset Taxation” petition also reached 57,649 approvals on the 14th, successfully meeting the 50,000 mark and formally being handed over for deliberation by the relevant standing committee.
The core demand of this petition is to postpone the implementation date of digital asset taxation by two years. The petitioners argue that if the tax policy is implemented directly, the revenue of cryptocurrency exchanges could see a significant decline, which would in turn lead to a sharp drop in corporate tax income—making it not worth the cost.
Of note is that this is the second digital-asset-tax-related petition to enter the standing committee review process in Congress. In May, another petition calling for a complete abolition of digital asset taxation was also formally submitted for deliberation after its number of supporters exceeded 50,000.
Overall, the South Korean government and the ruling party still have substantial differences on the issue of taxing digital assets. The government, on its side, insists on the existing plan and intends to officially begin collecting the tax in January 2027;
Meanwhile, the People Power Party firmly opposes imposing taxes on schedule on digital assets, citing reasons such as supporting infrastructure not yet being in place, and the two sides’ positions may be difficult to reconcile in the short term.
In summary, one side is the ruling party’s insistence on starting the digital asset tax in January 2027, while the other side is a petition supported by more than 50,000 people calling for a two-year delay. Which tax timetable do you support? Leave your views in the comments section!
#韩国虚拟资产征税延期请愿
On September 14, according to Digitalasset, following the tax petition that was abolished in May this year and surpassed the 50,000-supporter threshold, the “Two-Year Extension for Virtual Asset Taxation” petition also reached 57,649 approvals on the 14th, successfully meeting the 50,000 mark and formally being handed over for deliberation by the relevant standing committee.
The core demand of this petition is to postpone the implementation date of digital asset taxation by two years. The petitioners argue that if the tax policy is implemented directly, the revenue of cryptocurrency exchanges could see a significant decline, which would in turn lead to a sharp drop in corporate tax income—making it not worth the cost.
Of note is that this is the second digital-asset-tax-related petition to enter the standing committee review process in Congress. In May, another petition calling for a complete abolition of digital asset taxation was also formally submitted for deliberation after its number of supporters exceeded 50,000.
Overall, the South Korean government and the ruling party still have substantial differences on the issue of taxing digital assets. The government, on its side, insists on the existing plan and intends to officially begin collecting the tax in January 2027;
Meanwhile, the People Power Party firmly opposes imposing taxes on schedule on digital assets, citing reasons such as supporting infrastructure not yet being in place, and the two sides’ positions may be difficult to reconcile in the short term.
In summary, one side is the ruling party’s insistence on starting the digital asset tax in January 2027, while the other side is a petition supported by more than 50,000 people calling for a two-year delay. Which tax timetable do you support? Leave your views in the comments section!
#韩国虚拟资产征税延期请愿
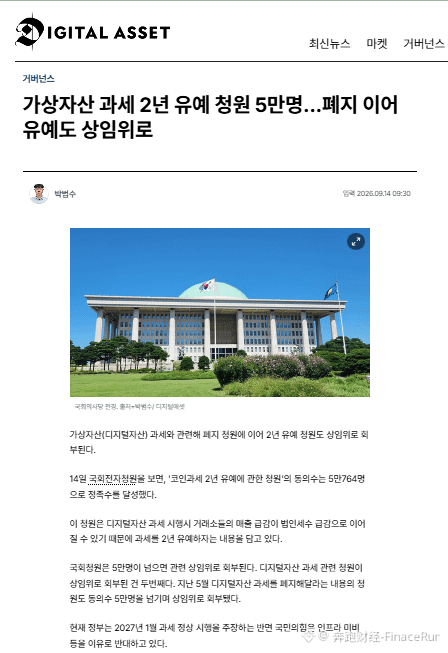

449
Cambodian payment platform CoolCash involved in fraud-related groups; its parent company’s license revoked and sanctions liquidation initiated
Recently, the parent company of the Cambodian payment platform CoolCash (XiaoYi Payment), Tian Xu International Technology Plc., had its payment license revoked by the National Bank of Cambodia and has entered liquidation proceedings.
Notably, the company and its director, Pang Weizhi, were previously accused of having ties to the Tai Zi Group allegedly involved in fraud. In March this year, the UK government listed them in its sanctions register.
In a notice issued on the 10th, the National Bank of Cambodia stated that it formally revoked Tian Xu International Technology’s payment service provider license on August 3. The license was issued on May 27, 2024, and was originally valid until 2030.
Meanwhile, pursuant to Article 68 of the Law on Banking and Financial Institutions, the National Bank of Cambodia designated the auditing accounting firm Morrison Kak MKA as the liquidator to handle liquidation matters in accordance with the law and to return relevant funds to the company’s customers in accordance with the statutory order of priority.
According to UK sanctions documents, Pang Weizhi holds dual Cambodian and Chinese nationality. In addition to serving as a director of Tian Xu International Technology, he is also a director of U-Life KH Super App Company Limited, the parent company of WOWNOW.
The UK government stated that there are reasonable grounds to suspect that Pang Weizhi provided financial services, funds, economic resources, goods, and technology to the Tai Zi Group. The Tai Zi Group is alleged to operate scam centers in Cambodia, involving forced labor and severe human rights abuses.
Based on the above allegations, Tian Xu International Technology and Pang Weizhi were separately added to the UK sanctions list in their capacities as a company and an individual, respectively. This sanctions decision also foreshadowed the eventual termination of the company’s business in Cambodia months later.
Several months after the sanctions took effect, a chain reaction became apparent. After the company’s Cambodian payment license was officially revoked and the company simultaneously initiated liquidation proceedings, industry generally believes there is a direct link between this and the international sanctions actions.
Worth noting is that Pang Weizhi’s business footprint in Cambodia extends beyond payments and food delivery. His operations also reach multiple sectors, including construction, entertainment, and aviation. The liquidation of the parent company this time may trigger further chain reactions across these associated businesses.
#金融监管
Cambodian payment platform CoolCash involved in fraud-related groups; its parent company’s license revoked and sanctions liquidation initiated
Recently, the parent company of the Cambodian payment platform CoolCash (XiaoYi Payment), Tian Xu International Technology Plc., had its payment license revoked by the National Bank of Cambodia and has entered liquidation proceedings.
Notably, the company and its director, Pang Weizhi, were previously accused of having ties to the Tai Zi Group allegedly involved in fraud. In March this year, the UK government listed them in its sanctions register.
In a notice issued on the 10th, the National Bank of Cambodia stated that it formally revoked Tian Xu International Technology’s payment service provider license on August 3. The license was issued on May 27, 2024, and was originally valid until 2030.
Meanwhile, pursuant to Article 68 of the Law on Banking and Financial Institutions, the National Bank of Cambodia designated the auditing accounting firm Morrison Kak MKA as the liquidator to handle liquidation matters in accordance with the law and to return relevant funds to the company’s customers in accordance with the statutory order of priority.
According to UK sanctions documents, Pang Weizhi holds dual Cambodian and Chinese nationality. In addition to serving as a director of Tian Xu International Technology, he is also a director of U-Life KH Super App Company Limited, the parent company of WOWNOW.
The UK government stated that there are reasonable grounds to suspect that Pang Weizhi provided financial services, funds, economic resources, goods, and technology to the Tai Zi Group. The Tai Zi Group is alleged to operate scam centers in Cambodia, involving forced labor and severe human rights abuses.
Based on the above allegations, Tian Xu International Technology and Pang Weizhi were separately added to the UK sanctions list in their capacities as a company and an individual, respectively. This sanctions decision also foreshadowed the eventual termination of the company’s business in Cambodia months later.
Several months after the sanctions took effect, a chain reaction became apparent. After the company’s Cambodian payment license was officially revoked and the company simultaneously initiated liquidation proceedings, industry generally believes there is a direct link between this and the international sanctions actions.
Worth noting is that Pang Weizhi’s business footprint in Cambodia extends beyond payments and food delivery. His operations also reach multiple sectors, including construction, entertainment, and aviation. The liquidation of the parent company this time may trigger further chain reactions across these associated businesses.
#金融监管
Recently, the parent company of the Cambodian payment platform CoolCash (XiaoYi Payment), Tian Xu International Technology Plc., had its payment license revoked by the National Bank of Cambodia and has entered liquidation proceedings.
Notably, the company and its director, Pang Weizhi, were previously accused of having ties to the Tai Zi Group allegedly involved in fraud. In March this year, the UK government listed them in its sanctions register.
In a notice issued on the 10th, the National Bank of Cambodia stated that it formally revoked Tian Xu International Technology’s payment service provider license on August 3. The license was issued on May 27, 2024, and was originally valid until 2030.
Meanwhile, pursuant to Article 68 of the Law on Banking and Financial Institutions, the National Bank of Cambodia designated the auditing accounting firm Morrison Kak MKA as the liquidator to handle liquidation matters in accordance with the law and to return relevant funds to the company’s customers in accordance with the statutory order of priority.
According to UK sanctions documents, Pang Weizhi holds dual Cambodian and Chinese nationality. In addition to serving as a director of Tian Xu International Technology, he is also a director of U-Life KH Super App Company Limited, the parent company of WOWNOW.
The UK government stated that there are reasonable grounds to suspect that Pang Weizhi provided financial services, funds, economic resources, goods, and technology to the Tai Zi Group. The Tai Zi Group is alleged to operate scam centers in Cambodia, involving forced labor and severe human rights abuses.
Based on the above allegations, Tian Xu International Technology and Pang Weizhi were separately added to the UK sanctions list in their capacities as a company and an individual, respectively. This sanctions decision also foreshadowed the eventual termination of the company’s business in Cambodia months later.
Several months after the sanctions took effect, a chain reaction became apparent. After the company’s Cambodian payment license was officially revoked and the company simultaneously initiated liquidation proceedings, industry generally believes there is a direct link between this and the international sanctions actions.
Worth noting is that Pang Weizhi’s business footprint in Cambodia extends beyond payments and food delivery. His operations also reach multiple sectors, including construction, entertainment, and aviation. The liquidation of the parent company this time may trigger further chain reactions across these associated businesses.
#金融监管

1
2
1.2k
BTC spot ETF saw total net outflows of nearly $463 million last week, while ETH ETFs recorded a total net inflow of $197 million in the same week
On September 14, according to SosoValue data, U.S. BTC spot ETFs recorded their first week of cumulative total net outflows since September, with nearly $463 million in cumulative net outflows last week;
Among them, ARK & 21Shares ARKB, Grayscale (GBTC), and BlackRock IBIT saw total net outflows for the week of $234 million, $129 million, and $52.57 million, respectively;
Next were Fidelity FBTC, VanEck HODL, and Invesco BTCO, with weekly total net outflows of $50.60 million, $13.09 million, and $4.68 million, respectively;
Meanwhile, Morgan Stanley MSBT and Bitwise BITB recorded weekly total net inflows of $19.65 million and $1.91 million, respectively;
As of now, the total net asset value of Bitcoin spot ETFs is $97.58 billion, accounting for 6.28% of Bitcoin’s total market cap. Cumulatively, they have recorded total net inflows of $55.15 billion.
In the same week, however, U.S. Ethereum spot ETFs recorded a total net inflow of $197 million, marking the fourth consecutive week of total net inflows;
Among them, BlackRock’s ETHA and ETHB, as well as Bitwise ETHW, ranked top three on the previous week’s total net inflow list, with nearly $140 million, $55.2 million, and $29.09 million, respectively;
Next were VanEck ETHV and 21Shares TETH, with weekly total net inflows of $3.71 million and $2.10 million, respectively;
Meanwhile, Grayscale’s ETHE and ETH, along with Fidelity’s FETH, recorded weekly total net outflows of $17.29 million, $11.78 million, and $3.87 million, respectively;
As of now, the total net asset value of Ethereum spot ETFs is $16.31 billion, accounting for 5.28% of Ethereum’s total market cap. Cumulatively, they have recorded total net inflows of $13.39 billion.
Among other all-category crypto ETFs, besides the HYPE ETF, which recorded a weekly total net outflow of $26.42 million, XRP, SOL, LINK, HBAR, and DOT ETFs recorded varying degrees of weekly total net inflows;
#比特币ETF #以太坊ETF
BTC spot ETF saw total net outflows of nearly $463 million last week, while ETH ETFs recorded a total net inflow of $197 million in the same week
On September 14, according to SosoValue data, U.S. BTC spot ETFs recorded their first week of cumulative total net outflows since September, with nearly $463 million in cumulative net outflows last week;
Among them, ARK & 21Shares ARKB, Grayscale (GBTC), and BlackRock IBIT saw total net outflows for the week of $234 million, $129 million, and $52.57 million, respectively;
Next were Fidelity FBTC, VanEck HODL, and Invesco BTCO, with weekly total net outflows of $50.60 million, $13.09 million, and $4.68 million, respectively;
Meanwhile, Morgan Stanley MSBT and Bitwise BITB recorded weekly total net inflows of $19.65 million and $1.91 million, respectively;
As of now, the total net asset value of Bitcoin spot ETFs is $97.58 billion, accounting for 6.28% of Bitcoin’s total market cap. Cumulatively, they have recorded total net inflows of $55.15 billion.
In the same week, however, U.S. Ethereum spot ETFs recorded a total net inflow of $197 million, marking the fourth consecutive week of total net inflows;
Among them, BlackRock’s ETHA and ETHB, as well as Bitwise ETHW, ranked top three on the previous week’s total net inflow list, with nearly $140 million, $55.2 million, and $29.09 million, respectively;
Next were VanEck ETHV and 21Shares TETH, with weekly total net inflows of $3.71 million and $2.10 million, respectively;
Meanwhile, Grayscale’s ETHE and ETH, along with Fidelity’s FETH, recorded weekly total net outflows of $17.29 million, $11.78 million, and $3.87 million, respectively;
As of now, the total net asset value of Ethereum spot ETFs is $16.31 billion, accounting for 5.28% of Ethereum’s total market cap. Cumulatively, they have recorded total net inflows of $13.39 billion.
Among other all-category crypto ETFs, besides the HYPE ETF, which recorded a weekly total net outflow of $26.42 million, XRP, SOL, LINK, HBAR, and DOT ETFs recorded varying degrees of weekly total net inflows;
#比特币ETF #以太坊ETF
On September 14, according to SosoValue data, U.S. BTC spot ETFs recorded their first week of cumulative total net outflows since September, with nearly $463 million in cumulative net outflows last week;
Among them, ARK & 21Shares ARKB, Grayscale (GBTC), and BlackRock IBIT saw total net outflows for the week of $234 million, $129 million, and $52.57 million, respectively;
Next were Fidelity FBTC, VanEck HODL, and Invesco BTCO, with weekly total net outflows of $50.60 million, $13.09 million, and $4.68 million, respectively;
Meanwhile, Morgan Stanley MSBT and Bitwise BITB recorded weekly total net inflows of $19.65 million and $1.91 million, respectively;
As of now, the total net asset value of Bitcoin spot ETFs is $97.58 billion, accounting for 6.28% of Bitcoin’s total market cap. Cumulatively, they have recorded total net inflows of $55.15 billion.
In the same week, however, U.S. Ethereum spot ETFs recorded a total net inflow of $197 million, marking the fourth consecutive week of total net inflows;
Among them, BlackRock’s ETHA and ETHB, as well as Bitwise ETHW, ranked top three on the previous week’s total net inflow list, with nearly $140 million, $55.2 million, and $29.09 million, respectively;
Next were VanEck ETHV and 21Shares TETH, with weekly total net inflows of $3.71 million and $2.10 million, respectively;
Meanwhile, Grayscale’s ETHE and ETH, along with Fidelity’s FETH, recorded weekly total net outflows of $17.29 million, $11.78 million, and $3.87 million, respectively;
As of now, the total net asset value of Ethereum spot ETFs is $16.31 billion, accounting for 5.28% of Ethereum’s total market cap. Cumulatively, they have recorded total net inflows of $13.39 billion.
Among other all-category crypto ETFs, besides the HYPE ETF, which recorded a weekly total net outflow of $26.42 million, XRP, SOL, LINK, HBAR, and DOT ETFs recorded varying degrees of weekly total net inflows;
#比特币ETF #以太坊ETF


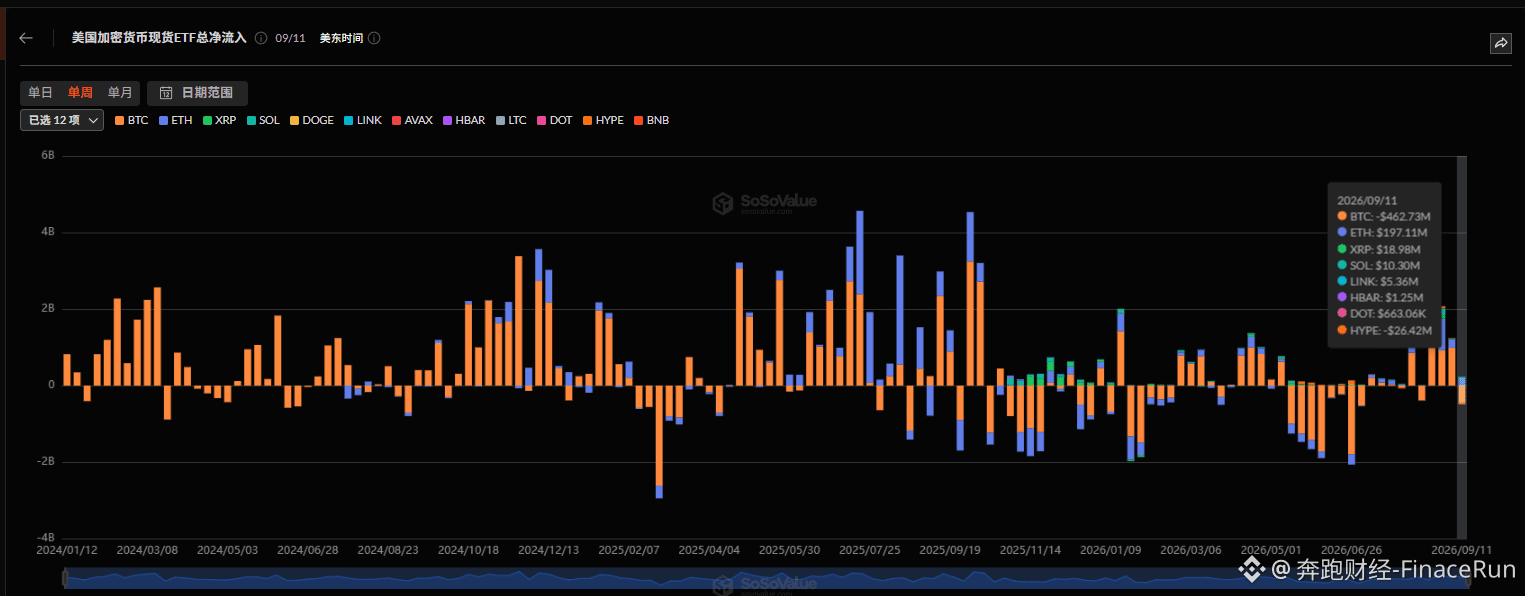
614
Perspective: The CLARITY Act is just a booster, not the deciding factor for an encrypted future
September 14, The ETF Store president Nate Geraci made a public statement, saying that although the CLARITY Act is worth期待 if it can secure enough votes and advance legislation, he personally believes that whether the bill passes will have little actual impact on the crypto industry.
Geraci noted that under the Trump administration, the U.S. Securities and Exchange Commission (SEC) and the Commodity Futures Trading Commission (CFTC) are working to use existing regulatory powers to drive the development of the crypto industry, rather than waiting for new legislation to take effect.
In his view, the pace at which the crypto industry evolves far outstrips political processes. By the time politicians truly realize that the financial system has already been reshaped, it may be too late to reverse this trend.
In addition, the real role of the CLARITY Act is to accelerate this process—by injecting confidence into industry innovation and making established facts harder to overturn. Therefore, the future of crypto does not depend on the bill itself.
In a subsequent post, he added that politicians may try to slow it down or hinder it, but as long as the benefits outweigh the drawbacks, they ultimately cannot block it for the long term—because innovation always finds a way forward.
What do you think of Geraci’s assessment? In your view, is the CLARITY Act a true turning point for the crypto industry, or just a booster that rides along with the current? Leave your thoughts in the comments section!
#CLARITY法案
Perspective: The CLARITY Act is just a booster, not the deciding factor for an encrypted future
September 14, The ETF Store president Nate Geraci made a public statement, saying that although the CLARITY Act is worth期待 if it can secure enough votes and advance legislation, he personally believes that whether the bill passes will have little actual impact on the crypto industry.
Geraci noted that under the Trump administration, the U.S. Securities and Exchange Commission (SEC) and the Commodity Futures Trading Commission (CFTC) are working to use existing regulatory powers to drive the development of the crypto industry, rather than waiting for new legislation to take effect.
In his view, the pace at which the crypto industry evolves far outstrips political processes. By the time politicians truly realize that the financial system has already been reshaped, it may be too late to reverse this trend.
In addition, the real role of the CLARITY Act is to accelerate this process—by injecting confidence into industry innovation and making established facts harder to overturn. Therefore, the future of crypto does not depend on the bill itself.
In a subsequent post, he added that politicians may try to slow it down or hinder it, but as long as the benefits outweigh the drawbacks, they ultimately cannot block it for the long term—because innovation always finds a way forward.
What do you think of Geraci’s assessment? In your view, is the CLARITY Act a true turning point for the crypto industry, or just a booster that rides along with the current? Leave your thoughts in the comments section!
#CLARITY法案
September 14, The ETF Store president Nate Geraci made a public statement, saying that although the CLARITY Act is worth期待 if it can secure enough votes and advance legislation, he personally believes that whether the bill passes will have little actual impact on the crypto industry.
Geraci noted that under the Trump administration, the U.S. Securities and Exchange Commission (SEC) and the Commodity Futures Trading Commission (CFTC) are working to use existing regulatory powers to drive the development of the crypto industry, rather than waiting for new legislation to take effect.
In his view, the pace at which the crypto industry evolves far outstrips political processes. By the time politicians truly realize that the financial system has already been reshaped, it may be too late to reverse this trend.
In addition, the real role of the CLARITY Act is to accelerate this process—by injecting confidence into industry innovation and making established facts harder to overturn. Therefore, the future of crypto does not depend on the bill itself.
In a subsequent post, he added that politicians may try to slow it down or hinder it, but as long as the benefits outweigh the drawbacks, they ultimately cannot block it for the long term—because innovation always finds a way forward.
What do you think of Geraci’s assessment? In your view, is the CLARITY Act a true turning point for the crypto industry, or just a booster that rides along with the current? Leave your thoughts in the comments section!
#CLARITY法案

1
2
2k
Bitcoin’s rebound has ignited the strongest market enthusiasm in nearly two years, with the market sentiment index surging into the “Extreme Greed” range
On September 12, analysts Darkfost said that this round of Bitcoin’s rebound has sparked the highest level of investor enthusiasm seen in the past two years. The last time such strong bullish sentiment appeared was back in March 2024.
According to the related market sentiment index shared by the analyst, the score temporarily broke above 89 (out of 100), placing it in the “Extreme Greed” range.
The index combines the Fear and Greed Index and other indicators. Its scale ranges from -100 to +100, ordered from Extreme Greed to Extreme Fear, allowing it to reflect shifts in market sentiment from Extreme Greed to Fear.
Although the index includes indicators such as the “Fear and Greed Index,” their operating mechanisms are not exactly the same. During bear market cycles, sentiment-type indicators usually linger in negative territory for a long time, making their reference value relatively limited.
However, once the market trend reverses, these indicators show important observation value. Especially when market sentiment clearly turns, such indicators can provide valuable signals for investors, helping them grasp key turning points in the market.
Based on historical experience, once market sentiment moves to extremes—whether excessively optimistic or excessively pessimistic—it often signals that the market is about to reach a turning point.
Currently, after a wave of heightened enthusiasm, this sentiment indicator is gradually rolling over from high levels and moving back toward more normal levels.
Meanwhile, Bitcoin is also working to hold its current price range, as bulls and bears engage in a standoff at this level.
As for whether the market can find a new direction after sentiment cools down, investors will need to keep watching how events unfold.
#市场情绪 #链上指标分析
Bitcoin’s rebound has ignited the strongest market enthusiasm in nearly two years, with the market sentiment index surging into the “Extreme Greed” range
On September 12, analysts Darkfost said that this round of Bitcoin’s rebound has sparked the highest level of investor enthusiasm seen in the past two years. The last time such strong bullish sentiment appeared was back in March 2024.
According to the related market sentiment index shared by the analyst, the score temporarily broke above 89 (out of 100), placing it in the “Extreme Greed” range.
The index combines the Fear and Greed Index and other indicators. Its scale ranges from -100 to +100, ordered from Extreme Greed to Extreme Fear, allowing it to reflect shifts in market sentiment from Extreme Greed to Fear.
Although the index includes indicators such as the “Fear and Greed Index,” their operating mechanisms are not exactly the same. During bear market cycles, sentiment-type indicators usually linger in negative territory for a long time, making their reference value relatively limited.
However, once the market trend reverses, these indicators show important observation value. Especially when market sentiment clearly turns, such indicators can provide valuable signals for investors, helping them grasp key turning points in the market.
Based on historical experience, once market sentiment moves to extremes—whether excessively optimistic or excessively pessimistic—it often signals that the market is about to reach a turning point.
Currently, after a wave of heightened enthusiasm, this sentiment indicator is gradually rolling over from high levels and moving back toward more normal levels.
Meanwhile, Bitcoin is also working to hold its current price range, as bulls and bears engage in a standoff at this level.
As for whether the market can find a new direction after sentiment cools down, investors will need to keep watching how events unfold.
#市场情绪 #链上指标分析
On September 12, analysts Darkfost said that this round of Bitcoin’s rebound has sparked the highest level of investor enthusiasm seen in the past two years. The last time such strong bullish sentiment appeared was back in March 2024.
According to the related market sentiment index shared by the analyst, the score temporarily broke above 89 (out of 100), placing it in the “Extreme Greed” range.
The index combines the Fear and Greed Index and other indicators. Its scale ranges from -100 to +100, ordered from Extreme Greed to Extreme Fear, allowing it to reflect shifts in market sentiment from Extreme Greed to Fear.
Although the index includes indicators such as the “Fear and Greed Index,” their operating mechanisms are not exactly the same. During bear market cycles, sentiment-type indicators usually linger in negative territory for a long time, making their reference value relatively limited.
However, once the market trend reverses, these indicators show important observation value. Especially when market sentiment clearly turns, such indicators can provide valuable signals for investors, helping them grasp key turning points in the market.
Based on historical experience, once market sentiment moves to extremes—whether excessively optimistic or excessively pessimistic—it often signals that the market is about to reach a turning point.
Currently, after a wave of heightened enthusiasm, this sentiment indicator is gradually rolling over from high levels and moving back toward more normal levels.
Meanwhile, Bitcoin is also working to hold its current price range, as bulls and bears engage in a standoff at this level.
As for whether the market can find a new direction after sentiment cools down, investors will need to keep watching how events unfold.
#市场情绪 #链上指标分析
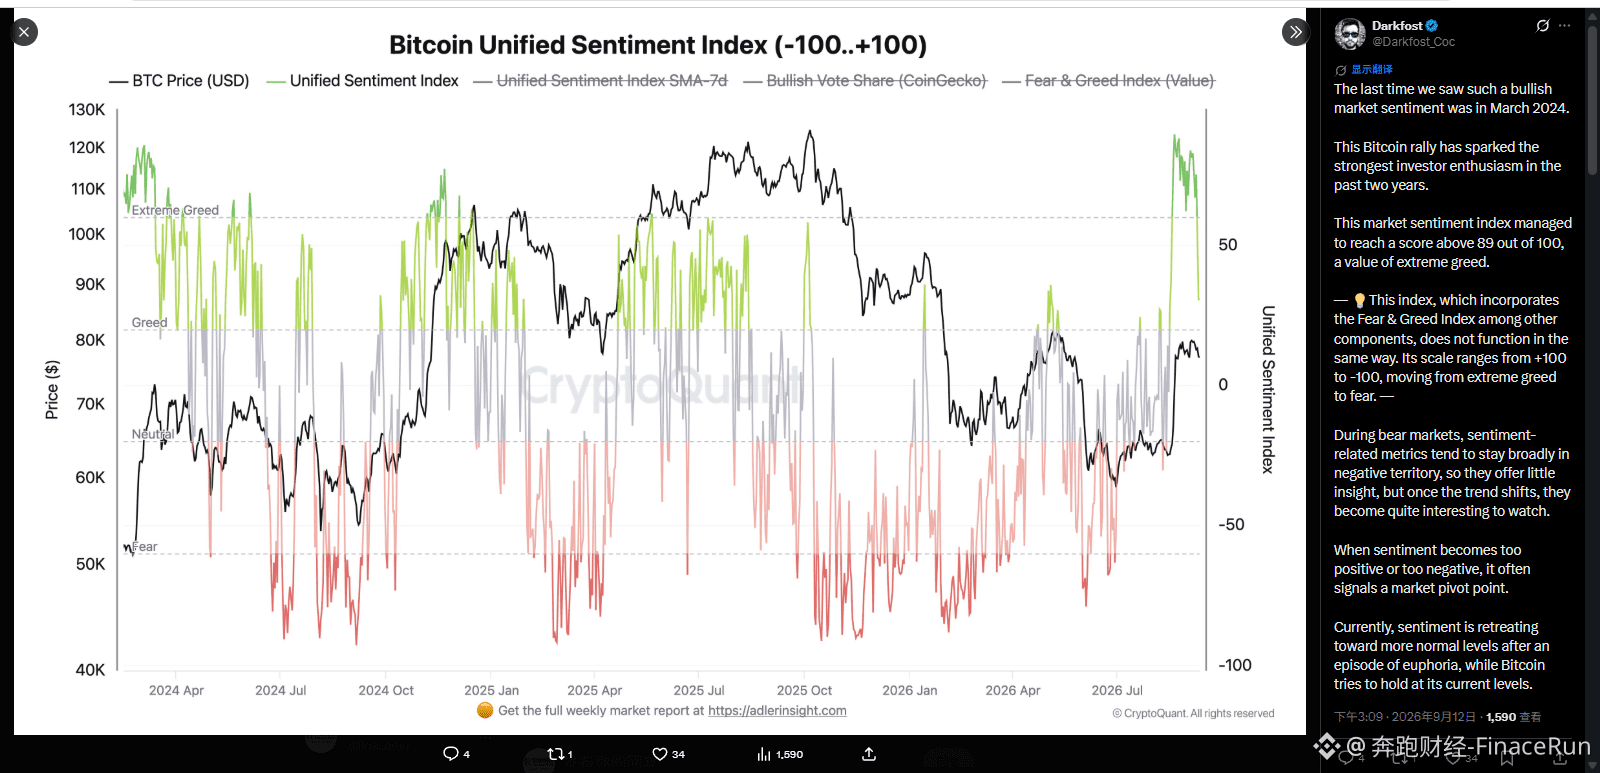
1.2k
Log in to explore more content
Join global crypto users on Binance Square
⚡️ Get latest and useful information about crypto.
💬 Trusted by the world’s largest crypto exchange.
👍 Discover real insights from verified creators.
Email / Phone number
Trending Topics
FedRateWatch
1.5M views
6,813 Discussing
Share & Win Traffic Reward in our Trending Hashtag Campaign
✨Topic: FOMC September, What's The Fed's Next Move?
👉How to Join:
Publish a short post or article with hashtag #FedRateWatch
Create content based on the below angles:
- August core CPI rose 0.3% month-over-month, and the odds of a 25bp hike this week are now close to 90%. Do you anticipate a rate hike this week? Is it a one-off, or the start of a longer hiking cycle?
- If the hike lands, how does it play out for BTC, tech stocks, and gold? Bullish or bearish?
- How are you planning to trade next? Share your BTC, stocks or gold trade/holdings with our trade sharing widget.
⏰Campaign Period:
- 2026-09-15 11:00 - 2026-09-17 3:00 UTC
🎁Reward:
- Qualified posts that comply with the above guidelines and contain more than 100 words will be reviewed and may receive a random traffic boost of 500 to 3,000 views. You will receive a notification from your feed secretary if your post is selected.
- Get a chance to have your article featured on Binance Square Official
Need ideas for your post? Visit the topic page #FedRateWatch or the Square Guide on How to Post for Better Reach.
Binance Square Official
·650 Likes
·1.7M views
ZcashRises6%
57,599 views
683 Discussing
XRPSinks10%
38,253 views
447 Discussing