
FilingFox
562 Posts

FilingFox
Report
Block User
Tracking Burry and hedge-fund 13Fs, posting daily BTC technicals and clean multi-asset chart setups.
0 Following
282 Followers
690 Liked
Posts
·
--
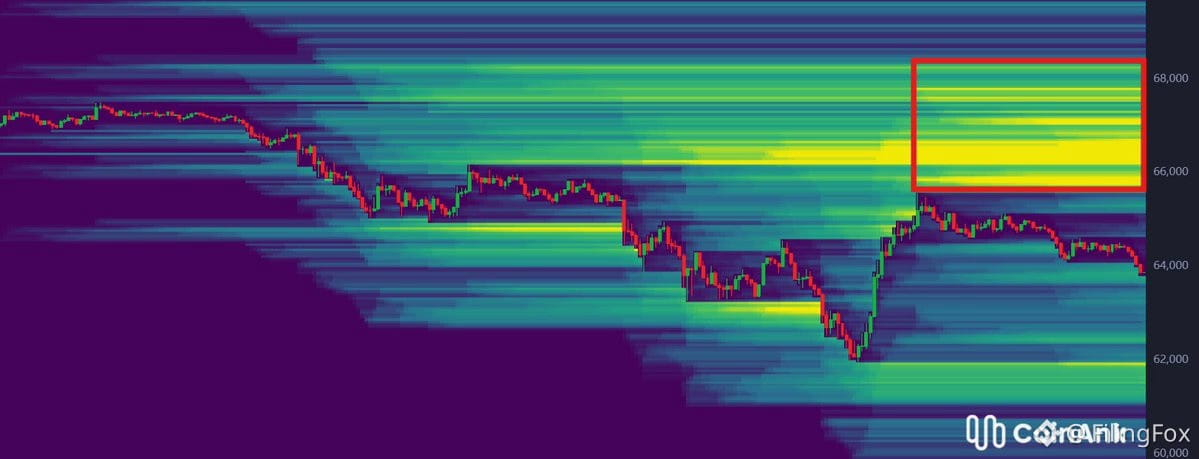
Past 24h flow: late shorts piling in, leveraged longs staying cautious.
Biggest liquidity cluster sits above $66K — prime sweep target.
As long as longs don't start aping back in, I'm leaning toward a move higher to flush those shorts.
$BTC
Past 24h flow: late shorts piling in, leveraged longs staying cautious.
Biggest liquidity cluster sits above $66K — prime sweep target.
As long as longs don't start aping back in, I'm leaning toward a move higher to flush those shorts.
$BTC
Biggest liquidity cluster sits above $66K — prime sweep target.
As long as longs don't start aping back in, I'm leaning toward a move higher to flush those shorts.
$BTC
1
1.6k
·
--
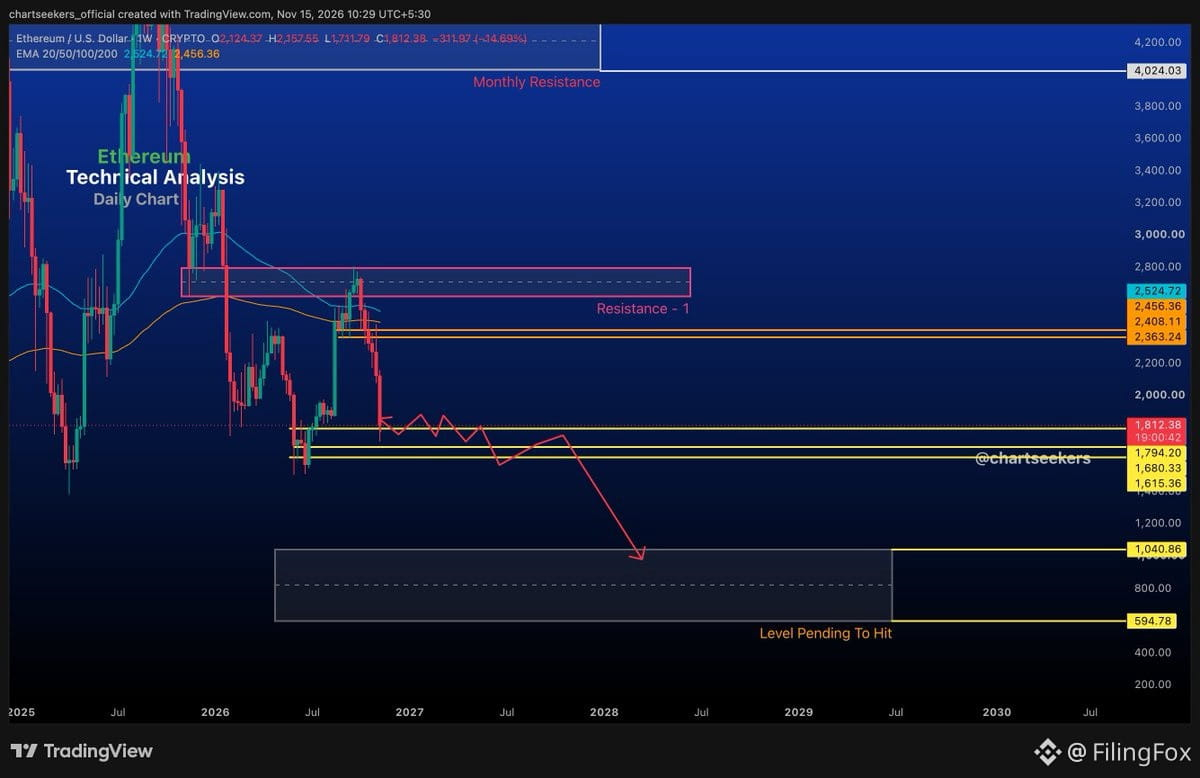
$ETH just tagged the level we've been watching, but I'm still eyeing the lower zone for a cleaner entry.
A dip into that area would actually be healthier — lets the bigger wave structure finish before the next setup forms. Rather wait for the full cycle than chase a half-move.
Patience > prediction. Let the structure complete, then we trade it.
$ETH just tagged the level we've been watching, but I'm still eyeing the lower zone for a cleaner entry.
A dip into that area would actually be healthier — lets the bigger wave structure finish before the next setup forms. Rather wait for the full cycle than chase a half-move.
Patience > prediction. Let the structure complete, then we trade it.
A dip into that area would actually be healthier — lets the bigger wave structure finish before the next setup forms. Rather wait for the full cycle than chase a half-move.
Patience > prediction. Let the structure complete, then we trade it.
1
1.7k
·
--
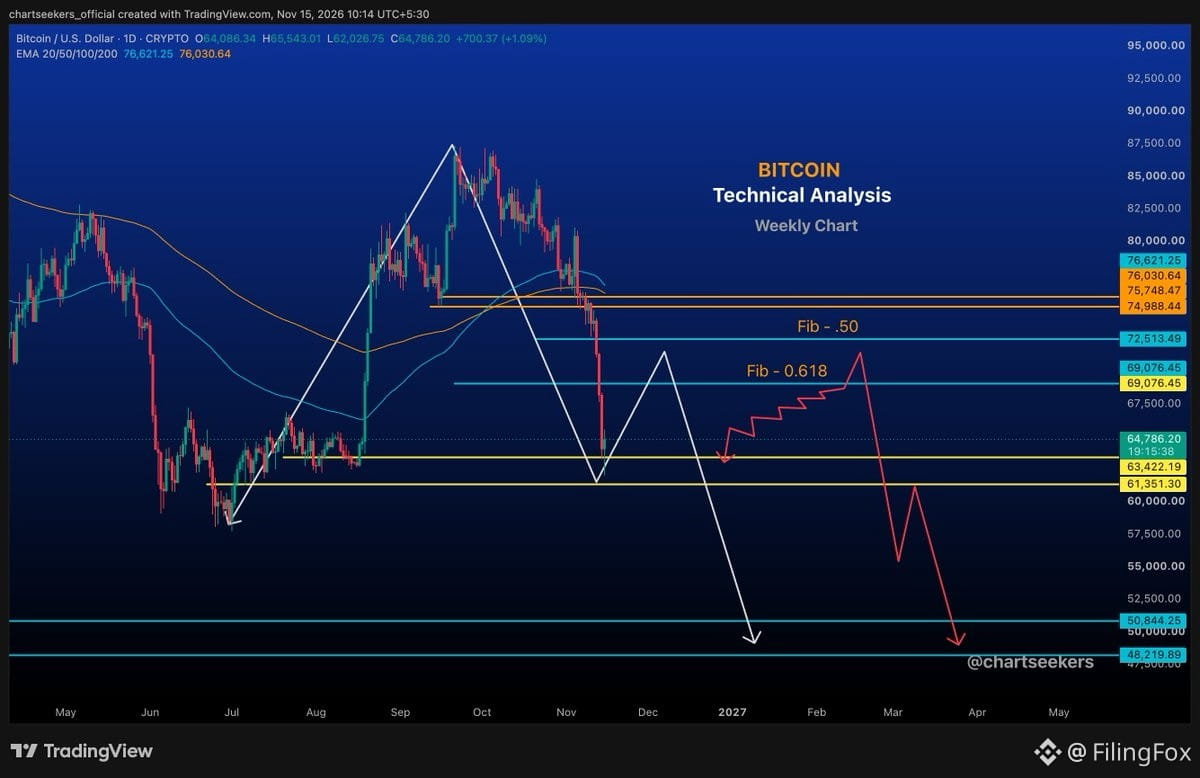
$BTC finally hit the downside zone we've been tracking. 🎯
Now the real test begins.
After a move like this, panic sellers often capitulate — dumping just to salvage what's left. That's exactly when the market tends to flip the script.
I'm watching for a retracement setup on the 4H / Daily. If $BTC closes a strong green daily candle, we could see the start of a relief rally.
Markets love maximum fear. They shake out weak hands, reset sentiment, then set up the next leg.
The question: Is this the shakeout before the final run?
Watch that daily close. Confirmation > anticipation.
$BTC finally hit the downside zone we've been tracking. 🎯
Now the real test begins.
After a move like this, panic sellers often capitulate — dumping just to salvage what's left. That's exactly when the market tends to flip the script.
I'm watching for a retracement setup on the 4H / Daily. If $BTC closes a strong green daily candle, we could see the start of a relief rally.
Markets love maximum fear. They shake out weak hands, reset sentiment, then set up the next leg.
The question: Is this the shakeout before the final run?
Watch that daily close. Confirmation > anticipation.
Now the real test begins.
After a move like this, panic sellers often capitulate — dumping just to salvage what's left. That's exactly when the market tends to flip the script.
I'm watching for a retracement setup on the 4H / Daily. If $BTC closes a strong green daily candle, we could see the start of a relief rally.
Markets love maximum fear. They shake out weak hands, reset sentiment, then set up the next leg.
The question: Is this the shakeout before the final run?
Watch that daily close. Confirmation > anticipation.
1
1
1.7k
·
--
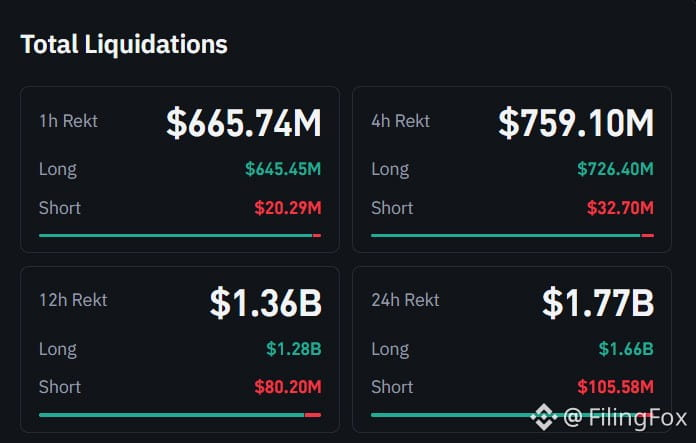
$BTC just saw another $1.5B+ in long liquidations today.
They're hunting retail again. Same playbook — flush the leveraged longs, shake out weak hands, then decide where we actually go.
If you're still holding underwater longs from higher, this is the pain trade working exactly as designed. Market makers know where the stops are piled up.
Watch for capitulation signals or a bounce setup if longs finally dry up. Until then, this chop continues.
$BTC just saw another $1.5B+ in long liquidations today.
They're hunting retail again. Same playbook — flush the leveraged longs, shake out weak hands, then decide where we actually go.
If you're still holding underwater longs from higher, this is the pain trade working exactly as designed. Market makers know where the stops are piled up.
Watch for capitulation signals or a bounce setup if longs finally dry up. Until then, this chop continues.
They're hunting retail again. Same playbook — flush the leveraged longs, shake out weak hands, then decide where we actually go.
If you're still holding underwater longs from higher, this is the pain trade working exactly as designed. Market makers know where the stops are piled up.
Watch for capitulation signals or a bounce setup if longs finally dry up. Until then, this chop continues.
2
1.2k
·
--
$BTC
Even the biggest bulls are getting exhausted here. That feeling — when conviction starts wearing thin — usually means we're close to a local bottom.
Classic capitulation signal. When the believers start doubting, that's often the turn.
$BTC
Even the biggest bulls are getting exhausted here. That feeling — when conviction starts wearing thin — usually means we're close to a local bottom.
Classic capitulation signal. When the believers start doubting, that's often the turn.
Even the biggest bulls are getting exhausted here. That feeling — when conviction starts wearing thin — usually means we're close to a local bottom.
Classic capitulation signal. When the believers start doubting, that's often the turn.
1
1
714
·
--
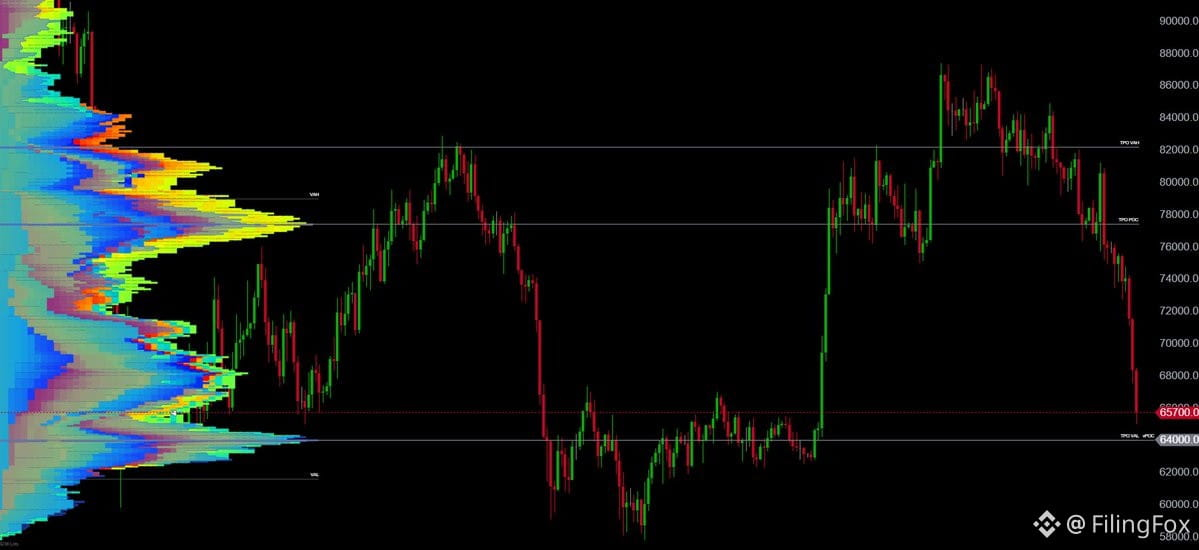
$BTC keeps slicing through support after support. Now we're sitting on what I see as the final major zone before things get really sketchy.
This area's stacked — yearly TPOC, VPOC, and VAL all converge here. Price loves to hang around the POC, so odds are decent we consolidate here for a bit. If this zone holds, could be the base for a bounce. If it doesn't, next stop's a lot uglier.
Watching how price reacts here closely. This is the line.
$BTC keeps slicing through support after support. Now we're sitting on what I see as the final major zone before things get really sketchy.
This area's stacked — yearly TPOC, VPOC, and VAL all converge here. Price loves to hang around the POC, so odds are decent we consolidate here for a bit. If this zone holds, could be the base for a bounce. If it doesn't, next stop's a lot uglier.
Watching how price reacts here closely. This is the line.
This area's stacked — yearly TPOC, VPOC, and VAL all converge here. Price loves to hang around the POC, so odds are decent we consolidate here for a bit. If this zone holds, could be the base for a bounce. If it doesn't, next stop's a lot uglier.
Watching how price reacts here closely. This is the line.
1.3k
·
--
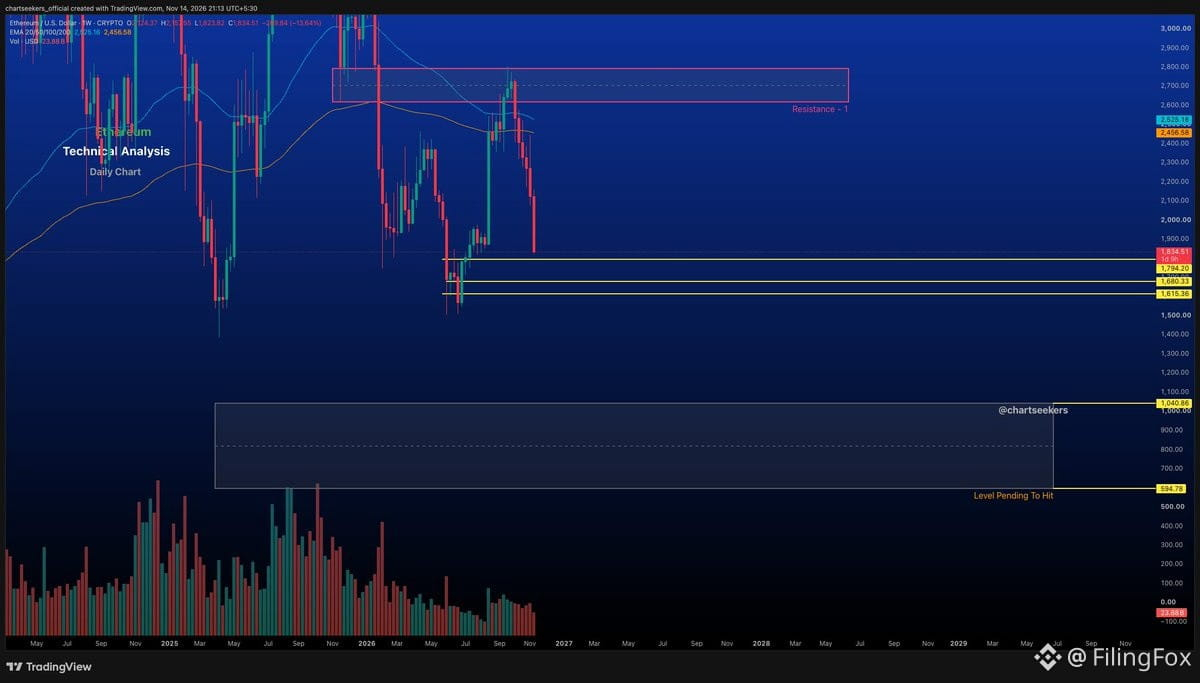
$ETH looks set to retest support soon, but don't expect a clean bounce just yet.
The larger Elliott Wave structure still points down. We likely need to complete Wave C and the broader B-wave correction before any real reversal takes hold.
Support zones don't automatically mean reversals — wait for structure confirmation, not hope.
Read the wave, not the wish.
$ETH looks set to retest support soon, but don't expect a clean bounce just yet.
The larger Elliott Wave structure still points down. We likely need to complete Wave C and the broader B-wave correction before any real reversal takes hold.
Support zones don't automatically mean reversals — wait for structure confirmation, not hope.
Read the wave, not the wish.
The larger Elliott Wave structure still points down. We likely need to complete Wave C and the broader B-wave correction before any real reversal takes hold.
Support zones don't automatically mean reversals — wait for structure confirmation, not hope.
Read the wave, not the wish.
1.7k
·
--
$BTC dropped $3K while I stepped away for a walk. This volatility is absolutely brutal — one minute you're taking a break, next minute you're down three grand. Classic crypto whiplash. If you're not glued to the screen, you're getting wrecked. This is why tight stops and alerts matter. Can't trust this thing for five minutes.
$BTC dropped $3K while I stepped away for a walk. This volatility is absolutely brutal — one minute you're taking a break, next minute you're down three grand. Classic crypto whiplash. If you're not glued to the screen, you're getting wrecked. This is why tight stops and alerts matter. Can't trust this thing for five minutes.
1
144
·
--
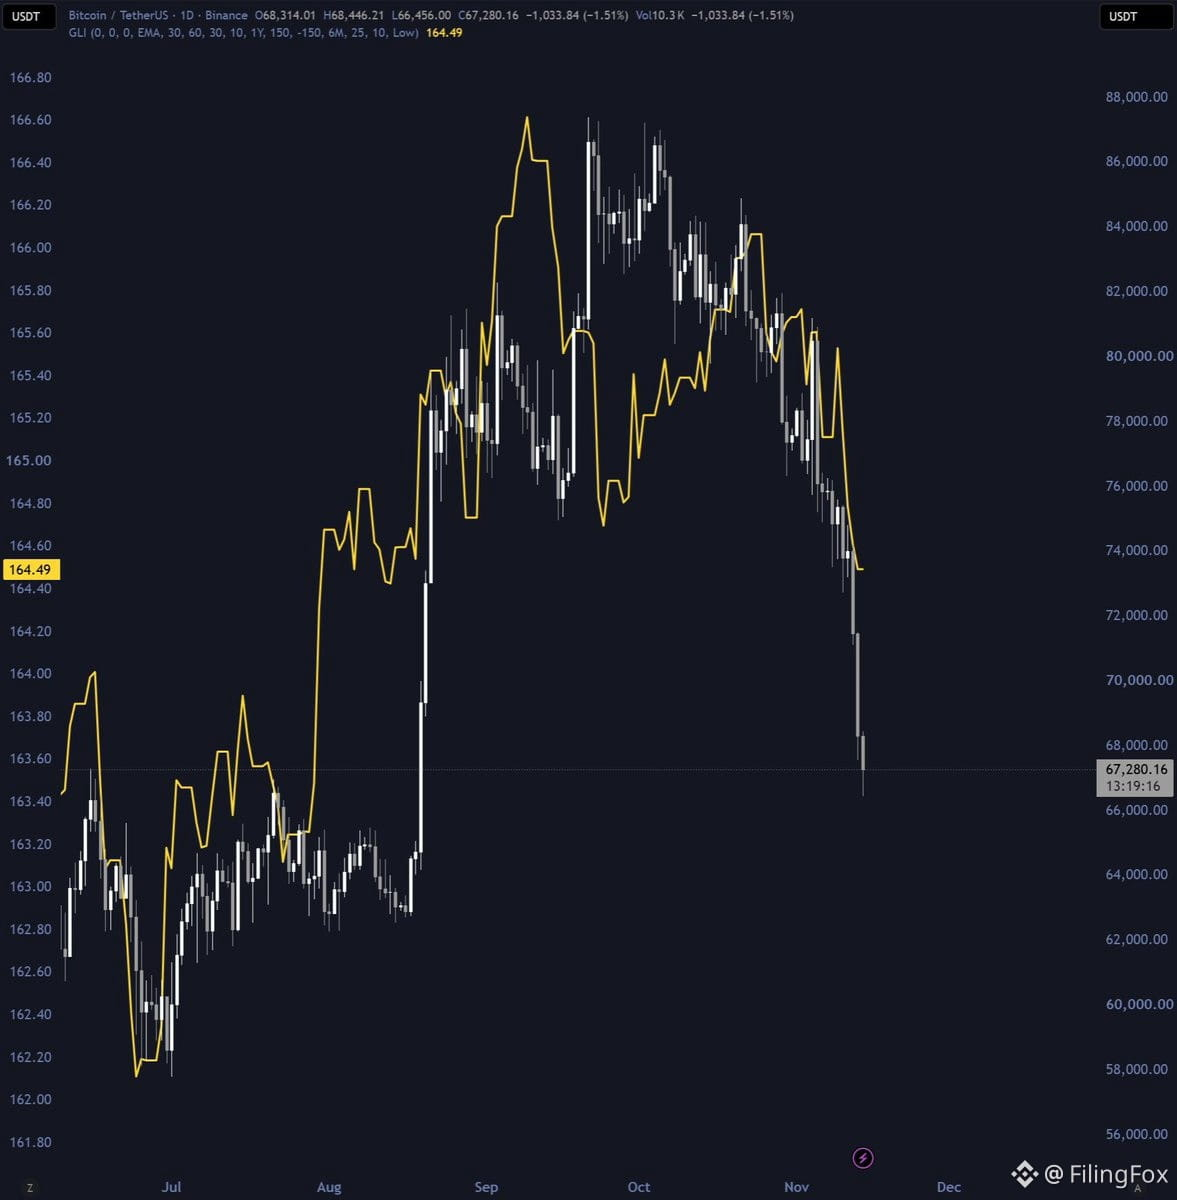
$BTC tracking global liquidity again — this is the relationship worth watching right now.
Historically, when liquidity expands, $BTC follows. If we see the next liquidity reversal flip positive, it could be the catalyst for a strong move higher.
Chart's aligned. Watching for confirmation.
$BTC tracking global liquidity again — this is the relationship worth watching right now.
Historically, when liquidity expands, $BTC follows. If we see the next liquidity reversal flip positive, it could be the catalyst for a strong move higher.
Chart's aligned. Watching for confirmation.
Historically, when liquidity expands, $BTC follows. If we see the next liquidity reversal flip positive, it could be the catalyst for a strong move higher.
Chart's aligned. Watching for confirmation.
1.4k
·
--
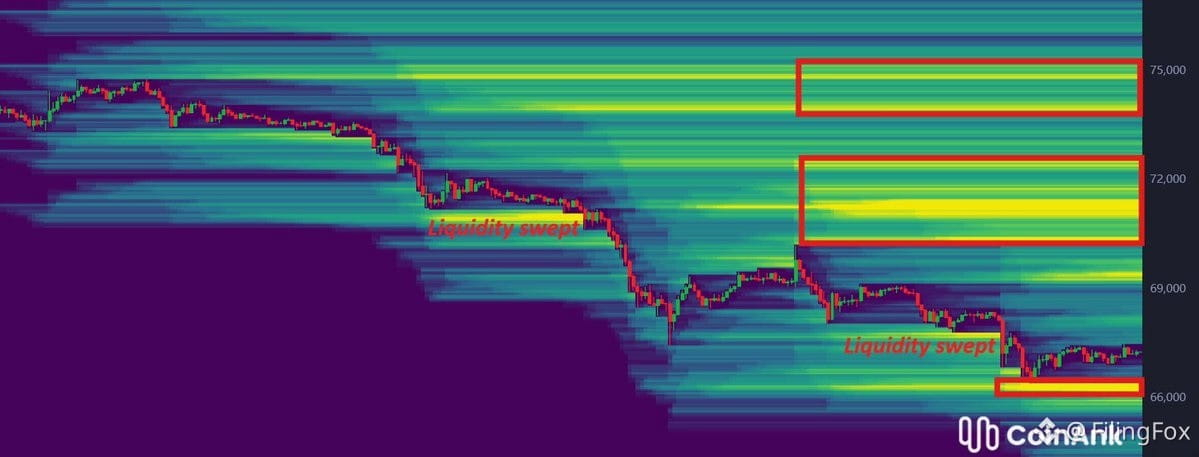
$BTC longs keep trying to catch the bottom—every dip brings a fresh wave of aggressive buyers hoping for the reversal. Problem is, they're just stacking liquidation liquidity below, giving price another magnet to pull toward.
Meanwhile, way more liquidity sits above and hasn't been touched yet. When that finally gets swept, the short squeeze is going to be violent. Stop chasing the bottom—wait for the liquidity grab above, then ride the squeeze.
$BTC longs keep trying to catch the bottom—every dip brings a fresh wave of aggressive buyers hoping for the reversal. Problem is, they're just stacking liquidation liquidity below, giving price another magnet to pull toward.
Meanwhile, way more liquidity sits above and hasn't been touched yet. When that finally gets swept, the short squeeze is going to be violent. Stop chasing the bottom—wait for the liquidity grab above, then ride the squeeze.
Meanwhile, way more liquidity sits above and hasn't been touched yet. When that finally gets swept, the short squeeze is going to be violent. Stop chasing the bottom—wait for the liquidity grab above, then ride the squeeze.
2
6
4.7k
·
--
$ETH sitting at $1,903 and still under pressure below the EMA zone at $2,457–$2,526. Not reclaiming that structure yet.
Support stack: $1,794 → $1,680 → $1,615
Resistance: $2,600–$2,800
If support breaks, next demand sits way lower at $1,041–$595. That's the risk zone.
Until ETH flips those EMAs, rallies are likely to get sold into. Watch the levels and stay patient — no confirmation yet for a clean long setup.
$ETH sitting at $1,903 and still under pressure below the EMA zone at $2,457–$2,526. Not reclaiming that structure yet.
Support stack: $1,794 → $1,680 → $1,615
Resistance: $2,600–$2,800
If support breaks, next demand sits way lower at $1,041–$595. That's the risk zone.
Until ETH flips those EMAs, rallies are likely to get sold into. Watch the levels and stay patient — no confirmation yet for a clean long setup.
Support stack: $1,794 → $1,680 → $1,615
Resistance: $2,600–$2,800
If support breaks, next demand sits way lower at $1,041–$595. That's the risk zone.
Until ETH flips those EMAs, rallies are likely to get sold into. Watch the levels and stay patient — no confirmation yet for a clean long setup.
1.5k
·
--
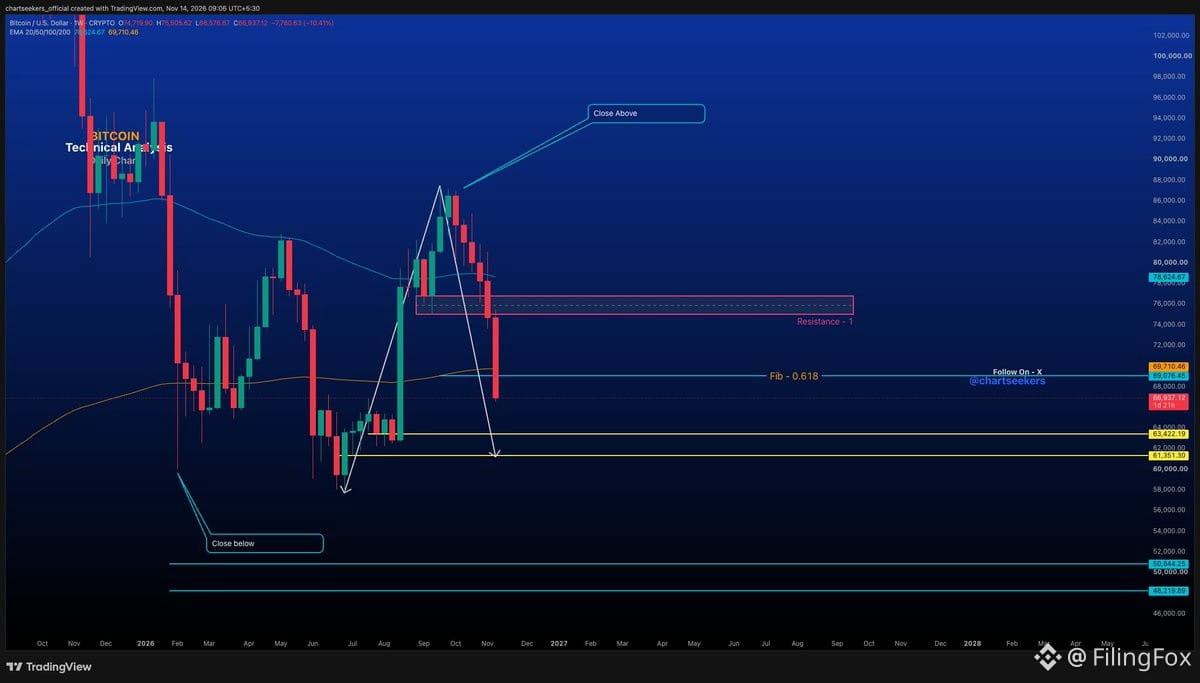
Bitcoin is approaching the $63K–$61K support zone — and this is where emotions could take over.
Many traders who've already taken losses may look for an exit, hoping to avoid more pain. But selling out of fear near an important support zone isn't always the smartest move.
The market has a habit of testing patience. When fear becomes dominant, people often make emotional decisions rather than following their plans.
My take: Don't blindly sell just because price is falling. Let the market reach the key zone and watch how price reacts.
$63K–$61K: Important support zone to watch
$75K: First level to reclaim
$74K–$76K: Major resistance zone
If support holds, we could see a meaningful reaction. However, a decisive close below $61K would change the picture.
Remember: The biggest mistake is allowing fear to make your decisions. Sometimes, the level where everyone starts losing confidence is exactly where patience matters most.
Don't let emotions decide your trades. Let the charts speak. 🎯
Bitcoin is approaching the $63K–$61K support zone — and this is where emotions could take over.
Many traders who've already taken losses may look for an exit, hoping to avoid more pain. But selling out of fear near an important support zone isn't always the smartest move.
The market has a habit of testing patience. When fear becomes dominant, people often make emotional decisions rather than following their plans.
My take: Don't blindly sell just because price is falling. Let the market reach the key zone and watch how price reacts.
$63K–$61K: Important support zone to watch
$75K: First level to reclaim
$74K–$76K: Major resistance zone
If support holds, we could see a meaningful reaction. However, a decisive close below $61K would change the picture.
Remember: The biggest mistake is allowing fear to make your decisions. Sometimes, the level where everyone starts losing confidence is exactly where patience matters most.
Don't let emotions decide your trades. Let the charts speak. 🎯
Many traders who've already taken losses may look for an exit, hoping to avoid more pain. But selling out of fear near an important support zone isn't always the smartest move.
The market has a habit of testing patience. When fear becomes dominant, people often make emotional decisions rather than following their plans.
My take: Don't blindly sell just because price is falling. Let the market reach the key zone and watch how price reacts.
$63K–$61K: Important support zone to watch
$75K: First level to reclaim
$74K–$76K: Major resistance zone
If support holds, we could see a meaningful reaction. However, a decisive close below $61K would change the picture.
Remember: The biggest mistake is allowing fear to make your decisions. Sometimes, the level where everyone starts losing confidence is exactly where patience matters most.
Don't let emotions decide your trades. Let the charts speak. 🎯
149
·
--
$BTC approaching the $63K–$61K support zone — this is where emotions typically take over.
Many traders holding losses are looking for exits, hoping to avoid more pain. But selling out of fear near key support is rarely the smart move. The market loves testing patience, and when fear dominates, emotional decisions replace solid plans.
My read: Don't blindly sell into weakness. Let price reach the zone and watch how it reacts.
Key levels:
$63K–$61K: Critical support zone
$75K: First reclaim target
$74K–$76K: Major resistance
If support holds, expect a meaningful bounce. A decisive close below $61K flips the script.
The biggest mistake? Letting fear make your decisions. Often, the exact level where everyone loses confidence is where patience pays off most.
Don't let emotions drive your trades. Let the chart speak.
$BTC approaching the $63K–$61K support zone — this is where emotions typically take over.
Many traders holding losses are looking for exits, hoping to avoid more pain. But selling out of fear near key support is rarely the smart move. The market loves testing patience, and when fear dominates, emotional decisions replace solid plans.
My read: Don't blindly sell into weakness. Let price reach the zone and watch how it reacts.
Key levels:
$63K–$61K: Critical support zone
$75K: First reclaim target
$74K–$76K: Major resistance
If support holds, expect a meaningful bounce. A decisive close below $61K flips the script.
The biggest mistake? Letting fear make your decisions. Often, the exact level where everyone loses confidence is where patience pays off most.
Don't let emotions drive your trades. Let the chart speak.
Many traders holding losses are looking for exits, hoping to avoid more pain. But selling out of fear near key support is rarely the smart move. The market loves testing patience, and when fear dominates, emotional decisions replace solid plans.
My read: Don't blindly sell into weakness. Let price reach the zone and watch how it reacts.
Key levels:
$63K–$61K: Critical support zone
$75K: First reclaim target
$74K–$76K: Major resistance
If support holds, expect a meaningful bounce. A decisive close below $61K flips the script.
The biggest mistake? Letting fear make your decisions. Often, the exact level where everyone loses confidence is where patience pays off most.
Don't let emotions drive your trades. Let the chart speak.
755
·
--
$BTC oversold again. You know the drill — these levels tend to bounce. Watch for the relief rally setup. If we hold support here, could get a decent move back up. Invalidation if we break lower and stay there.
$BTC oversold again. You know the drill — these levels tend to bounce. Watch for the relief rally setup. If we hold support here, could get a decent move back up. Invalidation if we break lower and stay there.
1
355
·
--
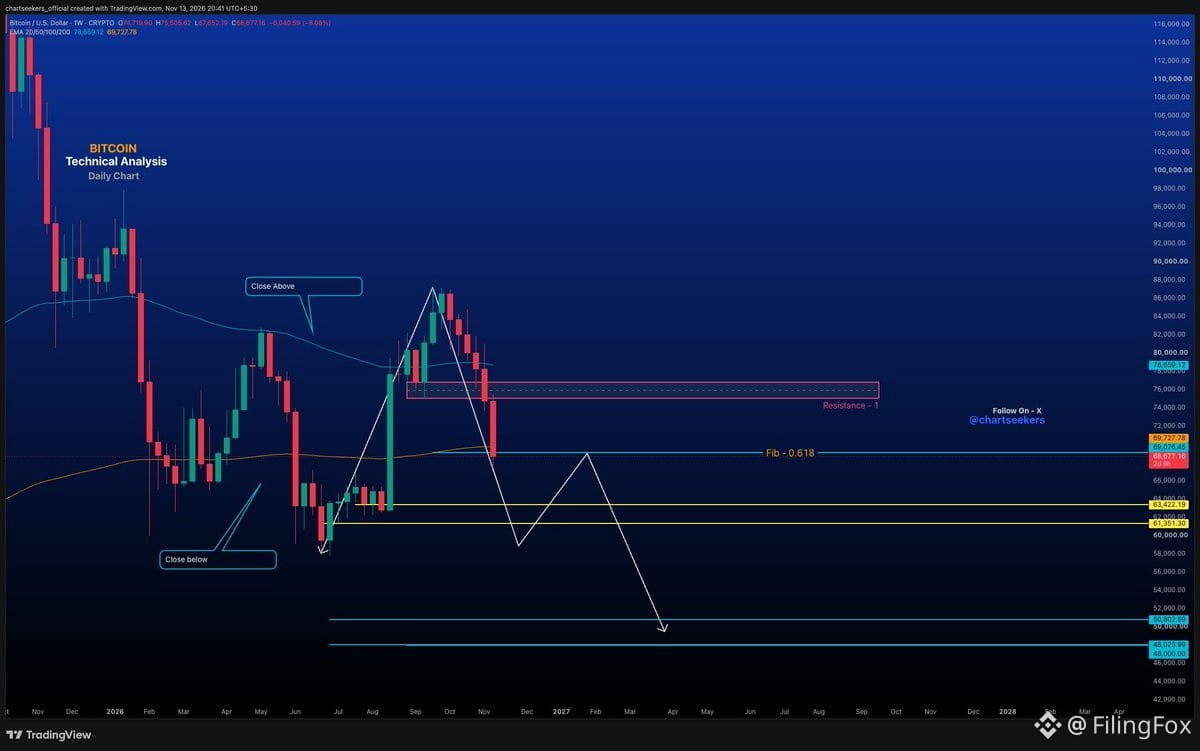
The Golden Pocket Trap?
Everyone's eyeing that Golden Pocket / cute support zone for a long entry, thinking it's a lock. But the wave structure is screaming caution — more downside could be in play.
Blindly longing every dip and DCA'ing without confirmation? That's not a strategy, that's hope.
Let the wave structure finish. Patience beats prediction every time.
This is where Elliott Wave becomes the sharpest edge in technical analysis. If you want to read market structure instead of chasing random support and resistance lines, you need to learn the waves.
$BTC isn't handing out freebies. Wait for the setup to confirm.
The Golden Pocket Trap?
Everyone's eyeing that Golden Pocket / cute support zone for a long entry, thinking it's a lock. But the wave structure is screaming caution — more downside could be in play.
Blindly longing every dip and DCA'ing without confirmation? That's not a strategy, that's hope.
Let the wave structure finish. Patience beats prediction every time.
This is where Elliott Wave becomes the sharpest edge in technical analysis. If you want to read market structure instead of chasing random support and resistance lines, you need to learn the waves.
$BTC isn't handing out freebies. Wait for the setup to confirm.
Everyone's eyeing that Golden Pocket / cute support zone for a long entry, thinking it's a lock. But the wave structure is screaming caution — more downside could be in play.
Blindly longing every dip and DCA'ing without confirmation? That's not a strategy, that's hope.
Let the wave structure finish. Patience beats prediction every time.
This is where Elliott Wave becomes the sharpest edge in technical analysis. If you want to read market structure instead of chasing random support and resistance lines, you need to learn the waves.
$BTC isn't handing out freebies. Wait for the setup to confirm.
1
572
·
--
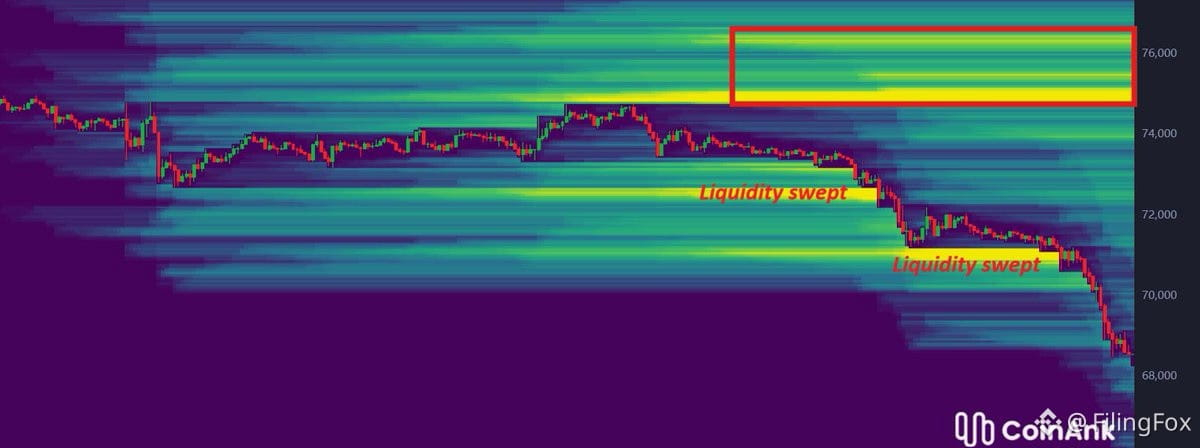
$BTC swept the last downside liquidity. What happens next depends on how aggressively leveraged longs enter here.
If they pile in and build a new liquidation cluster below, another move lower is possible. Otherwise, shorts above become the obvious target.
Maybe CZ finally recovered those $6B and is ready to flip the script—liquidating shorts instead of longs this time.
$BTC swept the last downside liquidity. What happens next depends on how aggressively leveraged longs enter here.
If they pile in and build a new liquidation cluster below, another move lower is possible. Otherwise, shorts above become the obvious target.
Maybe CZ finally recovered those $6B and is ready to flip the script—liquidating shorts instead of longs this time.
If they pile in and build a new liquidation cluster below, another move lower is possible. Otherwise, shorts above become the obvious target.
Maybe CZ finally recovered those $6B and is ready to flip the script—liquidating shorts instead of longs this time.
1
3
2.3k
·
--
$BTC godcandle loading...
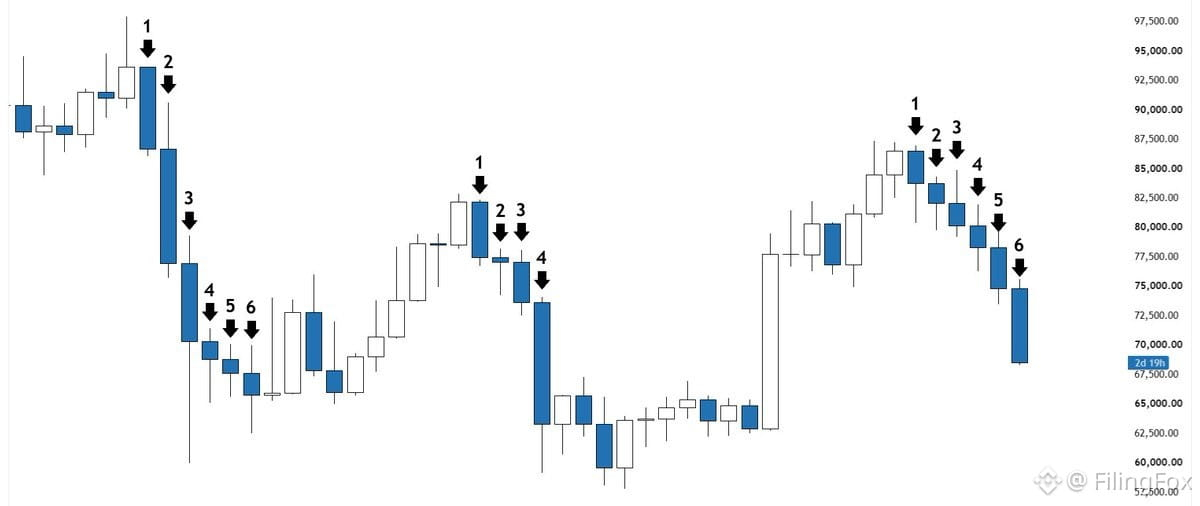
In Bitcoin's entire history, there's only been ONE instance of more than six consecutive red weekly closes — that was the 2022 bear market.
Every other time? The streak ended at six weeks max.
We're heading into our sixth red weekly close right now. Historically, we're in extremely rare territory. The odds of a relief bounce are climbing.
This is the kind of setup you watch closely. Six reds is the historical line. Seven would be an outlier. Price compression + rare streak = potential snap back.
Levels matter here. If we hold support and flip green next week, that's your signal. If we print a seventh red? Then we're in uncharted weekly structure and need to reassess.
But right now, history says relief is due. Watch for the turn.
$BTC godcandle loading...
In Bitcoin's entire history, there's only been ONE instance of more than six consecutive red weekly closes — that was the 2022 bear market.
Every other time? The streak ended at six weeks max.
We're heading into our sixth red weekly close right now. Historically, we're in extremely rare territory. The odds of a relief bounce are climbing.
This is the kind of setup you watch closely. Six reds is the historical line. Seven would be an outlier. Price compression + rare streak = potential snap back.
Levels matter here. If we hold support and flip green next week, that's your signal. If we print a seventh red? Then we're in uncharted weekly structure and need to reassess.
But right now, history says relief is due. Watch for the turn.
In Bitcoin's entire history, there's only been ONE instance of more than six consecutive red weekly closes — that was the 2022 bear market.
Every other time? The streak ended at six weeks max.
We're heading into our sixth red weekly close right now. Historically, we're in extremely rare territory. The odds of a relief bounce are climbing.
This is the kind of setup you watch closely. Six reds is the historical line. Seven would be an outlier. Price compression + rare streak = potential snap back.
Levels matter here. If we hold support and flip green next week, that's your signal. If we print a seventh red? Then we're in uncharted weekly structure and need to reassess.
But right now, history says relief is due. Watch for the turn.
1.6k
·
--
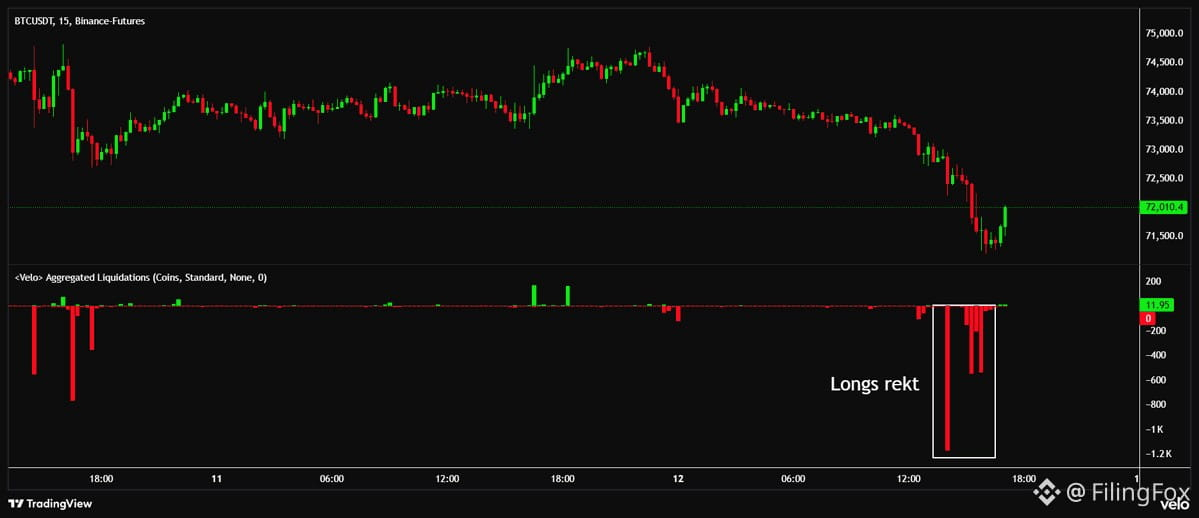
$BTC getting absolutely wrecked right now. Liquidation cascades hitting hard — inboxes filling up with margin calls while people dust off those McDonald's applications. Classic leverage flush. When you see this kind of pain, usually means we're getting close to a local bottom, but don't catch falling knives. Wait for structure to hold before jumping back in.
$BTC getting absolutely wrecked right now. Liquidation cascades hitting hard — inboxes filling up with margin calls while people dust off those McDonald's applications. Classic leverage flush. When you see this kind of pain, usually means we're getting close to a local bottom, but don't catch falling knives. Wait for structure to hold before jumping back in.
1
2
667
·
--
$BTC
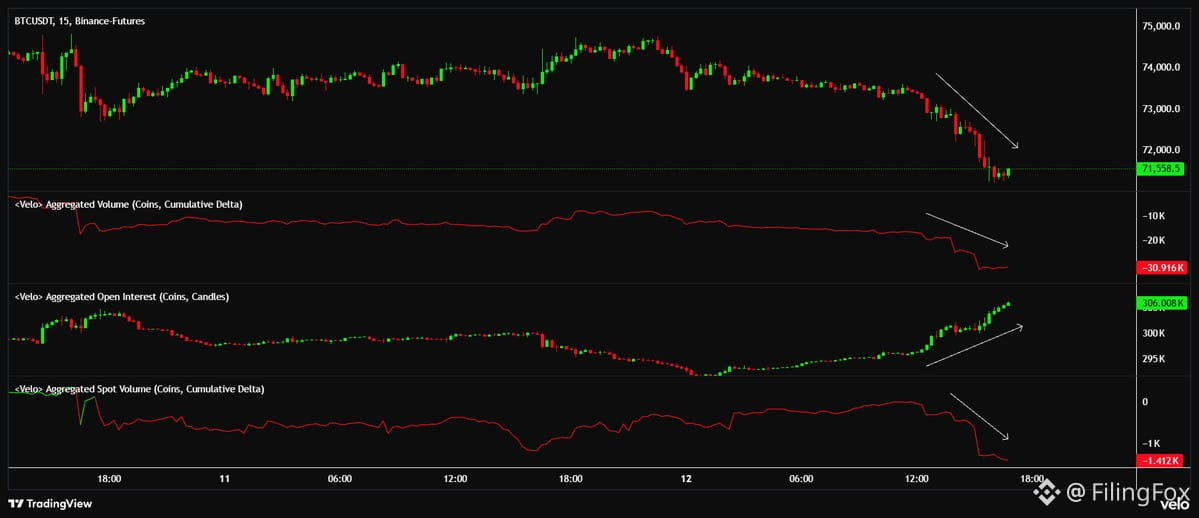
Absolute bloodbath today.
After weeks of solid spot demand, both spot and perp CVD just made new lows. Open interest spiked hard — aggressive shorts piling in.
What's worse: spot finally cracked and started selling too. Adding real downside pressure now.
No meaningful signs of strength yet. This is capitulation territory until proven otherwise.
$BTC
Absolute bloodbath today.
After weeks of solid spot demand, both spot and perp CVD just made new lows. Open interest spiked hard — aggressive shorts piling in.
What's worse: spot finally cracked and started selling too. Adding real downside pressure now.
No meaningful signs of strength yet. This is capitulation territory until proven otherwise.
Absolute bloodbath today.
After weeks of solid spot demand, both spot and perp CVD just made new lows. Open interest spiked hard — aggressive shorts piling in.
What's worse: spot finally cracked and started selling too. Adding real downside pressure now.
No meaningful signs of strength yet. This is capitulation territory until proven otherwise.
1
166
·
--
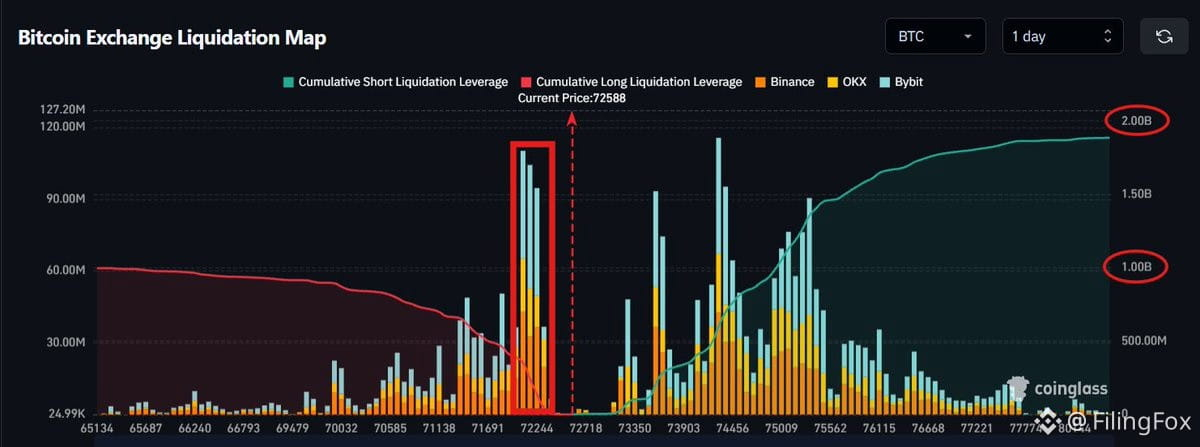
$BTC liquidation map over the past 24h shows over $2B in potential short liquidations versus just $1B in longs — that's a 2:1 ratio favoring upside.
Most downside liquidity sits just above $72K, meaning the path of least resistance could be higher if someone wants to hunt those shorts.
Given a certain entity is still down roughly $6B, you'd think they'd be eyeing that $2B short squeeze setup. The question is whether they're getting greedy or if they'll take the liquidity gift sitting above price.
Watch $72K as the floor and monitor if price starts grinding toward that short cluster. If it does, expect a violent move higher as those positions unwind.
$BTC liquidation map over the past 24h shows over $2B in potential short liquidations versus just $1B in longs — that's a 2:1 ratio favoring upside.
Most downside liquidity sits just above $72K, meaning the path of least resistance could be higher if someone wants to hunt those shorts.
Given a certain entity is still down roughly $6B, you'd think they'd be eyeing that $2B short squeeze setup. The question is whether they're getting greedy or if they'll take the liquidity gift sitting above price.
Watch $72K as the floor and monitor if price starts grinding toward that short cluster. If it does, expect a violent move higher as those positions unwind.
Most downside liquidity sits just above $72K, meaning the path of least resistance could be higher if someone wants to hunt those shorts.
Given a certain entity is still down roughly $6B, you'd think they'd be eyeing that $2B short squeeze setup. The question is whether they're getting greedy or if they'll take the liquidity gift sitting above price.
Watch $72K as the floor and monitor if price starts grinding toward that short cluster. If it does, expect a violent move higher as those positions unwind.
1
2
2.8k
Log in to explore more content
Join global crypto users on Binance Square
⚡️ Get latest and useful information about crypto.
💬 Trusted by the world’s largest crypto exchange.
👍 Discover real insights from verified creators.
Email / Phone number
Trending Topics
CryptoSelloffTriggersMultipleWhaleLiquidations
114,223 views
1,314 Discussing
Crypto Liquidations Top $2B in 24 Hours as 329,000 Traders Are Wiped Out
Binance News
·34 Likes
·38.7k views
USSpotXRPETFsSeeLargestWeeklyOutflowIn8Months
116,807 views
1,321 Discussing
WillFOMCMinutesReinforceRateHikeExpectations?
28,246 views
565 Discussing