
filetzrena
706 Posts

filetzrena
Report
Block User
KOL | Crypto News | $BTC & $BNB holder | Trader.
Open Trade
Frequent Trader
6.1 Years
12 Following
199 Followers
1.0K+ Liked
Posts
Portfolio
All
Quotes
Live
·
--
🚨 $HAEDAL /USDT — Long 📈
Entry: Market price
Leverage: 10x
Target: 0.02369
Stop-Loss: 0.01814
Risk management matters here — keep position sizing sensible and avoid shifting your stop out of emotion. Let the trade develop as planned.
🚨 $HAEDAL /USDT — Long 📈
Entry: Market price
Leverage: 10x
Target: 0.02369
Stop-Loss: 0.01814
Risk management matters here — keep position sizing sensible and avoid shifting your stop out of emotion. Let the trade develop as planned.
Entry: Market price
Leverage: 10x
Target: 0.02369
Stop-Loss: 0.01814
Risk management matters here — keep position sizing sensible and avoid shifting your stop out of emotion. Let the trade develop as planned.
1
133
·
--
📊 Trade Setup
Pair: $ZRX /USDT
Bias: Short
Leverage: Cross 20x
Entry Zone: 0.1069 – 0.1081
Target 1: 0.1048
Target 2: 0.1034
Target 3: 0.1013
Stop-Loss: 0.1120
📊 Trade Setup
Pair: $ZRX /USDT
Bias: Short
Leverage: Cross 20x
Entry Zone: 0.1069 – 0.1081
Target 1: 0.1048
Target 2: 0.1034
Target 3: 0.1013
Stop-Loss: 0.1120
Pair: $ZRX /USDT
Bias: Short
Leverage: Cross 20x
Entry Zone: 0.1069 – 0.1081
Target 1: 0.1048
Target 2: 0.1034
Target 3: 0.1013
Stop-Loss: 0.1120
1
176
·
--
Bullish
$SPK /USDT—LONG
ENTRY :0.02304
TP1 :0.02638
TP2:0.03070
TP3:0.3850
SL:0.01913
LEV: 20X
NOT A FINANCIAL ADVICE.
$SPK /USDT—LONG
ENTRY :0.02304
TP1 :0.02638
TP2:0.03070
TP3:0.3850
SL:0.01913
LEV: 20X
NOT A FINANCIAL ADVICE.
ENTRY :0.02304
TP1 :0.02638
TP2:0.03070
TP3:0.3850
SL:0.01913
LEV: 20X
NOT A FINANCIAL ADVICE.
65
·
--
Bearish
$OP /USDT—SHORT
ENTRY :0.10919
TP1 :0.10753
TP2:0.10449
TP3:0.10432
SL:0.1126
LEV: 20X
NOT A FINANCIAL ADVICE.
$OP /USDT—SHORT
ENTRY :0.10919
TP1 :0.10753
TP2:0.10449
TP3:0.10432
SL:0.1126
LEV: 20X
NOT A FINANCIAL ADVICE.
ENTRY :0.10919
TP1 :0.10753
TP2:0.10449
TP3:0.10432
SL:0.1126
LEV: 20X
NOT A FINANCIAL ADVICE.
1
72
·
--
Bullish
$COTI /USDT—LONG
ENTRY :0.020975
TP1 :0.02904
TP2:0.04235
TP3:0.063106
SL:0.015482
LEV: 20X
NOT A FINANCIAL ADVICE.
$COTI /USDT—LONG
ENTRY :0.020975
TP1 :0.02904
TP2:0.04235
TP3:0.063106
SL:0.015482
LEV: 20X
NOT A FINANCIAL ADVICE.
ENTRY :0.020975
TP1 :0.02904
TP2:0.04235
TP3:0.063106
SL:0.015482
LEV: 20X
NOT A FINANCIAL ADVICE.
82
·
--
Bullish
$IOST /USDT—LONG
ENTRY :0.007611
TP1 :0.0008628
TP2:0.0009786
TP3:0.00109
SL:0.0006291
LEV: 20X
NOT A FINANCIAL ADVICE.
$IOST /USDT—LONG
ENTRY :0.007611
TP1 :0.0008628
TP2:0.0009786
TP3:0.00109
SL:0.0006291
LEV: 20X
NOT A FINANCIAL ADVICE.
ENTRY :0.007611
TP1 :0.0008628
TP2:0.0009786
TP3:0.00109
SL:0.0006291
LEV: 20X
NOT A FINANCIAL ADVICE.
13
·
--
Bullish
$EPIC /USDT—LONG
ENTRY :0.4692
TP1 :0.5266
TP2:0.5880
TP3:0.7082
SL:0.3509
LEV: 20X
NOT A FINANCIAL ADVICE.
$EPIC /USDT—LONG
ENTRY :0.4692
TP1 :0.5266
TP2:0.5880
TP3:0.7082
SL:0.3509
LEV: 20X
NOT A FINANCIAL ADVICE.
ENTRY :0.4692
TP1 :0.5266
TP2:0.5880
TP3:0.7082
SL:0.3509
LEV: 20X
NOT A FINANCIAL ADVICE.
221
·
--
Bullish
I’m not sure anyone survived that candle on $AKE 😭💔
I’m not sure anyone survived that candle on $AKE 😭💔
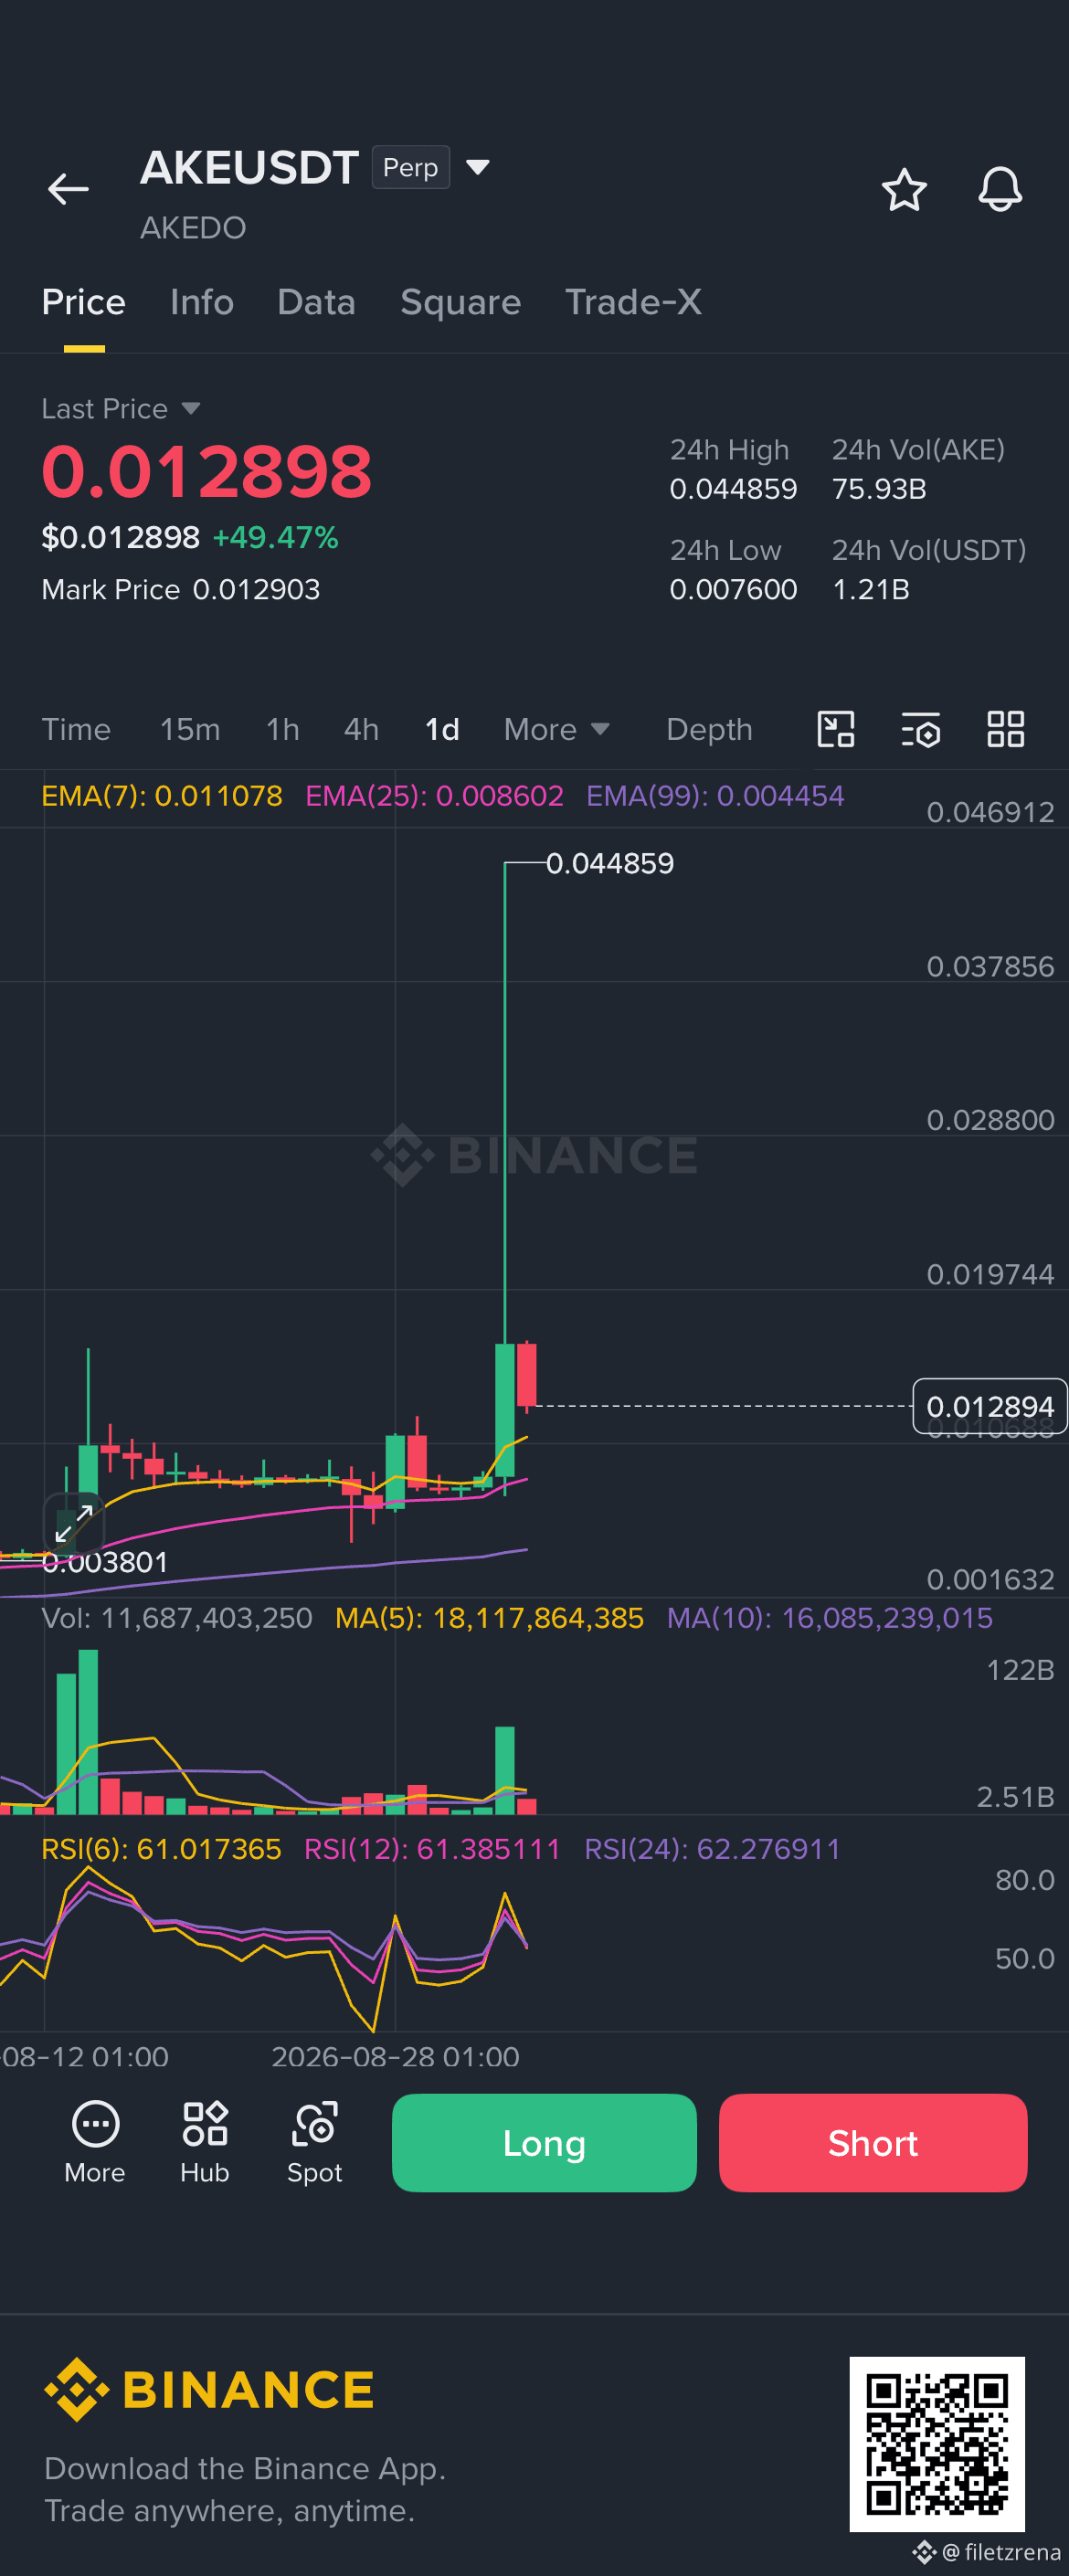
Sourced by user sharing on Binance
1
88
·
--
Bullish
if i were you, i would stop trading $AKE the manipulation is at it peak on that coin. you can easily loose your money trading that scam token. stay safe
if i were you, i would stop trading $AKE the manipulation is at it peak on that coin. you can easily loose your money trading that scam token. stay safe
1
85
·
--
$115M in longs got wiped out in under an hour, and it wasn't algos being dramatic; it was real geopolitics. #CryptoMarket
$115M in longs got wiped out in under an hour, and it wasn't algos being dramatic; it was real geopolitics. #CryptoMarket
1
11
·
--
This isn't Bitcoin's first Iran shock this year, and the scoreboard so far reads decisively one way.
Back in April, $BTC dipped to $70,741 on a Hormuz blockade scare and ripped straight back to $75,000 within the same session. In late July, a heavier strike wave liquidated $286 million and BTC barely blinked near $63,900 while the Dow dropped 2.2%. Now it's happened again, $115 million wiped in an hour as fresh US strikes hit Tuesday, and the low printed was $76,229. Bitcoin didn't even touch $75,000, let alone $70,000.
That's the pattern worth actually naming: each Iran headline this year has produced a sharp one-hour liquidation spike, then a stabilisation within hours, not a sustained breakdown.
The technicals back that read. BTC's 50, 100, and 200-day averages are clustered between $69,221 and $72,397 right now. Getting to $70K doesn't mean losing a round number, it means breaking through three stacked trend lines that have held all year. That's a structural event, not a headline reaction.
What's actually worth watching instead: Wintermute moved 5,100 BTC to Binance and a whale deposited over 41,000 $ETH to exchanges during the selloff. Exchange deposits like that can mean incoming selling, and that's real positioning risk sitting underneath the geopolitical noise.
So, hold or hit $70K? History and the chart both say $75K holds unless this escalates into something genuinely bigger than another round of strikes. Watch the exchange flows, not the headlines, for the real tell.
This isn't Bitcoin's first Iran shock this year, and the scoreboard so far reads decisively one way.
Back in April, $BTC dipped to $70,741 on a Hormuz blockade scare and ripped straight back to $75,000 within the same session. In late July, a heavier strike wave liquidated $286 million and BTC barely blinked near $63,900 while the Dow dropped 2.2%. Now it's happened again, $115 million wiped in an hour as fresh US strikes hit Tuesday, and the low printed was $76,229. Bitcoin didn't even touch $75,000, let alone $70,000.
That's the pattern worth actually naming: each Iran headline this year has produced a sharp one-hour liquidation spike, then a stabilisation within hours, not a sustained breakdown.
The technicals back that read. BTC's 50, 100, and 200-day averages are clustered between $69,221 and $72,397 right now. Getting to $70K doesn't mean losing a round number, it means breaking through three stacked trend lines that have held all year. That's a structural event, not a headline reaction.
What's actually worth watching instead: Wintermute moved 5,100 BTC to Binance and a whale deposited over 41,000 $ETH to exchanges during the selloff. Exchange deposits like that can mean incoming selling, and that's real positioning risk sitting underneath the geopolitical noise.
So, hold or hit $70K? History and the chart both say $75K holds unless this escalates into something genuinely bigger than another round of strikes. Watch the exchange flows, not the headlines, for the real tell.
Back in April, $BTC dipped to $70,741 on a Hormuz blockade scare and ripped straight back to $75,000 within the same session. In late July, a heavier strike wave liquidated $286 million and BTC barely blinked near $63,900 while the Dow dropped 2.2%. Now it's happened again, $115 million wiped in an hour as fresh US strikes hit Tuesday, and the low printed was $76,229. Bitcoin didn't even touch $75,000, let alone $70,000.
That's the pattern worth actually naming: each Iran headline this year has produced a sharp one-hour liquidation spike, then a stabilisation within hours, not a sustained breakdown.
The technicals back that read. BTC's 50, 100, and 200-day averages are clustered between $69,221 and $72,397 right now. Getting to $70K doesn't mean losing a round number, it means breaking through three stacked trend lines that have held all year. That's a structural event, not a headline reaction.
What's actually worth watching instead: Wintermute moved 5,100 BTC to Binance and a whale deposited over 41,000 $ETH to exchanges during the selloff. Exchange deposits like that can mean incoming selling, and that's real positioning risk sitting underneath the geopolitical noise.
So, hold or hit $70K? History and the chart both say $75K holds unless this escalates into something genuinely bigger than another round of strikes. Watch the exchange flows, not the headlines, for the real tell.
1
9
·
--
Bearish
#MarketSentimentToday i'm bearish on the market right now
#MarketSentimentToday i'm bearish on the market right now
1
13
·
--
Bearish
I saw what was going to happen to $TUT , i'm still bearish on it.
I saw what was going to happen to $TUT , i'm still bearish on it.
filetzrena
·
--
Bearish$TUT /USDT—SHORT
ENTRY :0.03577
TP1 :0.03289
TP2:0.03026
TP3:0.02770
SL:0.3896
LEV: 20X
NOT A FINANCIAL ADVICE.
ENTRY :0.03577
TP1 :0.03289
TP2:0.03026
TP3:0.02770
SL:0.3896
LEV: 20X
NOT A FINANCIAL ADVICE.
2
146
·
--
Bullish
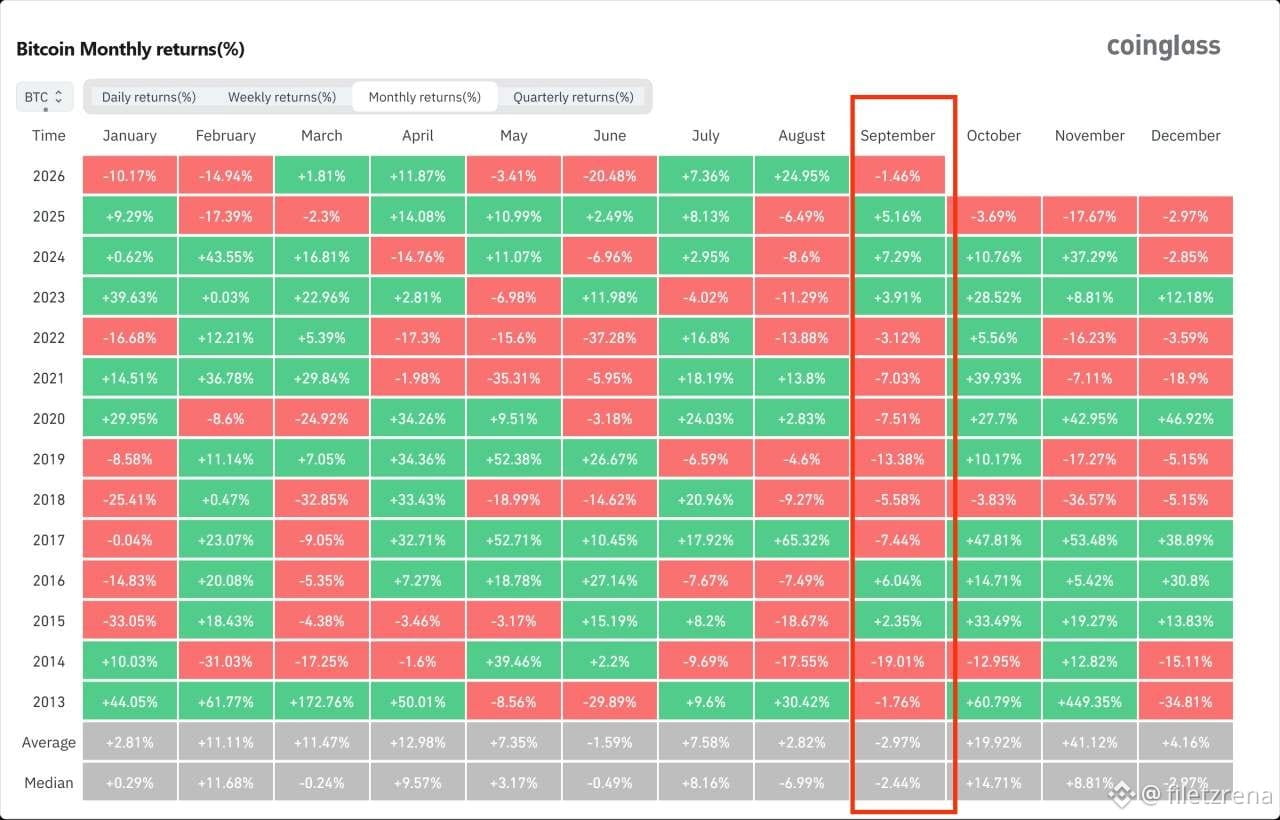
September Has Historically Been Bitcoin’s Weakest Month
Since 2013, $BTC has ended September lower in 8 out of 13 years, with an average monthly return of -2.97%. No other month has performed worse on average, June comes next at -1.59%.
However, Bitcoin managed to break this trend over the past three years, with September closing higher in 2023, 2024, and 2025.
So far, 2026 is following the historical pattern. Since the start of September, $BTC is down around 1.46%
#BTCPriceForecast
September Has Historically Been Bitcoin’s Weakest Month
Since 2013, $BTC has ended September lower in 8 out of 13 years, with an average monthly return of -2.97%. No other month has performed worse on average, June comes next at -1.59%.
However, Bitcoin managed to break this trend over the past three years, with September closing higher in 2023, 2024, and 2025.
So far, 2026 is following the historical pattern. Since the start of September, $BTC is down around 1.46%
#BTCPriceForecast
Since 2013, $BTC has ended September lower in 8 out of 13 years, with an average monthly return of -2.97%. No other month has performed worse on average, June comes next at -1.59%.
However, Bitcoin managed to break this trend over the past three years, with September closing higher in 2023, 2024, and 2025.
So far, 2026 is following the historical pattern. Since the start of September, $BTC is down around 1.46%
#BTCPriceForecast
1
33
·
--
Bullish
Money Is Pouring Into Crypto and Gold at the Same Time. Why?
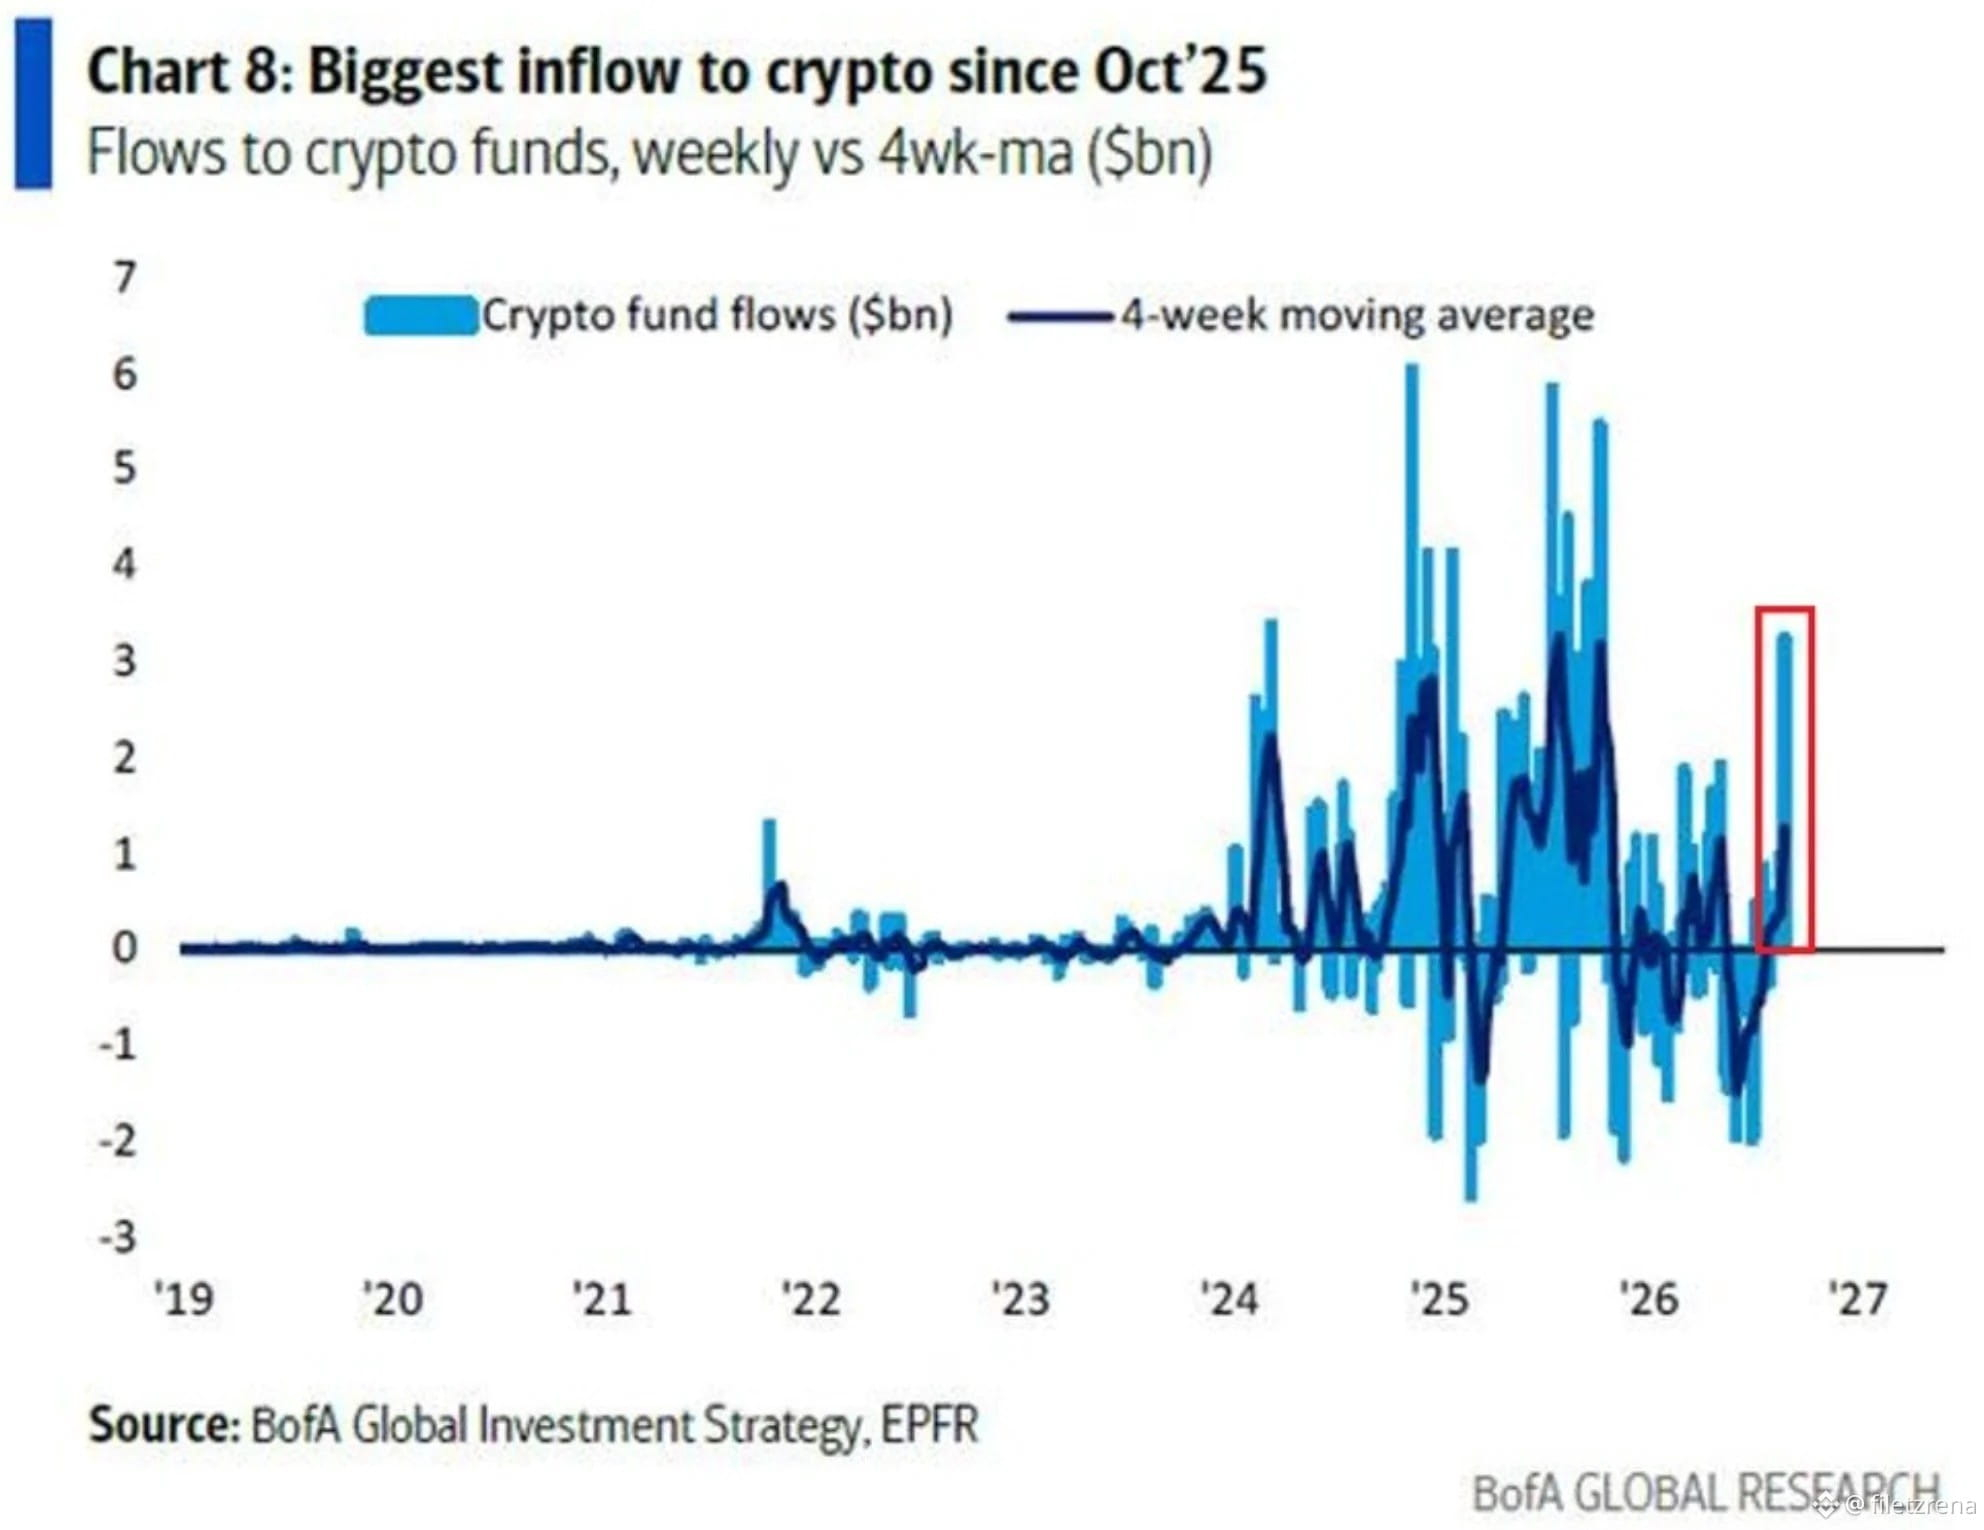
Here's a detail from the flow data that says more than any price chart. Investors are piling into crypto funds and gold funds simultaneously, $3.2 billion into crypto last week, the biggest since October 2025, right as gold demand runs hot too. Normally these two compete for the same "distrust the system" dollar. Right now they're both winning.
That tells you what people are actually positioning against. Not a specific asset call, but the macro backdrop itself, ballooning deficits, sticky inflation, a Fed that can't ease. When capital hedges into both digital and physical hard assets at once, it's voting against fiat, not for a token.
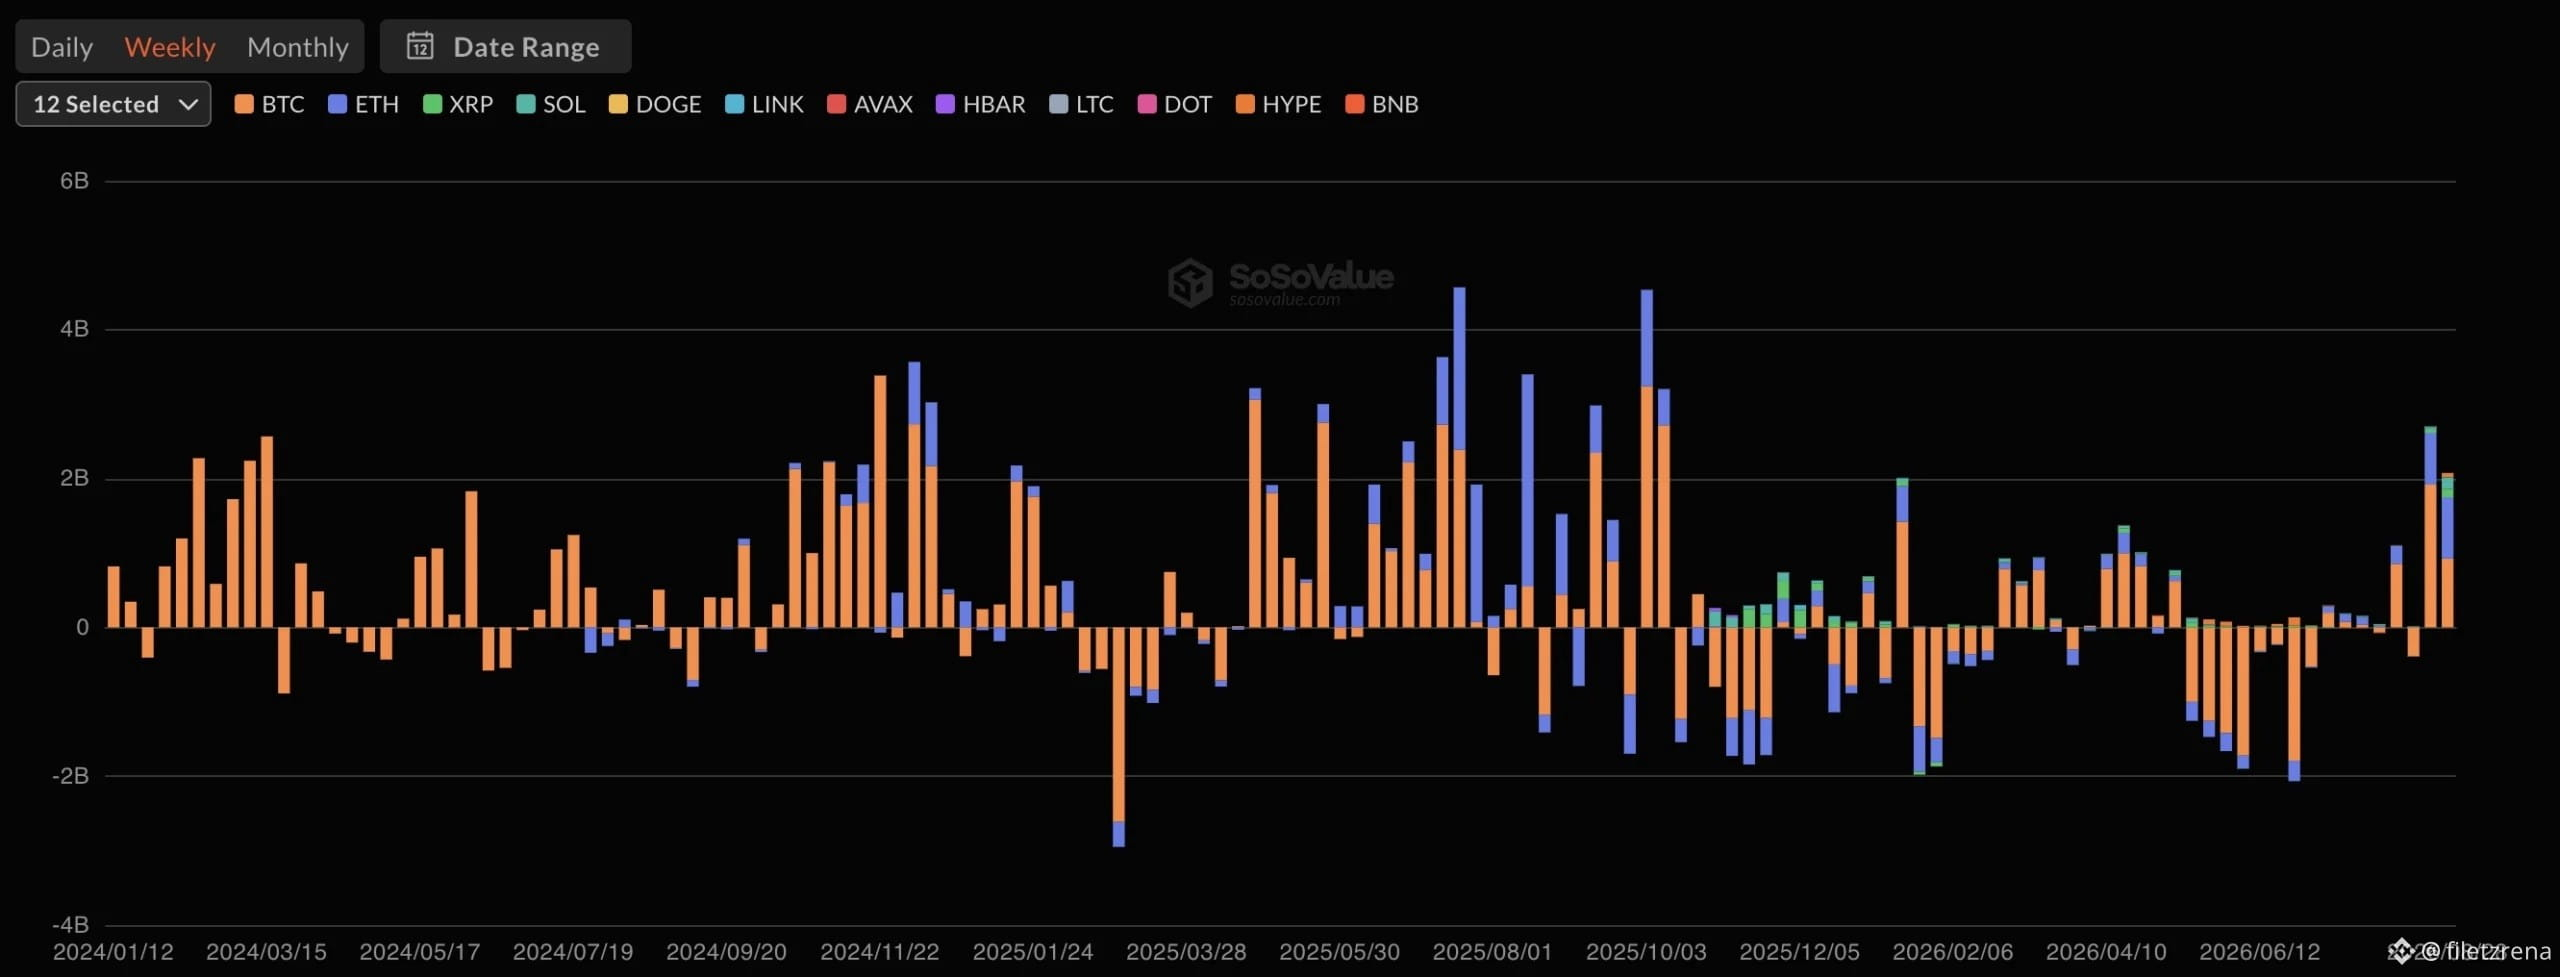
Inside the crypto bucket, the nuance is that the bid rotated rather than reversed. Bitcoin ETFs cooled slightly while ETH, SOL and even $XRP funds extended streaks. As Scott Melker put it, the money moved, it didn't leave. Investors are broadening across the space, not exiting it.
So two things are true at once: demand for hard assets is rising, and within crypto it's spreading past Bitcoin. Both point the same direction. The macro fear driving gold is quietly driving this too.
#Ripple #Altcoin
Money Is Pouring Into Crypto and Gold at the Same Time. Why?
Here's a detail from the flow data that says more than any price chart. Investors are piling into crypto funds and gold funds simultaneously, $3.2 billion into crypto last week, the biggest since October 2025, right as gold demand runs hot too. Normally these two compete for the same "distrust the system" dollar. Right now they're both winning.
That tells you what people are actually positioning against. Not a specific asset call, but the macro backdrop itself, ballooning deficits, sticky inflation, a Fed that can't ease. When capital hedges into both digital and physical hard assets at once, it's voting against fiat, not for a token.
Inside the crypto bucket, the nuance is that the bid rotated rather than reversed. Bitcoin ETFs cooled slightly while ETH, SOL and even $XRP funds extended streaks. As Scott Melker put it, the money moved, it didn't leave. Investors are broadening across the space, not exiting it.
So two things are true at once: demand for hard assets is rising, and within crypto it's spreading past Bitcoin. Both point the same direction. The macro fear driving gold is quietly driving this too.
#Ripple #Altcoin
Here's a detail from the flow data that says more than any price chart. Investors are piling into crypto funds and gold funds simultaneously, $3.2 billion into crypto last week, the biggest since October 2025, right as gold demand runs hot too. Normally these two compete for the same "distrust the system" dollar. Right now they're both winning.
That tells you what people are actually positioning against. Not a specific asset call, but the macro backdrop itself, ballooning deficits, sticky inflation, a Fed that can't ease. When capital hedges into both digital and physical hard assets at once, it's voting against fiat, not for a token.
Inside the crypto bucket, the nuance is that the bid rotated rather than reversed. Bitcoin ETFs cooled slightly while ETH, SOL and even $XRP funds extended streaks. As Scott Melker put it, the money moved, it didn't leave. Investors are broadening across the space, not exiting it.
So two things are true at once: demand for hard assets is rising, and within crypto it's spreading past Bitcoin. Both point the same direction. The macro fear driving gold is quietly driving this too.
#Ripple #Altcoin
1
43
·
--
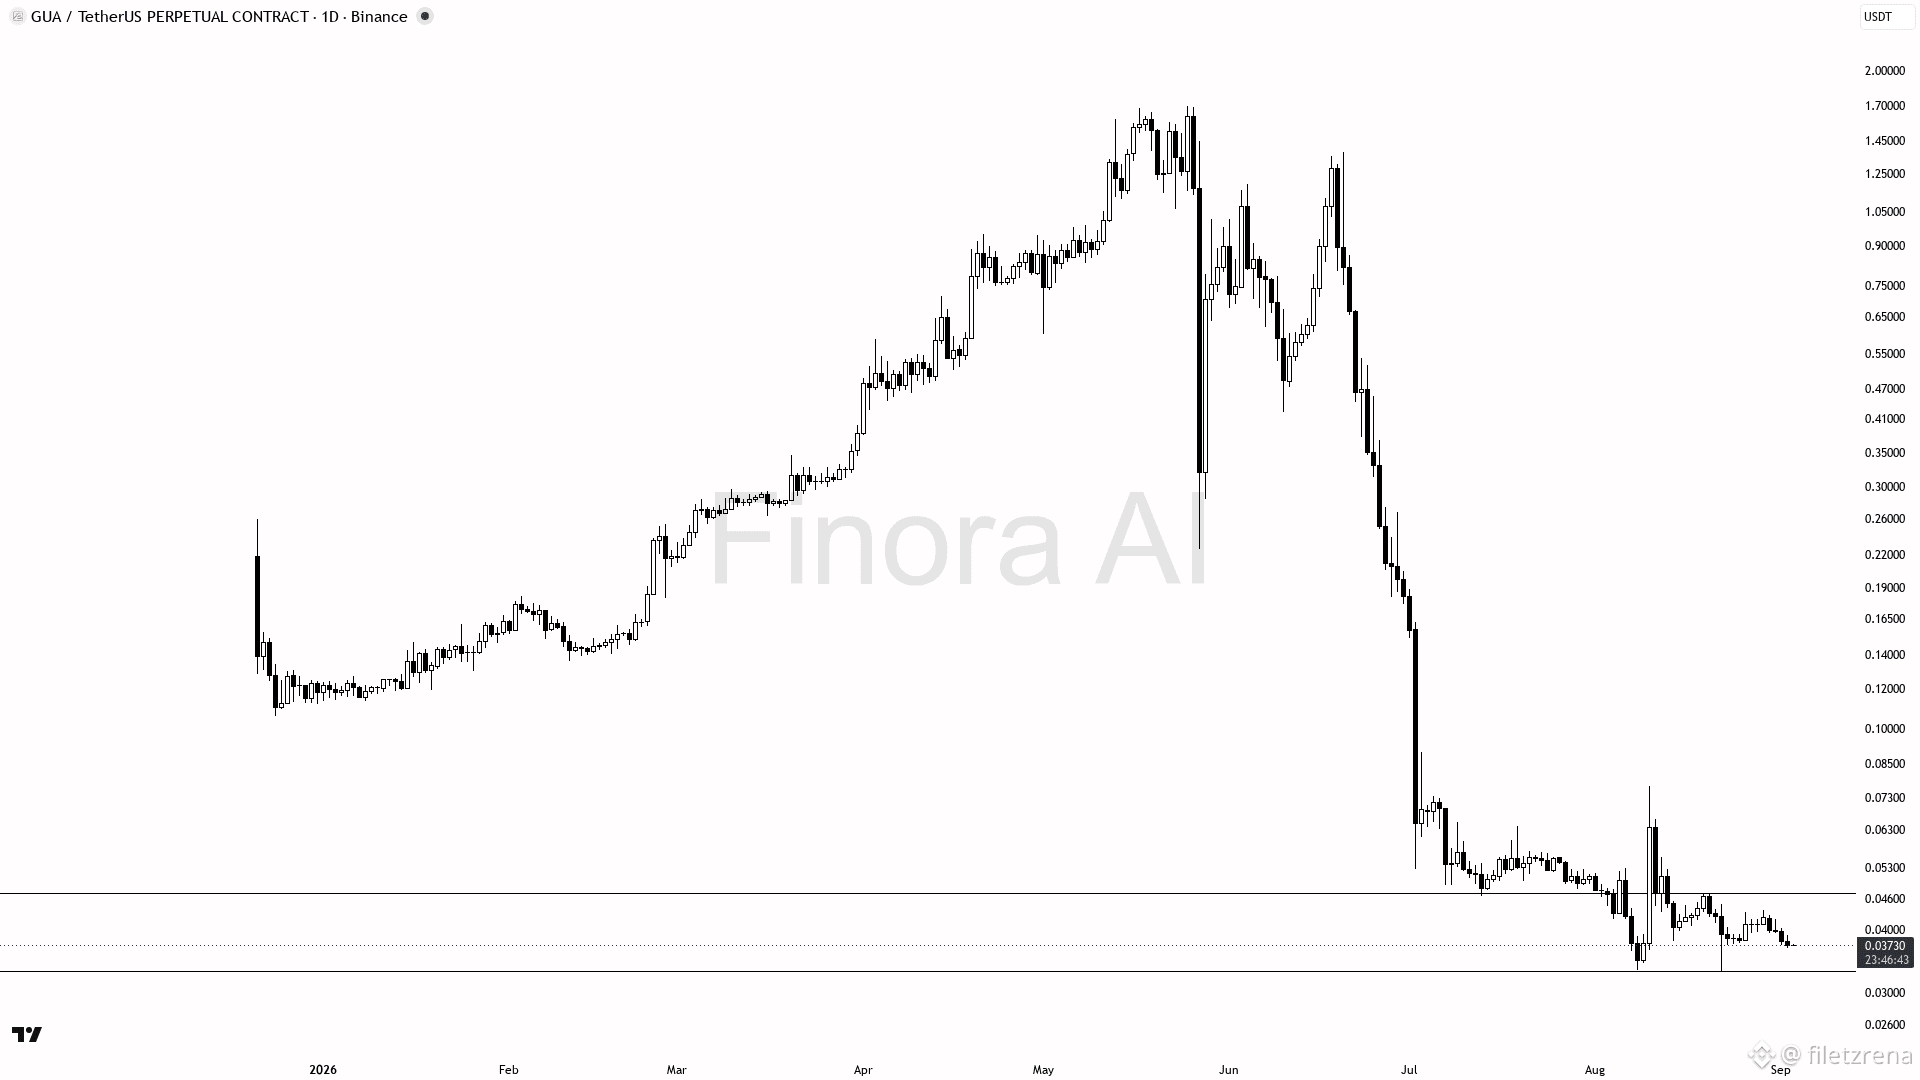
$GUA (1D): BEARISH TREND CONFIRMED
My base forecast is a bearish trend on the daily timeframe, confirmed by structure with downward movement and the last lower low at 0.03318. Current price 0.03730 is below the last local high 0.04379, keeping sellers in control. Weekly trend is neutral, BTC is bullish — this may allow short-term corrections, but overall bias remains bearish. Short entry is advisable on a retest of resistance zone around 0.0435–0.0440 with weakness confirmation — for example, a candlestick reversal or rejection from liquidity zone. Profit targets are first 0.0332 (last local low), then deeper support at 0.0219 and 0.0168. For additional confirmation, watch for rising sell volume and RSI staying below 40, indicating continuation of the downtrend. The bearish scenario is invalidated on a close above 0.04379 — this flips structure bullish and cancels the short bias.
$GUA (1D): BEARISH TREND CONFIRMED
My base forecast is a bearish trend on the daily timeframe, confirmed by structure with downward movement and the last lower low at 0.03318. Current price 0.03730 is below the last local high 0.04379, keeping sellers in control. Weekly trend is neutral, BTC is bullish — this may allow short-term corrections, but overall bias remains bearish. Short entry is advisable on a retest of resistance zone around 0.0435–0.0440 with weakness confirmation — for example, a candlestick reversal or rejection from liquidity zone. Profit targets are first 0.0332 (last local low), then deeper support at 0.0219 and 0.0168. For additional confirmation, watch for rising sell volume and RSI staying below 40, indicating continuation of the downtrend. The bearish scenario is invalidated on a close above 0.04379 — this flips structure bullish and cancels the short bias.
My base forecast is a bearish trend on the daily timeframe, confirmed by structure with downward movement and the last lower low at 0.03318. Current price 0.03730 is below the last local high 0.04379, keeping sellers in control. Weekly trend is neutral, BTC is bullish — this may allow short-term corrections, but overall bias remains bearish. Short entry is advisable on a retest of resistance zone around 0.0435–0.0440 with weakness confirmation — for example, a candlestick reversal or rejection from liquidity zone. Profit targets are first 0.0332 (last local low), then deeper support at 0.0219 and 0.0168. For additional confirmation, watch for rising sell volume and RSI staying below 40, indicating continuation of the downtrend. The bearish scenario is invalidated on a close above 0.04379 — this flips structure bullish and cancels the short bias.
1
357
·
--
$21K Turned Into $8M — On Paper
A trader turned roughly $21,000 into more than $8M in unrealized gains after accumulating 29M AI tokens over two months, a return of about 38,154%. The move came during a broader crypto rebound led by renewed strength in $BTC .
But there is an important catch: the trader also became the token’s largest holder.
That makes the $8M headline very different from $8M in realized profit. Exiting a position that large can eat through available bids, increase slippage and push the execution price below the quoted market price. The thinner the order book, the harder it becomes to turn paper gains into cash.
This is where liquidity matters more than headline PnL. WhiteBIT’s Market Making Program supports 900+ trading pairs and offers maker rebates of up to -0.012%, helping create more efficient execution conditions for active markets.
A 380x position is impressive. How much of it can actually be sold near the current price is the more important question.
$21K Turned Into $8M — On Paper
A trader turned roughly $21,000 into more than $8M in unrealized gains after accumulating 29M AI tokens over two months, a return of about 38,154%. The move came during a broader crypto rebound led by renewed strength in $BTC .
But there is an important catch: the trader also became the token’s largest holder.
That makes the $8M headline very different from $8M in realized profit. Exiting a position that large can eat through available bids, increase slippage and push the execution price below the quoted market price. The thinner the order book, the harder it becomes to turn paper gains into cash.
This is where liquidity matters more than headline PnL. WhiteBIT’s Market Making Program supports 900+ trading pairs and offers maker rebates of up to -0.012%, helping create more efficient execution conditions for active markets.
A 380x position is impressive. How much of it can actually be sold near the current price is the more important question.
A trader turned roughly $21,000 into more than $8M in unrealized gains after accumulating 29M AI tokens over two months, a return of about 38,154%. The move came during a broader crypto rebound led by renewed strength in $BTC .
But there is an important catch: the trader also became the token’s largest holder.
That makes the $8M headline very different from $8M in realized profit. Exiting a position that large can eat through available bids, increase slippage and push the execution price below the quoted market price. The thinner the order book, the harder it becomes to turn paper gains into cash.
This is where liquidity matters more than headline PnL. WhiteBIT’s Market Making Program supports 900+ trading pairs and offers maker rebates of up to -0.012%, helping create more efficient execution conditions for active markets.
A 380x position is impressive. How much of it can actually be sold near the current price is the more important question.
1
50
·
--
What’s Keeping $BTC Below $80K Right Now?
Bitcoin is holding around $77K after closing August +24.95%, and right now several forces are pulling the market in different directions:
🔹 ETF demand: US spot Bitcoin ETFs took in $3.52B in August, their strongest month of 2026. But September opened with a $236M outflow, so that support hasn’t carried over cleanly yet.
🔹 The Fed: after Kevin Warsh’s hawkish Jackson Hole speech, markets are pricing roughly a 60-65% chance of a September rate hike. Jobs data and CPI are now the obvious macro checkpoints.
🔹 Geopolitics: renewed US-Iran tensions pushed oil back above $90, adding another inflation variable - although BTC has held up surprisingly well compared with stocks.
🔹 The chart: $BTC is still above its daily Bollinger mid-band around $73.9K, but recent attempts around $80-81K have been rejected.
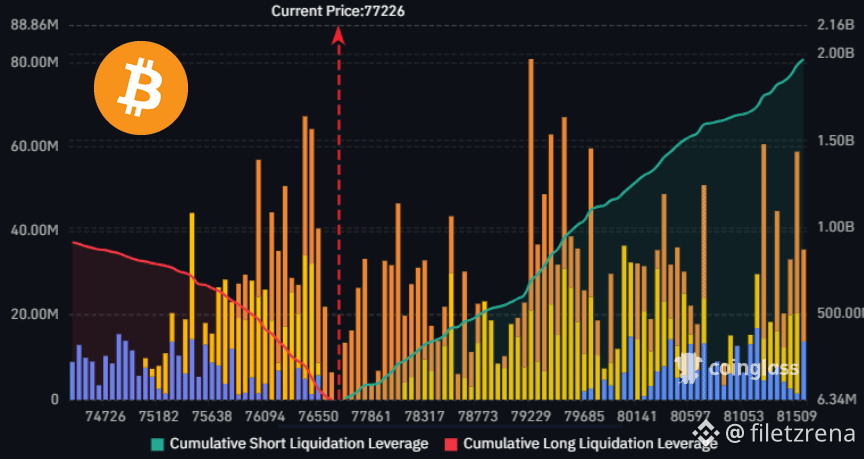
And this is where things get interesting: the liquidation map shows roughly $1.2B in cumulative short liquidation leverage up toward $80K. That isn’t $1.2B already liquidated - rather potential forced buying if BTC actually gets there.
📊 So if $80K finally breaks, the move above it could get much faster.
What’s Keeping $BTC Below $80K Right Now?
Bitcoin is holding around $77K after closing August +24.95%, and right now several forces are pulling the market in different directions:
🔹 ETF demand: US spot Bitcoin ETFs took in $3.52B in August, their strongest month of 2026. But September opened with a $236M outflow, so that support hasn’t carried over cleanly yet.
🔹 The Fed: after Kevin Warsh’s hawkish Jackson Hole speech, markets are pricing roughly a 60-65% chance of a September rate hike. Jobs data and CPI are now the obvious macro checkpoints.
🔹 Geopolitics: renewed US-Iran tensions pushed oil back above $90, adding another inflation variable - although BTC has held up surprisingly well compared with stocks.
🔹 The chart: $BTC is still above its daily Bollinger mid-band around $73.9K, but recent attempts around $80-81K have been rejected.
And this is where things get interesting: the liquidation map shows roughly $1.2B in cumulative short liquidation leverage up toward $80K. That isn’t $1.2B already liquidated - rather potential forced buying if BTC actually gets there.
📊 So if $80K finally breaks, the move above it could get much faster.
Bitcoin is holding around $77K after closing August +24.95%, and right now several forces are pulling the market in different directions:
🔹 ETF demand: US spot Bitcoin ETFs took in $3.52B in August, their strongest month of 2026. But September opened with a $236M outflow, so that support hasn’t carried over cleanly yet.
🔹 The Fed: after Kevin Warsh’s hawkish Jackson Hole speech, markets are pricing roughly a 60-65% chance of a September rate hike. Jobs data and CPI are now the obvious macro checkpoints.
🔹 Geopolitics: renewed US-Iran tensions pushed oil back above $90, adding another inflation variable - although BTC has held up surprisingly well compared with stocks.
🔹 The chart: $BTC is still above its daily Bollinger mid-band around $73.9K, but recent attempts around $80-81K have been rejected.
And this is where things get interesting: the liquidation map shows roughly $1.2B in cumulative short liquidation leverage up toward $80K. That isn’t $1.2B already liquidated - rather potential forced buying if BTC actually gets there.
📊 So if $80K finally breaks, the move above it could get much faster.
1
77
·
--
all profit taken.$UAI
all profit taken.$UAI
filetzrena
·
--
Bullish$UAI /USDT—LONG
ENTRY :0.3828
TP1 :0.4242
TP2:0.4777
TP3:0.5526
SL:0.3414
LEV: 20X
NOT A FINANCIAL ADVICE.
ENTRY :0.3828
TP1 :0.4242
TP2:0.4777
TP3:0.5526
SL:0.3414
LEV: 20X
NOT A FINANCIAL ADVICE.
2
105
·
--
you should be on profit if you took this trade $ETH
you should be on profit if you took this trade $ETH
filetzrena
·
--
Bearish$ETH /USDT—SHORT
ENTRY :2,478
TP1 :2,443
TP2:2,416
TP3:2,303
SL:2,590
LEV: 20X
NOT A FINANCIAL ADVICE.
ENTRY :2,478
TP1 :2,443
TP2:2,416
TP3:2,303
SL:2,590
LEV: 20X
NOT A FINANCIAL ADVICE.
15
Log in to explore more content
Join global crypto users on Binance Square
⚡️ Get latest and useful information about crypto.
💬 Trusted by the world’s largest crypto exchange.
👍 Discover real insights from verified creators.
Email / Phone number
Trending Topics
BitcoinReboundsTo$79K
9,733 views
101 Discussing
🚨 $BTC is pushing higher.
Bitcoin is trading around $78,804, up roughly 1.9%, after reclaiming the $78K area. The next level to watch is the intraday high near $78,905.
A clean break above that level could open the way toward $79K–$80K. If BTC gets rejected, support sits around $78,300, then $77,975.
Bulls have momentum, but BTC needs to hold above $78K.
#Bitcoin #BTC #CryptoTrading #CryptoMarket #CryptoAnalysis
PulseON
·11 Likes
·10.4k views
GrayscalePutsXRPAt26.11%InAdvisorPortfolio
756 views
64 Discussing
PhiladelphiaSemiconductorIndexFalls5.9%
759 views
43 Discussing