
Femifire
1.5k Posts

Femifire
Crypto Evangelist | Blockchain Believer | KOL | Moderator | Community Builder | BTC Analyst | Digital Asset Investor | Trader.
15 Following
1.9K+ Followers
2.9K+ Liked
Posts
All
Quotes
PINNED
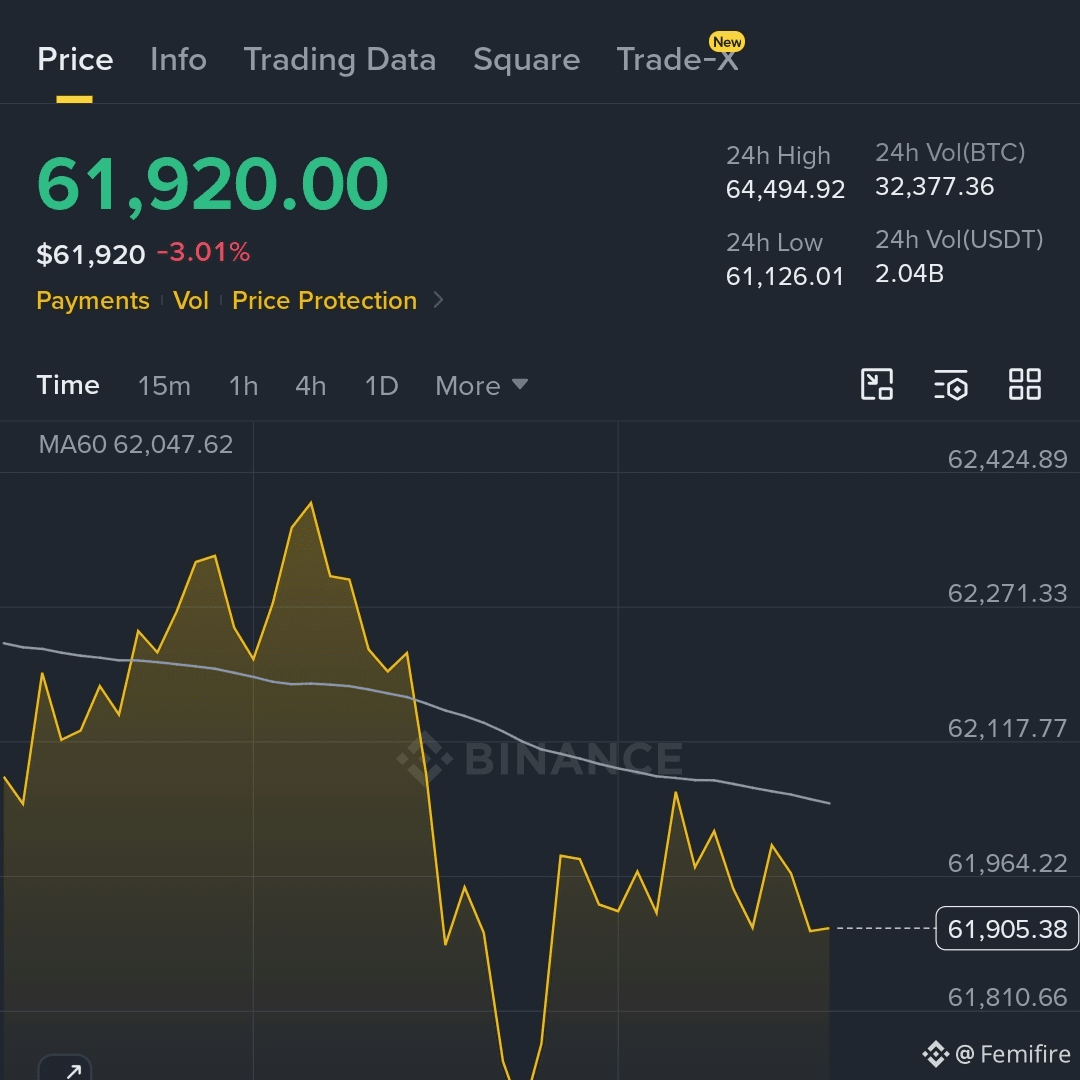
The recent drop in Bitcoin cleared out most of the liquidity underneath. April saw a slow climb upward, followed by a sharp sell-off now.
The main liquidity zone above is around $83K, just above the recent highs. Below, the $60K area, the local bottom still holds a significant amount of liquidity and stop orders.
The main liquidity zone above is around $83K, just above the recent highs. Below, the $60K area, the local bottom still holds a significant amount of liquidity and stop orders.
PINNED

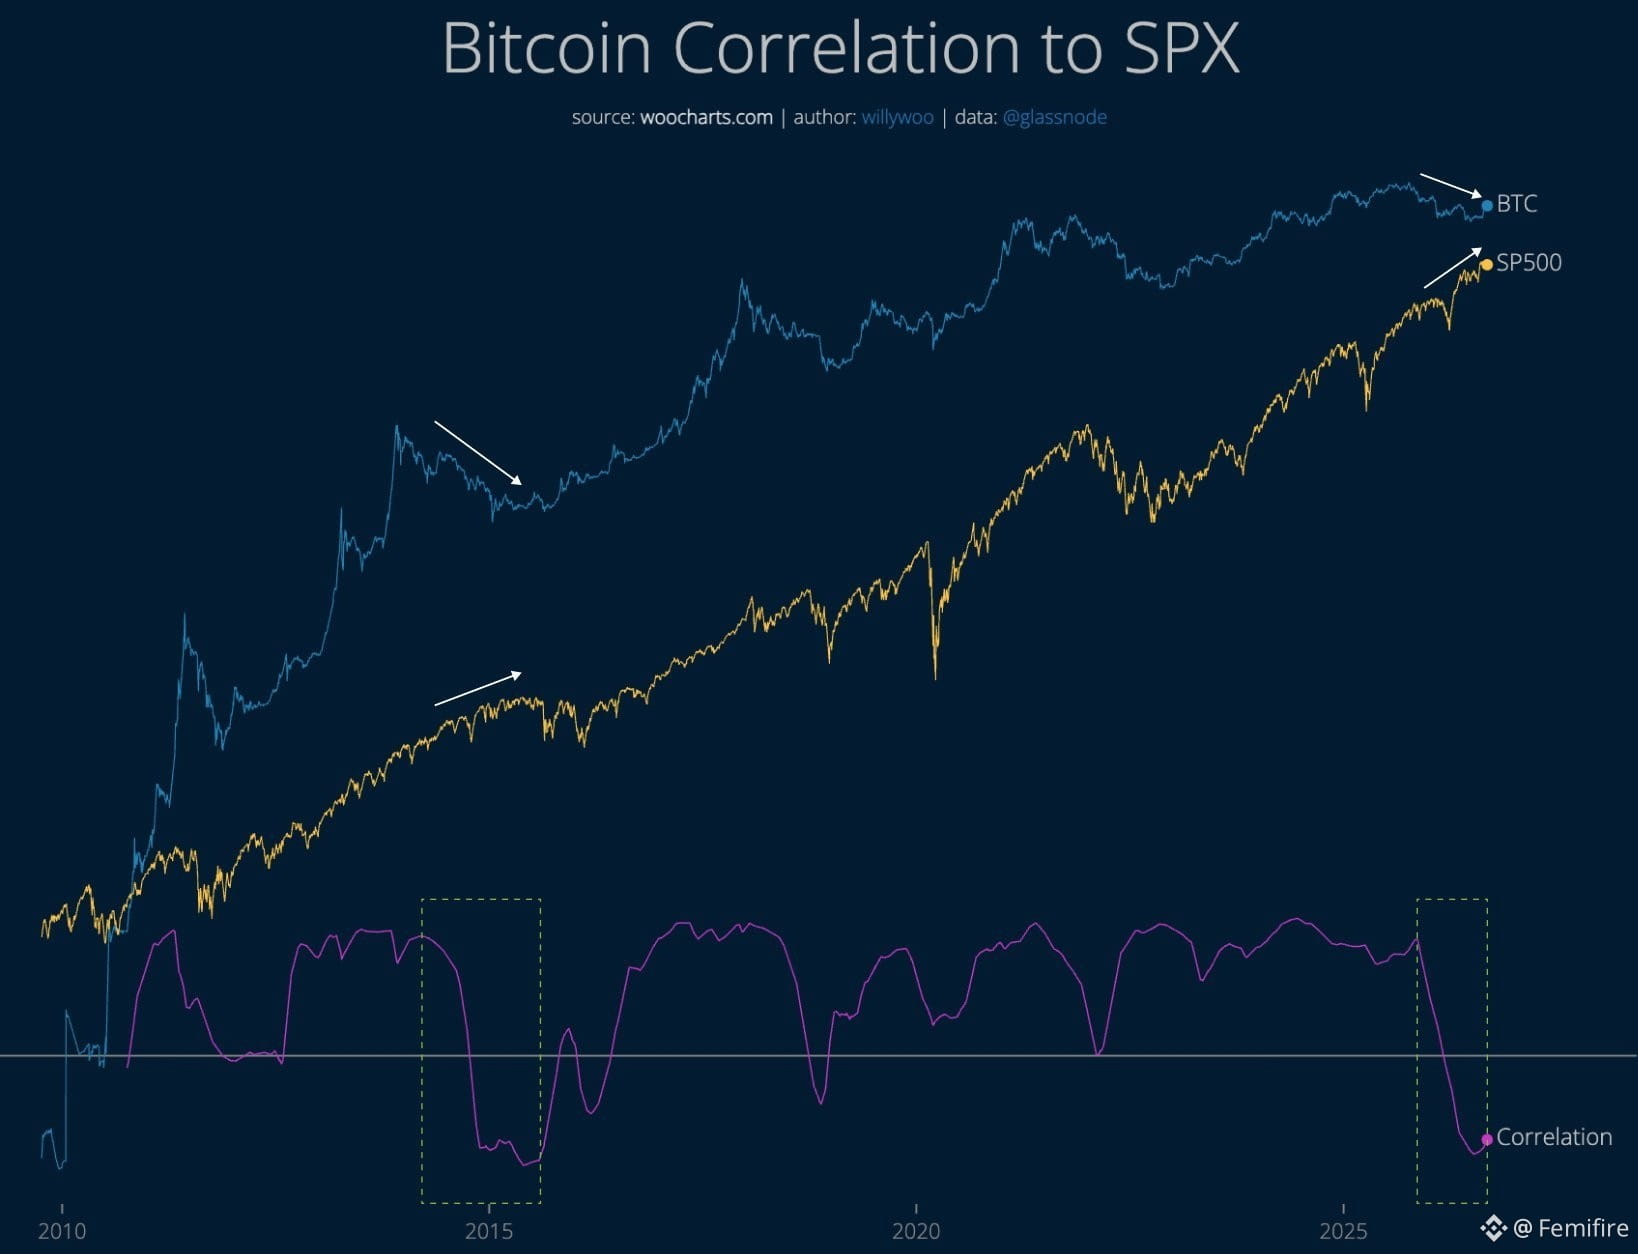
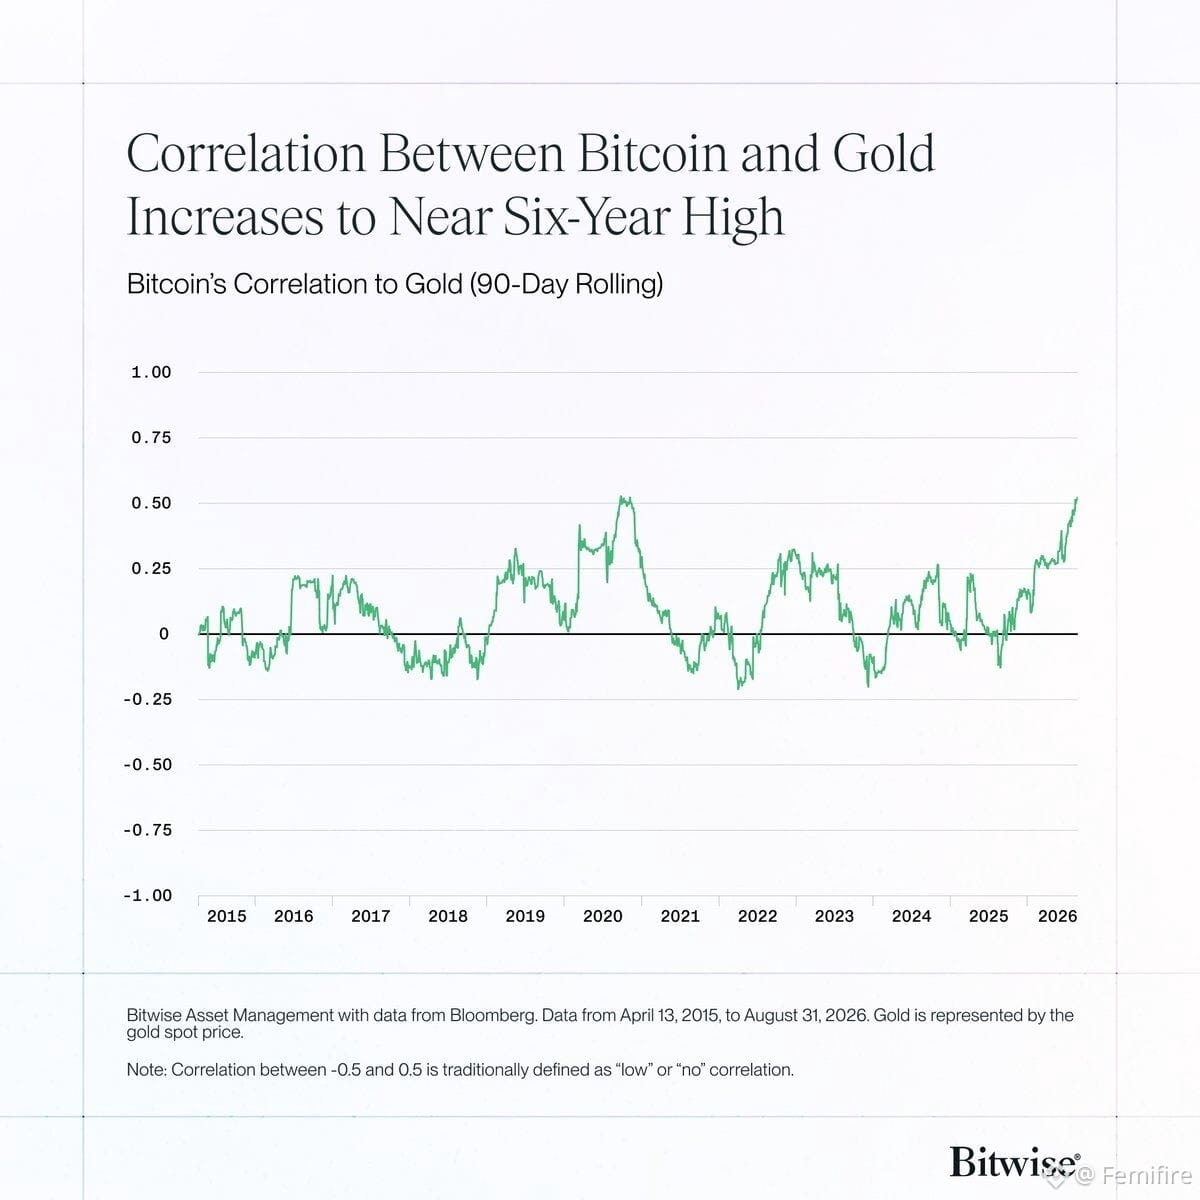
Bitcoin is breaking away from the Nasdaq and starting to track Gold instead. The last time we saw this shift was in 2017 right before a massive, explosive bull run. You’re not prepared for what’s coming.
SOPH is moving fast 👀
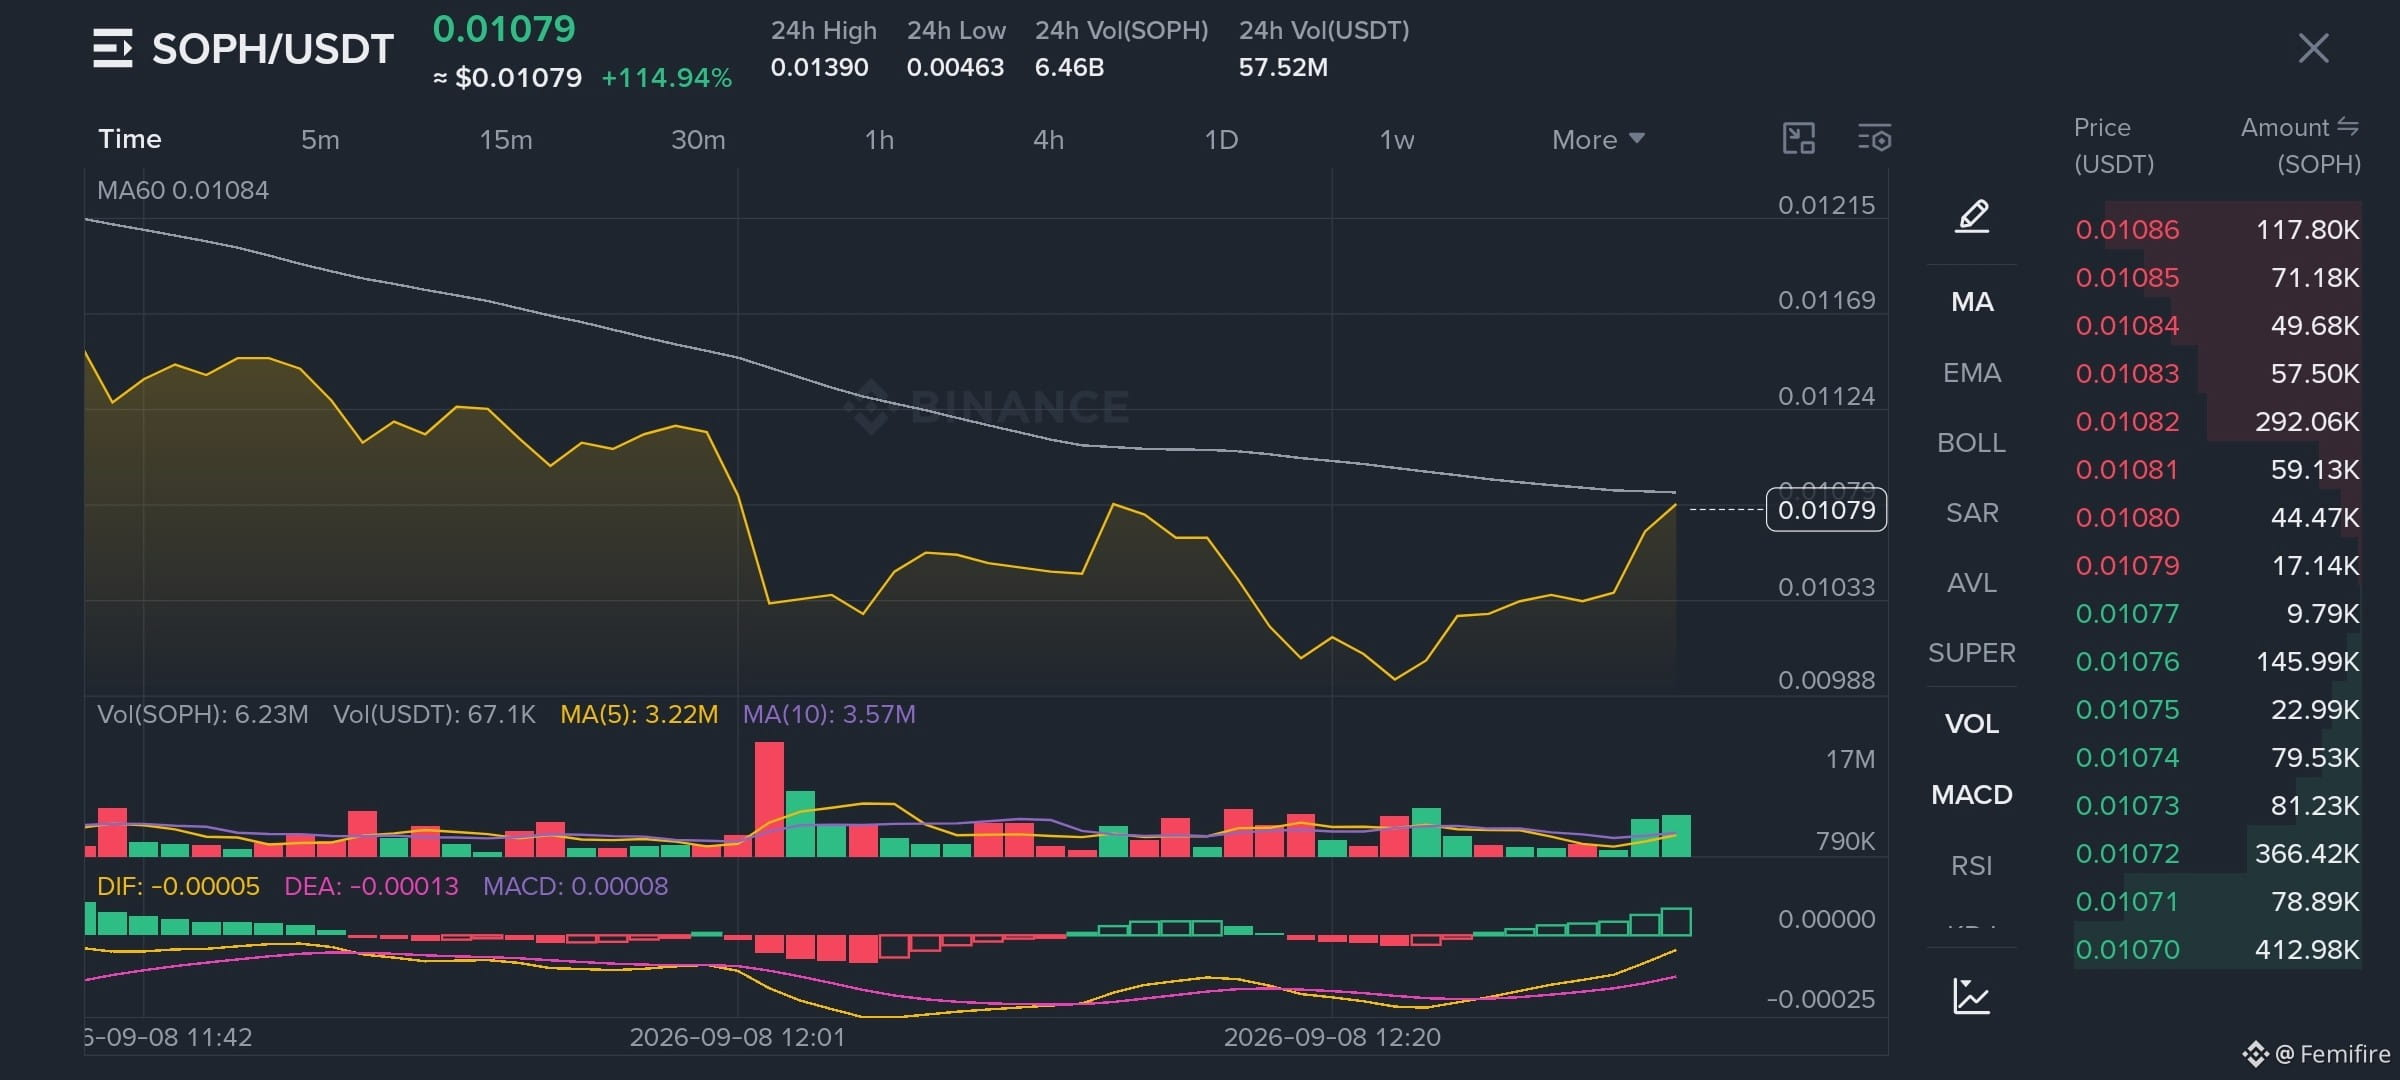
SOPH is up over 100%, currently around $0.01079 after trading as high as $0.01390. That’s a huge move, so I’m more interested in whether it can hold the recovery than chasing the pump.
On the chart, momentum is improving: the MACD histogram has turned positive and is expanding, while price is pushing back toward the MA60 around $0.01084.
$0.0108-$0.0110 is the area to watch. A clean reclaim could keep the short-term momentum alive, but rejection there could lead to some consolidation after such a sharp move.
Big volume, big move, now the key question is whether SOPH can hold the gains.
DYOR
SOPH is up over 100%, currently around $0.01079 after trading as high as $0.01390. That’s a huge move, so I’m more interested in whether it can hold the recovery than chasing the pump.
On the chart, momentum is improving: the MACD histogram has turned positive and is expanding, while price is pushing back toward the MA60 around $0.01084.
$0.0108-$0.0110 is the area to watch. A clean reclaim could keep the short-term momentum alive, but rejection there could lead to some consolidation after such a sharp move.
Big volume, big move, now the key question is whether SOPH can hold the gains.
DYOR
AERO just had a serious move
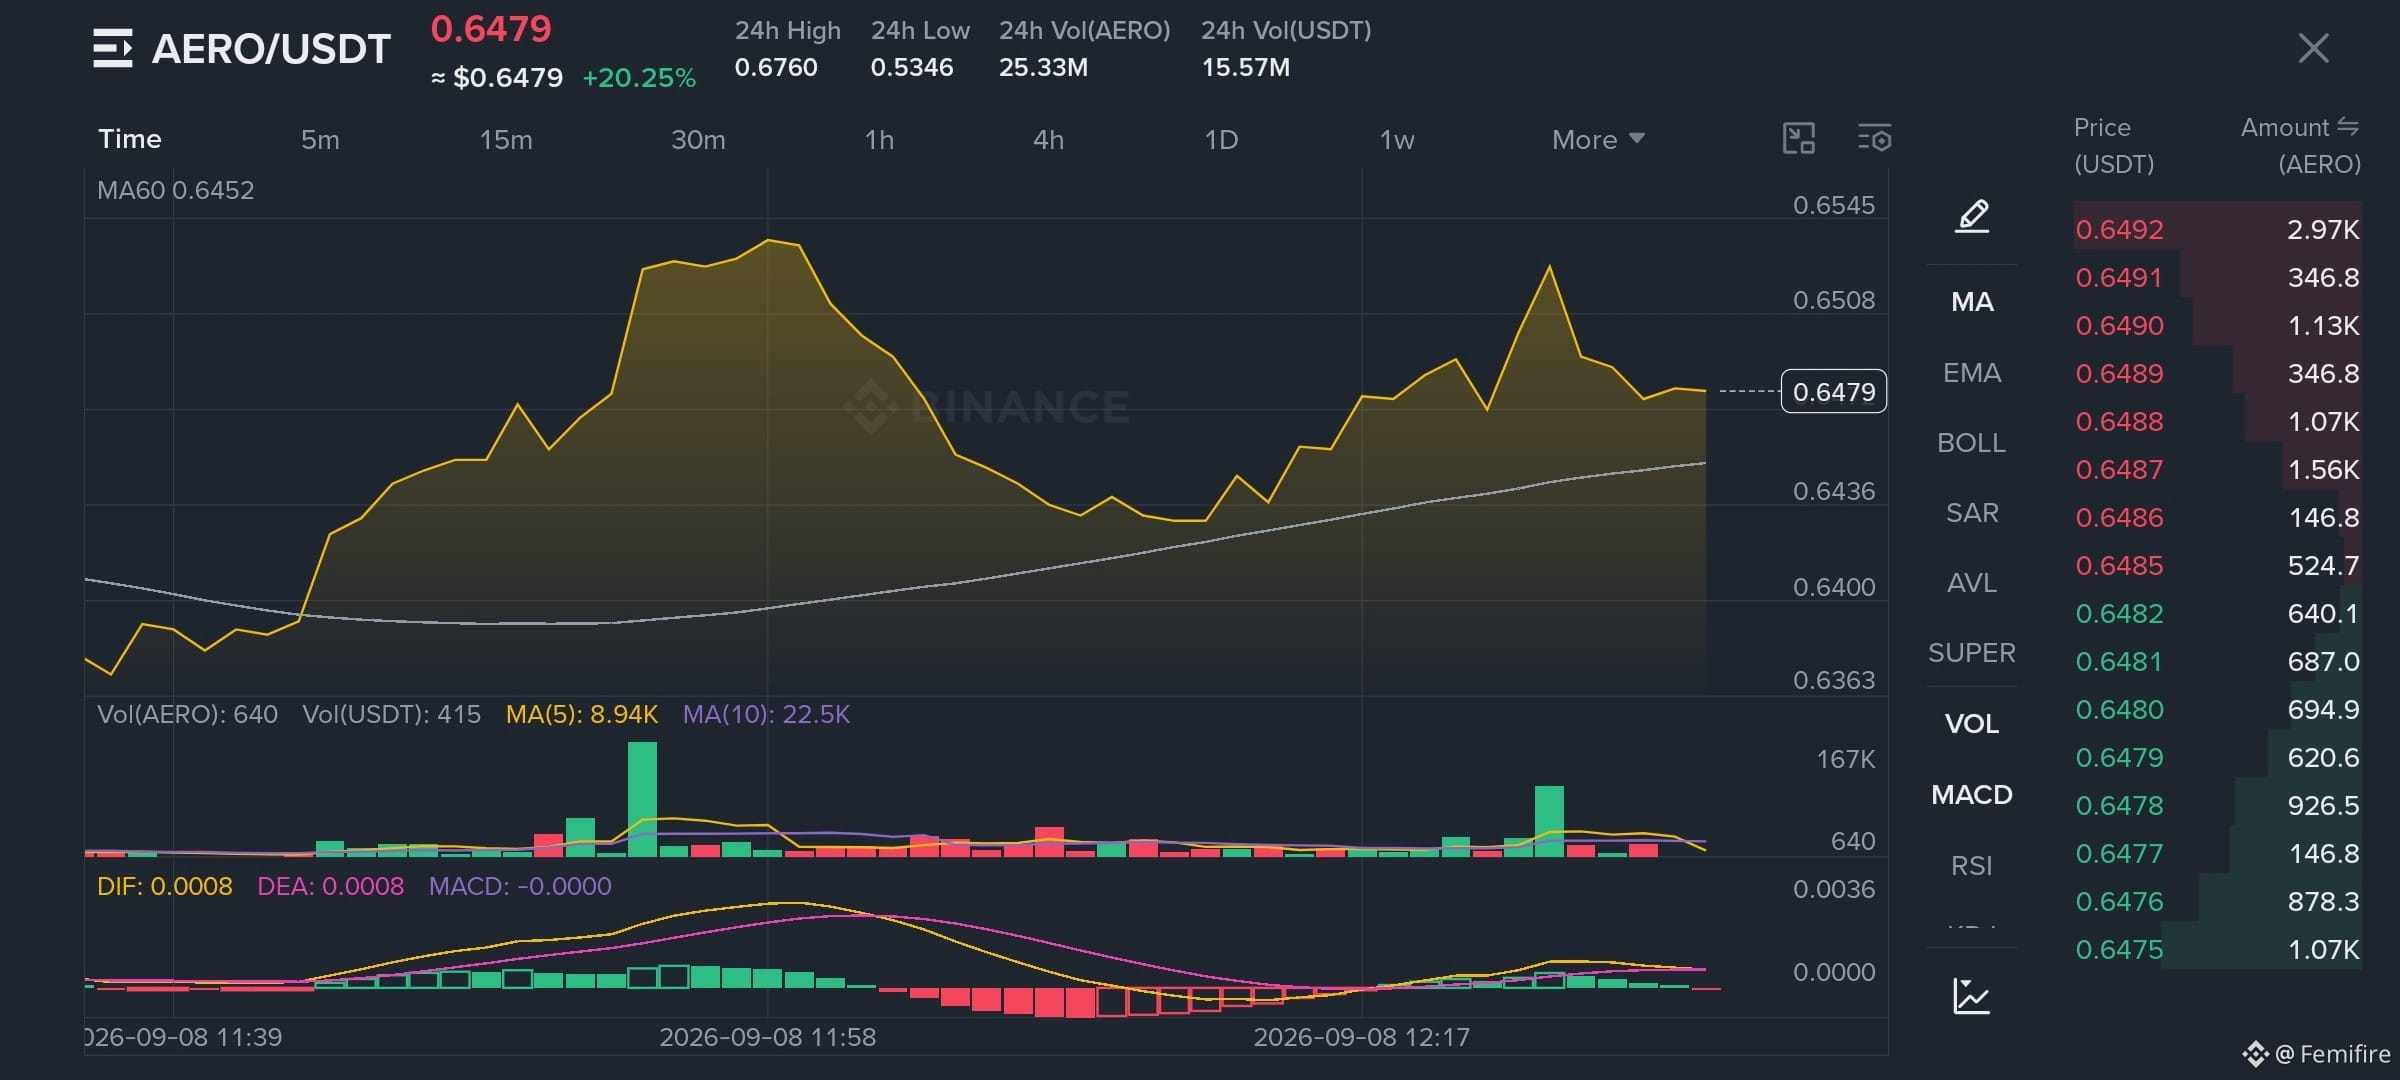
AERO is up around 20%, currently trading near $0.648 after pushing as high as $0.676.
From the chart, price is still holding above the MA60 around $0.645, which keeps the short-term structure looking constructive. But momentum has started to cool after that sharp run, with the MACD sitting close to neutral.
I’d be watching how AERO behaves around the $0.645 are. Holding above it could keep the bullish structure intact, while losing it could mean the market needs to consolidate after the big move.
I’d rather wait for confirmation than chase a 20% pump.
DYOR.
AERO is up around 20%, currently trading near $0.648 after pushing as high as $0.676.
From the chart, price is still holding above the MA60 around $0.645, which keeps the short-term structure looking constructive. But momentum has started to cool after that sharp run, with the MACD sitting close to neutral.
I’d be watching how AERO behaves around the $0.645 are. Holding above it could keep the bullish structure intact, while losing it could mean the market needs to consolidate after the big move.
I’d rather wait for confirmation than chase a 20% pump.
DYOR.
SOL looks like it’s trying to bounce 👀
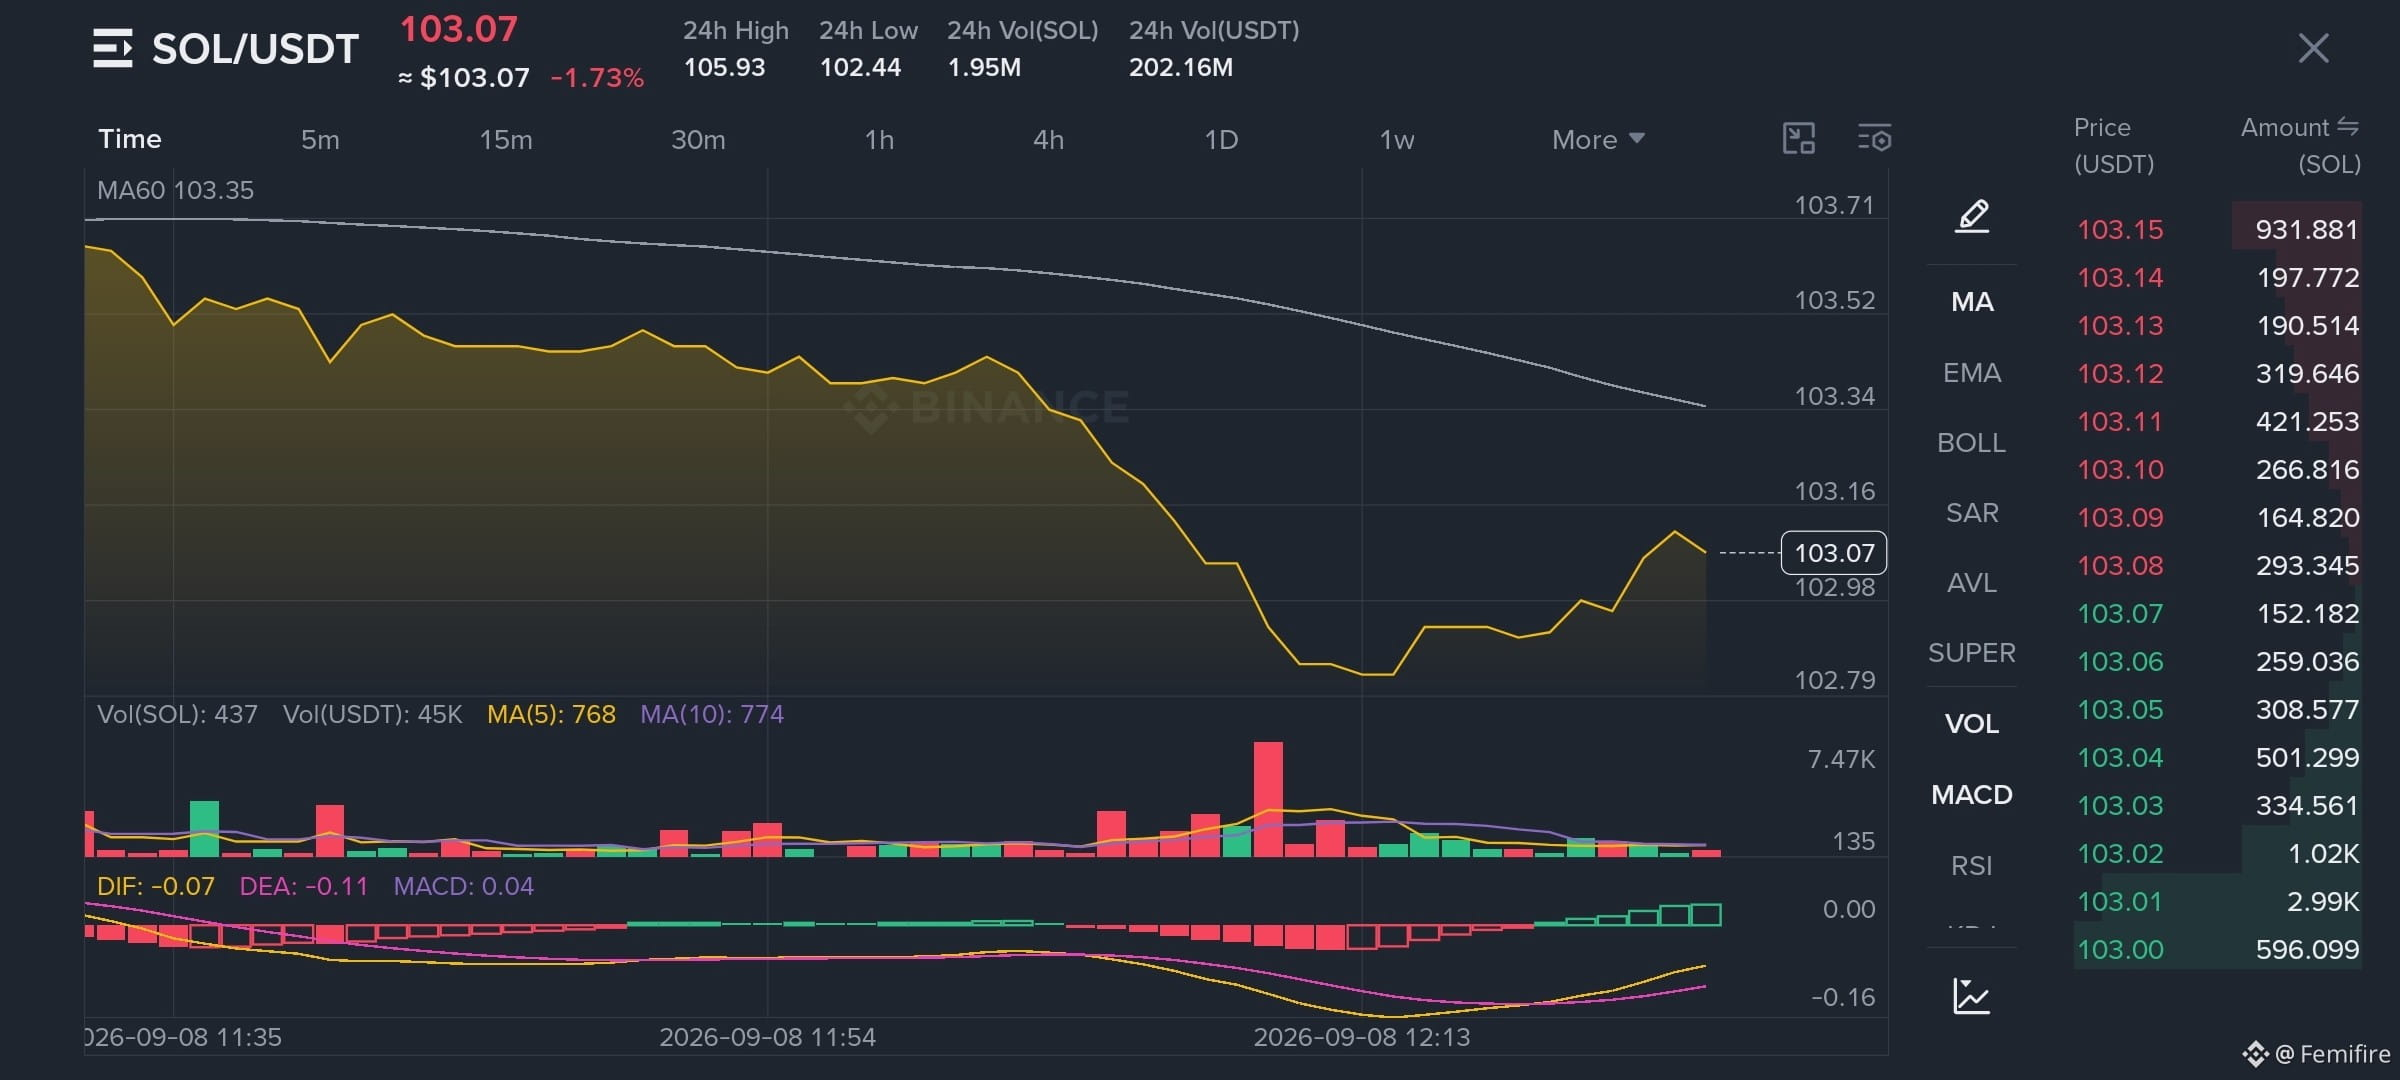
SOL is sitting around $103.07 on the chart after dropping toward $102.79 before recovering.
The interesting part is the momentum: MACD is starting to improve, with the histogram turning positive, but price is still below the MA60 around $103.35.
For me, $103.35-$103.50 is the area to watch. A clean reclaim could strengthen the short-term setup, while losing $102.79 would suggest the sellers are still in control.
I’m not chasing this move yet, waiting for confirmation.
DYOR
SOL is sitting around $103.07 on the chart after dropping toward $102.79 before recovering.
The interesting part is the momentum: MACD is starting to improve, with the histogram turning positive, but price is still below the MA60 around $103.35.
For me, $103.35-$103.50 is the area to watch. A clean reclaim could strengthen the short-term setup, while losing $102.79 would suggest the sellers are still in control.
I’m not chasing this move yet, waiting for confirmation.
DYOR
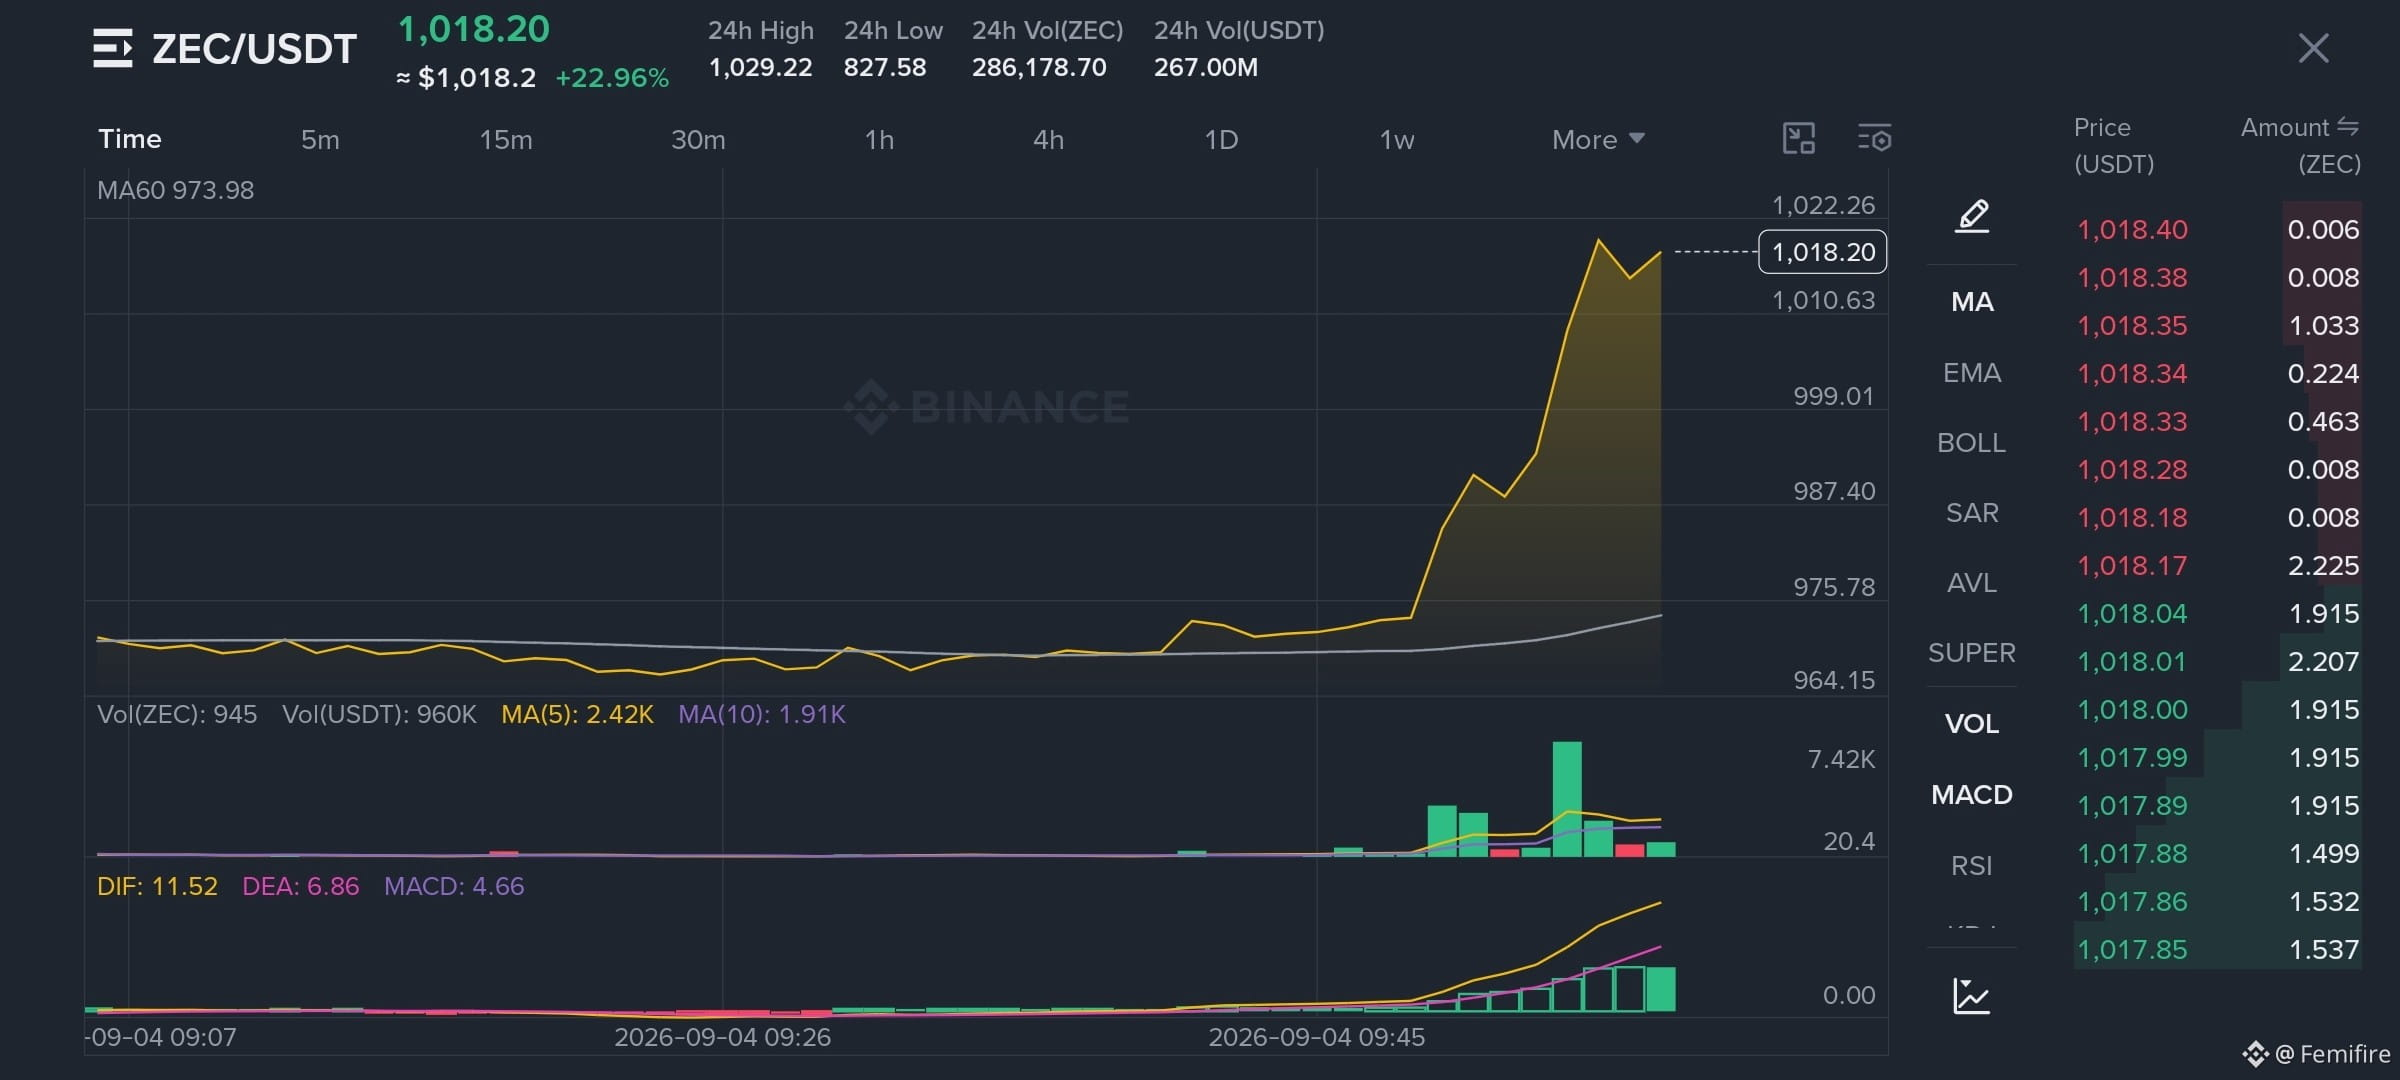
ZEC hits new 8-year high, slightly over a week after its Grayscale ETF went live on NYSE Arca.
Verified
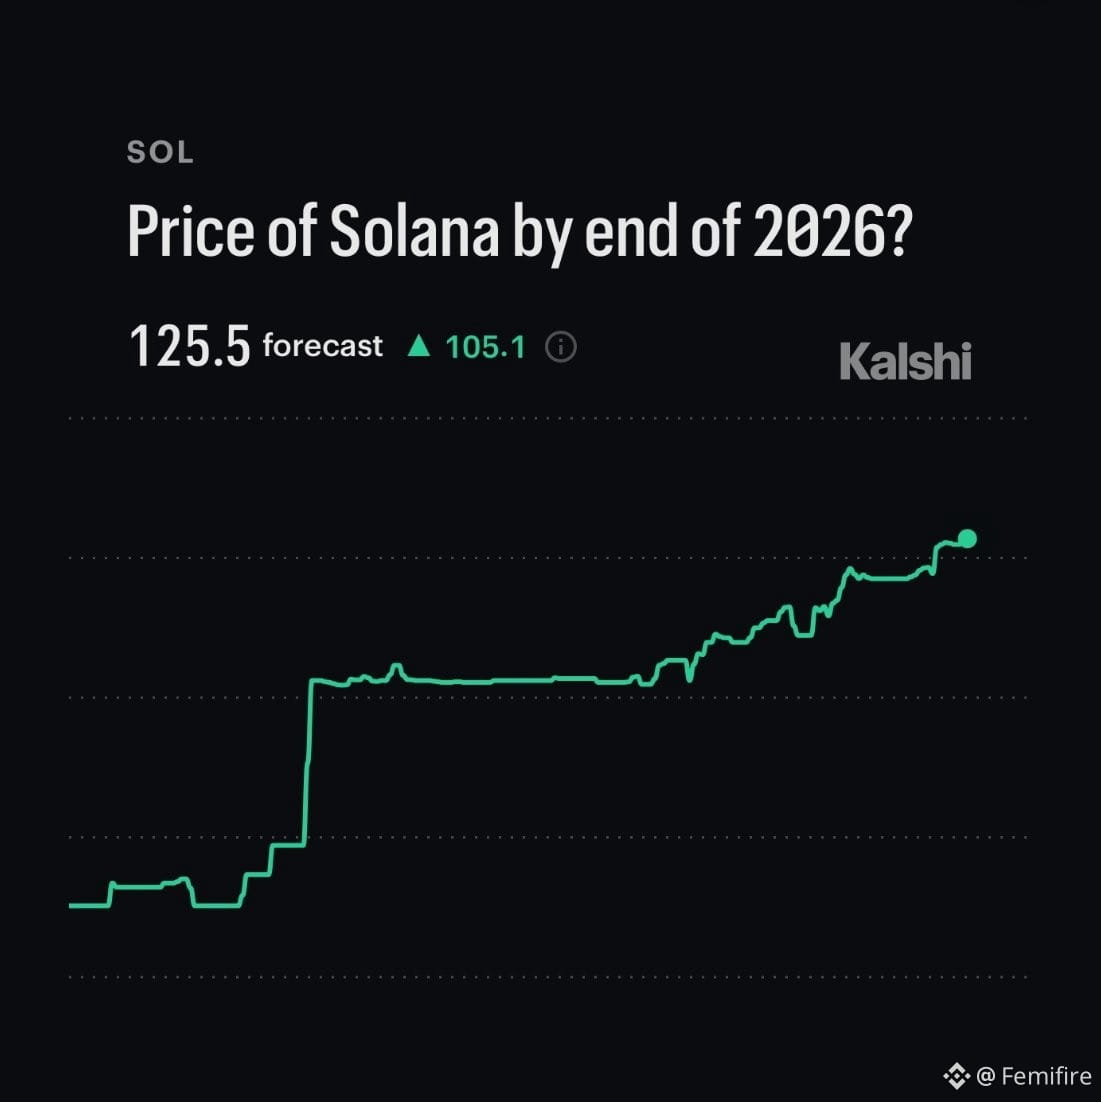
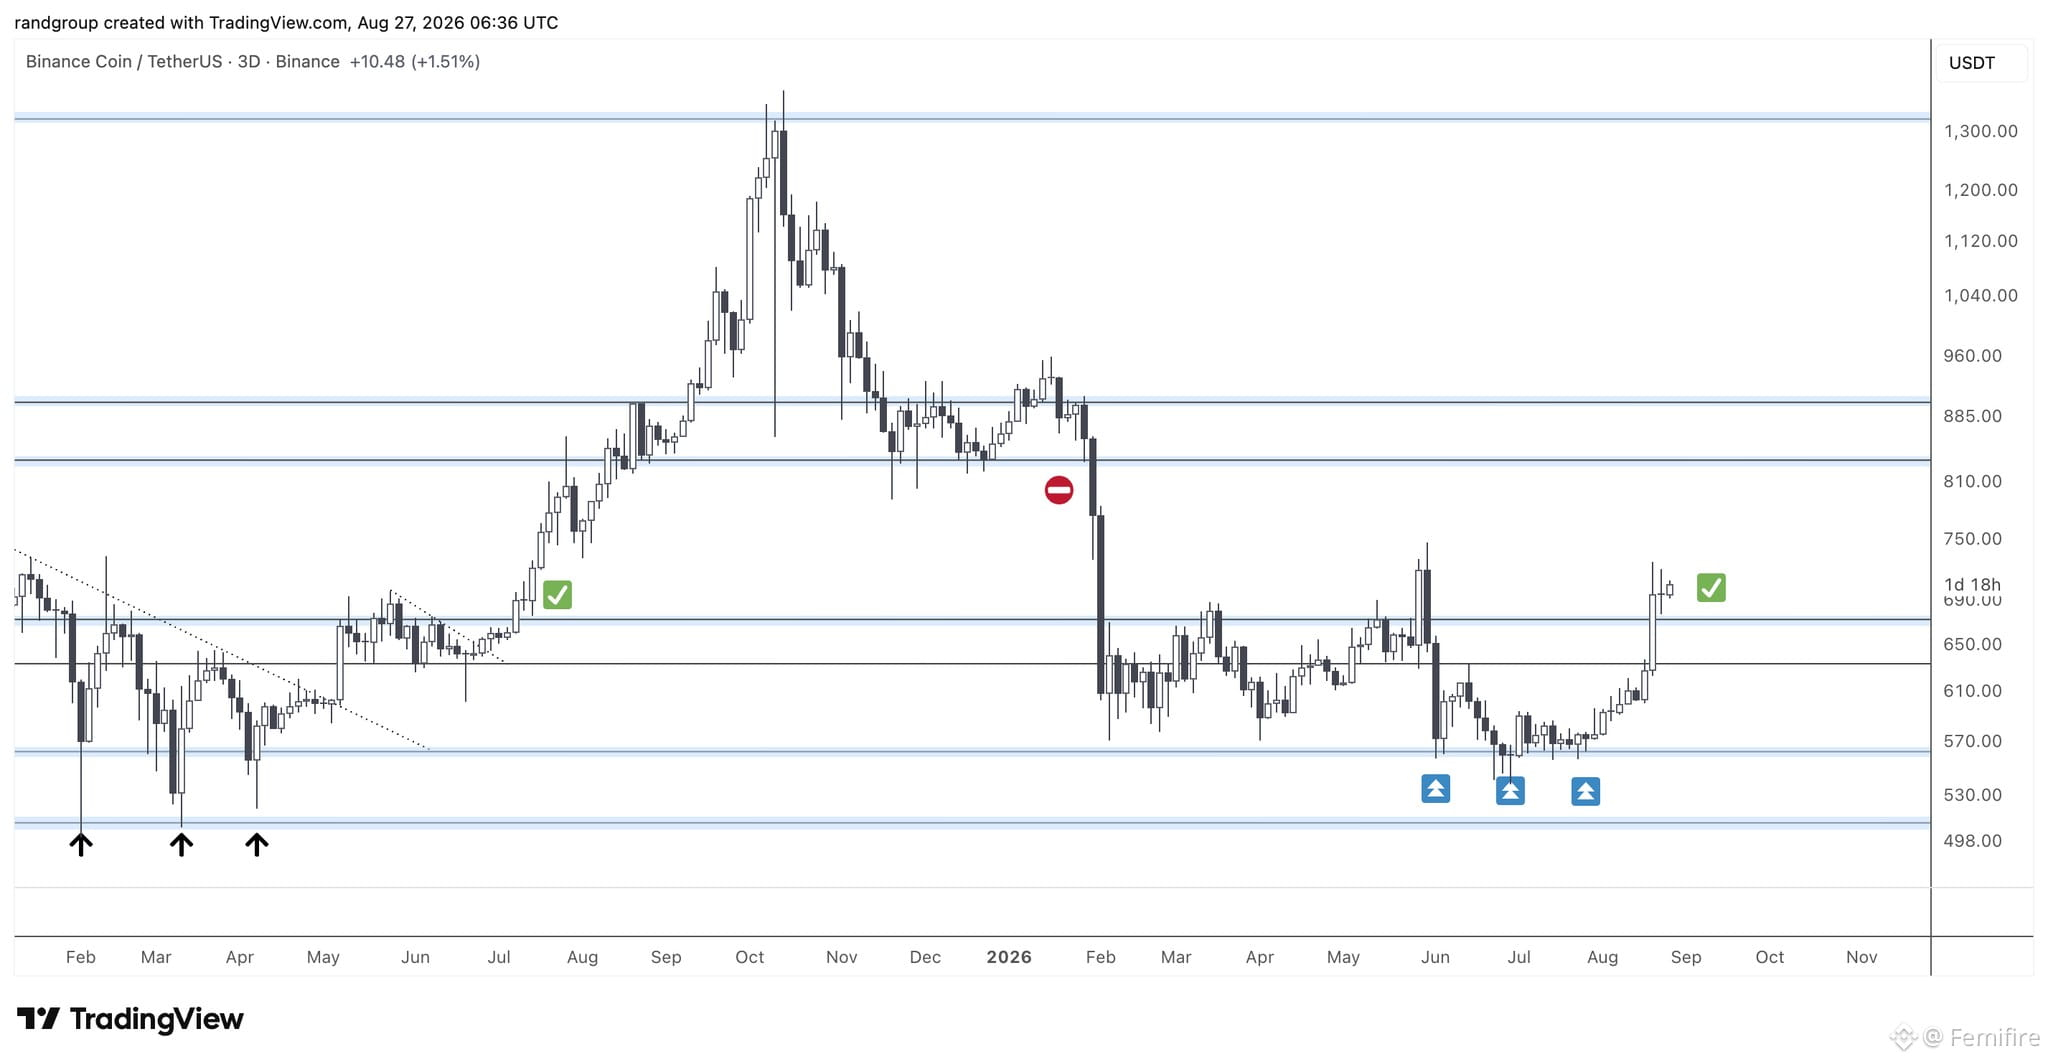
BNB is showing strong momentum. A monthly close that consolidates above the $670 level would be a very bullish development.
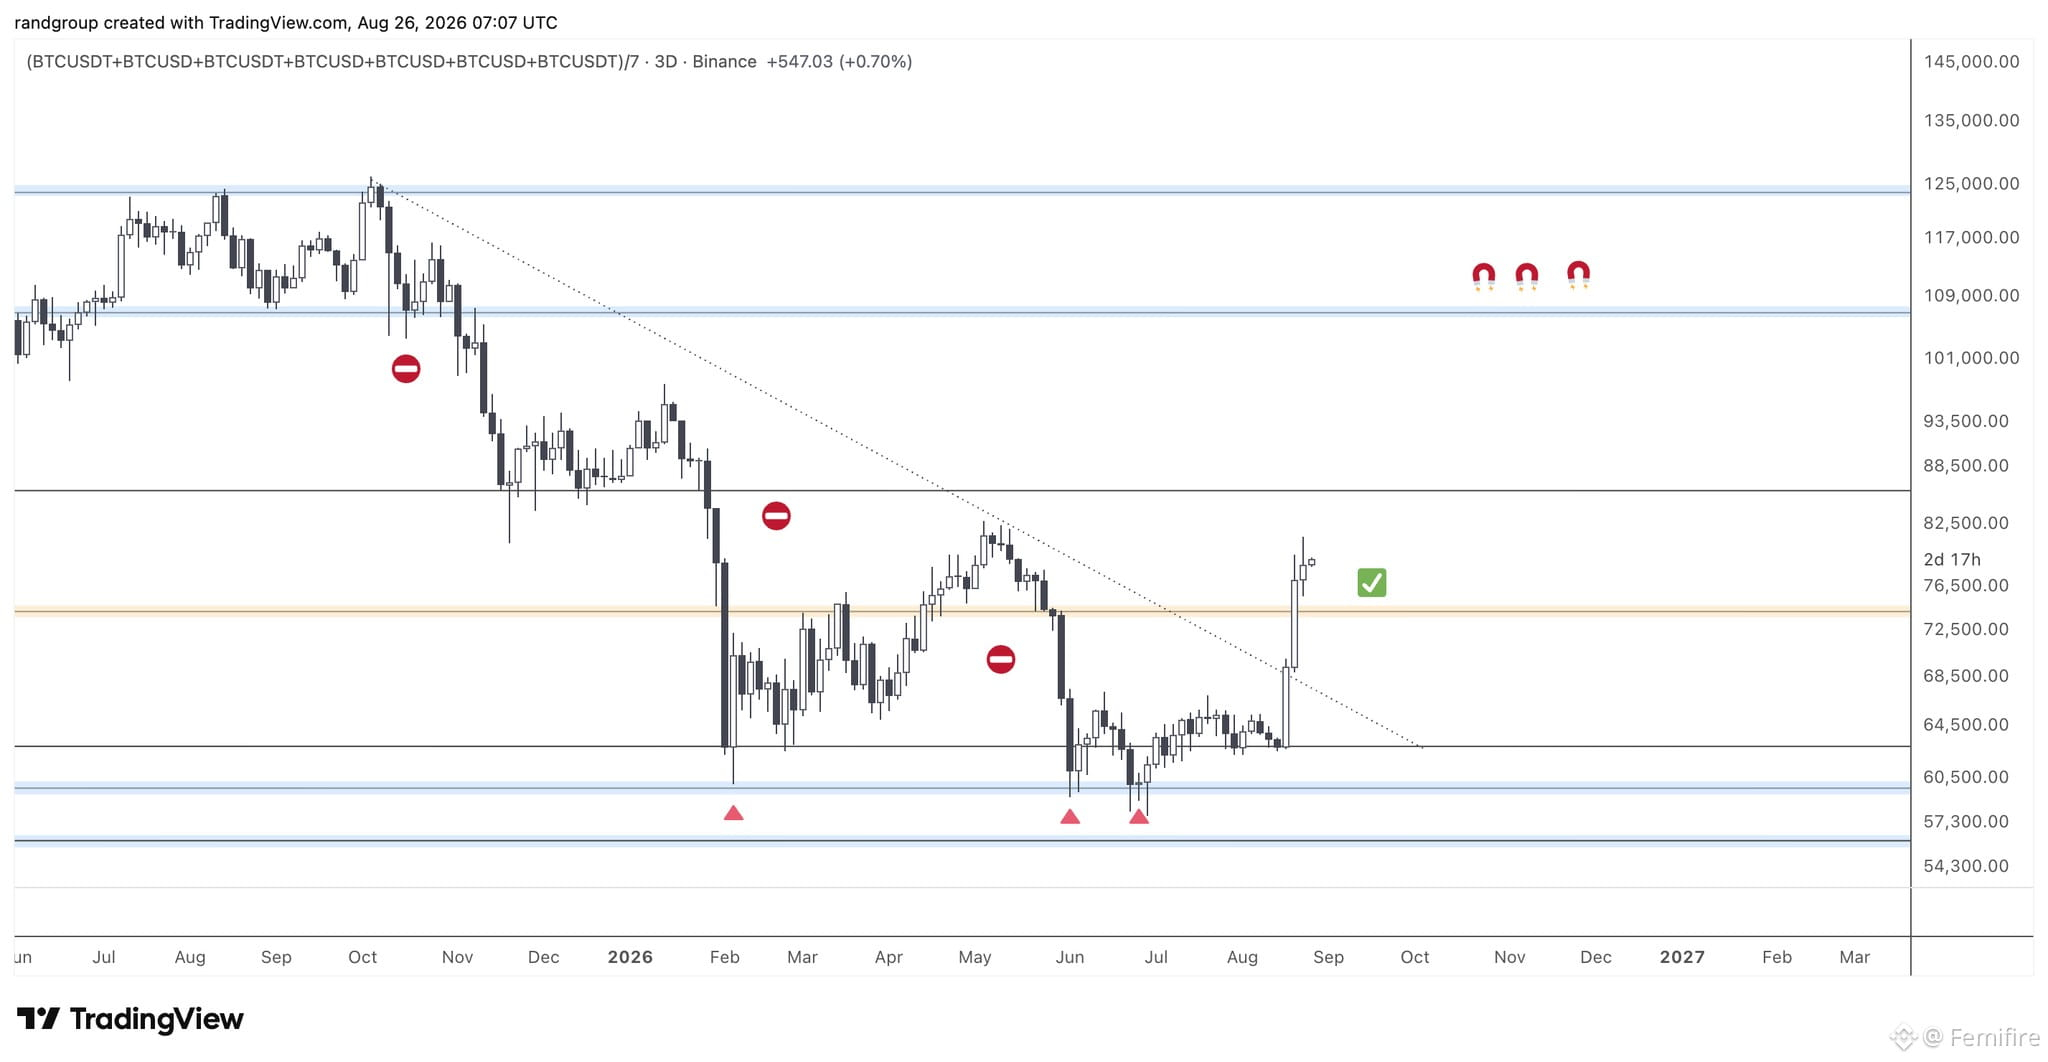

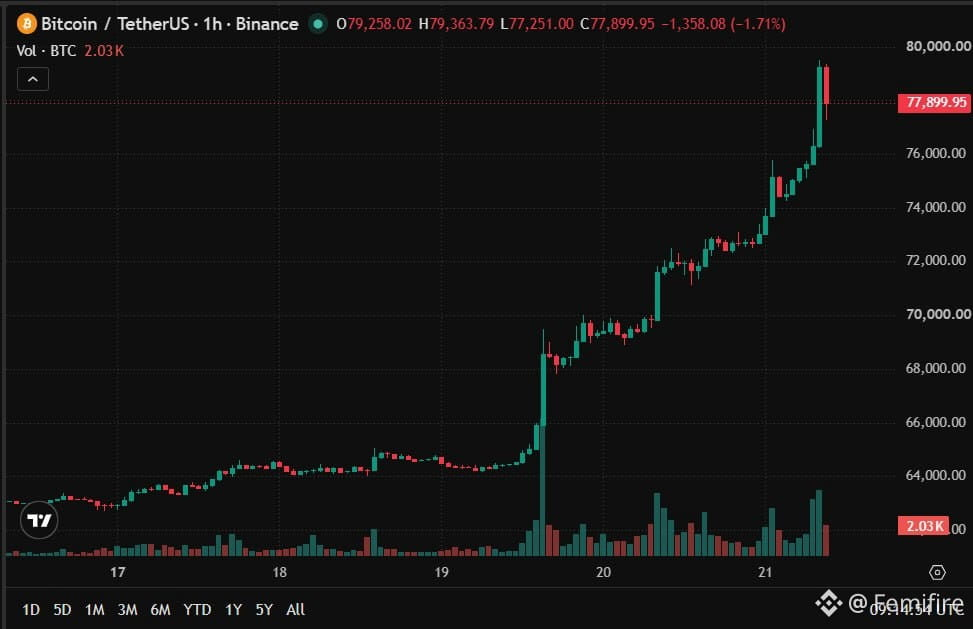
🚨 QUESTION: Does Bitcoin break $80K with this run, or is the rally running out of steam? Comment why.

Night traders, how is it going ?

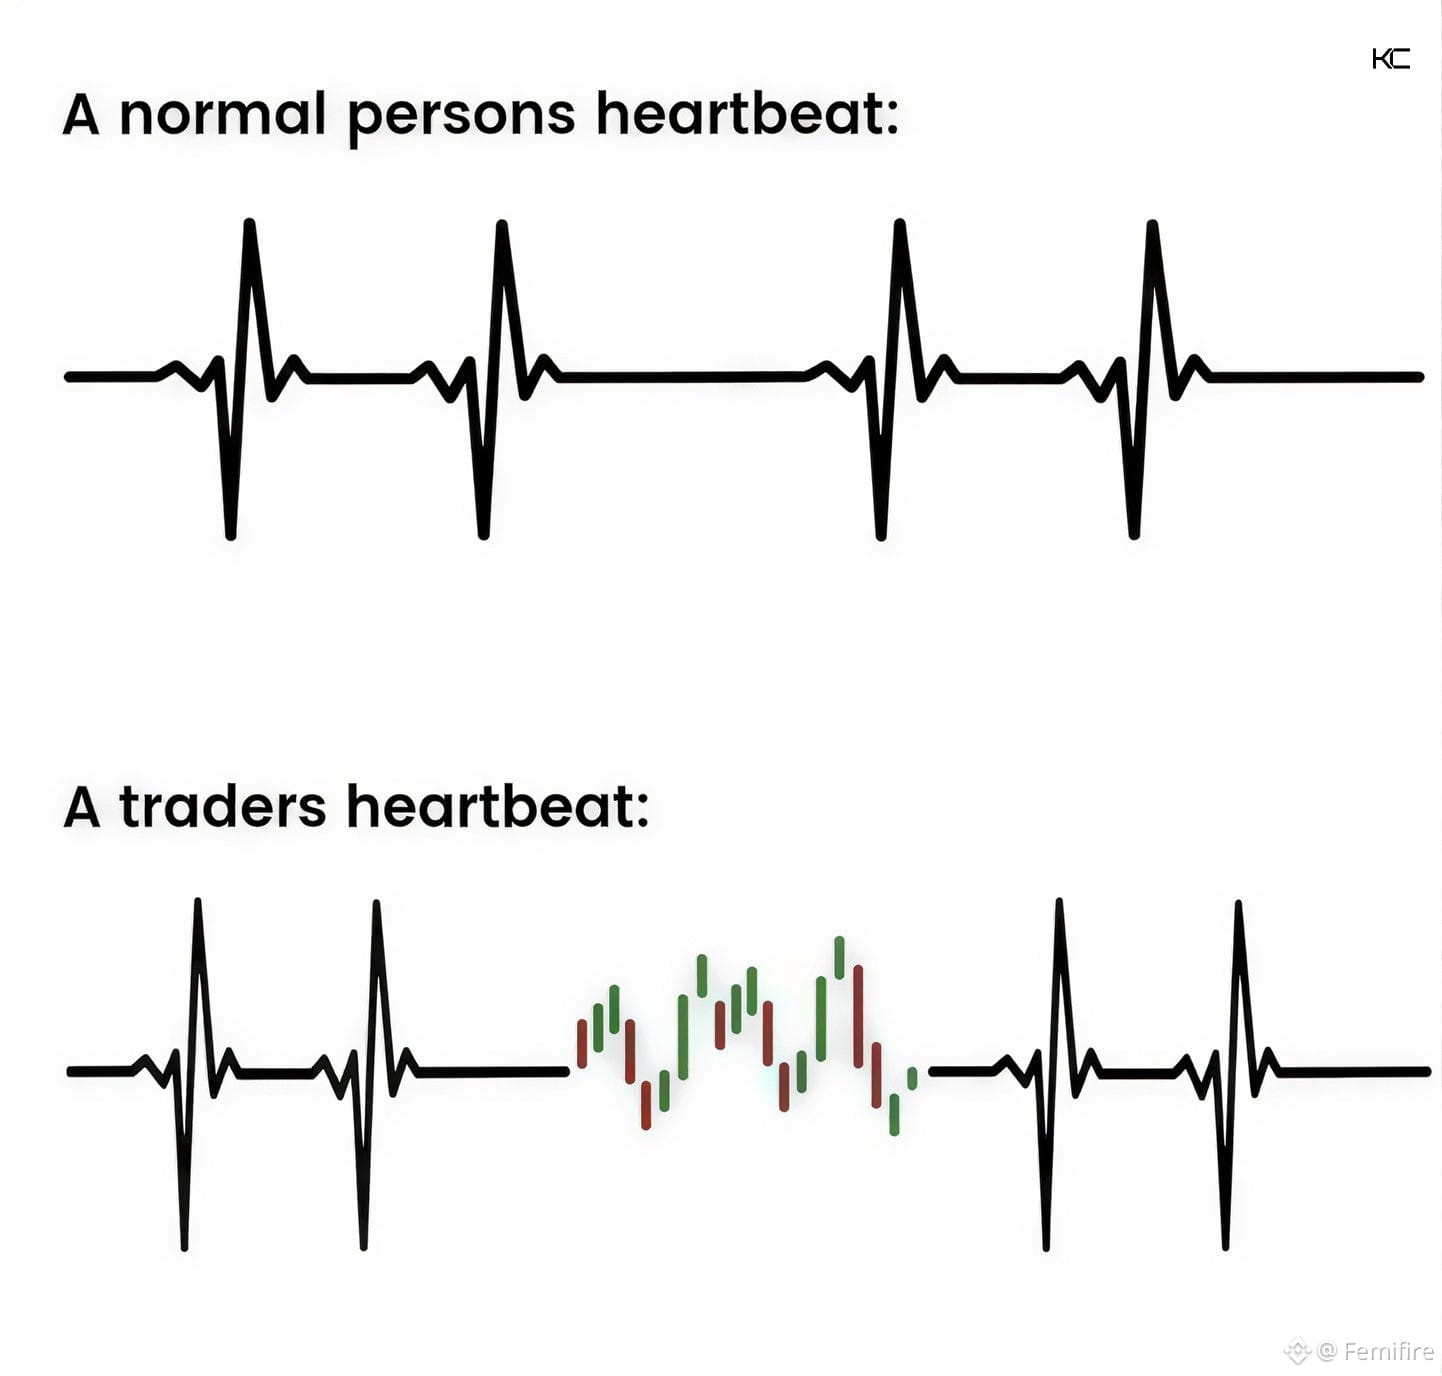
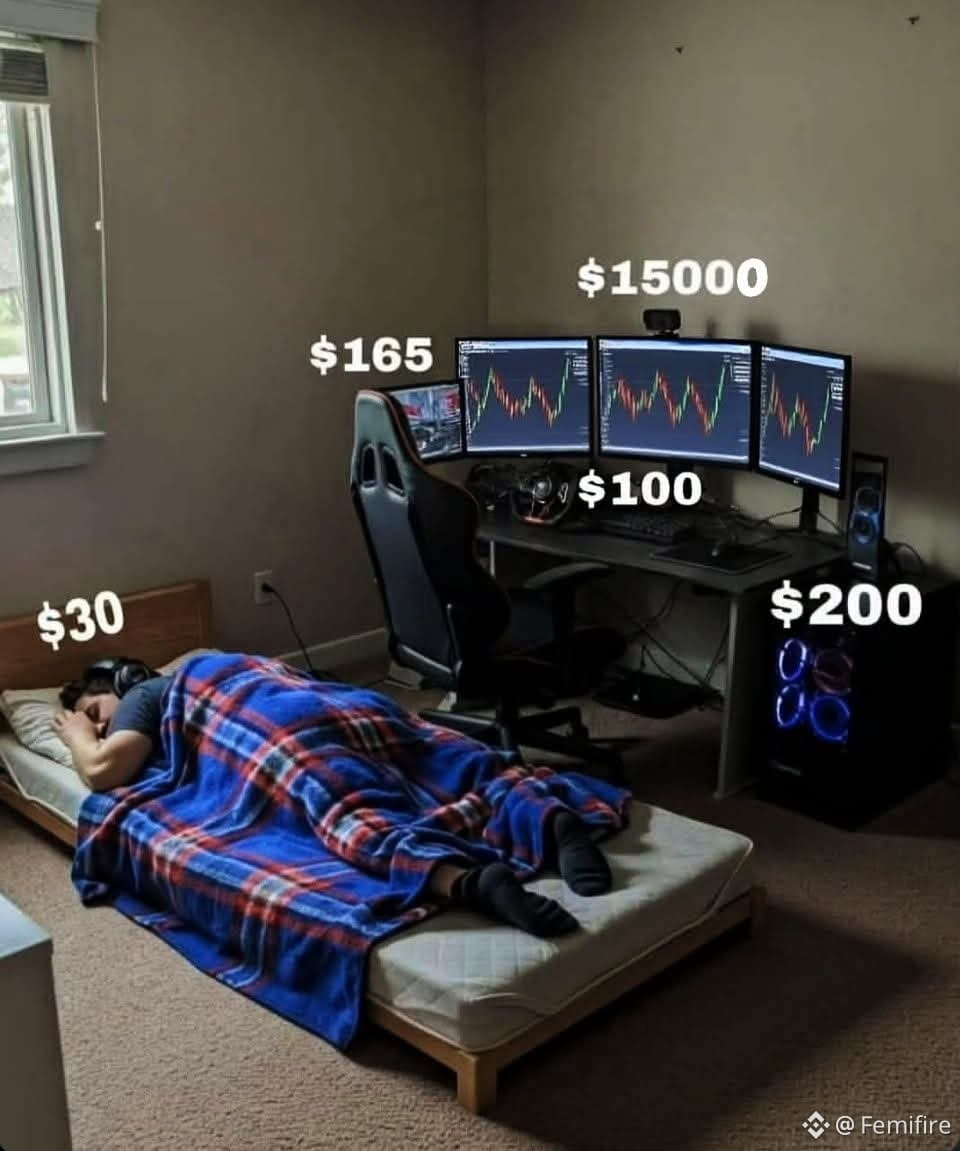
A typical crypto trader life.


Log in to explore more content