
庚赢
1.6k Posts

庚赢
公众号:庚赢
Frequent Trader
1.1 Years
5 Following
302 Followers
589 Liked
Posts
All
Videos
PINNED
Still stuck in place, confused by the market and unable to make up your mind?
Don't struggle with this entanglement any longer! Come here to chat, gossip, and even if it's just to complain about the incomprehensible charts, it can lighten your heart a bit~
Don't struggle with this entanglement any longer! Come here to chat, gossip, and even if it's just to complain about the incomprehensible charts, it can lighten your heart a bit~

Stop-loss moved up earlier; the result was that it was just swept out for a stop loss. Then the price reversed and immediately surged to 81,500. In the end, this trade still just missed it.$BTC #台股TAIEX受芯片股带动重返46500点
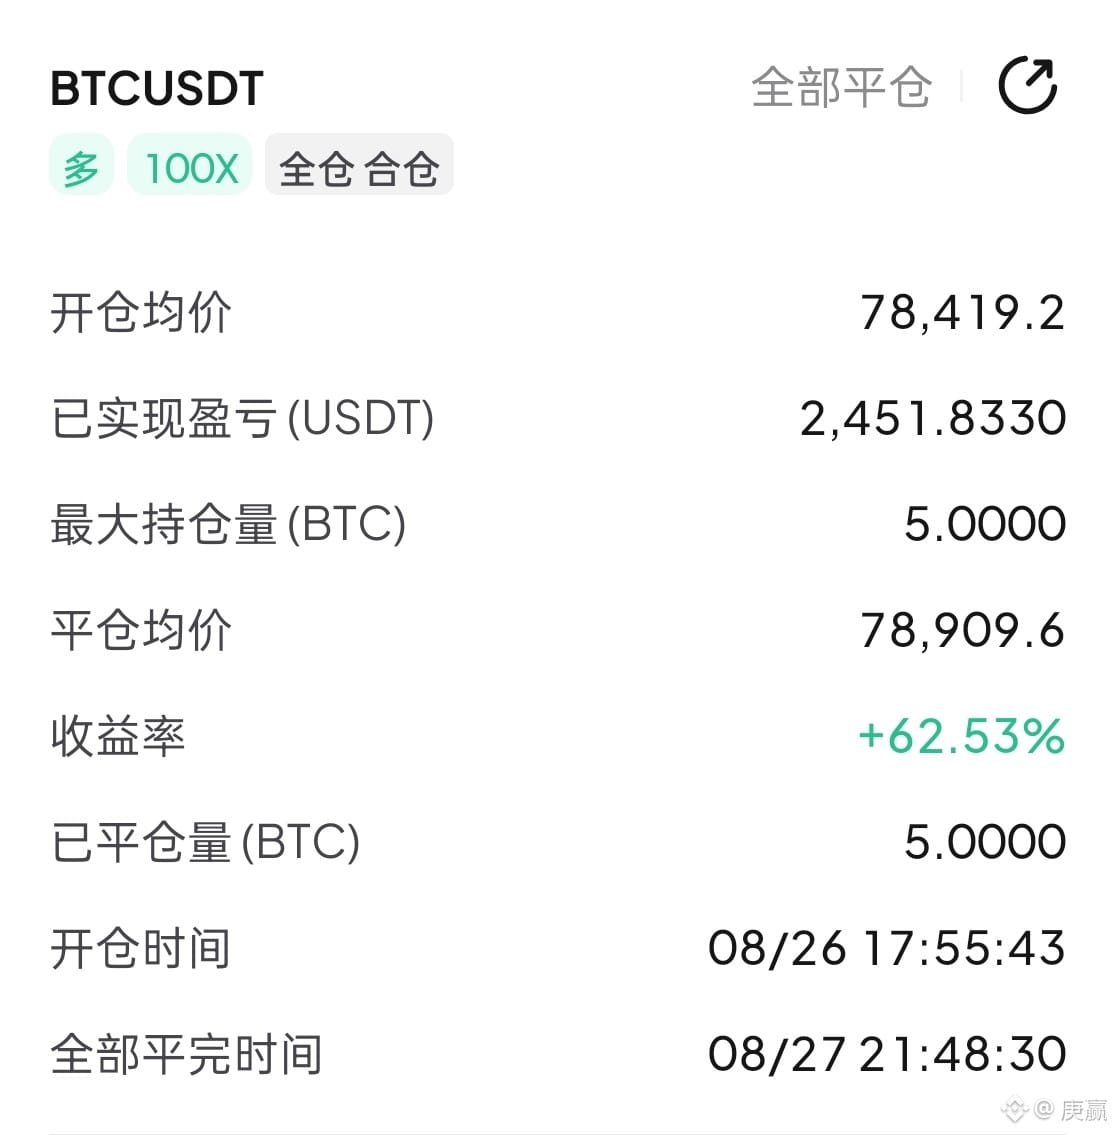
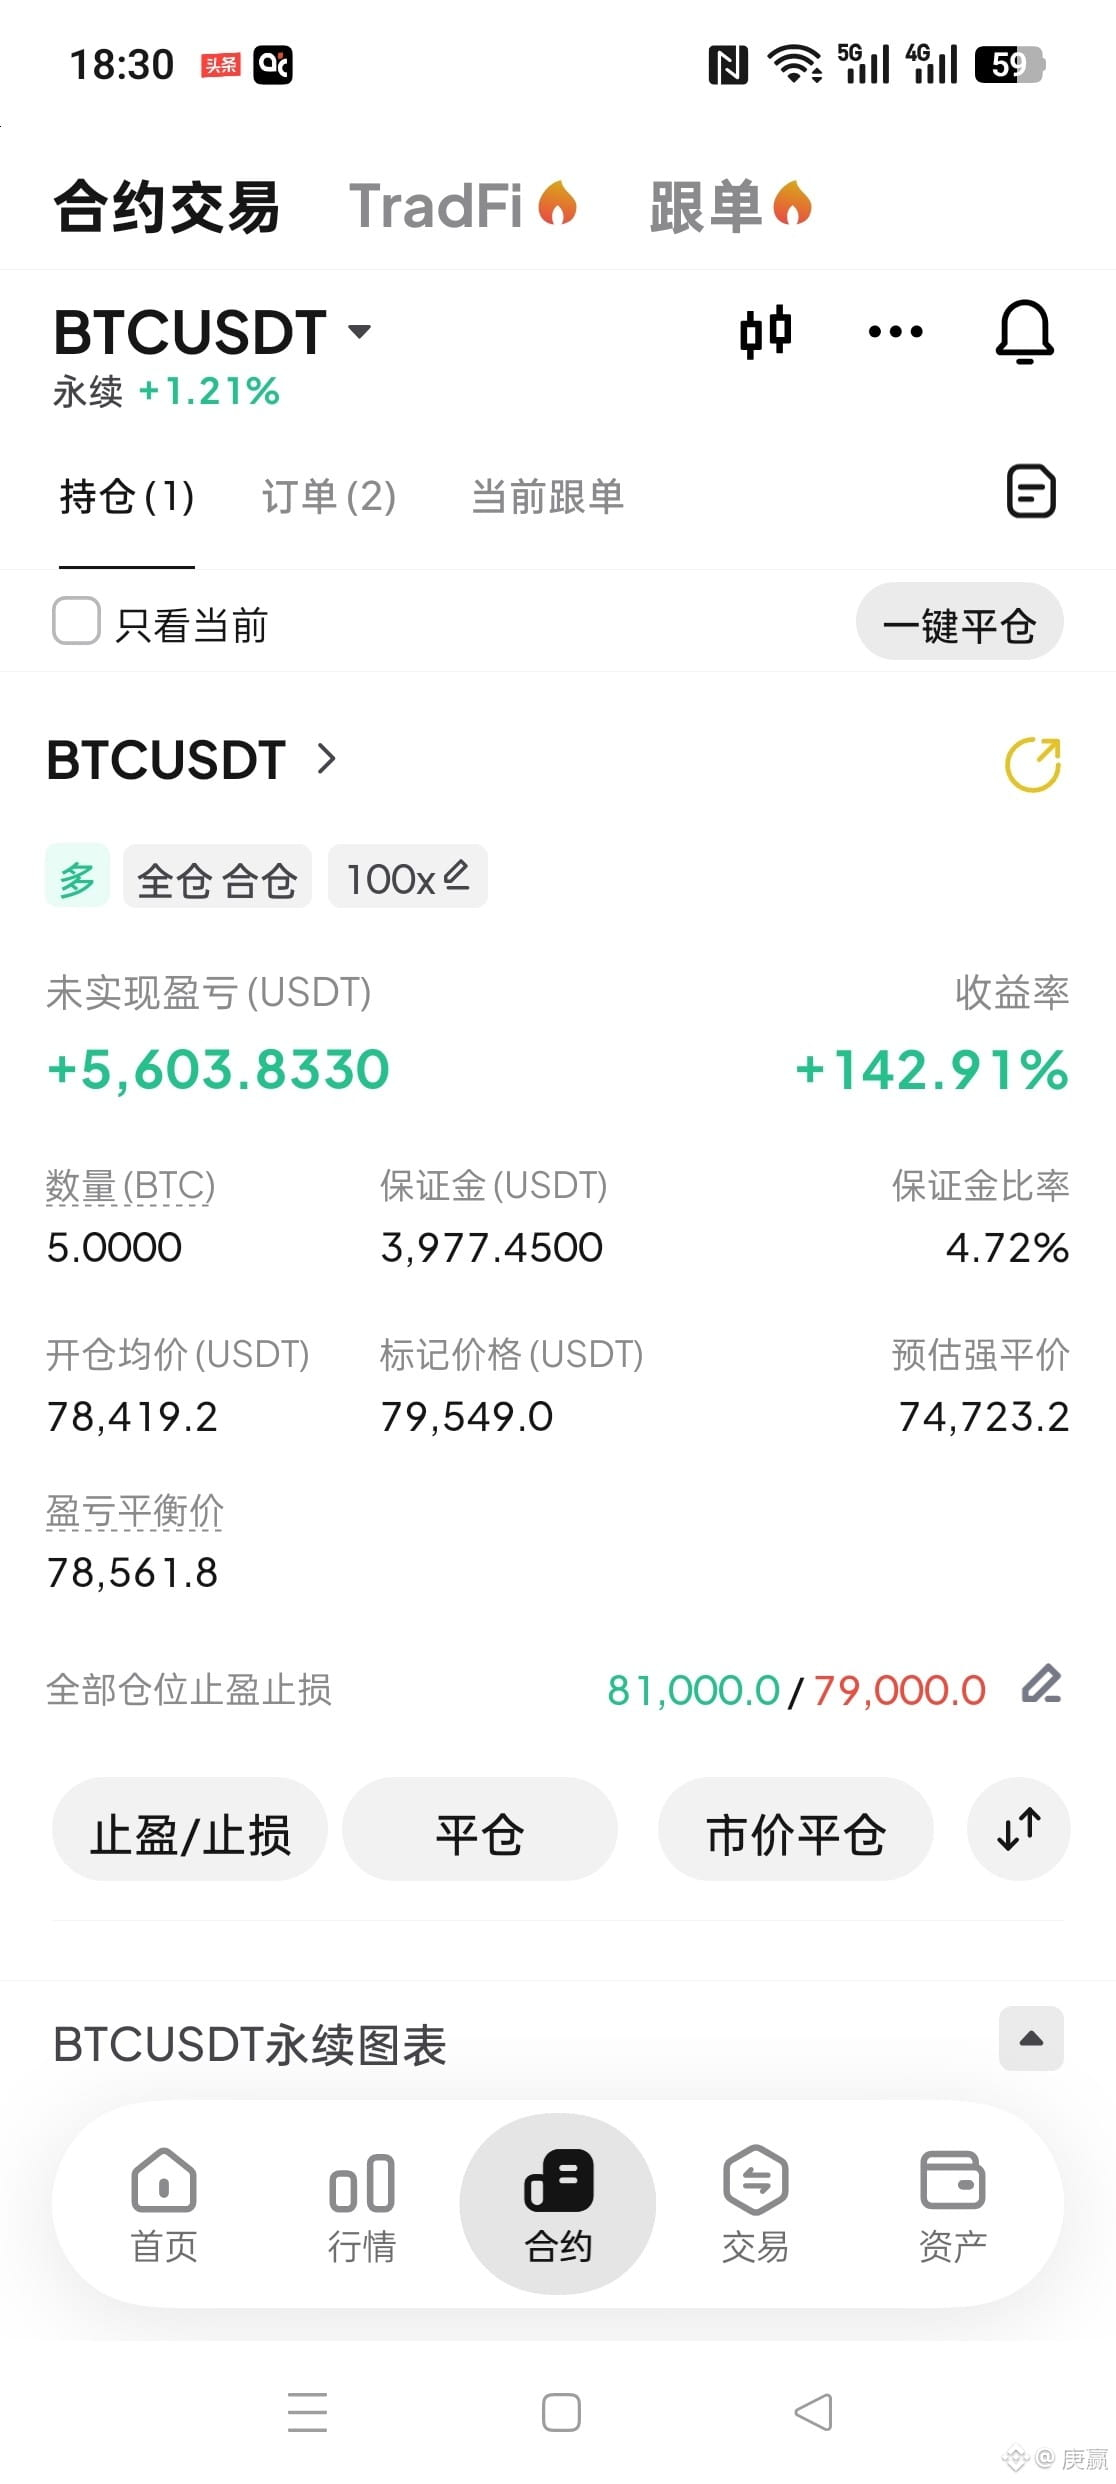
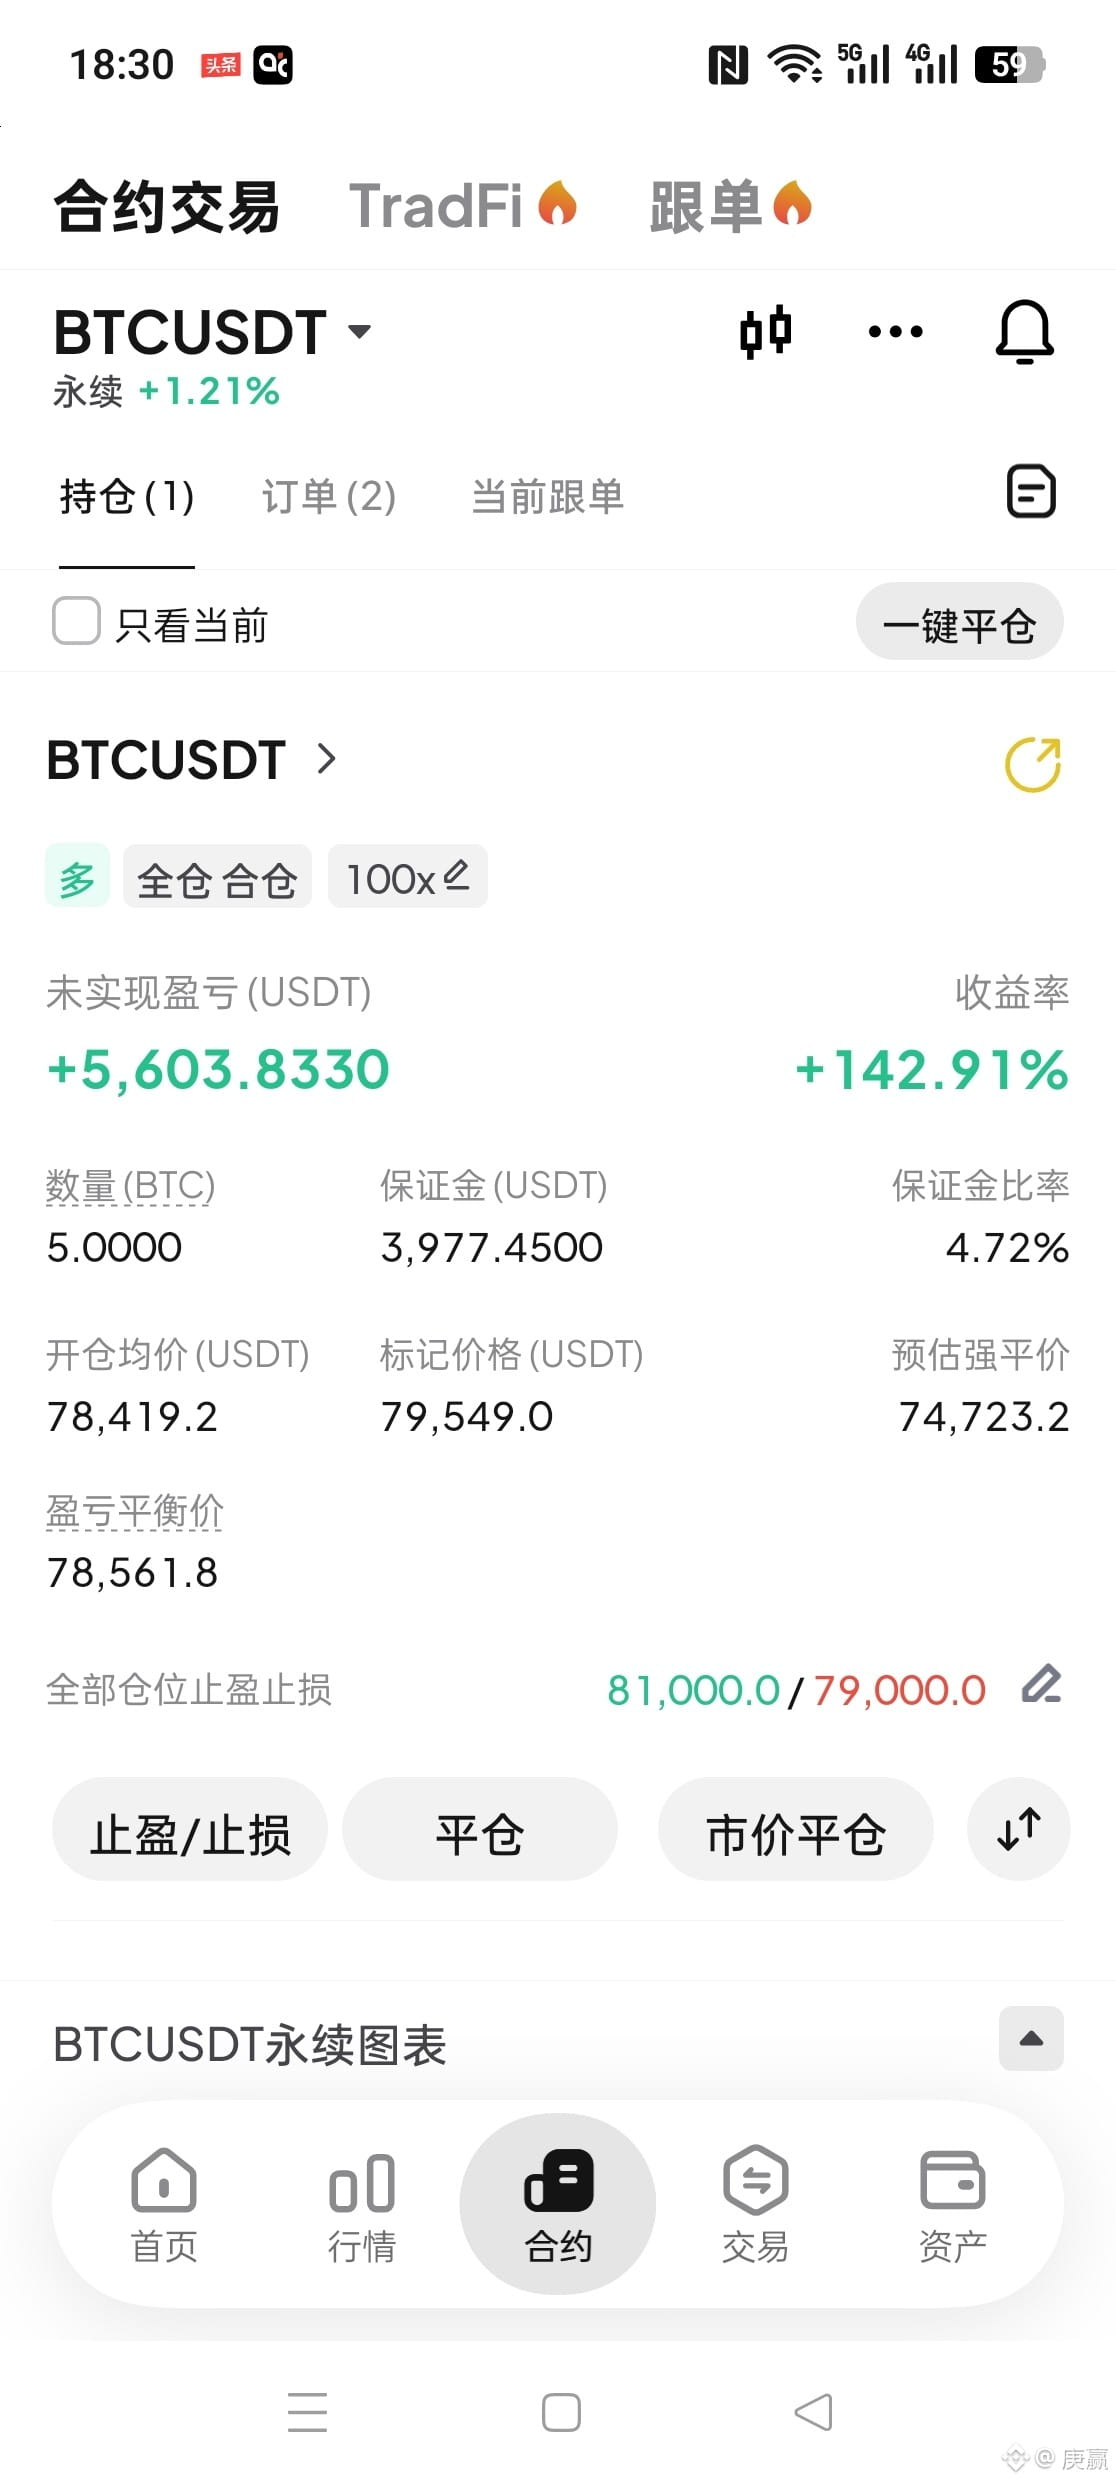
Did everyone listen to the reminder in the early morning? Those who survived a great calamity will surely have good fortune!$BTC #中国反对美国拟加征7.5%关税
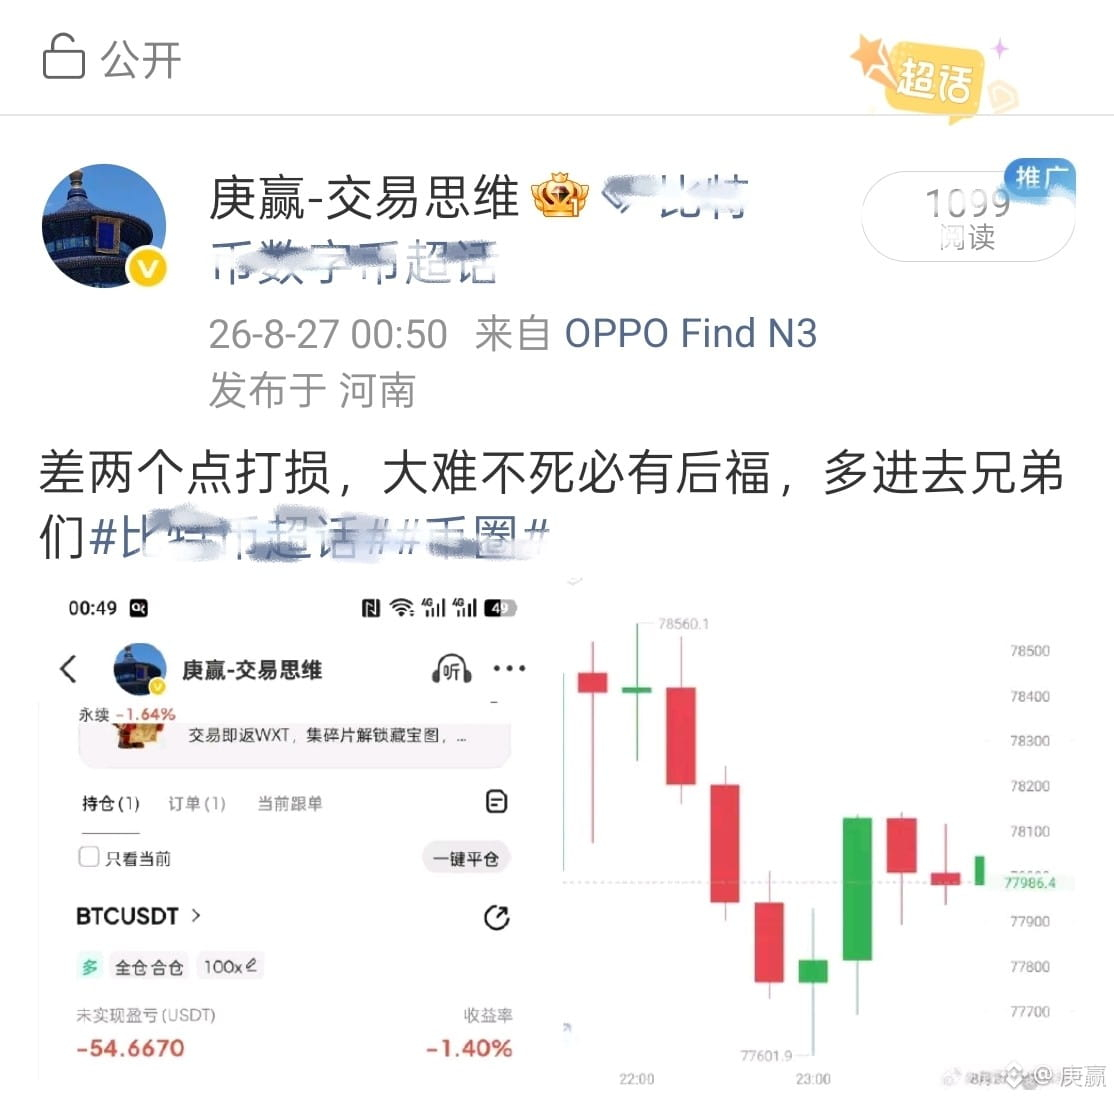
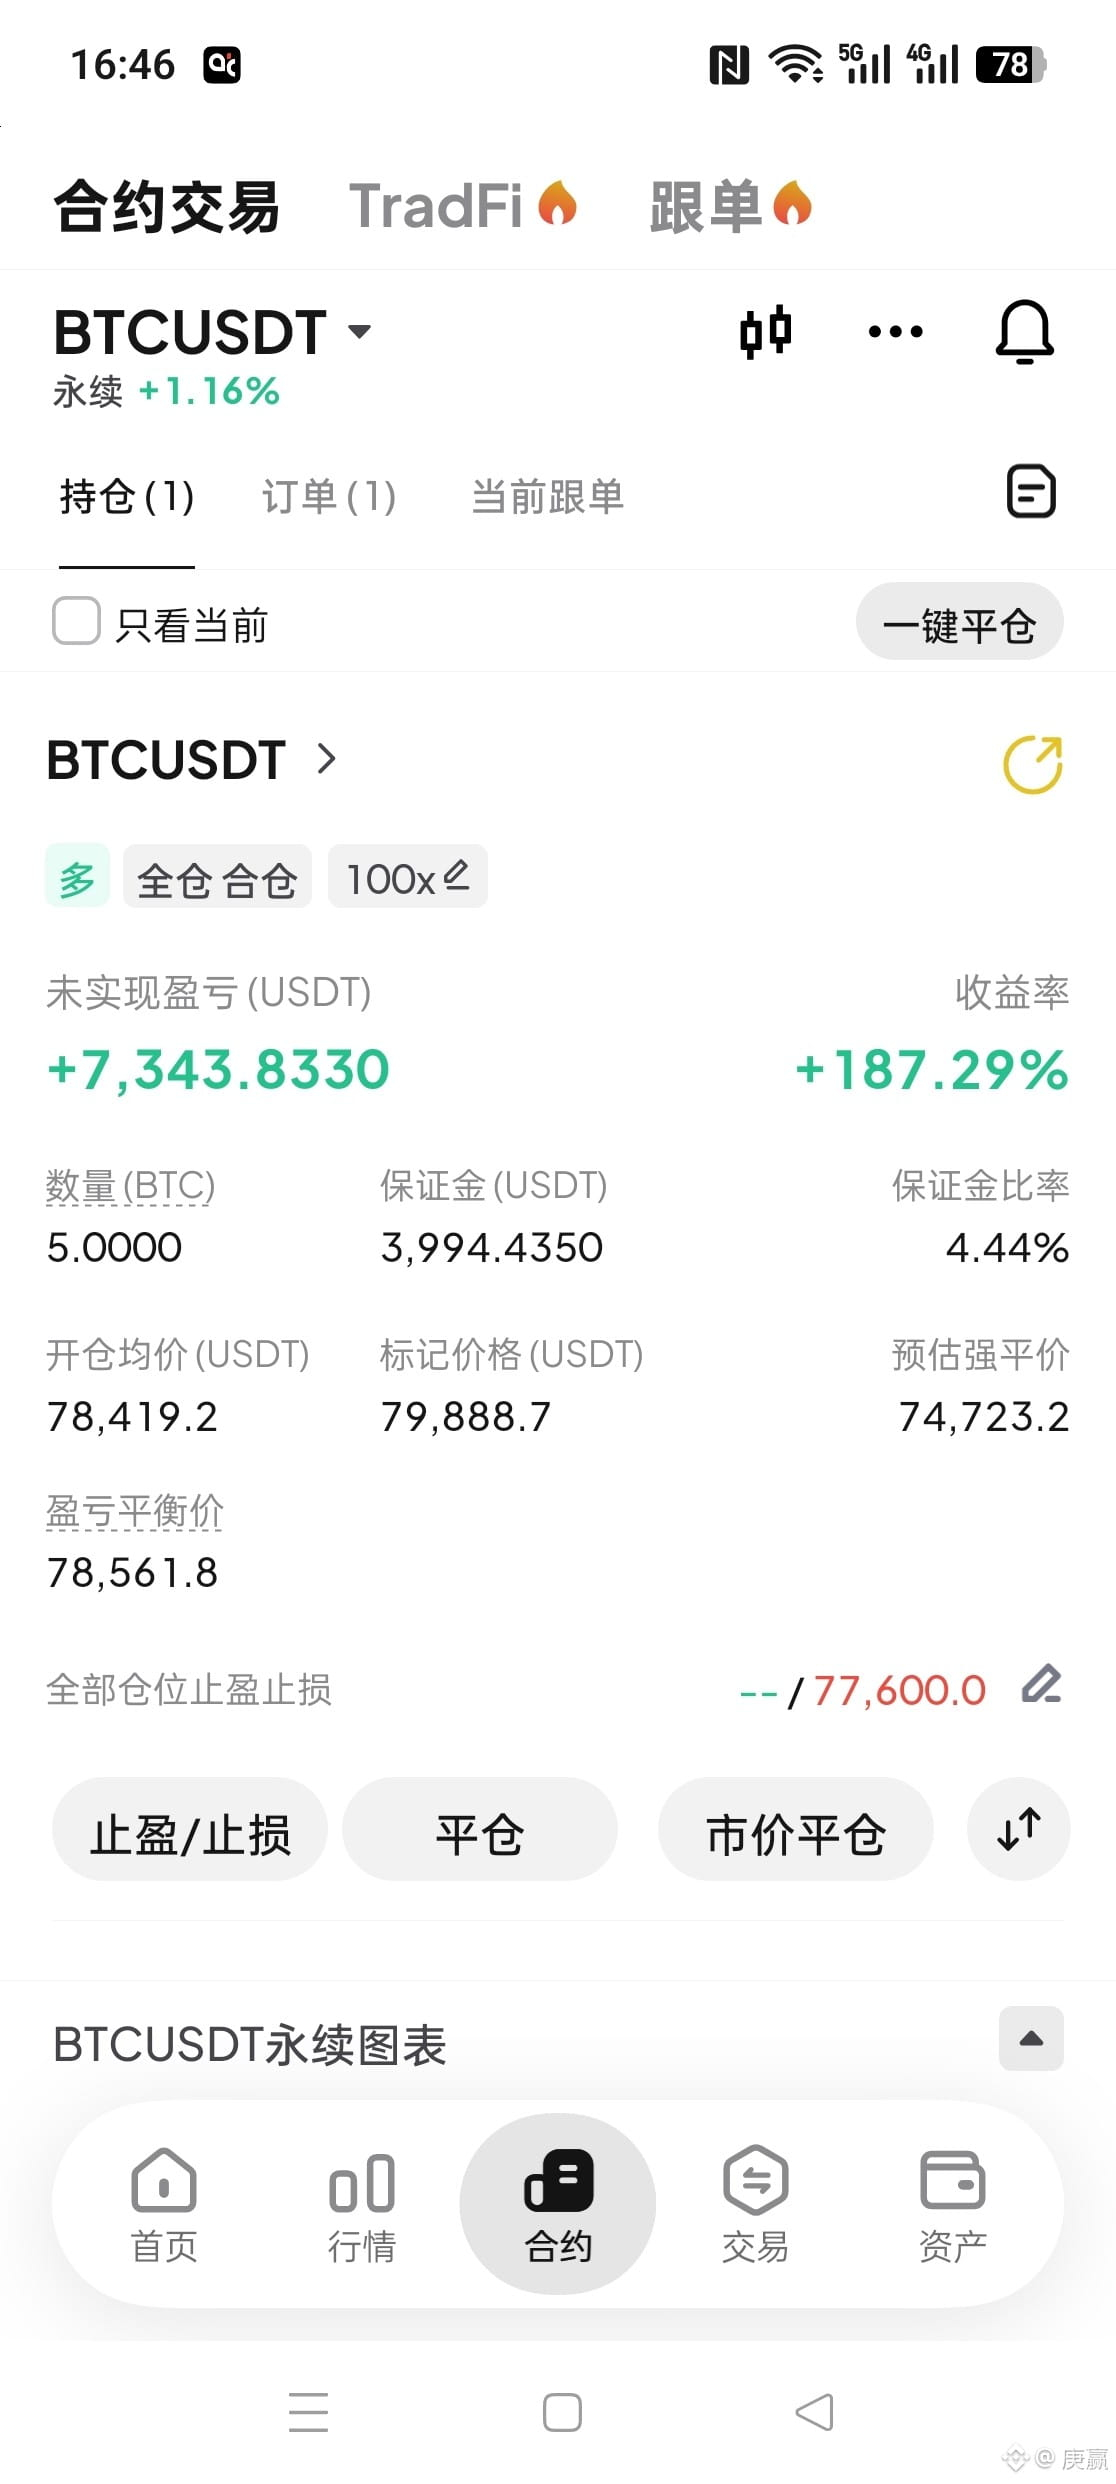
Did everyone hear the reminder this morning? If you’ve survived this pullback, you escaped a great danger—good fortune is sure to follow!$BTC #中国反对美国拟加征7.5%关税
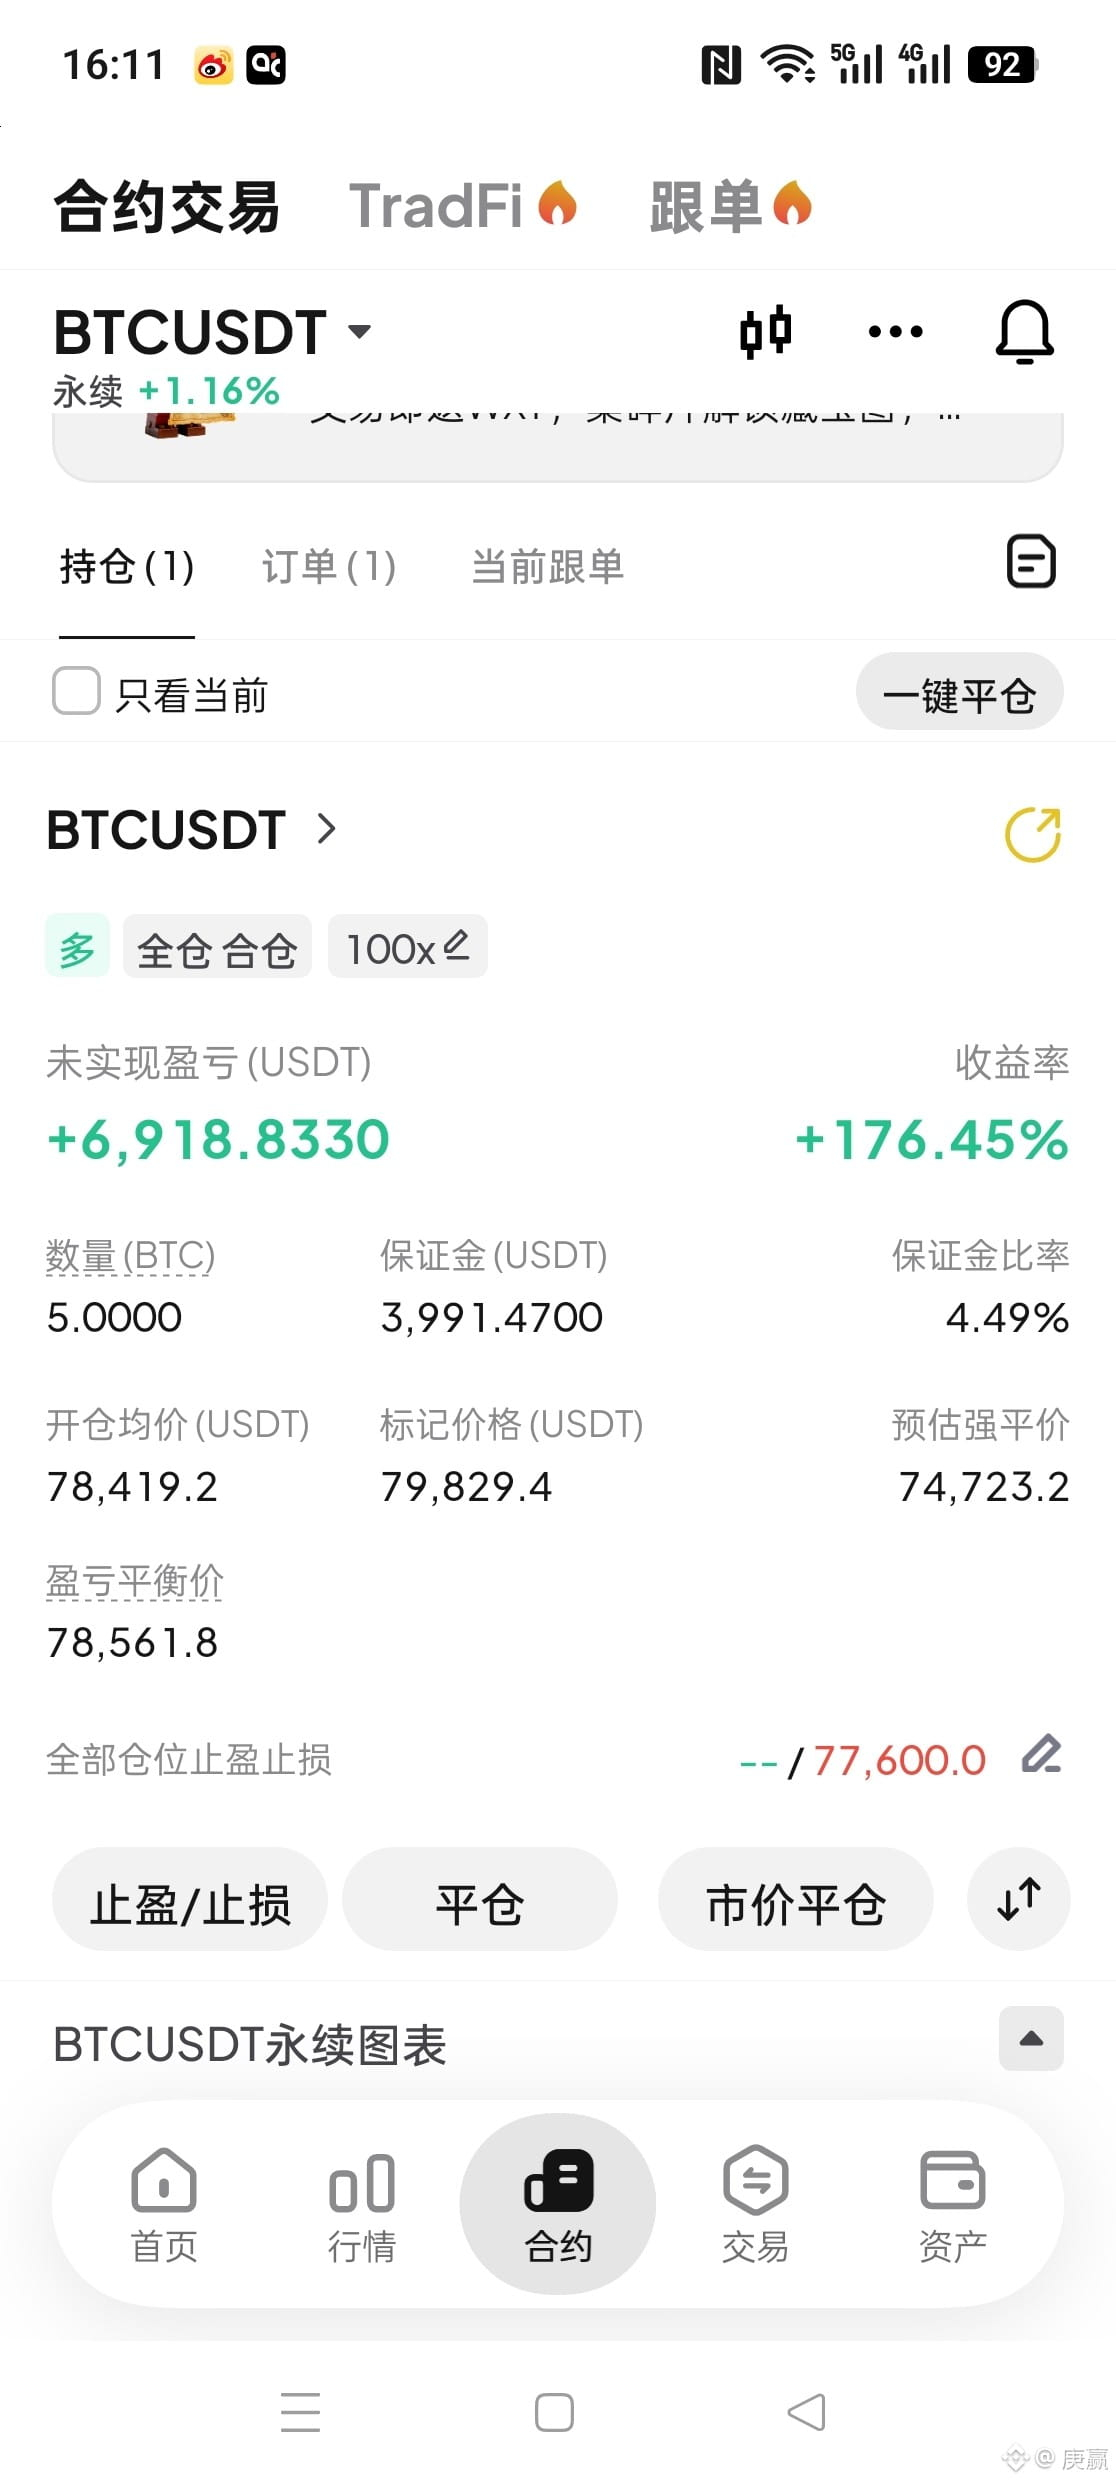
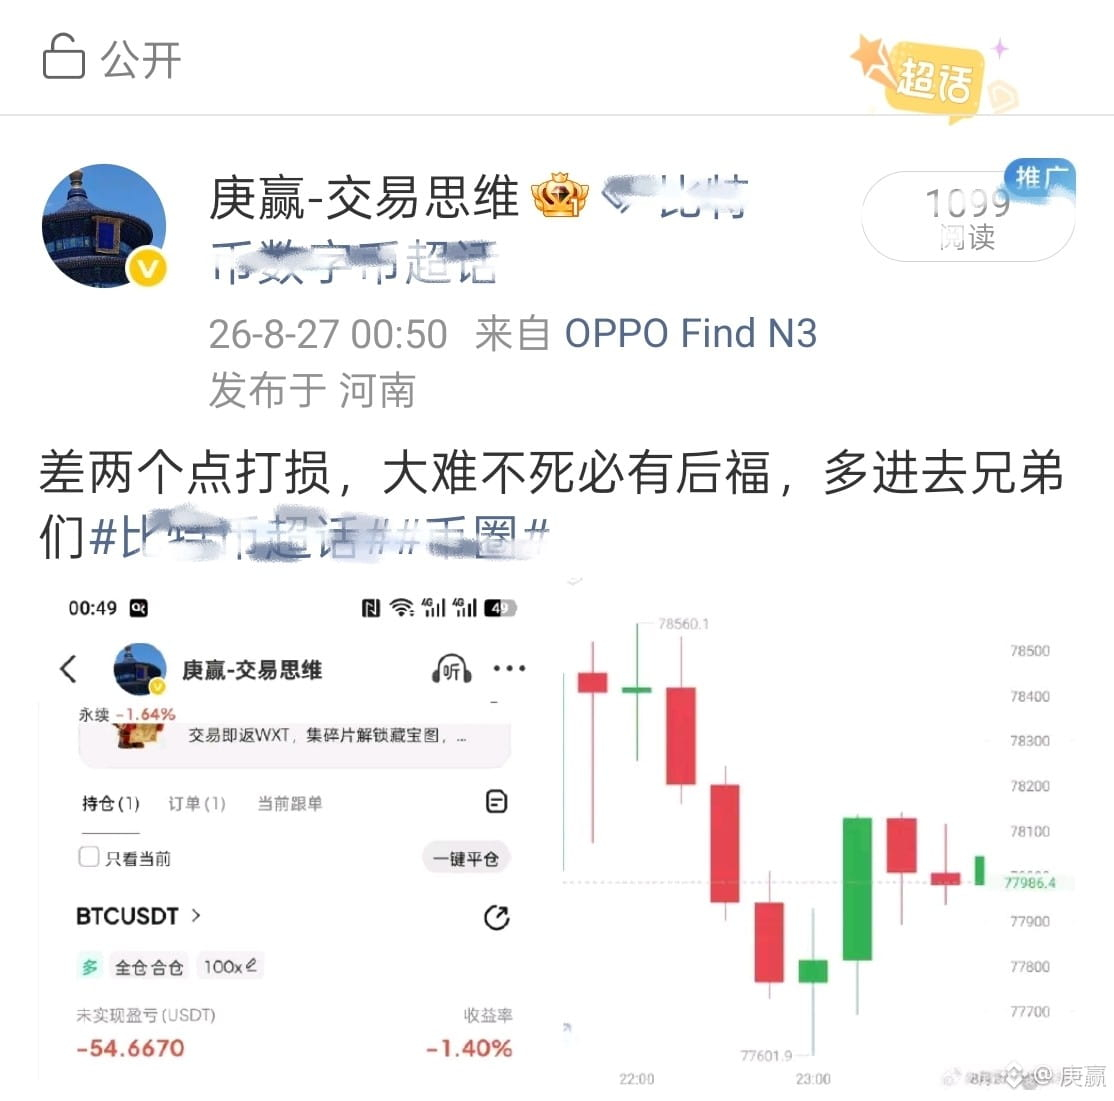
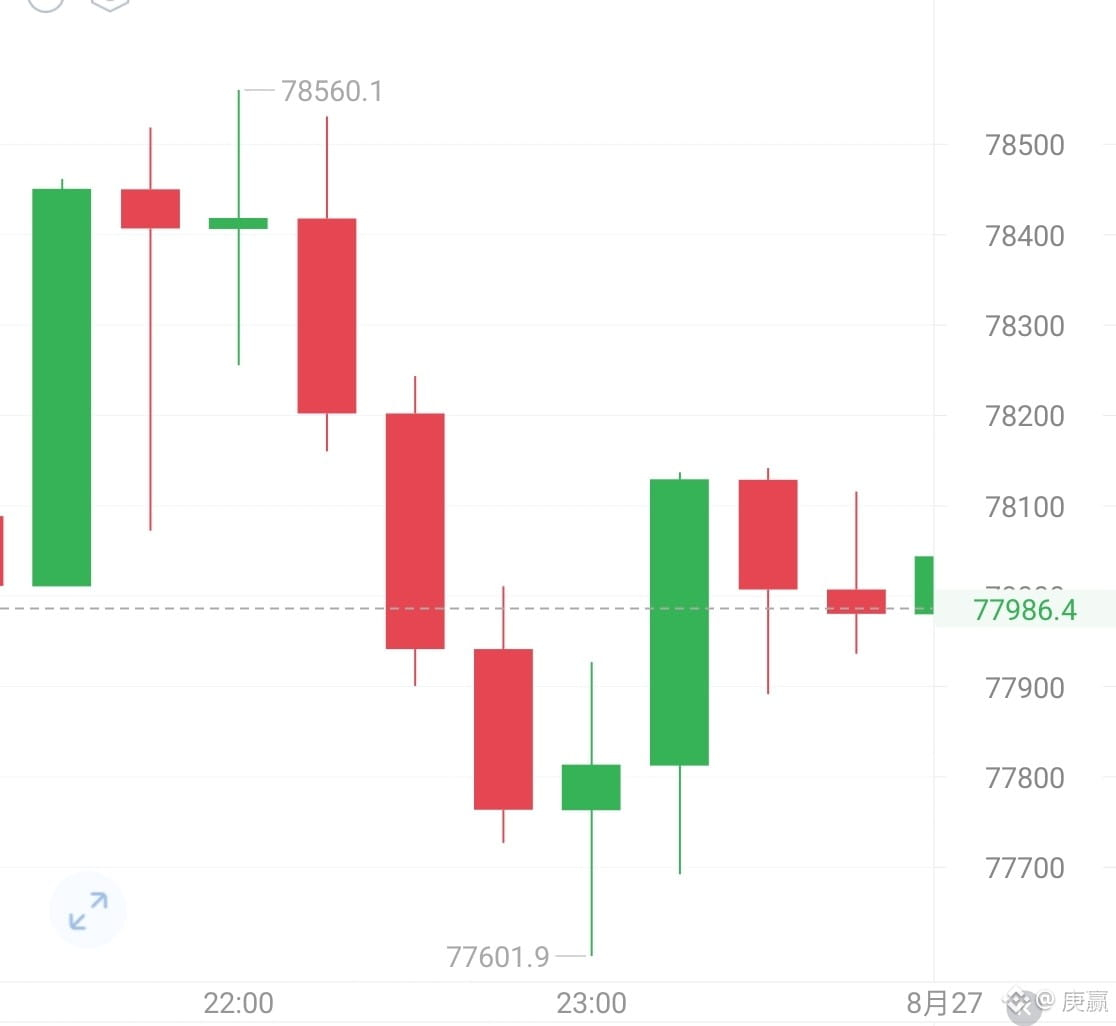
We missed it by two points and got hit hard, but we survived—there must be blessings after such a near miss. Big brothers who got in more 😂$BTC #SEC向白宫提交加密托管规则提案
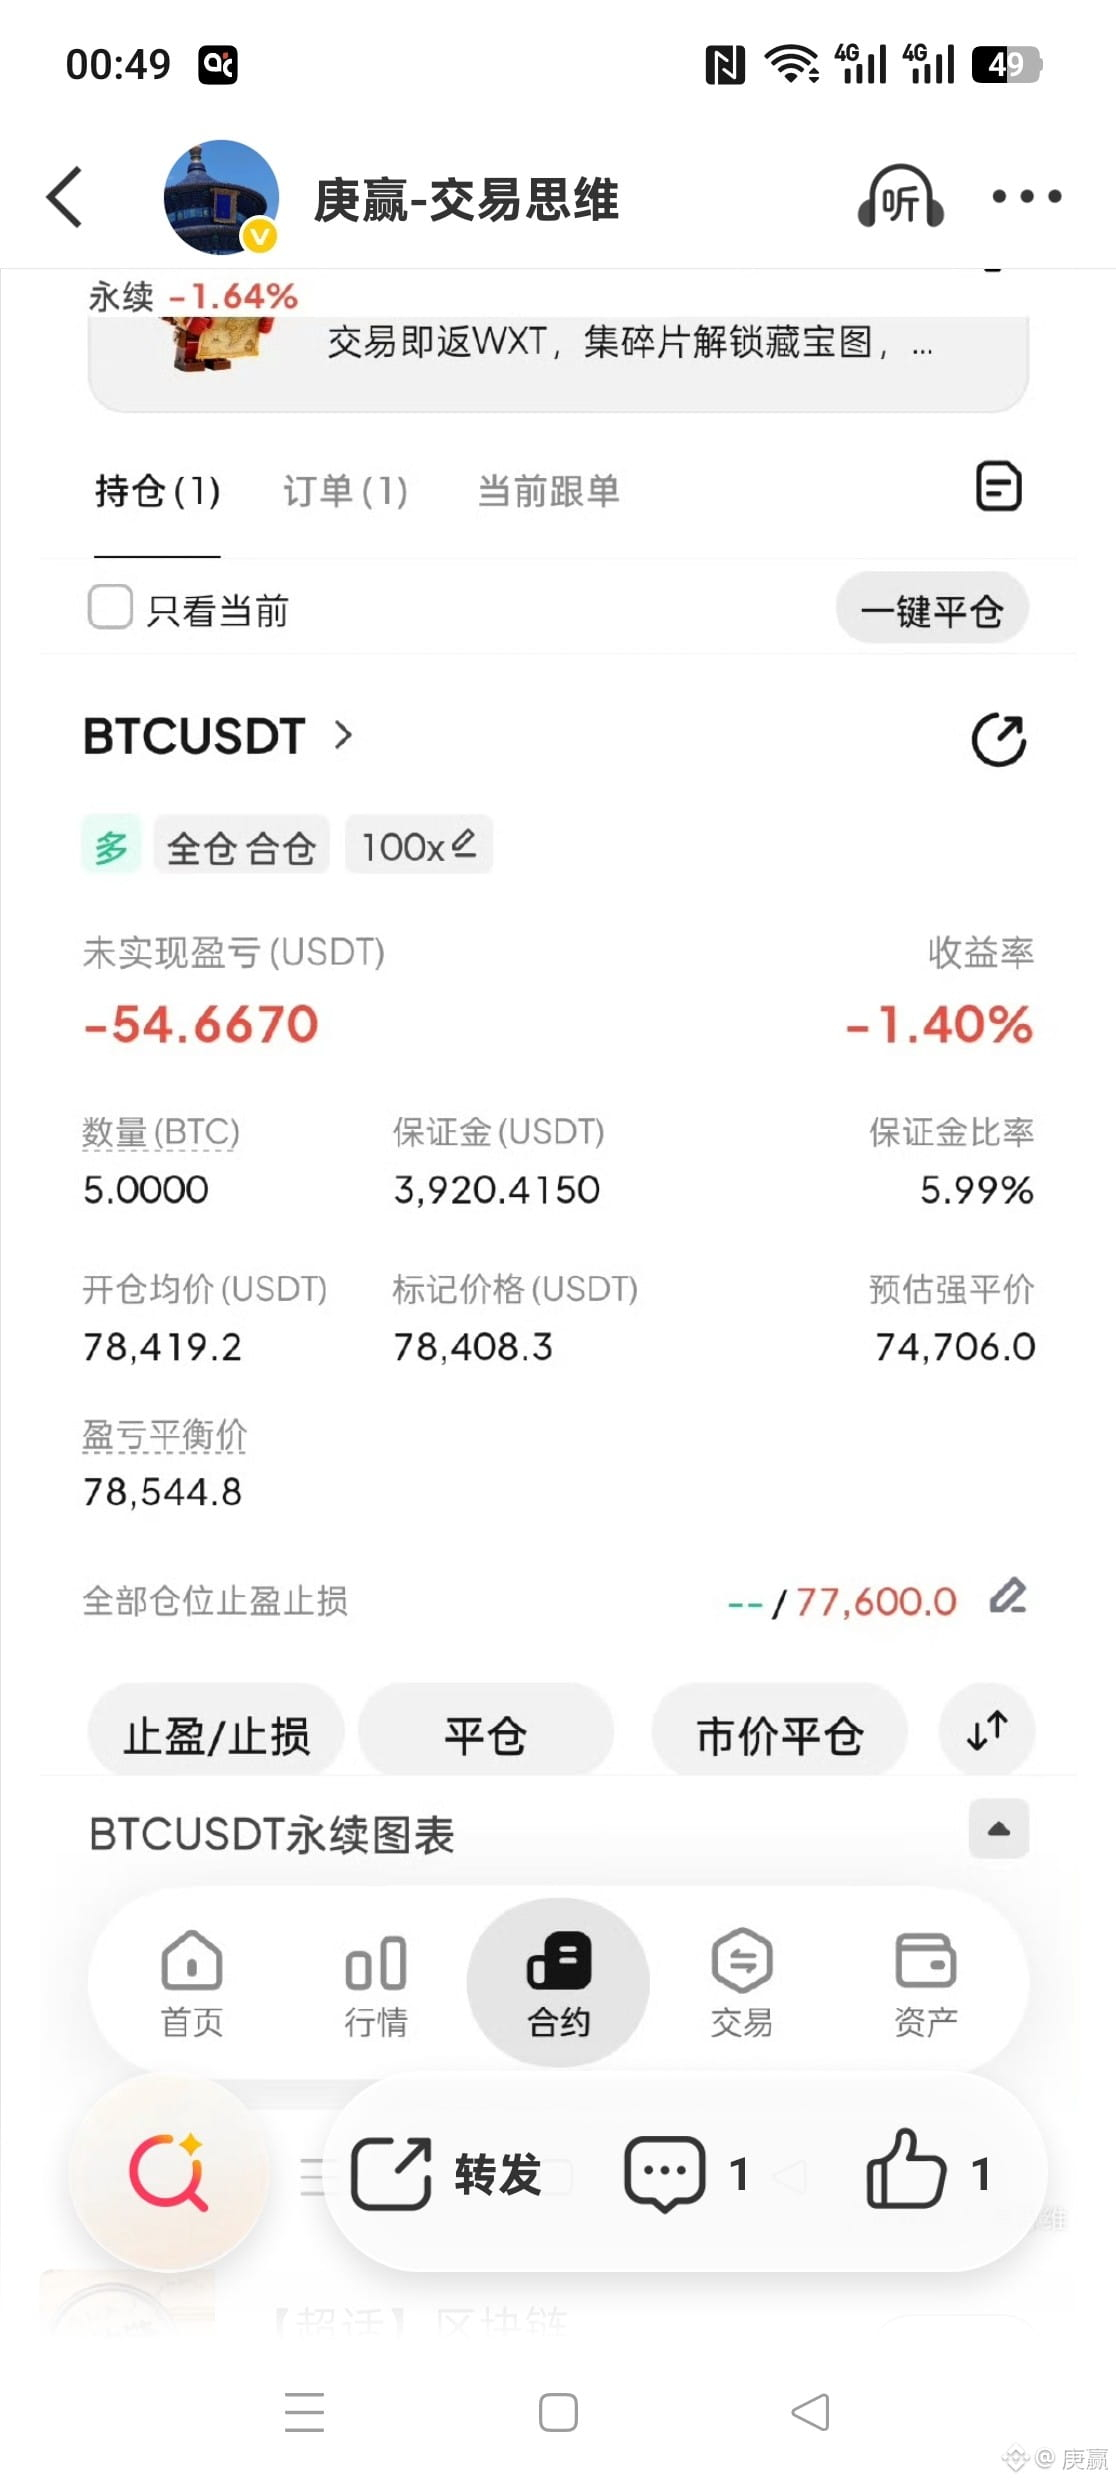
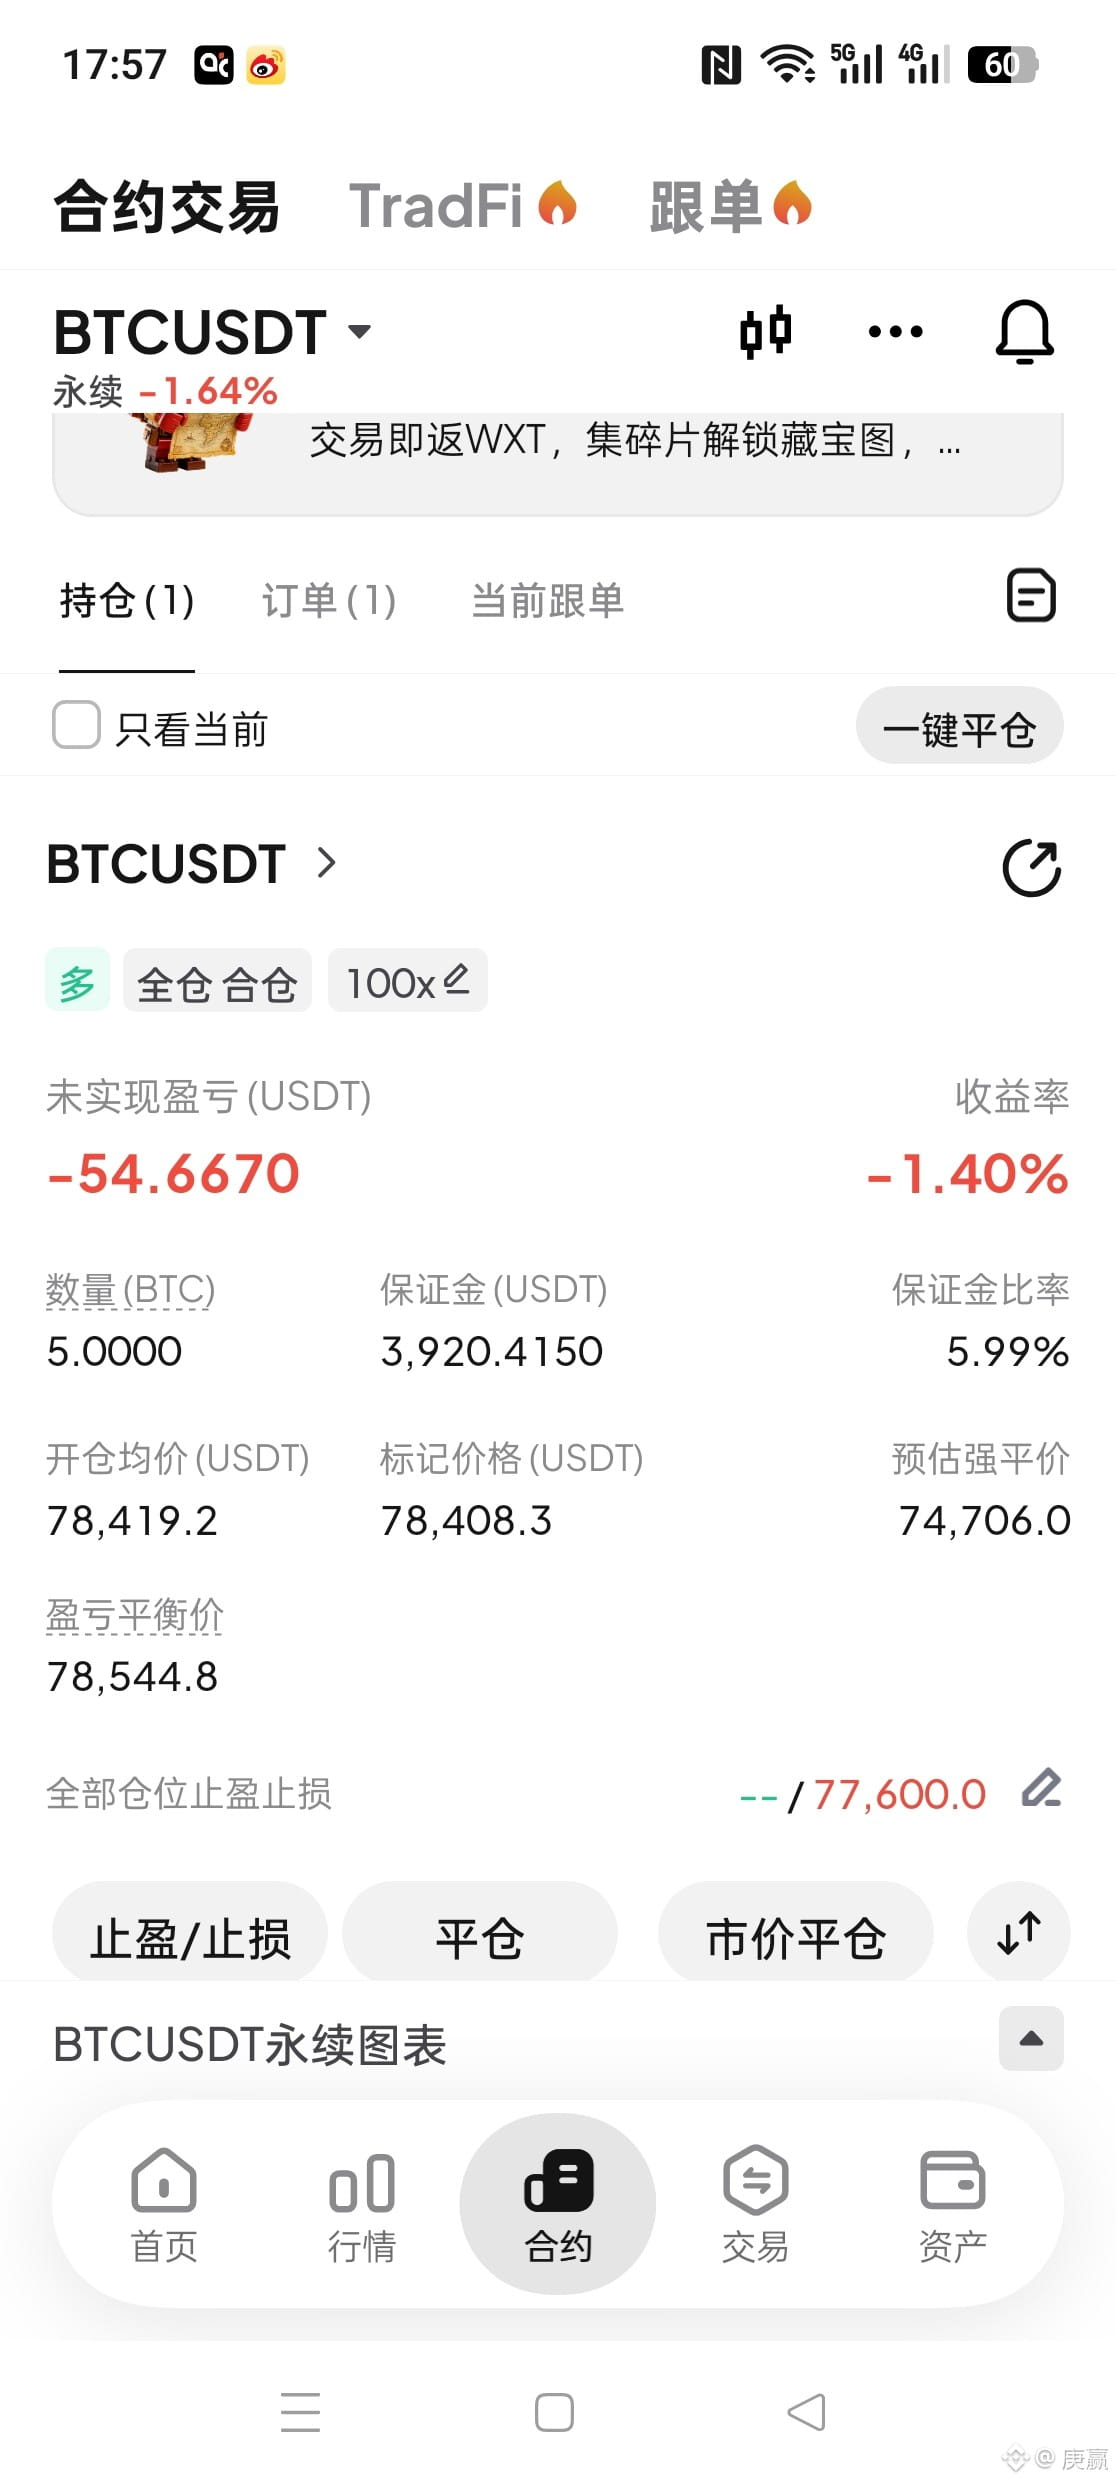
Continue to look above 80000, and I will first test the 500-point space for everyone, $BTC #美伊据报达成停火共识
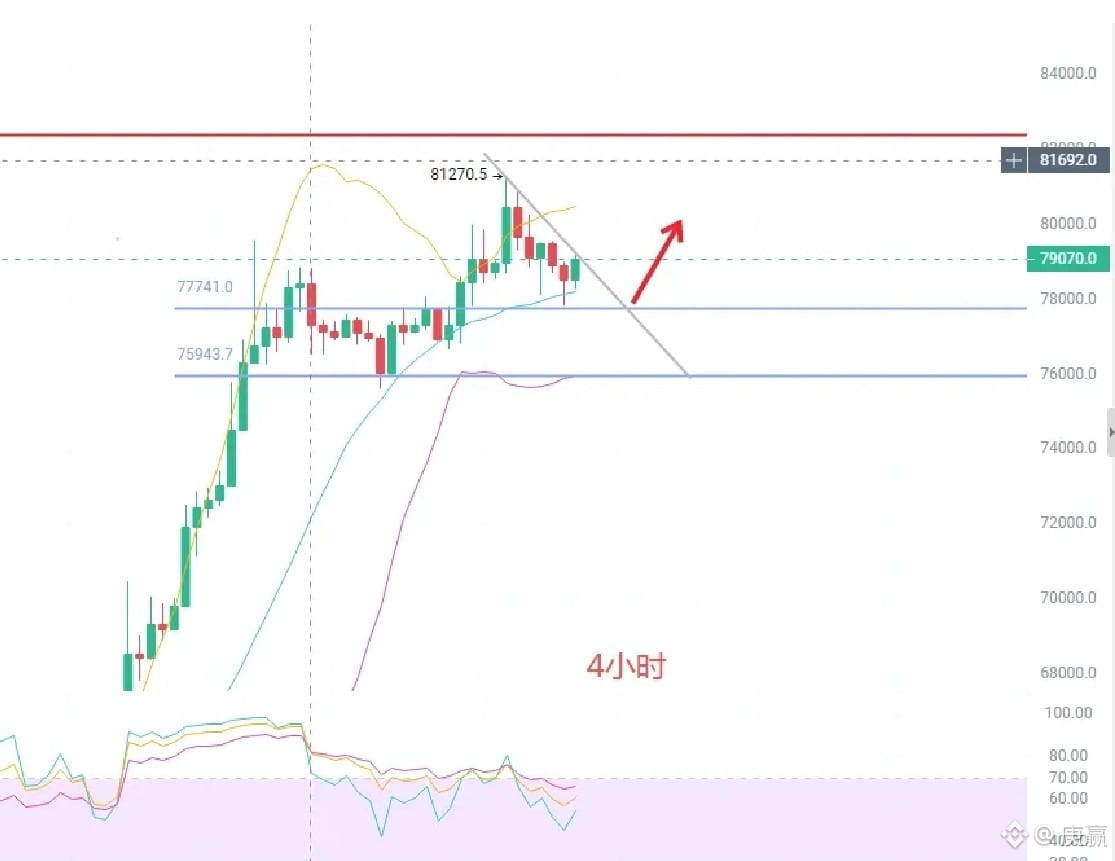
On Wednesday, August 26, the day after Big Cake surged to a new high, broke above and then encountered selling pressure at the start of the European session, pulling back. During the day it consolidated around the 79,000 level.
U.S. spot ETF inflows have been net positive for several days. Institutional buying has stepped in, and short liquidations have helped drive the rise. However, daily indicators are overbought and market sentiment is greedy. At higher levels, profit-taking sell pressure has intensified, increasing disagreement in the market and weakening one-direction momentum.
The bigger trend remains biased bullish. In the short term, it’s not advisable to chase the rally; more prudent would be to wait for a pullback, then look for low entries after key support stabilizes.$BTC #美国加密股指数涨5.04%
U.S. spot ETF inflows have been net positive for several days. Institutional buying has stepped in, and short liquidations have helped drive the rise. However, daily indicators are overbought and market sentiment is greedy. At higher levels, profit-taking sell pressure has intensified, increasing disagreement in the market and weakening one-direction momentum.
The bigger trend remains biased bullish. In the short term, it’s not advisable to chase the rally; more prudent would be to wait for a pullback, then look for low entries after key support stabilizes.$BTC #美国加密股指数涨5.04%
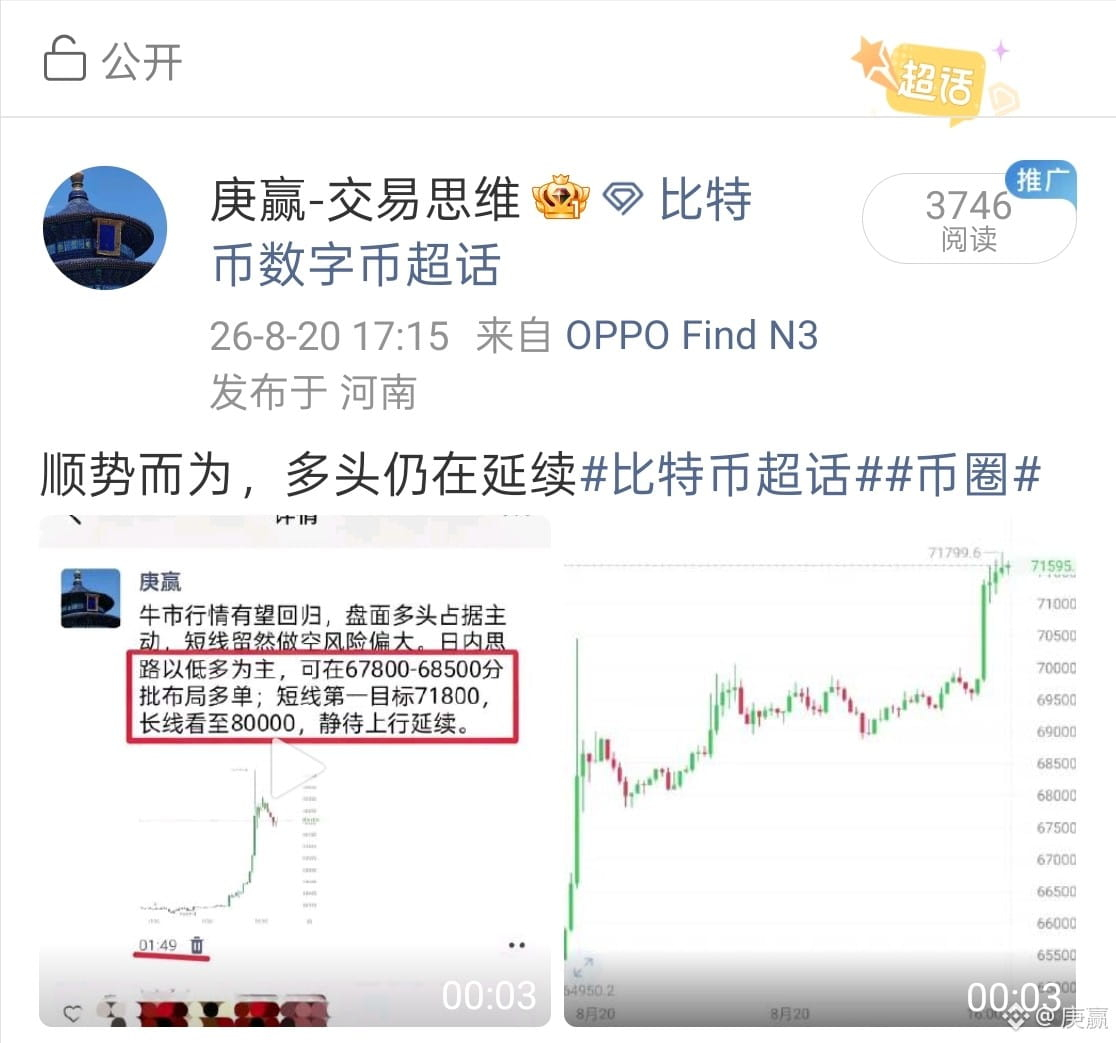
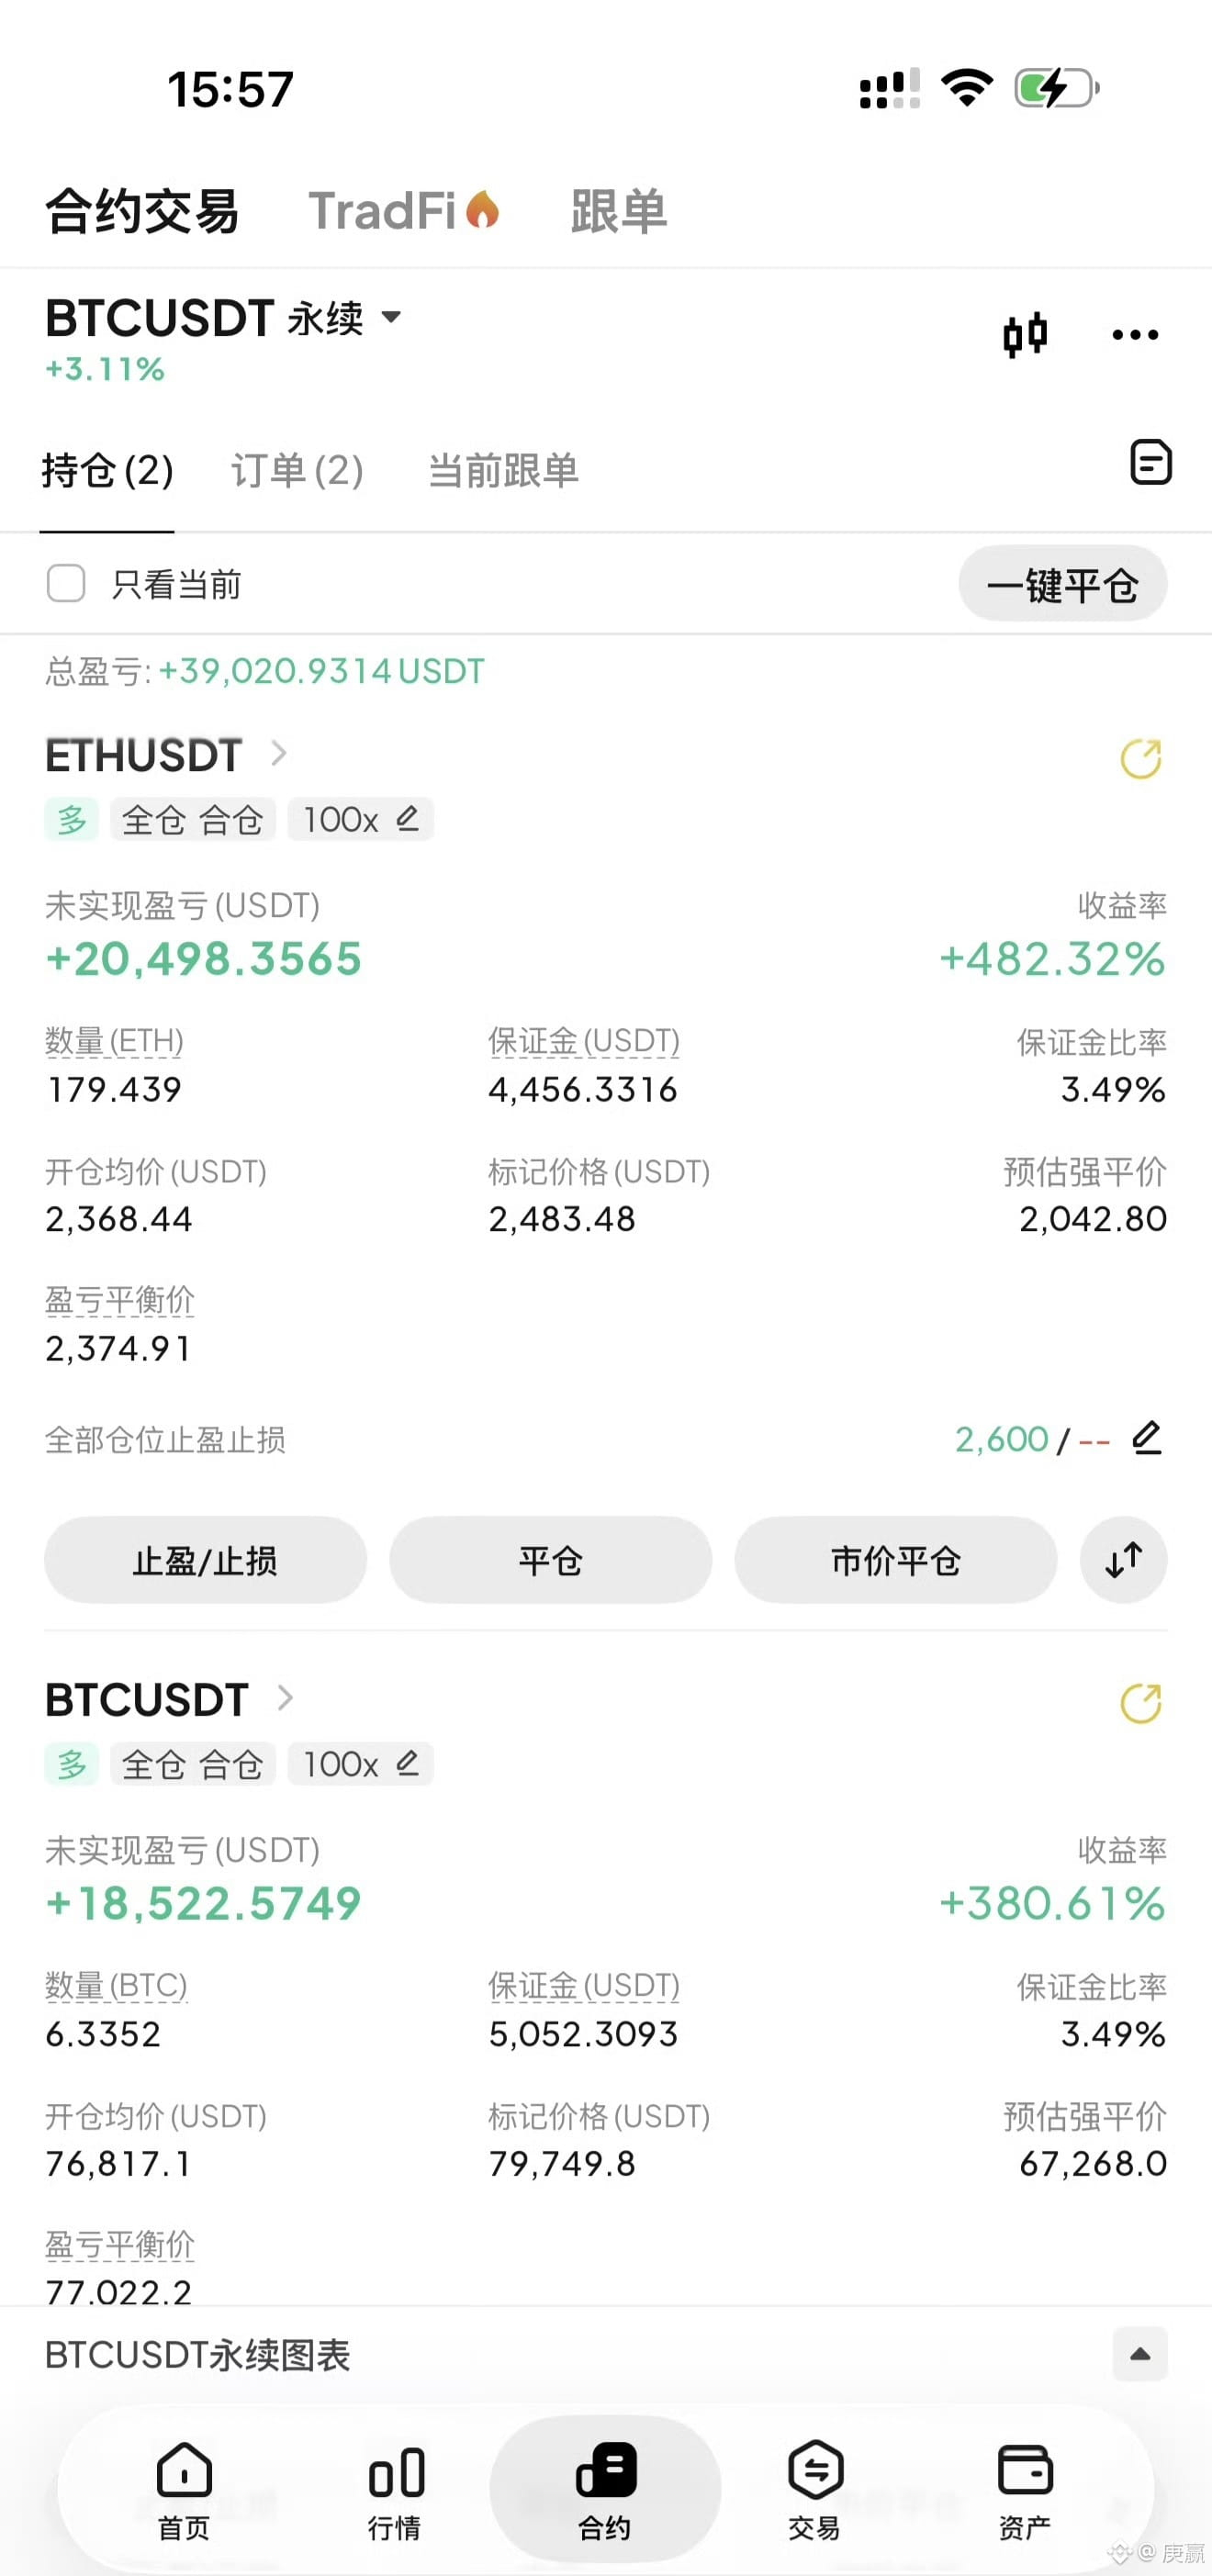
Recently, the market has continued to move upward. Looking back at the views previously shared, the northbound allocation strategy has always been maintained, and the trend logic has not changed. $BTC #BTC触及80000美元
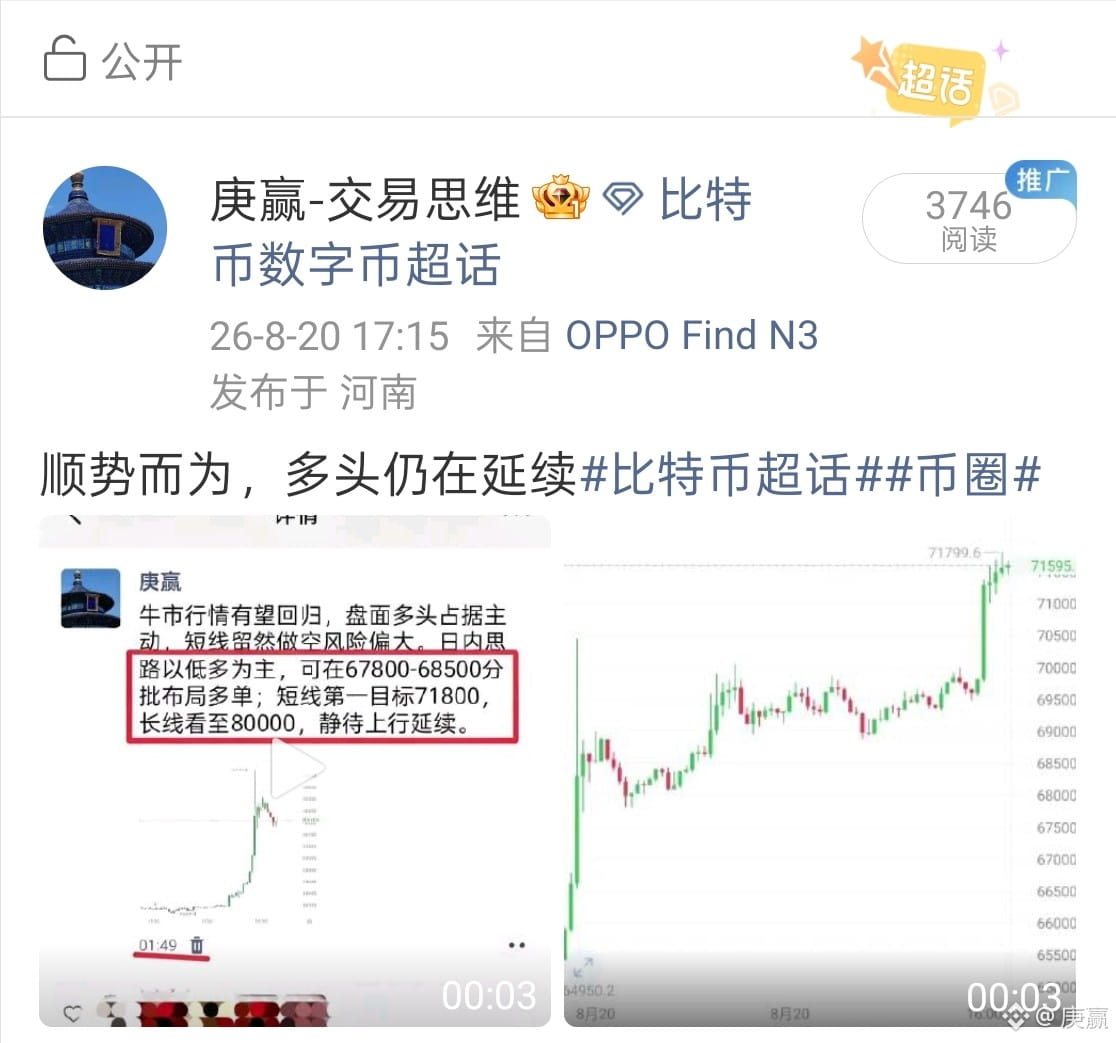
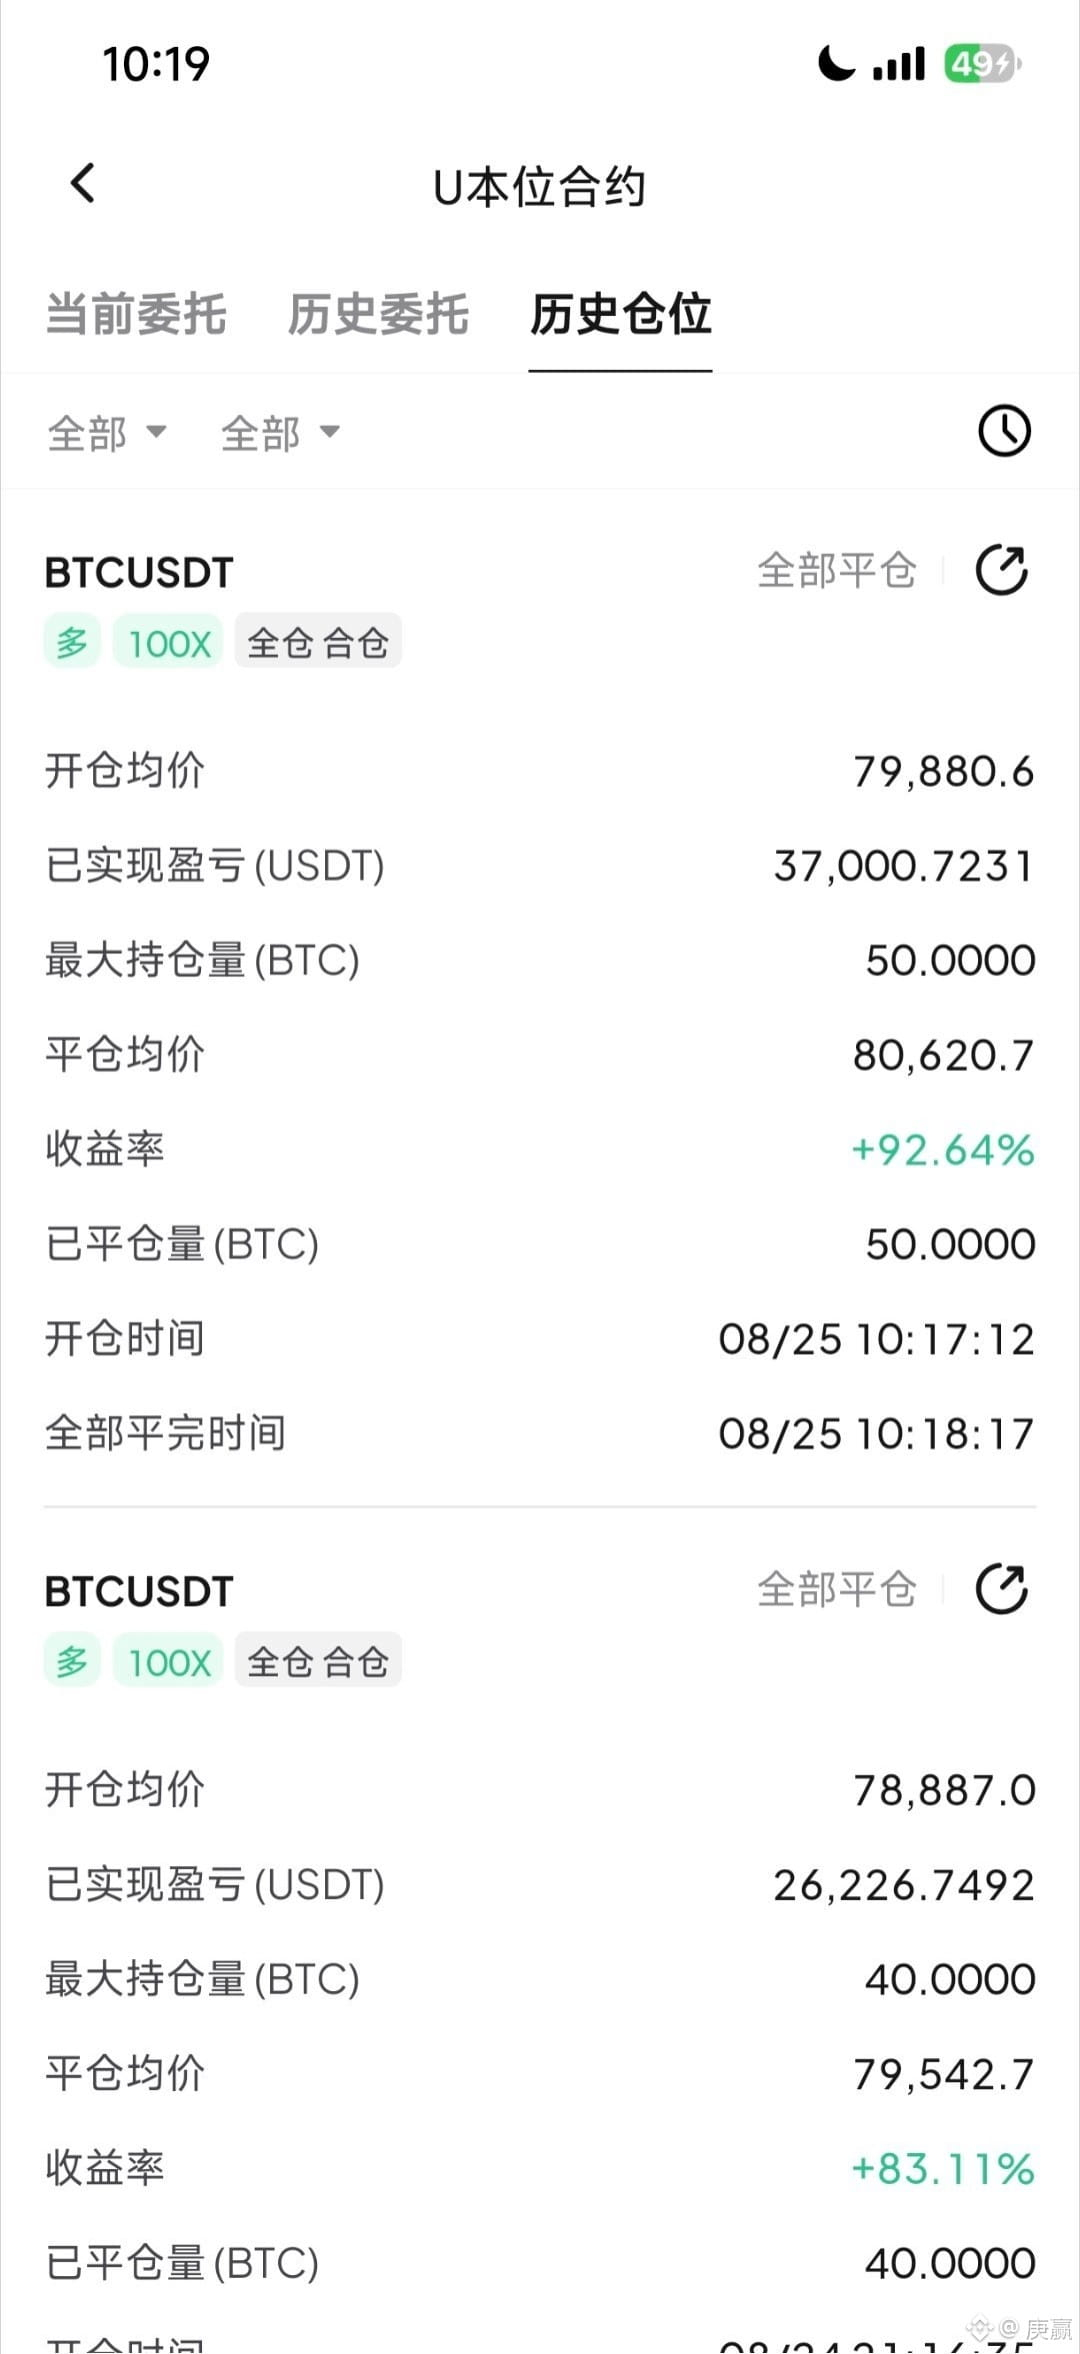
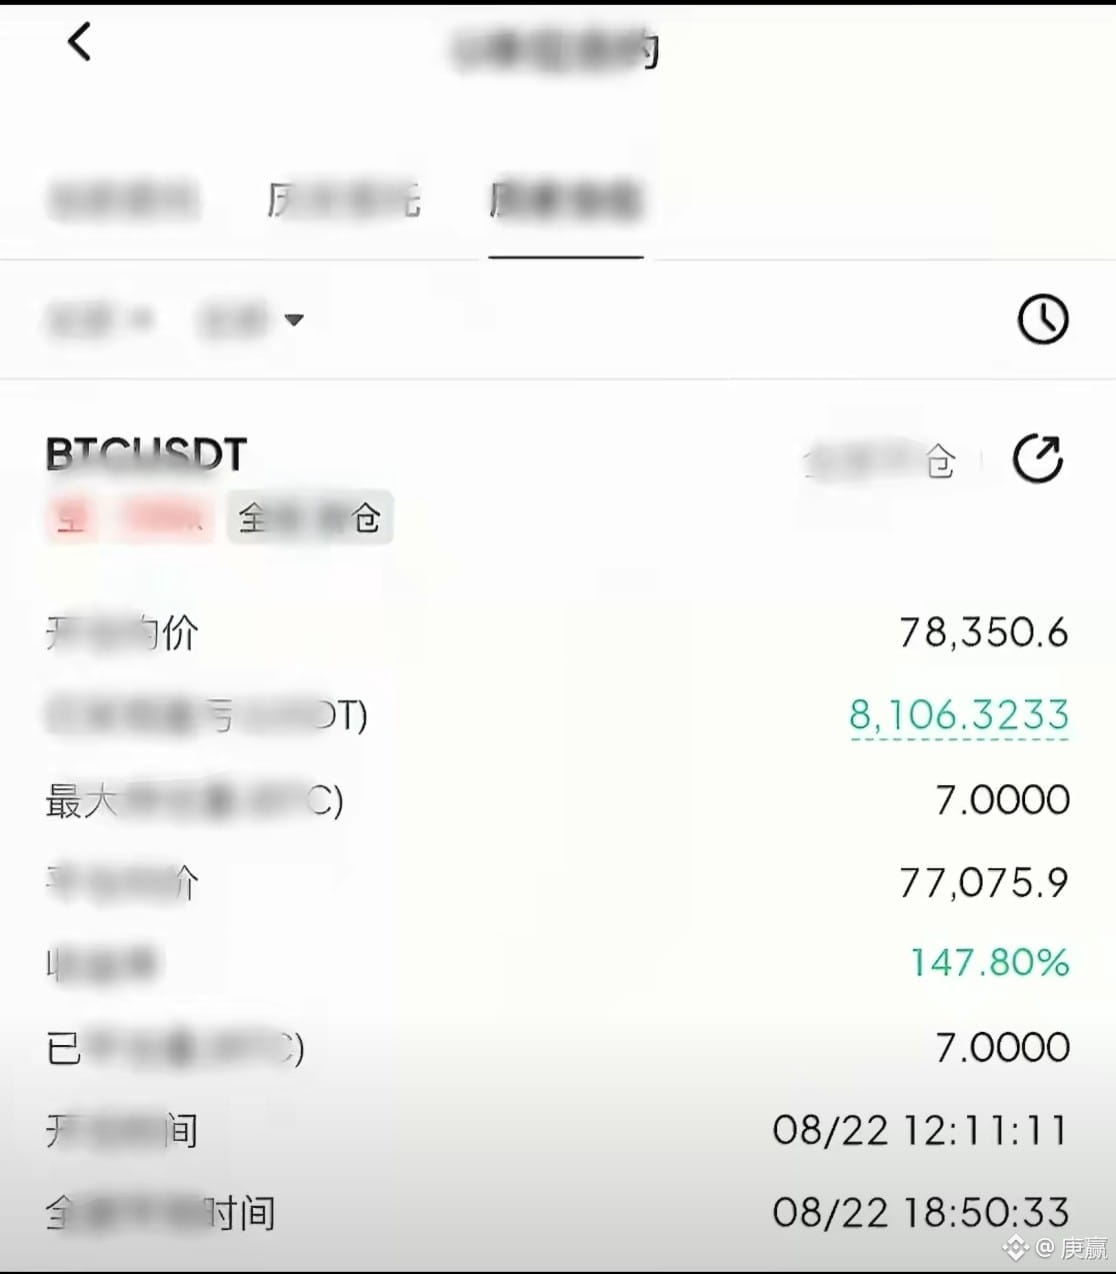
Market continues northward, and now sees a slight pullback. You’re welcome to discuss and explore the outlook going forward.$BTC #Anthropic据报IPO或超SpaceX纪录

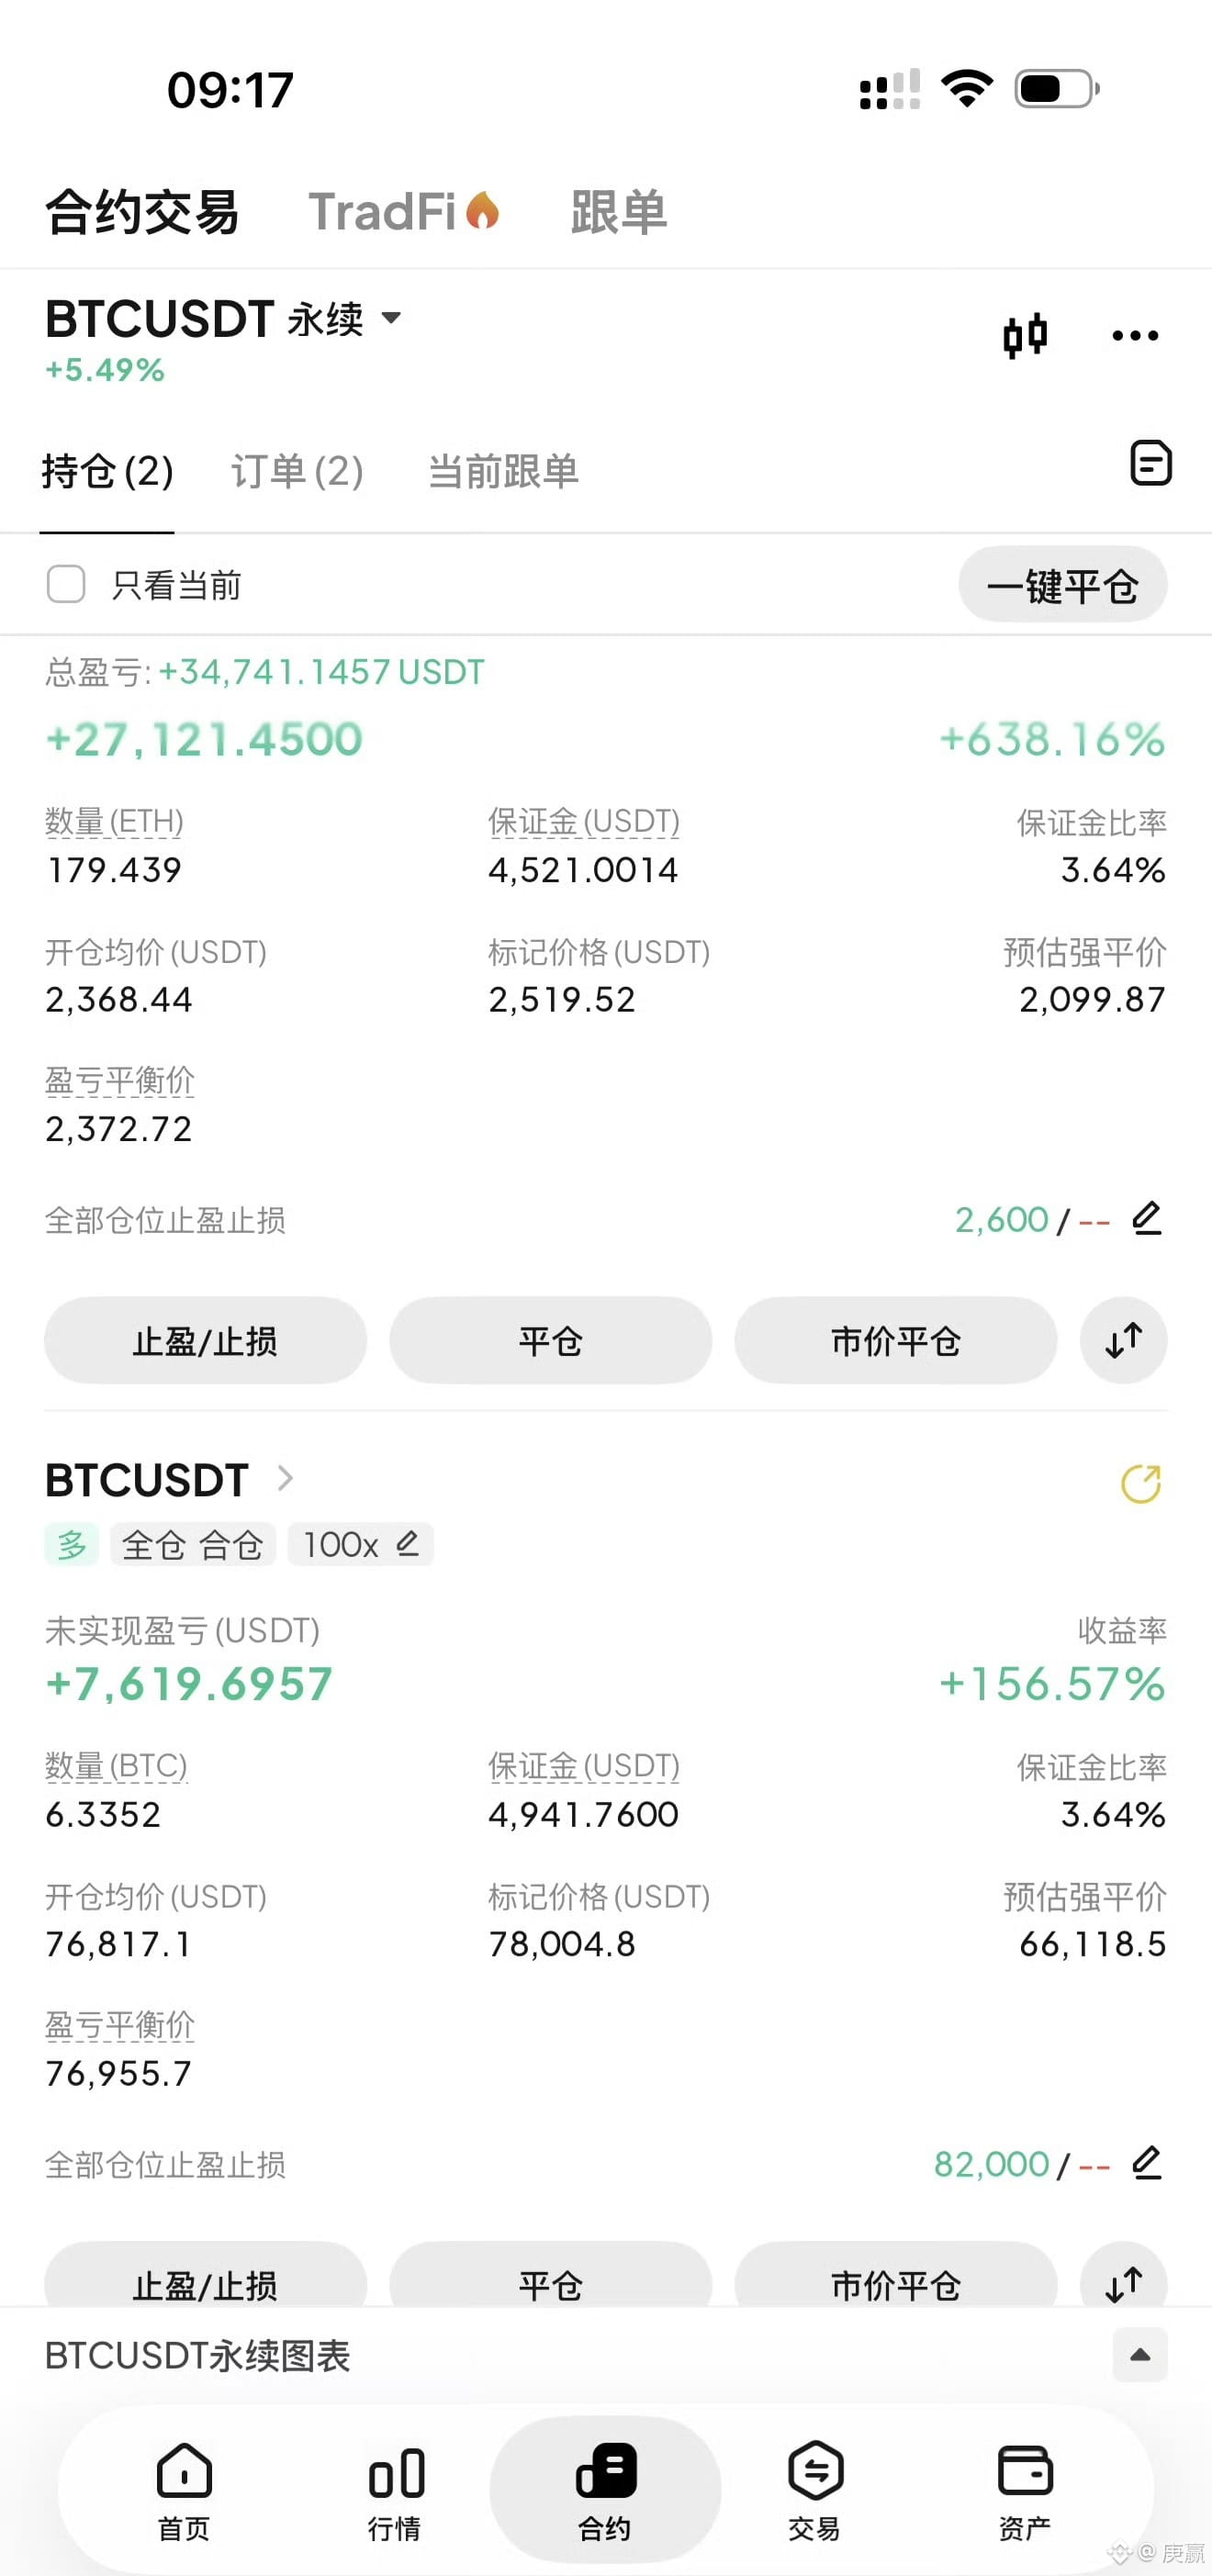

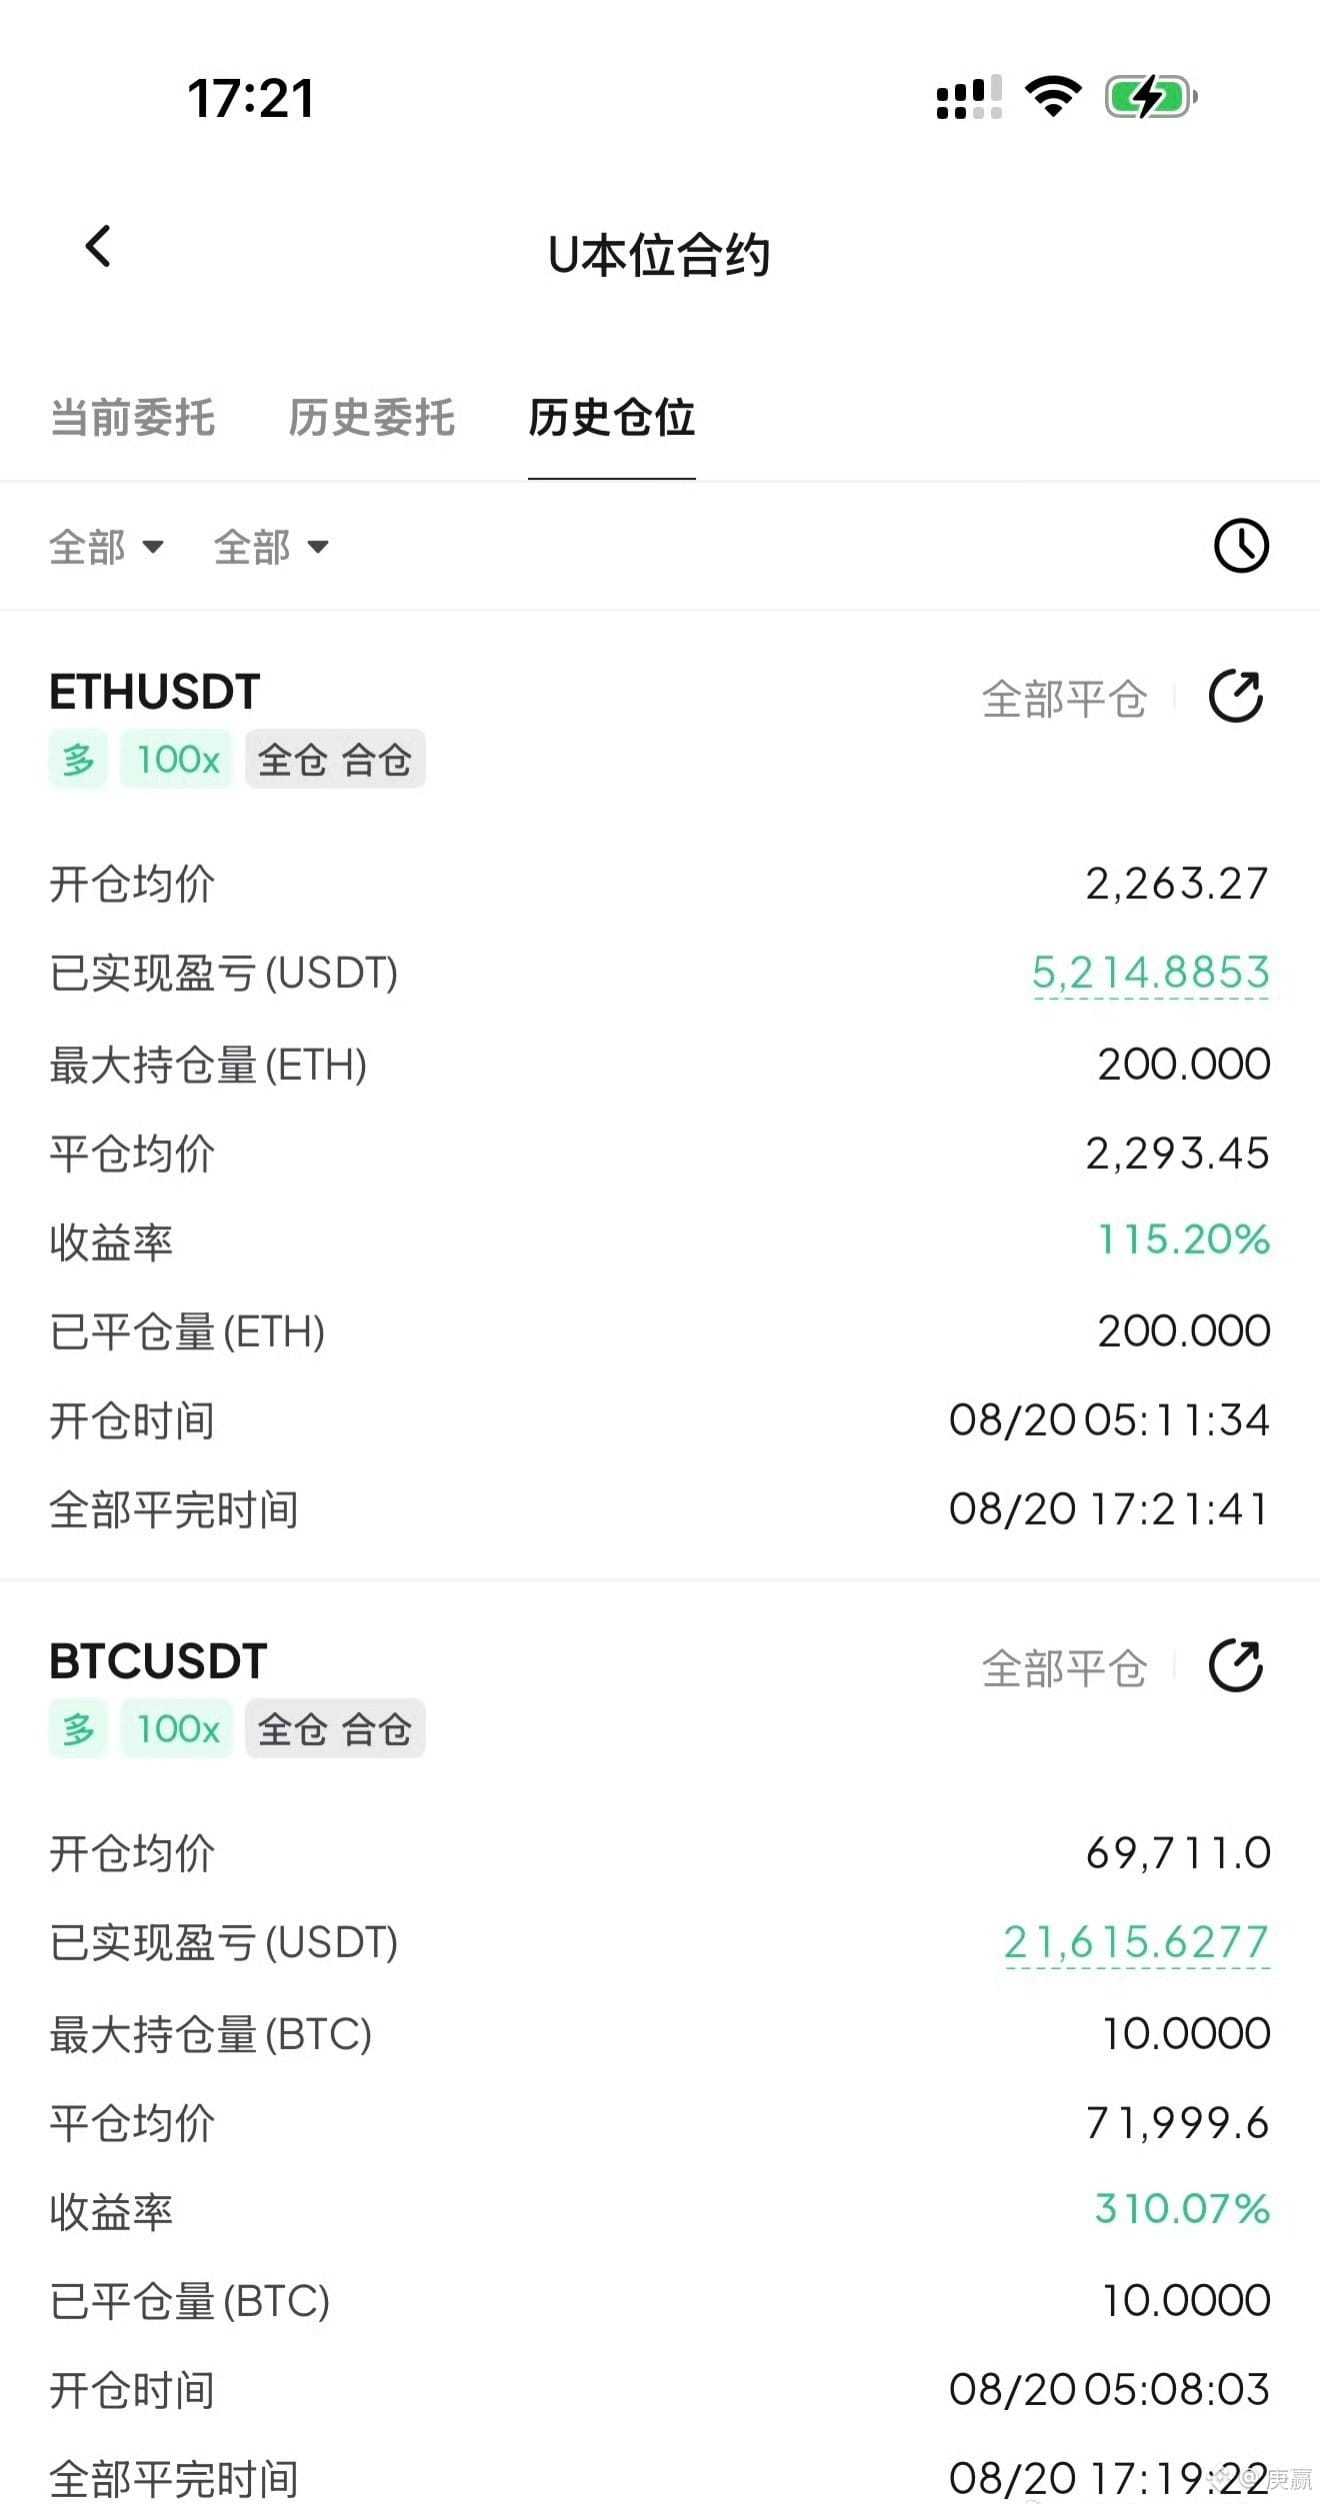
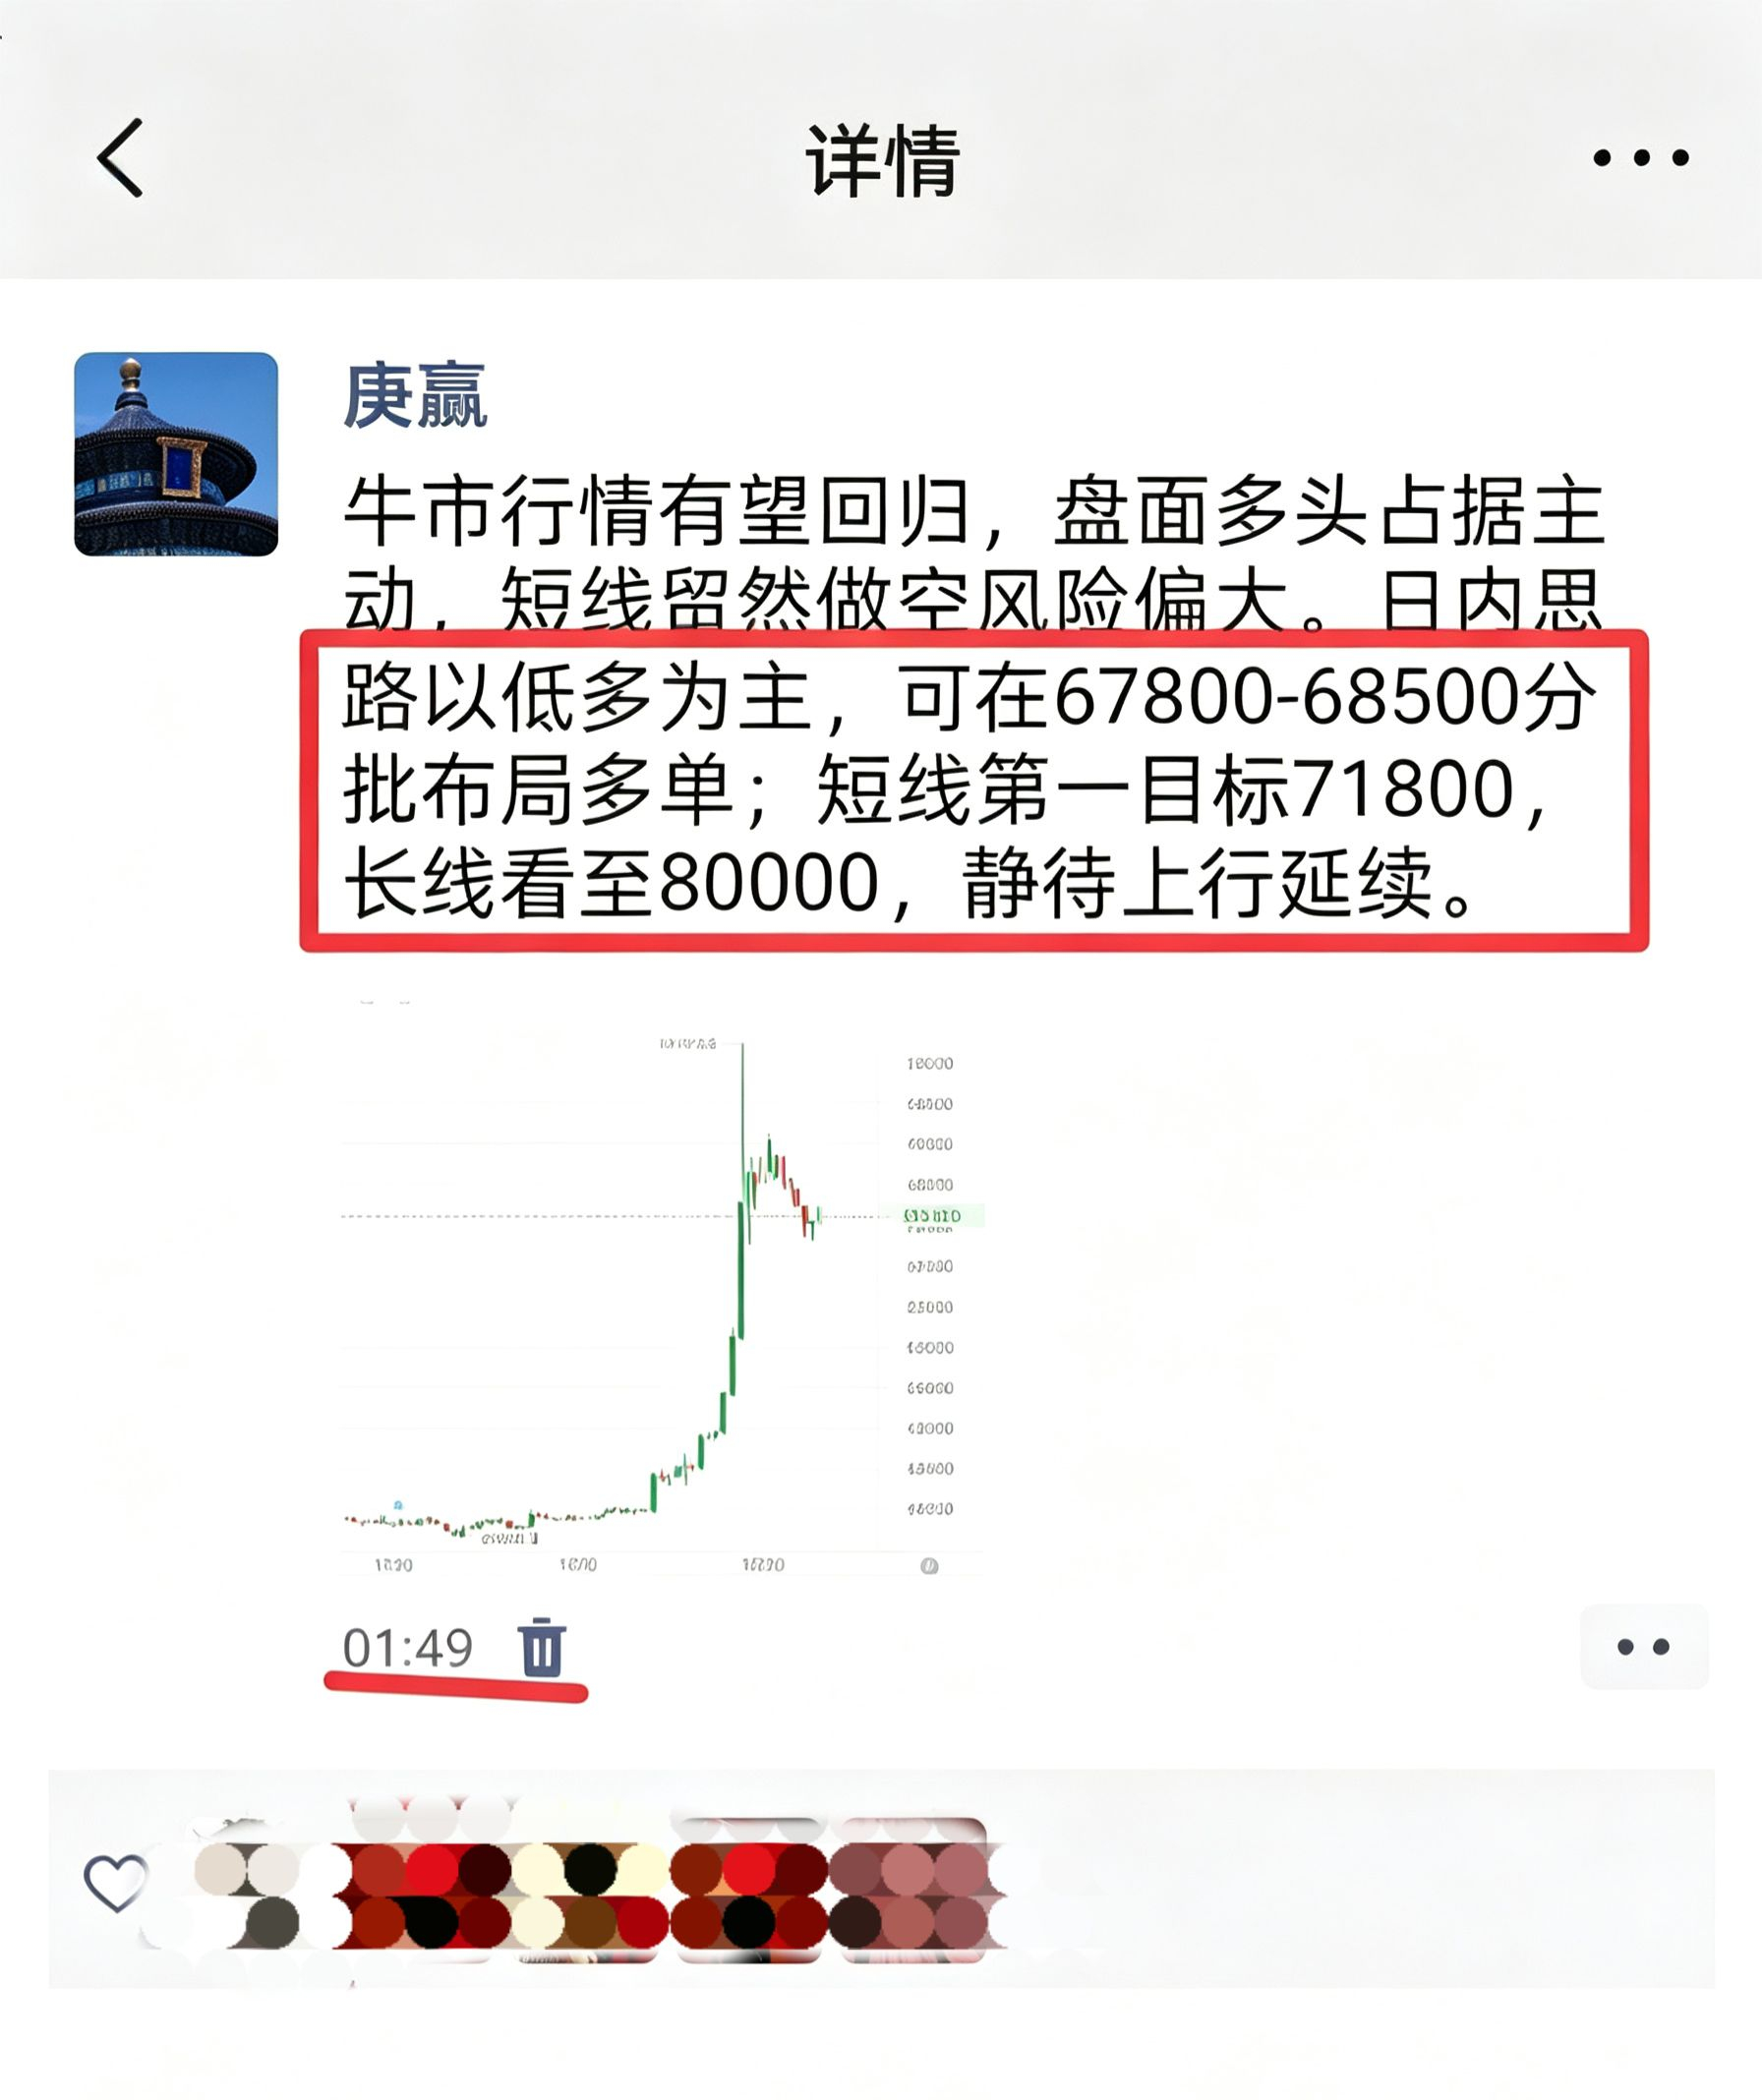
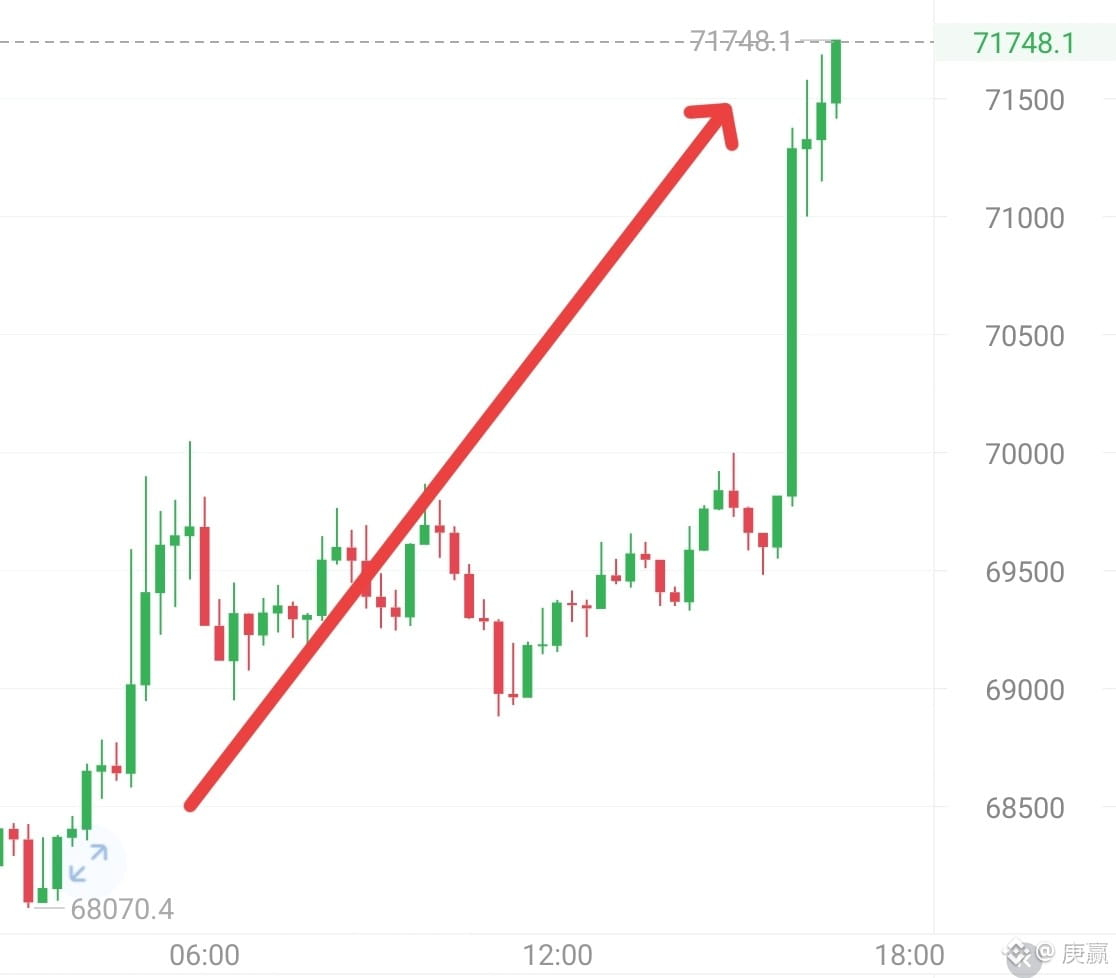
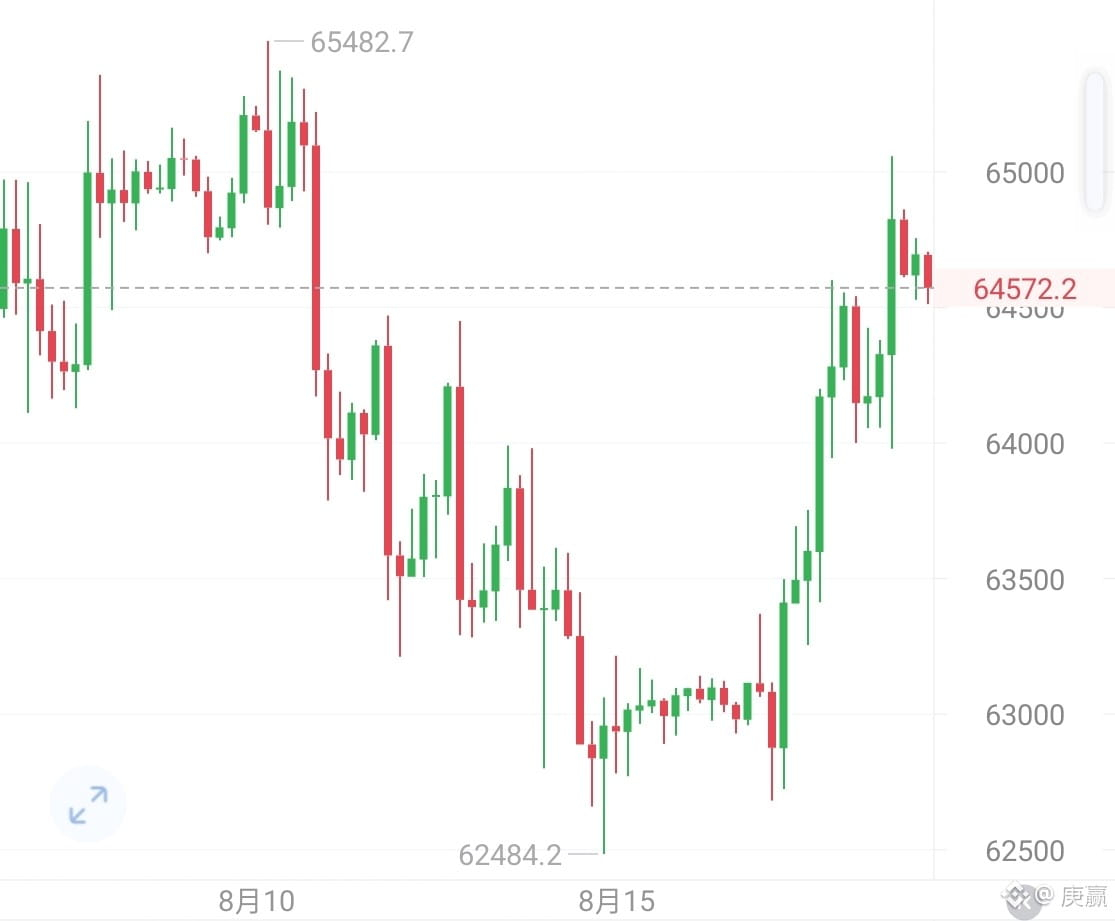
Bitcoin current price 64500. The current range-bound market can easily put people in a dilemma: chasing higher prices for fear of getting trapped, while trying to bottom out worries about further downside. Frequent emotion-driven trading makes it easy to repeatedly stop out. In a ranging market, never follow the direction you subjectively judge based on short-term price rises or falls.
On the four-hour chart, price has stabilized above the short-term EMA line(s), and the moving averages are in a bullish alignment. The Bollinger Bands are opening slightly upward, with price pressing near the upper band under resistance. The MACD forms a golden cross and the red histogram bars expand, giving the short-term bulls an advantage; however, the price is positioned relatively high and there is a need for a pullback. Strong resistance lies at 65700–66000, the previous highs. If it fails to break through, it is prone to pull back. Key support below is 63600 (the Bollinger middle band). If this level holds, the short-term rebound structure can continue; if it breaks, the rebound would be invalid.
Short-term ideas:
Pull back to 63500–63900 to look for longs; stop loss 500 points; target 65400–66000
On a rebound to 65700–66000, look for shorts; stop loss 500 points; target 64200–63700$BTC #美国要求韩国优先投资存储芯片
On the four-hour chart, price has stabilized above the short-term EMA line(s), and the moving averages are in a bullish alignment. The Bollinger Bands are opening slightly upward, with price pressing near the upper band under resistance. The MACD forms a golden cross and the red histogram bars expand, giving the short-term bulls an advantage; however, the price is positioned relatively high and there is a need for a pullback. Strong resistance lies at 65700–66000, the previous highs. If it fails to break through, it is prone to pull back. Key support below is 63600 (the Bollinger middle band). If this level holds, the short-term rebound structure can continue; if it breaks, the rebound would be invalid.
Short-term ideas:
Pull back to 63500–63900 to look for longs; stop loss 500 points; target 65400–66000
On a rebound to 65700–66000, look for shorts; stop loss 500 points; target 64200–63700$BTC #美国要求韩国优先投资存储芯片
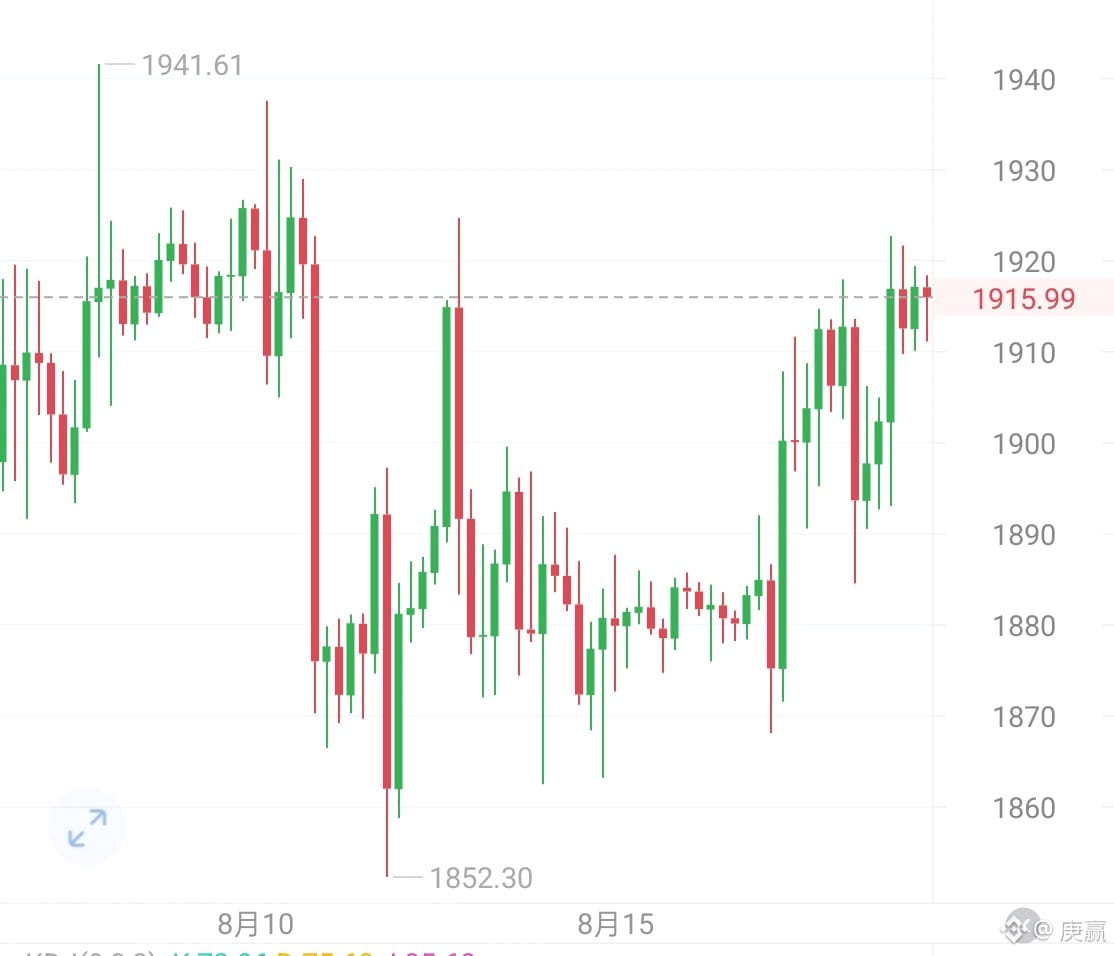
Ethereum current price 1915. The market is currently trapped in a range-bound consolidation, with limited upside and downside potential, making it easy to repeatedly get stopped out. Holding positions can easily put you in a dilemma: going long worries you about a sudden plunge, while going short fears a breakout rally. When there’s no clear direction, frequent trading is likely to get harvested by the price action. In a choppy market, avoid chasing price or selling in panic; prioritize controlling your position size.
On the 4-hour timeframe, price is running above the EMA lines, showing a somewhat strong consolidation pattern. The Bollinger Bands are flat, and price is pressured below the upper band. The overhead zone of 1922-1930 is a strong resistance from prior highs; it has been tested multiple times but has not broken through effectively. The MACD red histogram is not expanding enough, indicating that bullish momentum is gradually weakening.
The lower zone of 1870-1890 is clustered support formed by the Fibonacci 38.2% level plus multiple moving averages. As long as it holds, the bullish structure is likely to continue; a breakdown will trigger a pullback.
Short-term ideas:
Pull back to 1870-1890 to try going long. Stop loss: 50 points. Targets: 1925-1945
On a rebound to 1945-1965, try going short. Stop loss: 50 points. Target: 1900-1885$ETH #比特币永续合约资金费率创20个月新高
On the 4-hour timeframe, price is running above the EMA lines, showing a somewhat strong consolidation pattern. The Bollinger Bands are flat, and price is pressured below the upper band. The overhead zone of 1922-1930 is a strong resistance from prior highs; it has been tested multiple times but has not broken through effectively. The MACD red histogram is not expanding enough, indicating that bullish momentum is gradually weakening.
The lower zone of 1870-1890 is clustered support formed by the Fibonacci 38.2% level plus multiple moving averages. As long as it holds, the bullish structure is likely to continue; a breakdown will trigger a pullback.
Short-term ideas:
Pull back to 1870-1890 to try going long. Stop loss: 50 points. Targets: 1925-1945
On a rebound to 1945-1965, try going short. Stop loss: 50 points. Target: 1900-1885$ETH #比特币永续合约资金费率创20个月新高
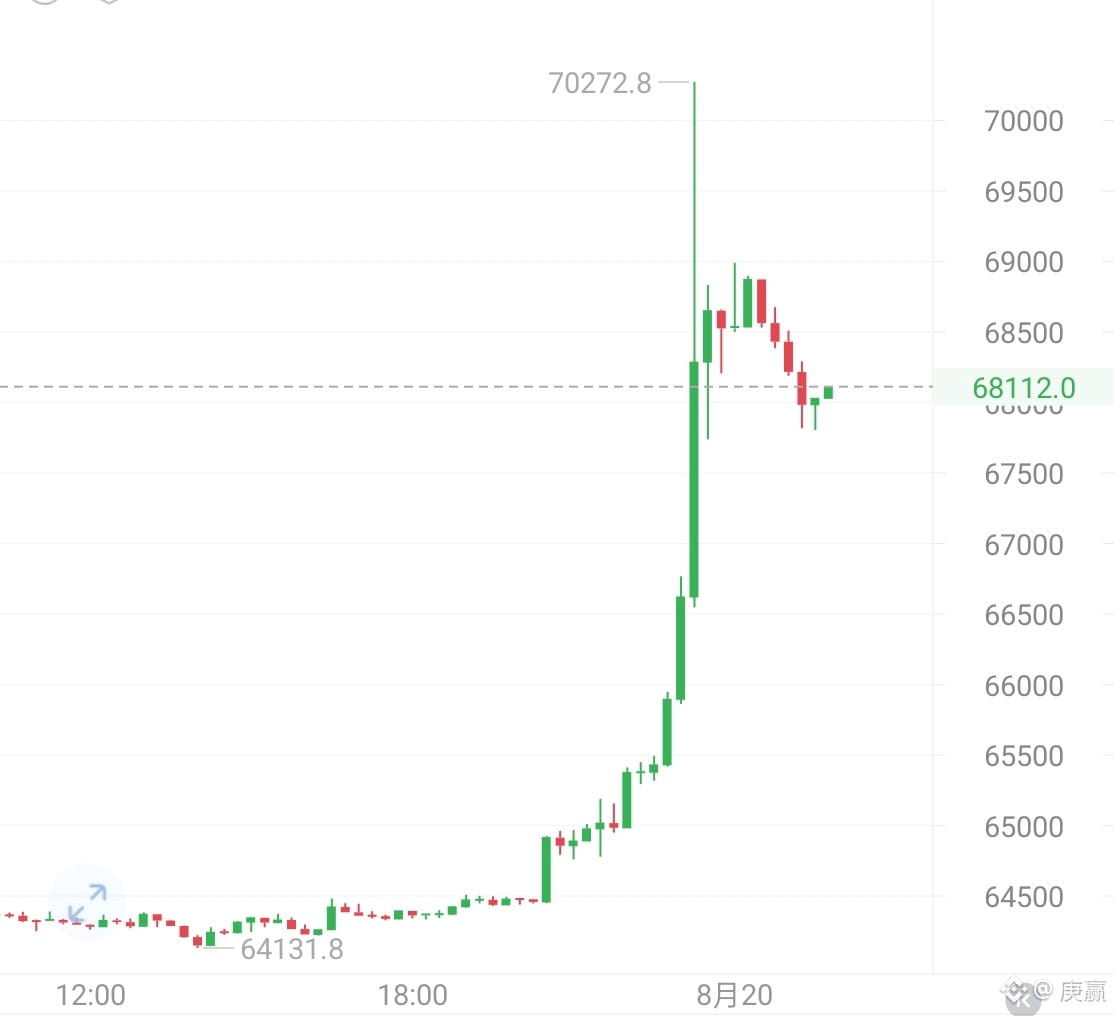
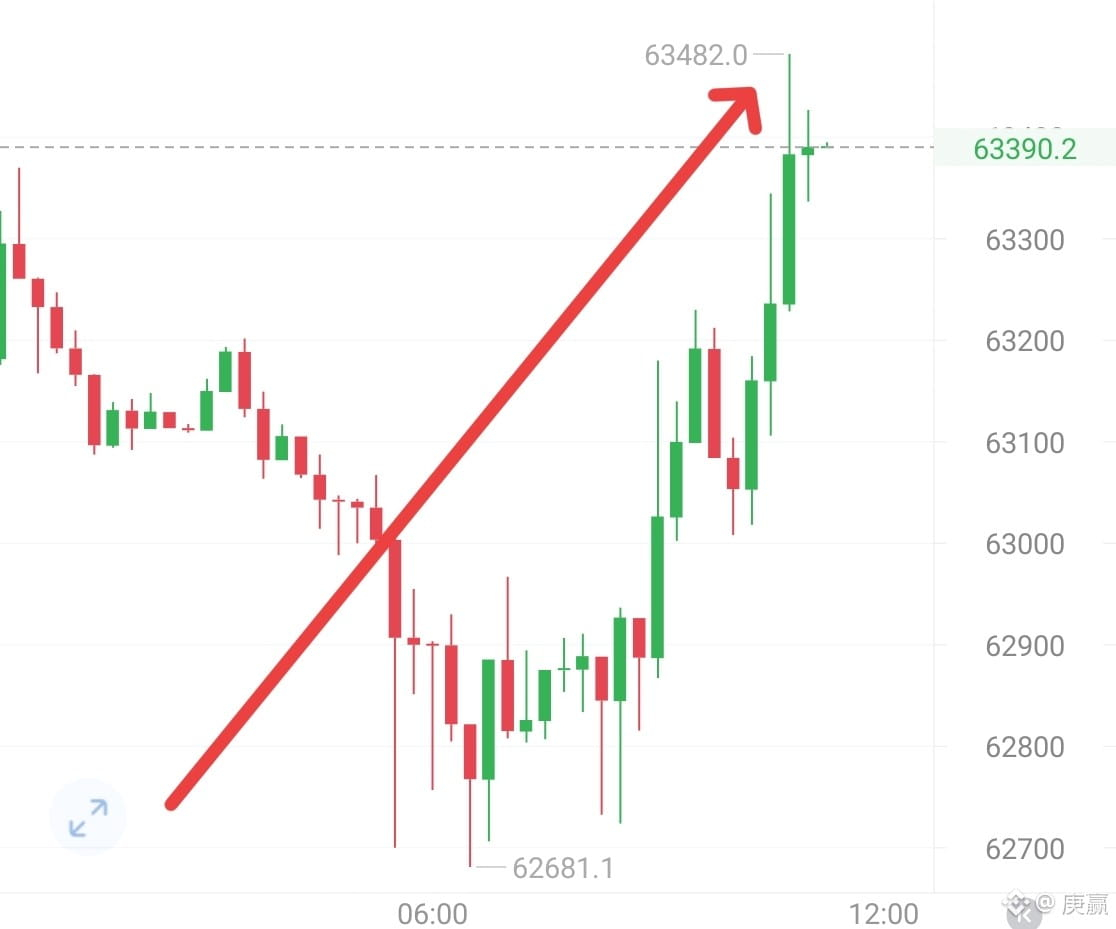
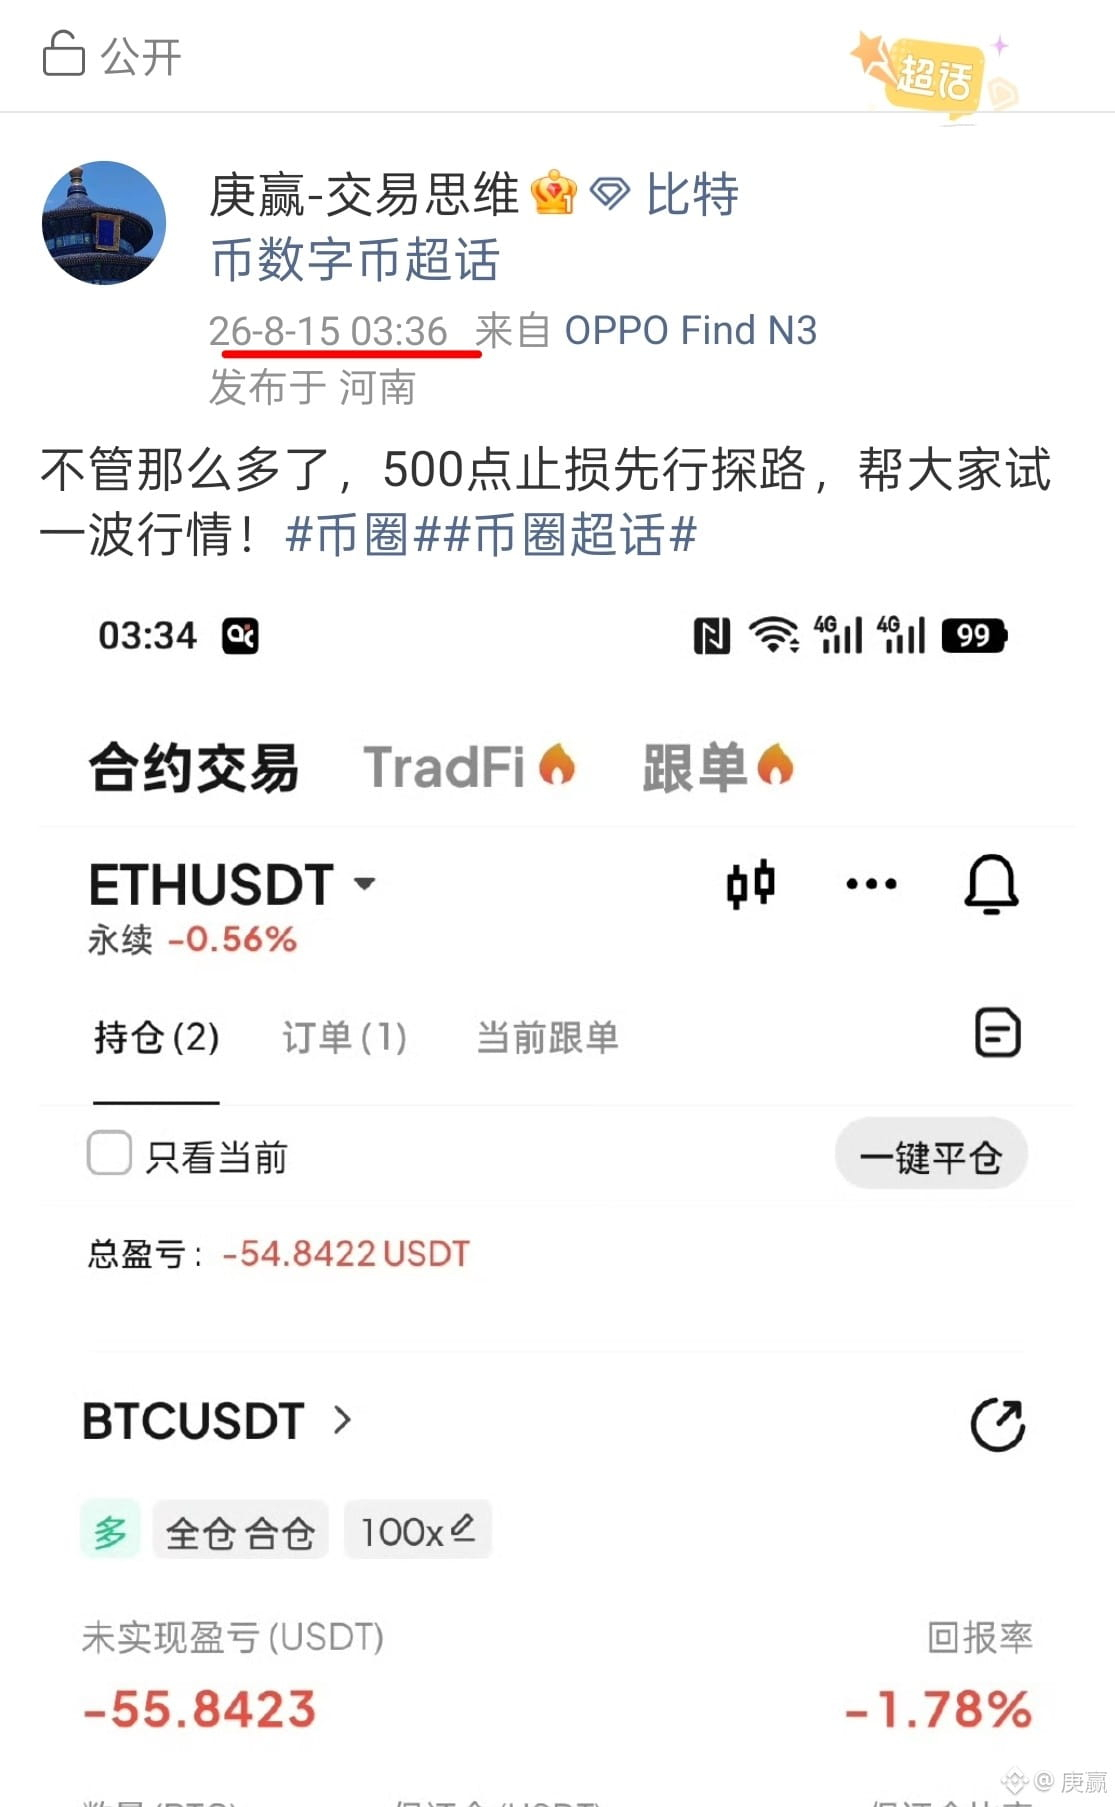
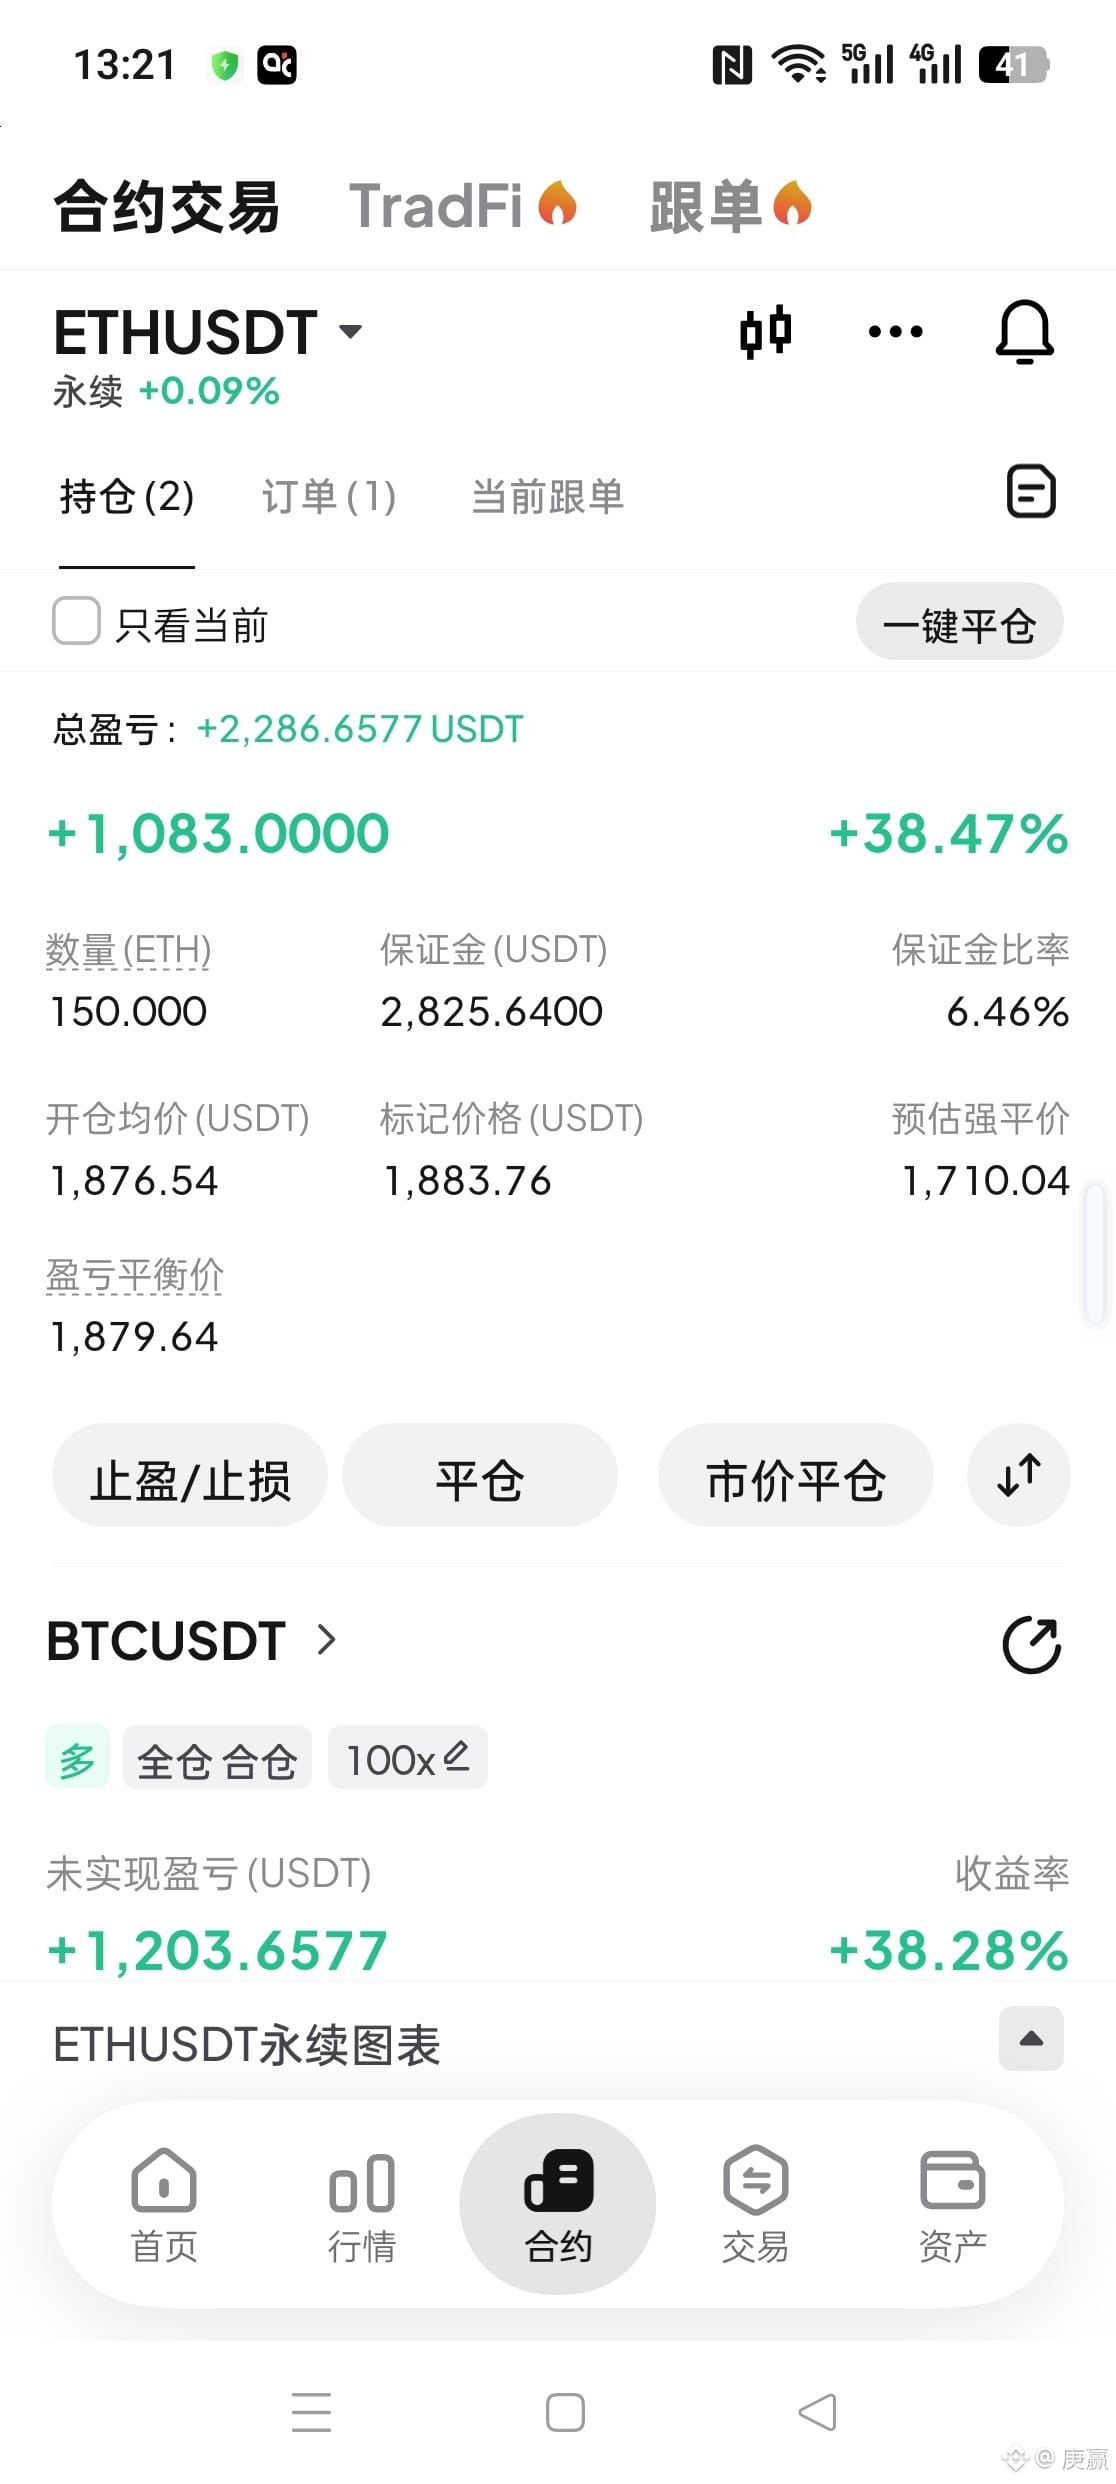
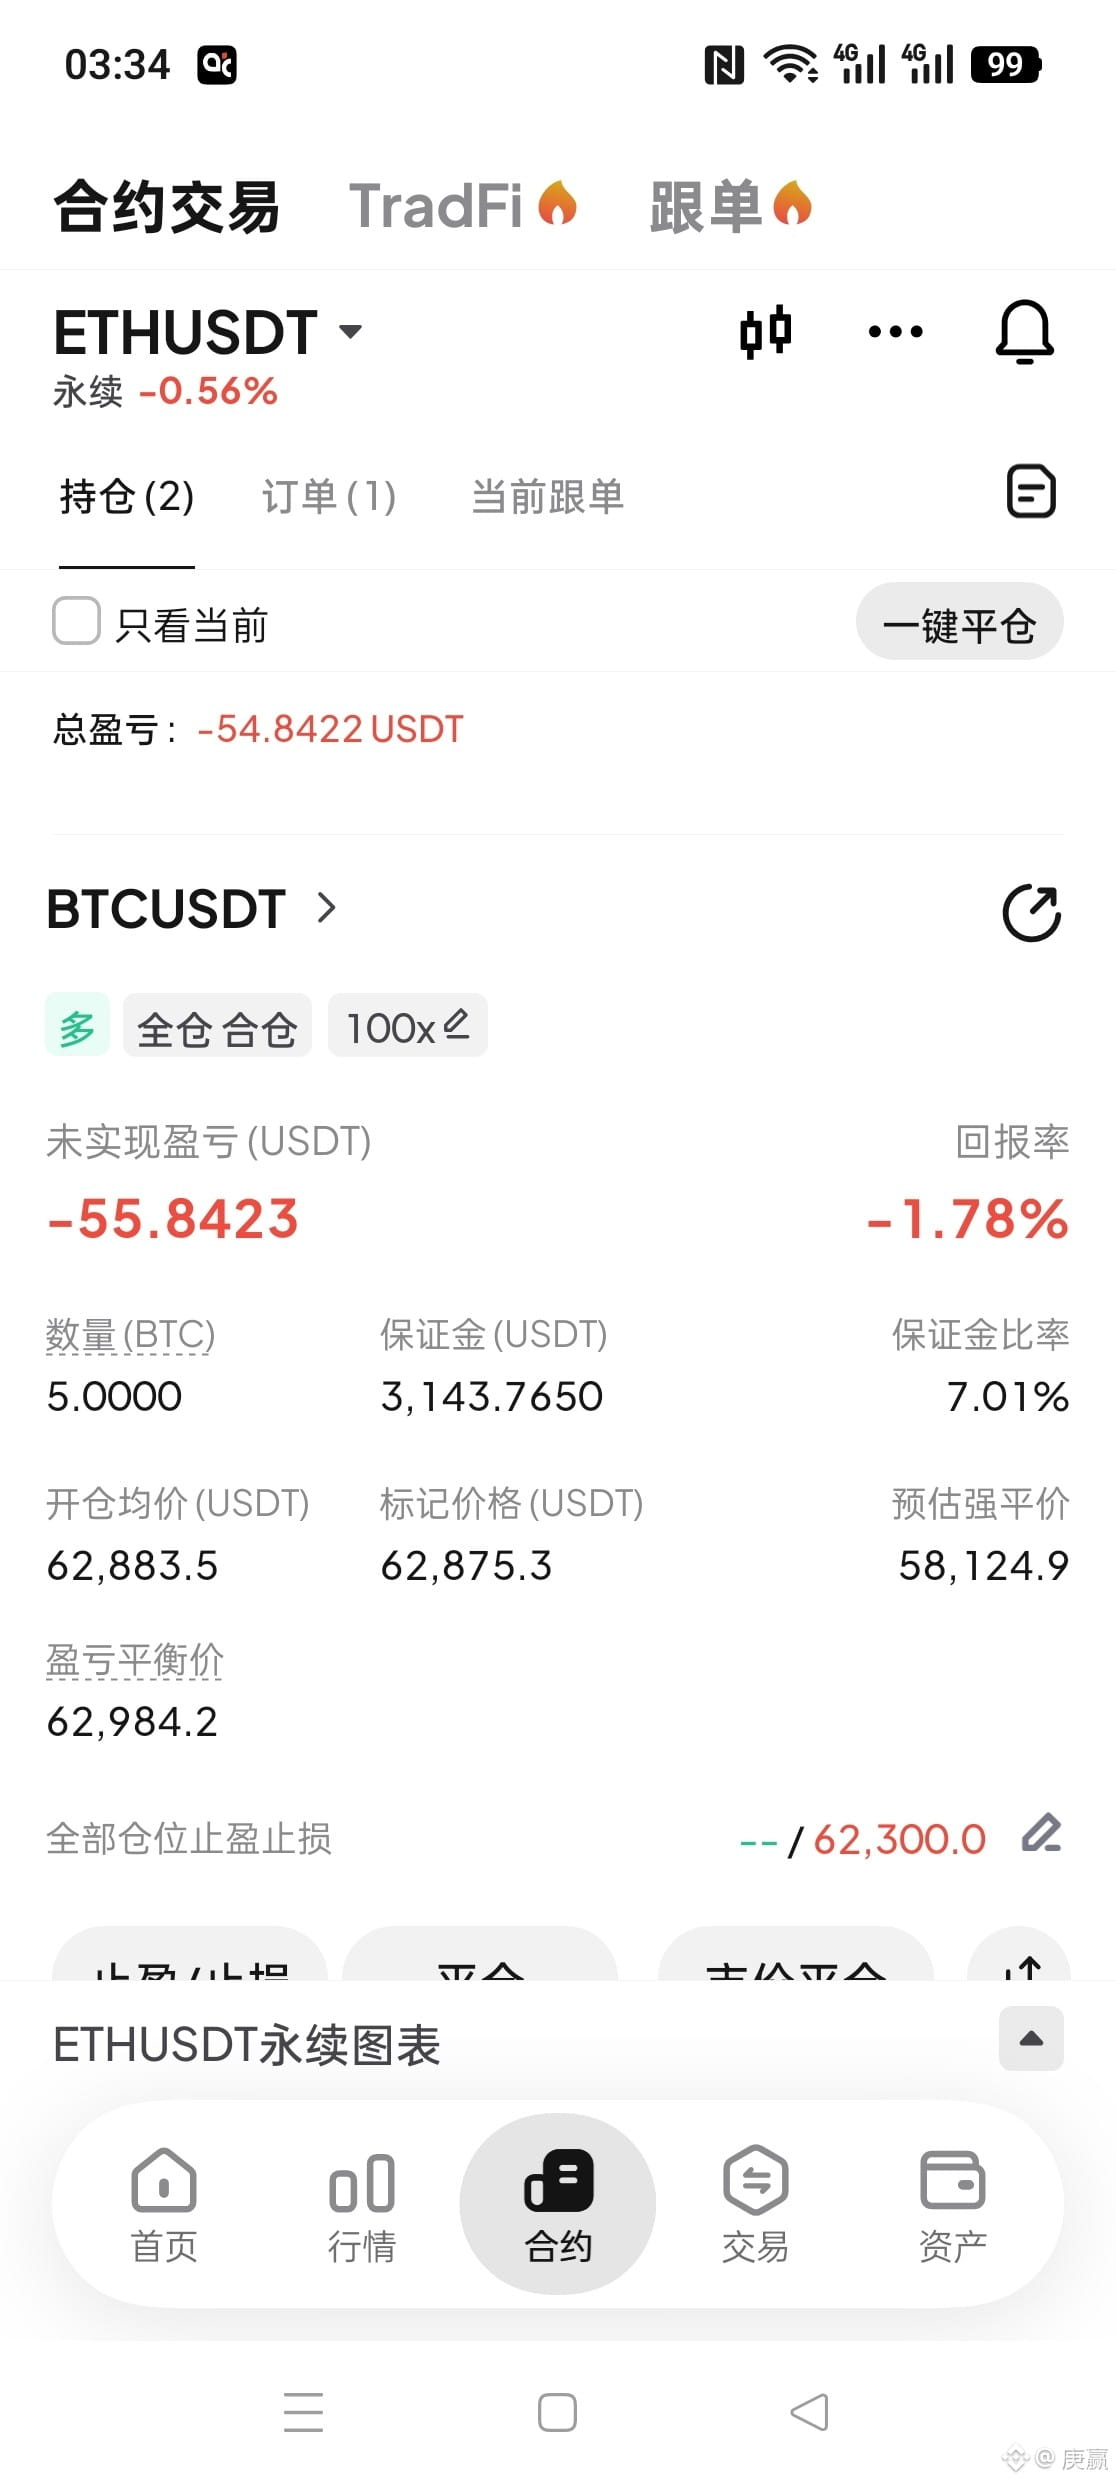
The price list arranged for everyone on Saturday is now already running out quite a lot of room. The levels are clear and obvious—follow along and you can catch it! $BTC #SpaceX股价涨至140美元
Log in to explore more content