
Scheidt Alexandre
39 Posts

Scheidt Alexandre
Report
Block User
Trader e investidor no mercado financeiro
14 Following
142 Followers
127 Liked
Posts
All
Quotes
😂😂😂🤣🤣🤣🤣🤣 1m!! 🤦🏻♂️
😂😂😂🤣🤣🤣🤣🤣 1m!! 🤦🏻♂️

Bullish_Bella
·
--
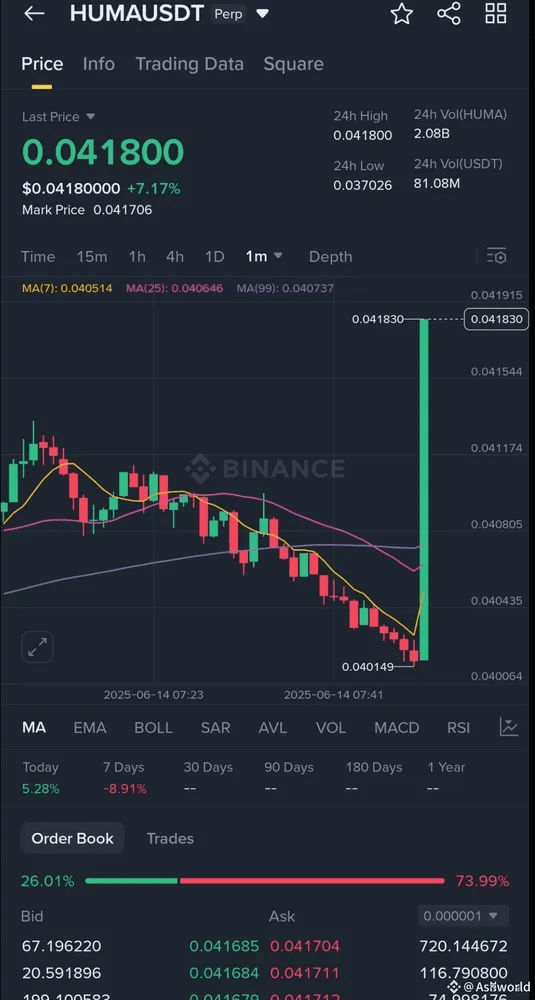
Bullish#HUMAAAAAAAAA🤪🚀💥 TOO THE MOON🚀🚀🤑
WHAT A PERFORMANCE🤩
REALLY APPRECIETED💋🤩🤭👀😊💥🤙🚀🥳🤑🌹
#BinanceSquareTalks
WHAT A PERFORMANCE🤩
REALLY APPRECIETED💋🤩🤭👀😊💥🤙🚀🥳🤑🌹
#BinanceSquareTalks
1
62
Where can I find this crypto? It's not on alpha
Where can I find this crypto? It's not on alpha

Corocoin
·
--
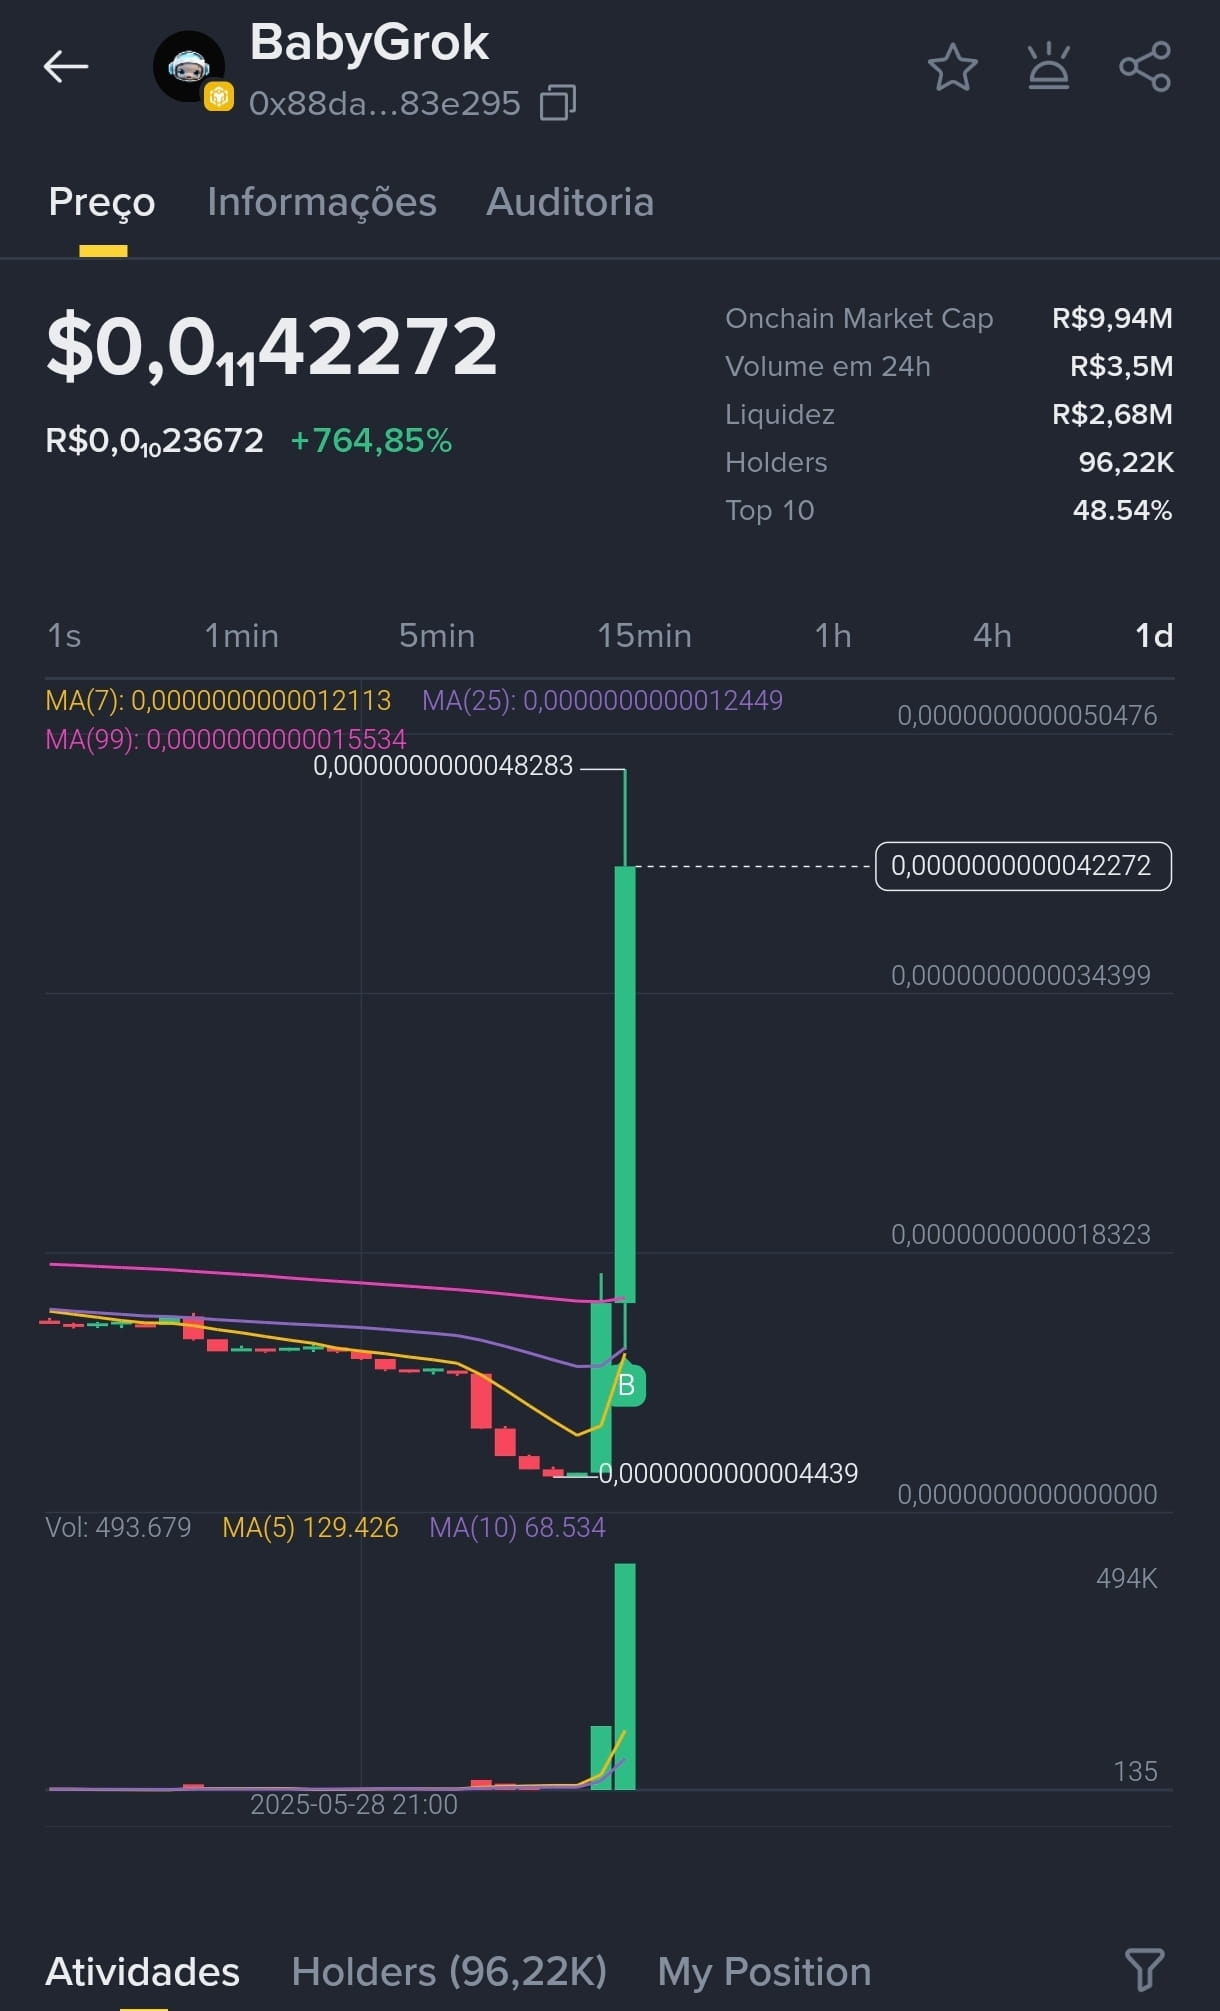
Currency on the rise with many 00's to burn an automatic burn project carried out with each transaction. I bought it on Binance Web3 because I think it's a meme project that can generate Laguna profits with an appreciation of more than 600% in 24 hours.
This is not investment advice, but for those who like memes, I suggest taking a look; who knows, we might be looking at a new future #BOB
This is not investment advice, but for those who like memes, I suggest taking a look; who knows, we might be looking at a new future #BOB
1
51
Good reading, perfect analysis!!
Good reading, perfect analysis!!
Quoted content has been removed
2
81
$BTC ‼️Market update!
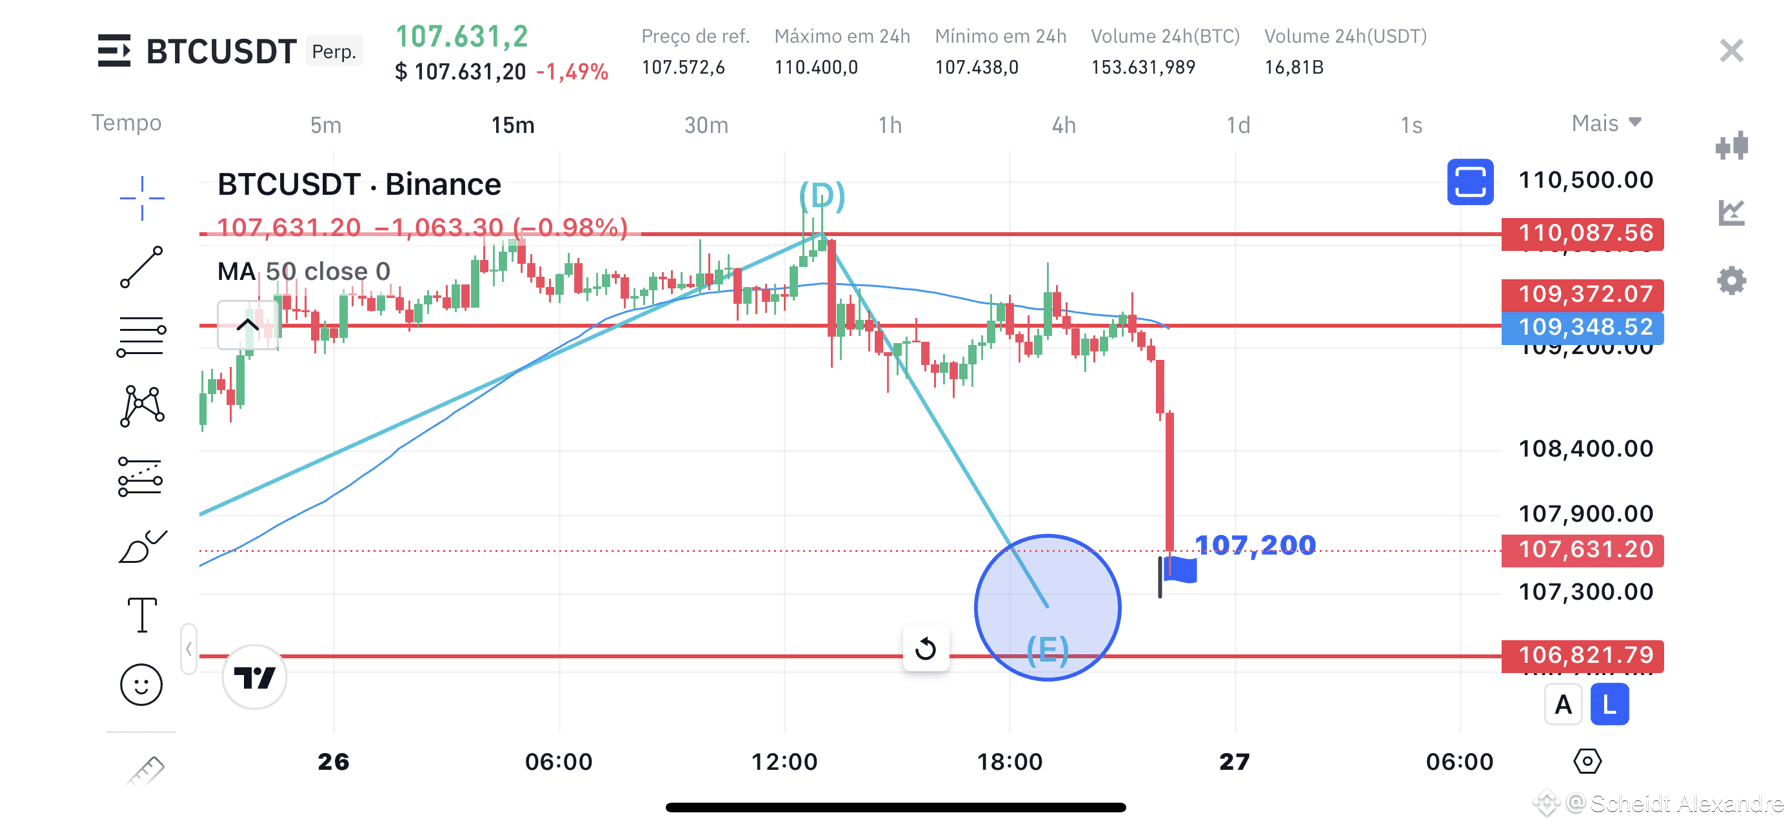
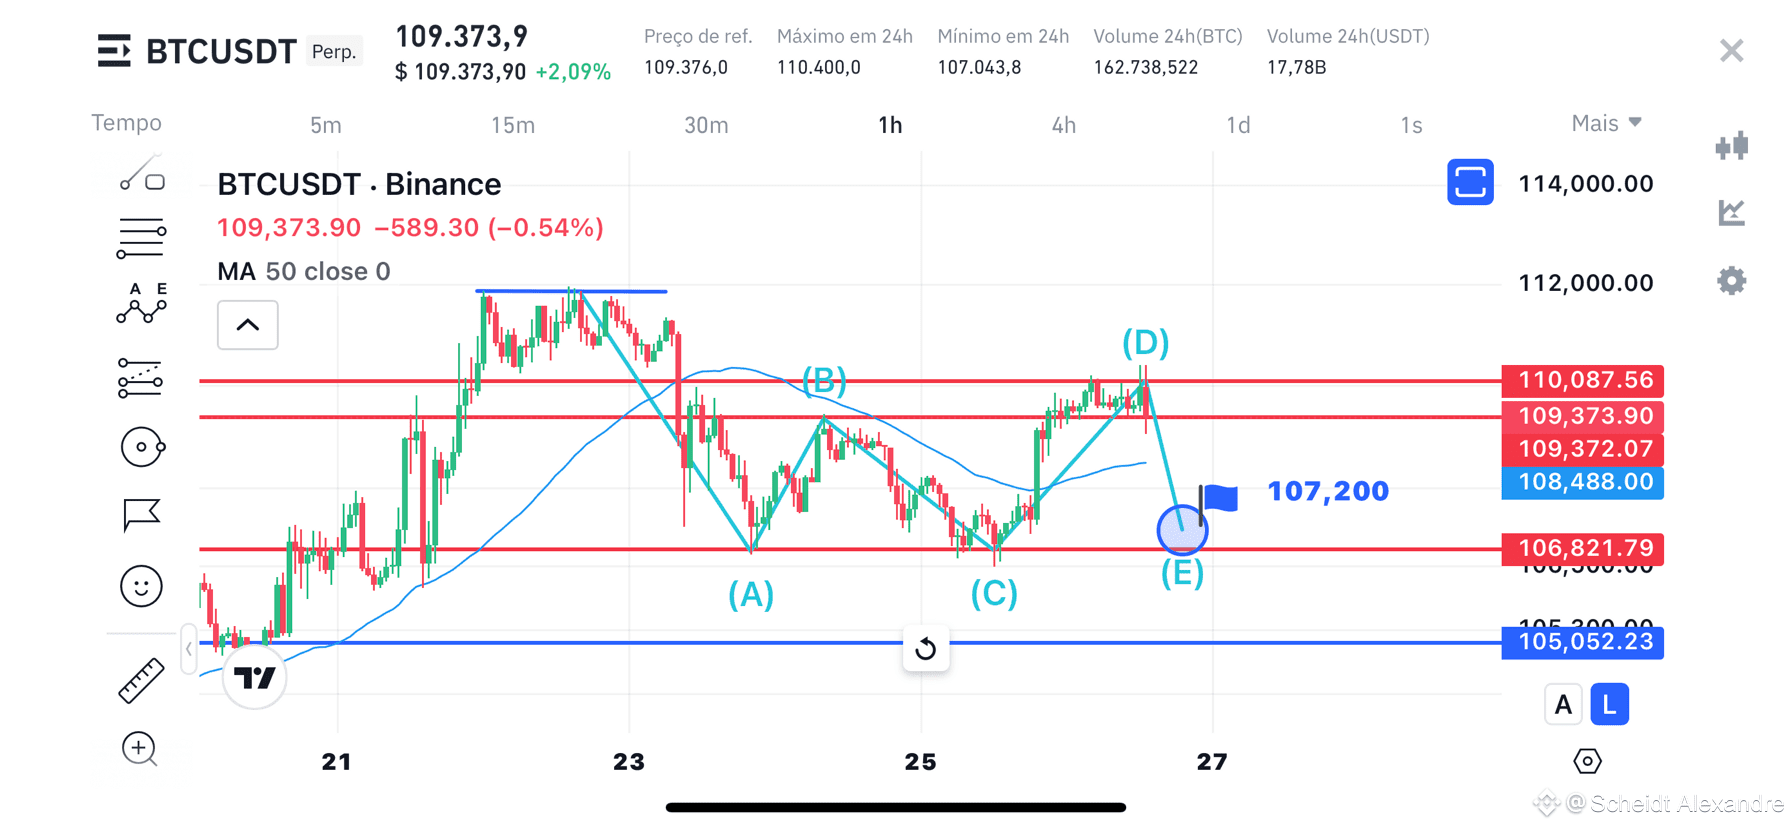
Taking into account the breakout mentioned in previous posts. After making a technical movement of; (Shoulder, head, and shoulder). The shoulder was broken confirming the supposed drop, and as expected, it came with strength in a brutal drop rally!🤯
I am not a fortune teller. This is technical analysis at its core! The simple prevails
We are about to reach our target at 107 thousand and 200 points
Thank you to everyone who believed and was part of this operation! Stay tuned for new updates…
$BTC ‼️Market update!
Taking into account the breakout mentioned in previous posts. After making a technical movement of; (Shoulder, head, and shoulder). The shoulder was broken confirming the supposed drop, and as expected, it came with strength in a brutal drop rally!🤯
I am not a fortune teller. This is technical analysis at its core! The simple prevails
We are about to reach our target at 107 thousand and 200 points
Thank you to everyone who believed and was part of this operation! Stay tuned for new updates…
Taking into account the breakout mentioned in previous posts. After making a technical movement of; (Shoulder, head, and shoulder). The shoulder was broken confirming the supposed drop, and as expected, it came with strength in a brutal drop rally!🤯
I am not a fortune teller. This is technical analysis at its core! The simple prevails
We are about to reach our target at 107 thousand and 200 points
Thank you to everyone who believed and was part of this operation! Stay tuned for new updates…
3
4.7k
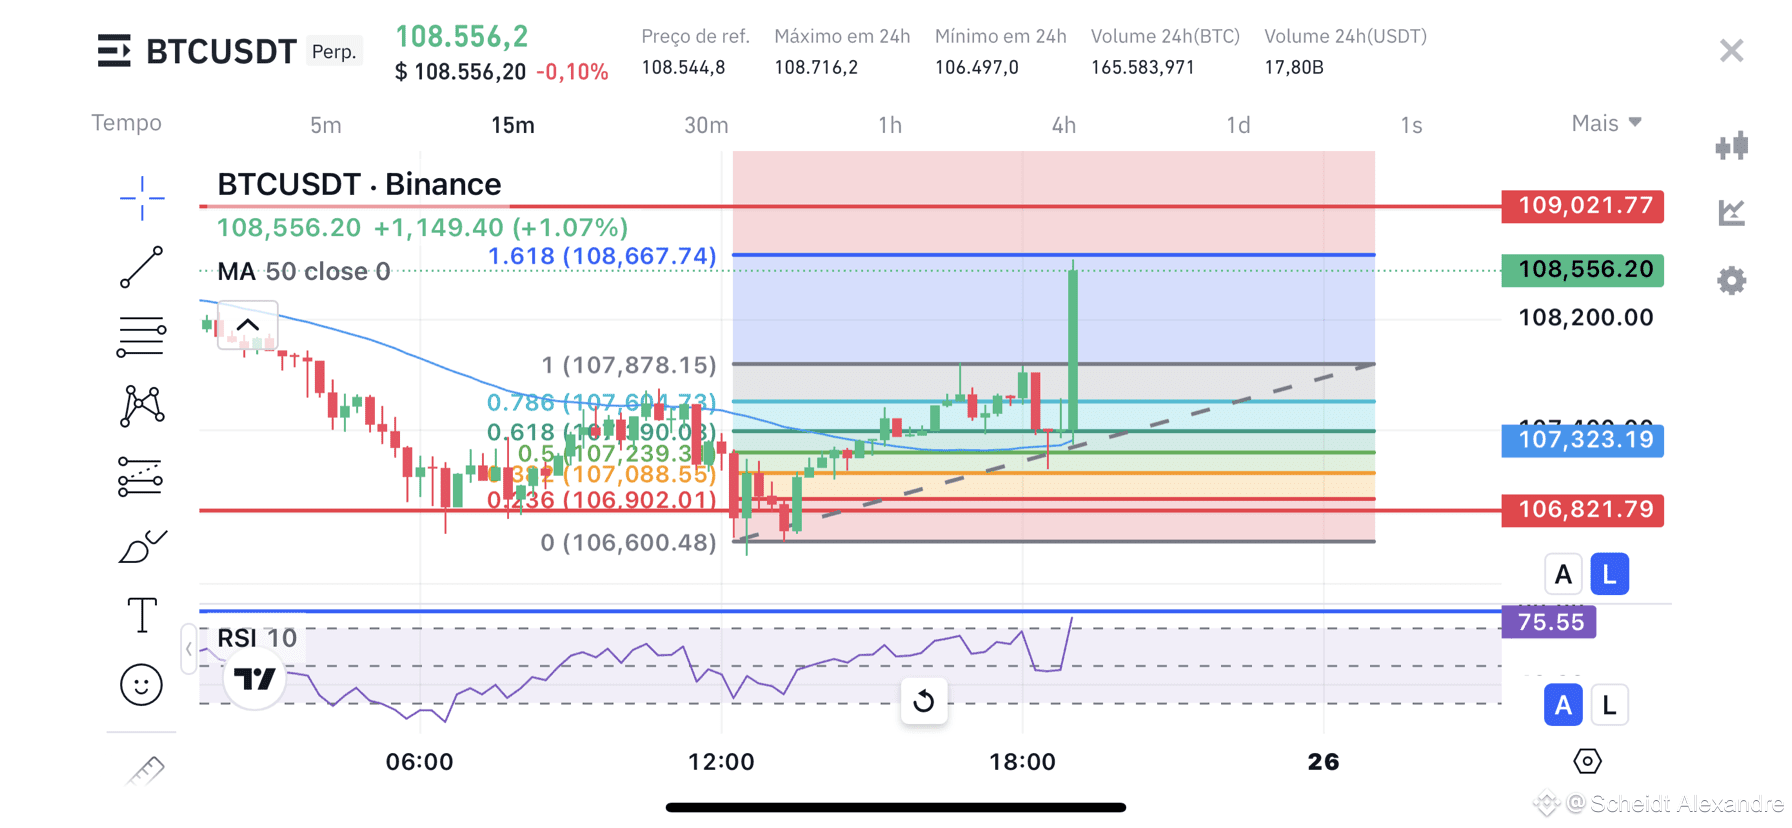
$BTC ‼️Update! Strong downward rally!
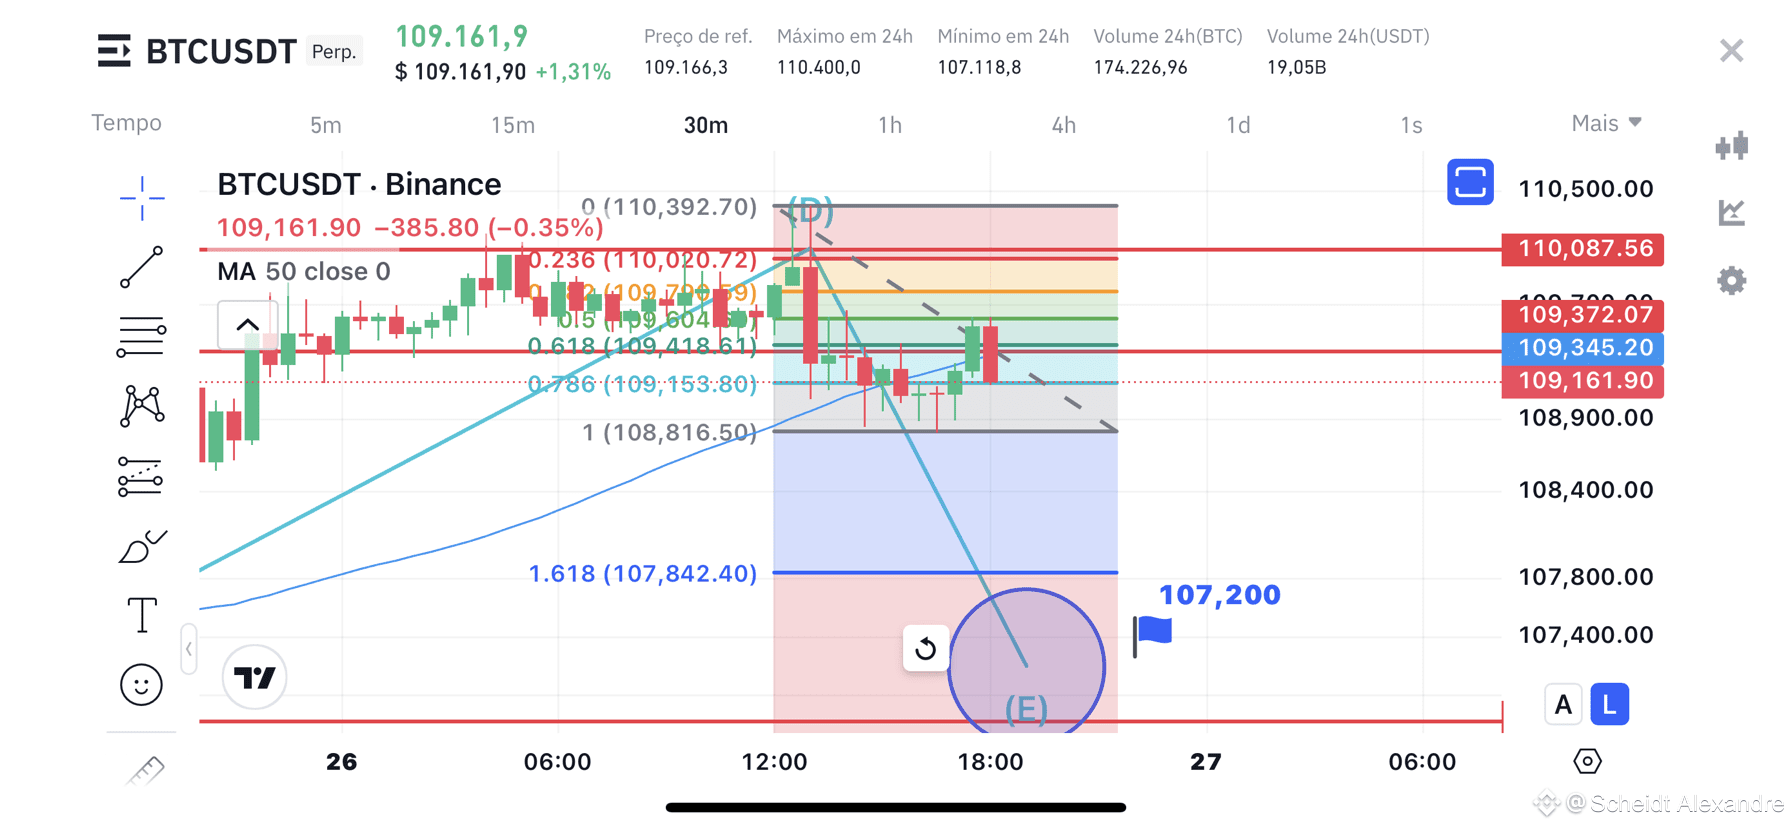
After the breakout of the strength number in the region of 109 thousand points, the #btc starts a downward pivot movement initiating a bearish cycle.
Those who positioned themselves in the region of 109,300, or above 300 in sales, congratulations 👏, you are in the game with me! And what comes next is a brutal downward rally! 📉
Movement pattern (Breakout of strength number correcting downward pivot with Fibonacci retracement in the region of 50%. And now ❓❓
Now my friends, get ready! Our target is close in the region of 107 thousand and 200 points 🎯
$BTC ‼️Update! Strong downward rally!
After the breakout of the strength number in the region of 109 thousand points, the #btc starts a downward pivot movement initiating a bearish cycle.
Those who positioned themselves in the region of 109,300, or above 300 in sales, congratulations 👏, you are in the game with me! And what comes next is a brutal downward rally! 📉
Movement pattern (Breakout of strength number correcting downward pivot with Fibonacci retracement in the region of 50%. And now ❓❓
Now my friends, get ready! Our target is close in the region of 107 thousand and 200 points 🎯
After the breakout of the strength number in the region of 109 thousand points, the #btc starts a downward pivot movement initiating a bearish cycle.
Those who positioned themselves in the region of 109,300, or above 300 in sales, congratulations 👏, you are in the game with me! And what comes next is a brutal downward rally! 📉
Movement pattern (Breakout of strength number correcting downward pivot with Fibonacci retracement in the region of 50%. And now ❓❓
Now my friends, get ready! Our target is close in the region of 107 thousand and 200 points 🎯
23
10
8
20.5k
·
--
Bearish
$BTC
‼️Alert!! Decisive accumulation.
High volume on the selling side!
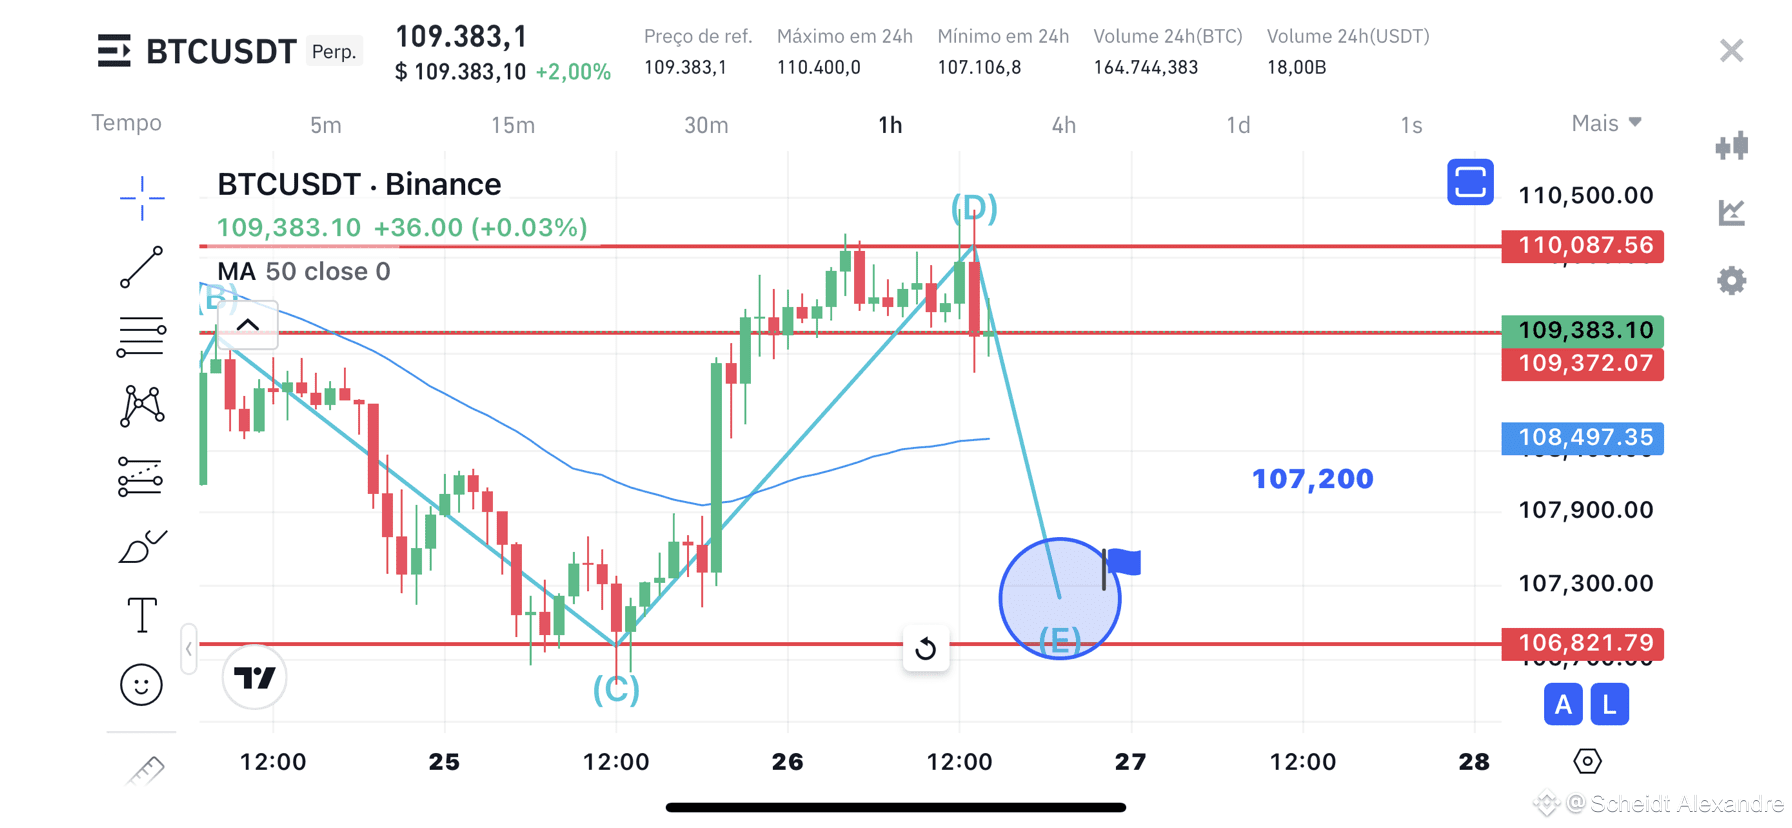
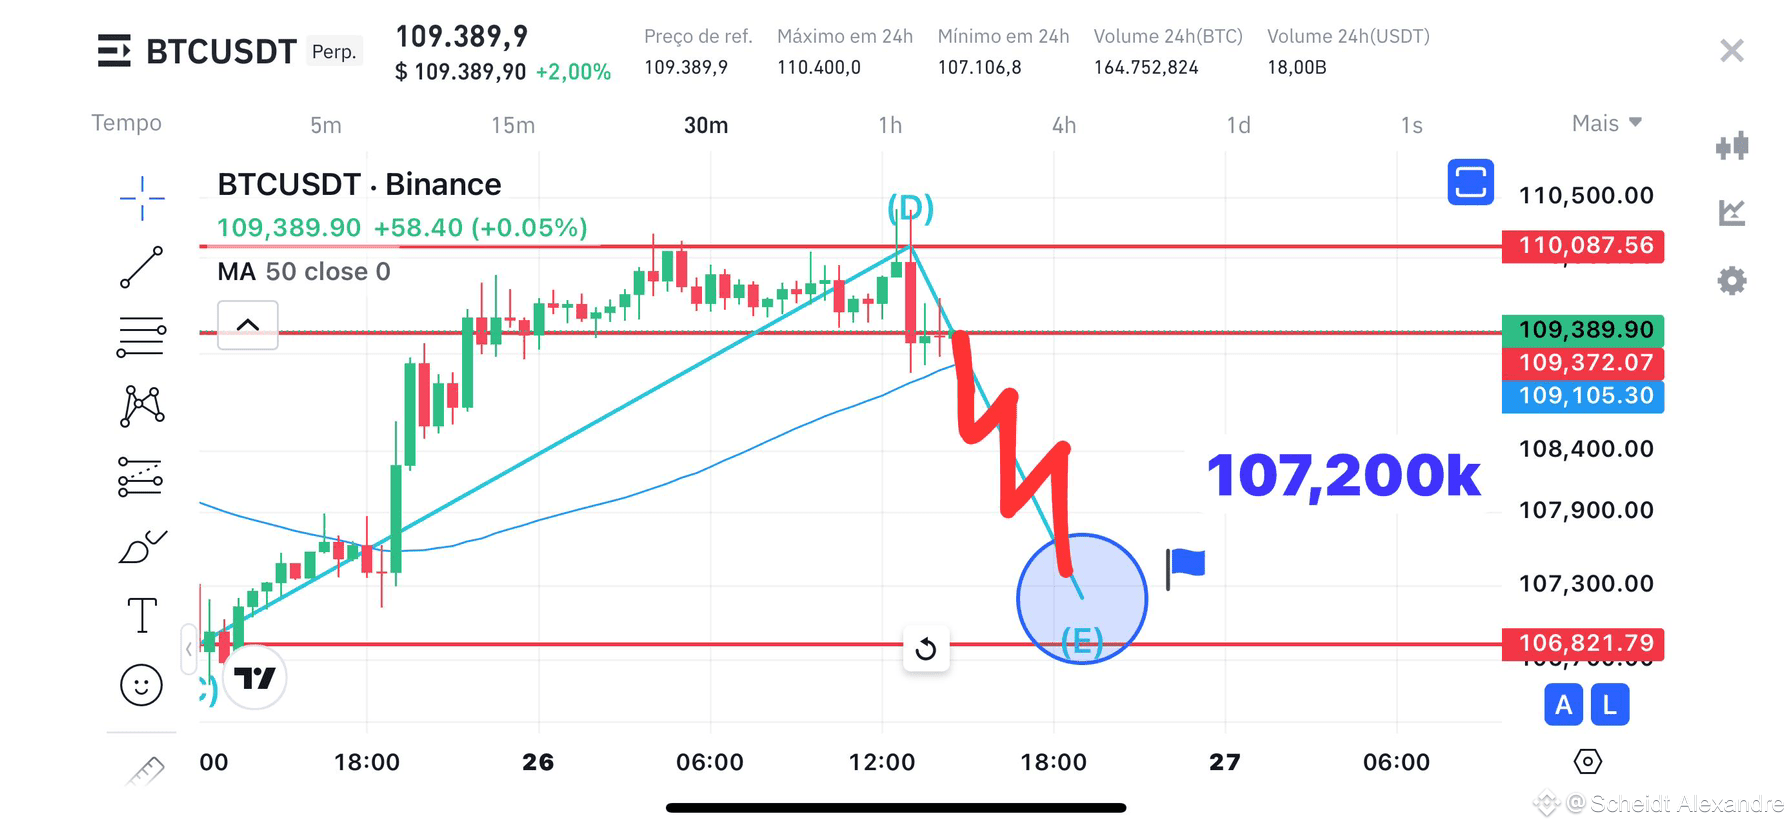
After Bitcoin accumulated in the region of #btc110k , where we have an interesting psychological price number, the buying side could not sustain the price, and subsequently, the selling side reacted strongly, causing those who were bought to become sold, initiating a downtrend rally.
Movement pattern: (After respecting the strength number at 110k, the price has been struggling to break the region of #btc109k to initiate a brutal drop 🤯.) Stay alert as a drop can occur at any moment.
🔴 Selling operation
✅ Entry 109,300 or above
🚨 Stop 110,600
💰 Realization 107,200
‼️ Keep your profit multiplier at a maximum of
15x. Do not be aggressive.
$BTC
‼️Alert!! Decisive accumulation.
High volume on the selling side!
After Bitcoin accumulated in the region of #btc110k , where we have an interesting psychological price number, the buying side could not sustain the price, and subsequently, the selling side reacted strongly, causing those who were bought to become sold, initiating a downtrend rally.
Movement pattern: (After respecting the strength number at 110k, the price has been struggling to break the region of #btc109k to initiate a brutal drop 🤯.) Stay alert as a drop can occur at any moment.
🔴 Selling operation
✅ Entry 109,300 or above
🚨 Stop 110,600
💰 Realization 107,200
‼️ Keep your profit multiplier at a maximum of
15x. Do not be aggressive.
‼️Alert!! Decisive accumulation.
High volume on the selling side!
After Bitcoin accumulated in the region of #btc110k , where we have an interesting psychological price number, the buying side could not sustain the price, and subsequently, the selling side reacted strongly, causing those who were bought to become sold, initiating a downtrend rally.
Movement pattern: (After respecting the strength number at 110k, the price has been struggling to break the region of #btc109k to initiate a brutal drop 🤯.) Stay alert as a drop can occur at any moment.
🔴 Selling operation
✅ Entry 109,300 or above
🚨 Stop 110,600
💰 Realization 107,200
‼️ Keep your profit multiplier at a maximum of
15x. Do not be aggressive.
3
375
Let's go for it, brother! 🔥🚀
I'll give you a very important tip: Lower your profit multiplier, keep it at 15 at most and 20x, this will keep you alive in the market in the long run.
Let's go for it, brother! 🔥🚀
I'll give you a very important tip: Lower your profit multiplier, keep it at 15 at most and 20x, this will keep you alive in the market in the long run.
I'll give you a very important tip: Lower your profit multiplier, keep it at 15 at most and 20x, this will keep you alive in the market in the long run.

Jp Crypto Trader
·
--
Thanks bro
1
317
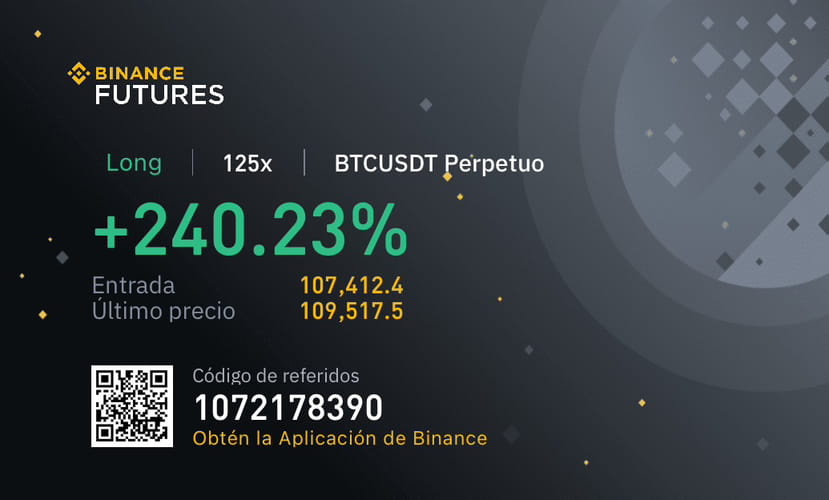
$BTC 👏🎉 Congratulations to those who positioned themselves together in this movement. I had already warned about the ongoing movement, and as expected, we are about to carry out our operation at 109k
‼️Stay alert for the next price defense regions.
Breaking the 109k region on the 1H and 4H chart, our only defense region will be in the range of #btc110k
Are you ready for an exponential explosion in the coming months? 🚀🚀
$BTC 👏🎉 Congratulations to those who positioned themselves together in this movement. I had already warned about the ongoing movement, and as expected, we are about to carry out our operation at 109k
‼️Stay alert for the next price defense regions.
Breaking the 109k region on the 1H and 4H chart, our only defense region will be in the range of #btc110k
Are you ready for an exponential explosion in the coming months? 🚀🚀
‼️Stay alert for the next price defense regions.
Breaking the 109k region on the 1H and 4H chart, our only defense region will be in the range of #btc110k
Are you ready for an exponential explosion in the coming months? 🚀🚀
704
Hello my dear. Exactly 👍. This is an intraday chart, the trend is on the higher time frame being the times of (1h, 4h, 1d, weekly and monthly). The m15 is just the cherry on top 🍒
Hello my dear. Exactly 👍. This is an intraday chart, the trend is on the higher time frame being the times of (1h, 4h, 1d, weekly and monthly). The m15 is just the cherry on top 🍒

Jean Fera
·
--
Man, this is a 15-minute chart.
It doesn't indicate any trend.
It doesn't indicate any trend.
1
58
·
--
Bullish
$BTC
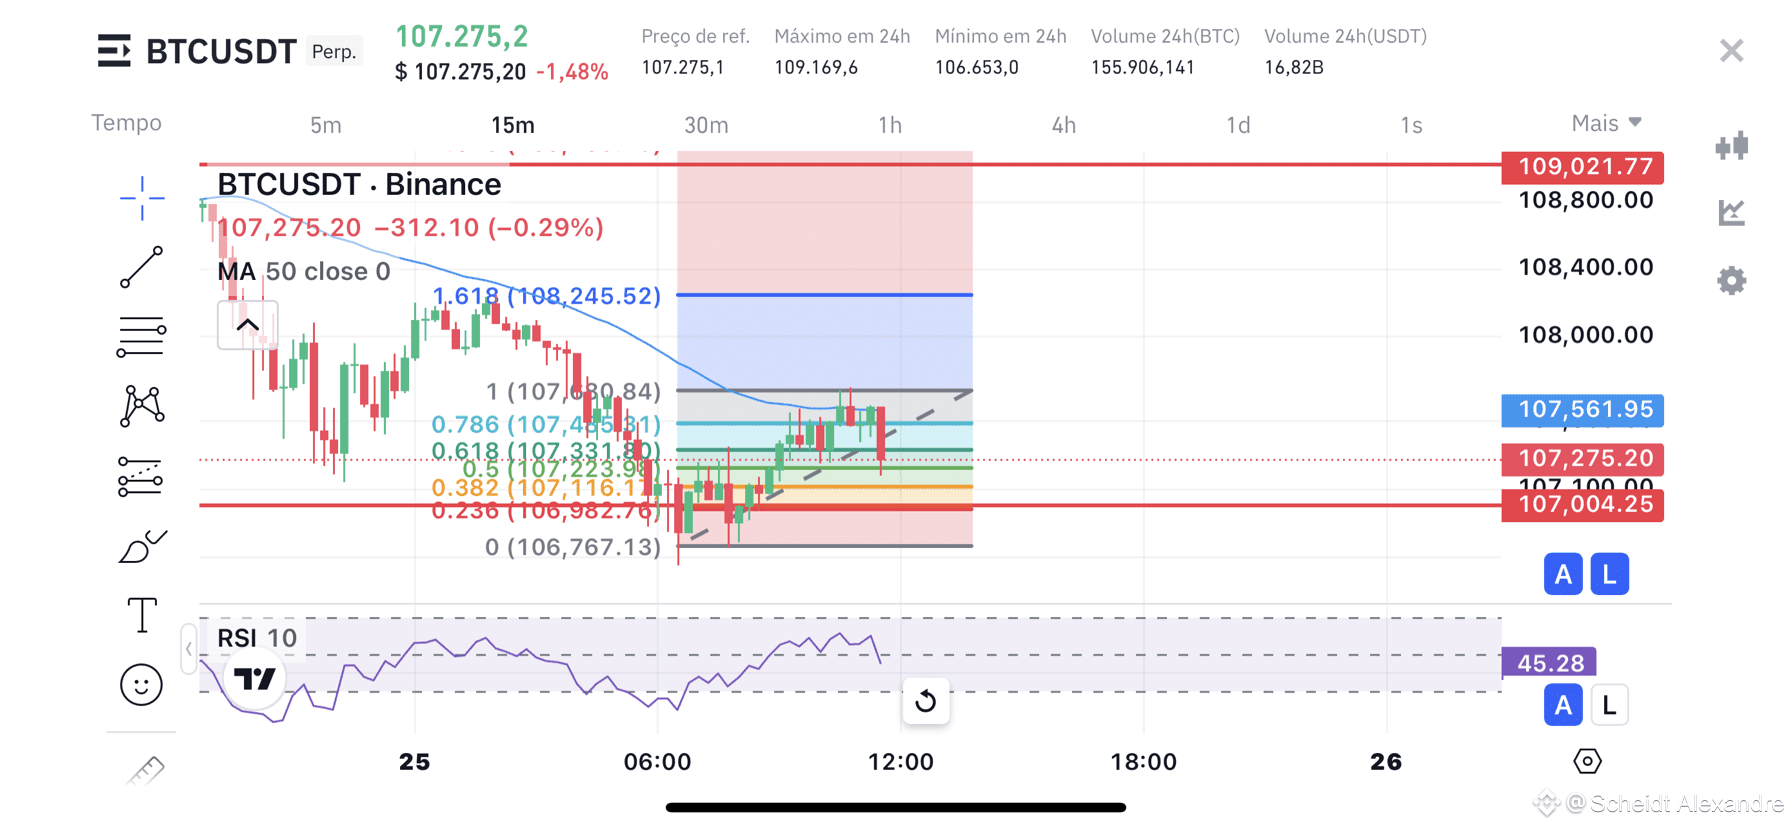
‼️Alert! Short rally of decline in bitcoin
The movement is repeating again. After reaching a strength number in the region of 107k, the price returns to the current trend which is upward.
Movement pattern (A bullish pivot has been initiated with Fibonacci retracement between the regions of;
61.8
50%
38.2
Respecting one of the regions, the price will go straight to seek our target 🎯 in the region of #btc109k
Entries 🚨
Buy at 107,275
Target 🎯 at 109,000
Important notice!!
Losing the region of 38.2 and breaking below 107,000 on the 1H chart, BTC may lose 107k and seek regions close to 105 to 103k
$BTC
‼️Alert! Short rally of decline in bitcoin
The movement is repeating again. After reaching a strength number in the region of 107k, the price returns to the current trend which is upward.
Movement pattern (A bullish pivot has been initiated with Fibonacci retracement between the regions of;
61.8
50%
38.2
Respecting one of the regions, the price will go straight to seek our target 🎯 in the region of #btc109k
Entries 🚨
Buy at 107,275
Target 🎯 at 109,000
Important notice!!
Losing the region of 38.2 and breaking below 107,000 on the 1H chart, BTC may lose 107k and seek regions close to 105 to 103k
‼️Alert! Short rally of decline in bitcoin
The movement is repeating again. After reaching a strength number in the region of 107k, the price returns to the current trend which is upward.
Movement pattern (A bullish pivot has been initiated with Fibonacci retracement between the regions of;
61.8
50%
38.2
Respecting one of the regions, the price will go straight to seek our target 🎯 in the region of #btc109k
Entries 🚨
Buy at 107,275
Target 🎯 at 109,000
Important notice!!
Losing the region of 38.2 and breaking below 107,000 on the 1H chart, BTC may lose 107k and seek regions close to 105 to 103k
5
4
14
54k
Yes yes yes!
It even lost the 38.2 Fibonacci region and is now going to seek 107,000
Yes yes yes!
It even lost the 38.2 Fibonacci region and is now going to seek 107,000
It even lost the 38.2 Fibonacci region and is now going to seek 107,000

Flossie Zomora Cc3G
--
Reply to @Scheidt Alexandre
fibonazi!!!!!
já já já já já já já já
1
28
·
--
Bullish
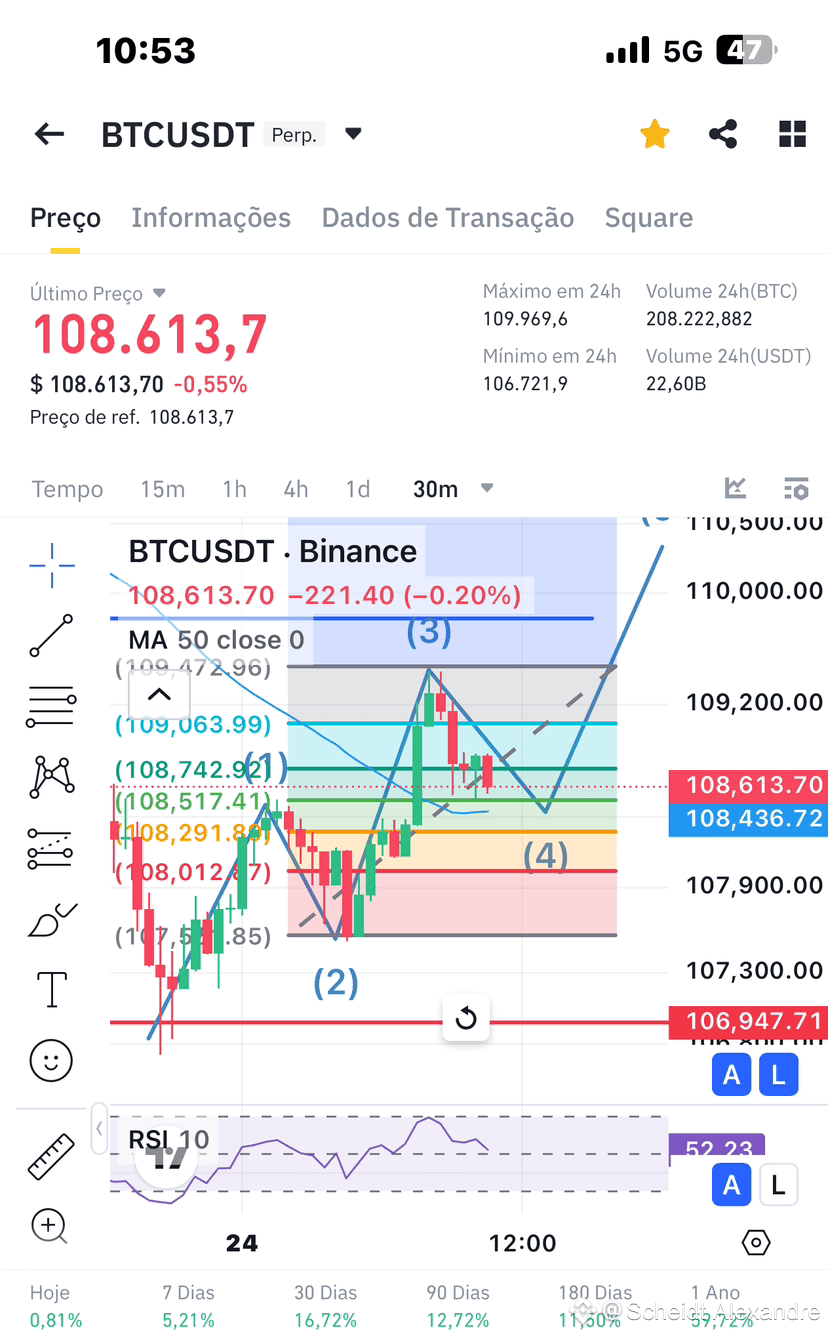
$BTC currently in a short bearish rally seeking one of the Fibonacci regions to outline a rise in correlation with the Elliott waves within the prevailing uptrend 📈
Ready to get in the game ❓❓❓
‼️ Keep the following in mind, folks!
Taking into consideration the basic concepts of Dow theory and combining it with Elliott's Theory. The market moves in waves. It advances, corrects, and then advances even further.
In Elliott's theory, there are 5 waves within the 1st Cycle (3 of trend and 2 of correction). Continuing, shortly after, it enters the ABC movement correcting the trend wave within the 1st cycle.
🚨 Currently, $BTC is correcting wave 4 seeking one of the Fibonacci regions, being; 61.8
50%
38.2
Respecting one of these regions at this exact moment within the 30-minute and 1-hour chart will be a precise confirmation indicating that we are on the right path again towards #btc110k
🚨 Extremely important alert!!! 🔴
Losing the 38.2 Fibonacci region enters the merit of breaking the pattern, heading again towards the 107k region!
$BTC currently in a short bearish rally seeking one of the Fibonacci regions to outline a rise in correlation with the Elliott waves within the prevailing uptrend 📈
Ready to get in the game ❓❓❓
‼️ Keep the following in mind, folks!
Taking into consideration the basic concepts of Dow theory and combining it with Elliott's Theory. The market moves in waves. It advances, corrects, and then advances even further.
In Elliott's theory, there are 5 waves within the 1st Cycle (3 of trend and 2 of correction). Continuing, shortly after, it enters the ABC movement correcting the trend wave within the 1st cycle.
🚨 Currently, $BTC is correcting wave 4 seeking one of the Fibonacci regions, being; 61.8
50%
38.2
Respecting one of these regions at this exact moment within the 30-minute and 1-hour chart will be a precise confirmation indicating that we are on the right path again towards #btc110k
🚨 Extremely important alert!!! 🔴
Losing the 38.2 Fibonacci region enters the merit of breaking the pattern, heading again towards the 107k region!
Ready to get in the game ❓❓❓
‼️ Keep the following in mind, folks!
Taking into consideration the basic concepts of Dow theory and combining it with Elliott's Theory. The market moves in waves. It advances, corrects, and then advances even further.
In Elliott's theory, there are 5 waves within the 1st Cycle (3 of trend and 2 of correction). Continuing, shortly after, it enters the ABC movement correcting the trend wave within the 1st cycle.
🚨 Currently, $BTC is correcting wave 4 seeking one of the Fibonacci regions, being; 61.8
50%
38.2
Respecting one of these regions at this exact moment within the 30-minute and 1-hour chart will be a precise confirmation indicating that we are on the right path again towards #btc110k
🚨 Extremely important alert!!! 🔴
Losing the 38.2 Fibonacci region enters the merit of breaking the pattern, heading again towards the 107k region!
5
3
5
7.4k
I believe you are mistaken, the buying region is near 105k with the target in the region of 110k, in daily and weekly projection the chart broke the resistance making a pullback
I believe you are mistaken, the buying region is near 105k with the target in the region of 110k, in daily and weekly projection the chart broke the resistance making a pullback

AltsCoin_Expert
·
--
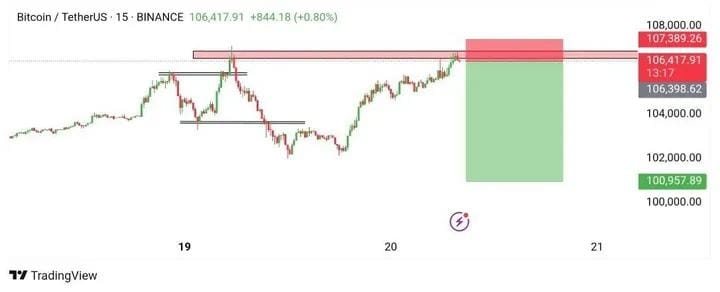
Bullish$BTC
/USDT
#SHORT
SELL ZONE :- 106500 - 107000
TARGET :-
1) 105k -
2) 103k
3) 100k
STOPLOSS :- 107700
/USDT
#SHORT
SELL ZONE :- 106500 - 107000
TARGET :-
1) 105k -
2) 103k
3) 100k
STOPLOSS :- 107700
1
118
I agree with your analysis, the 8$ is the price defense region, but I believe that selling in the range of 6.98$ is the best option as it is already in a fair price range
I agree with your analysis, the 8$ is the price defense region, but I believe that selling in the range of 6.98$ is the best option as it is already in a fair price range

TruthInvestor629
·
--
Bullish$SANTOS Heading to 8$... $BTC $ETH Volume increased and an upward trend has begun! 🚀
1
307
Will melt in less than 4 hours, short sell!!!
Will melt in less than 4 hours, short sell!!!

Alvy_1
·
--
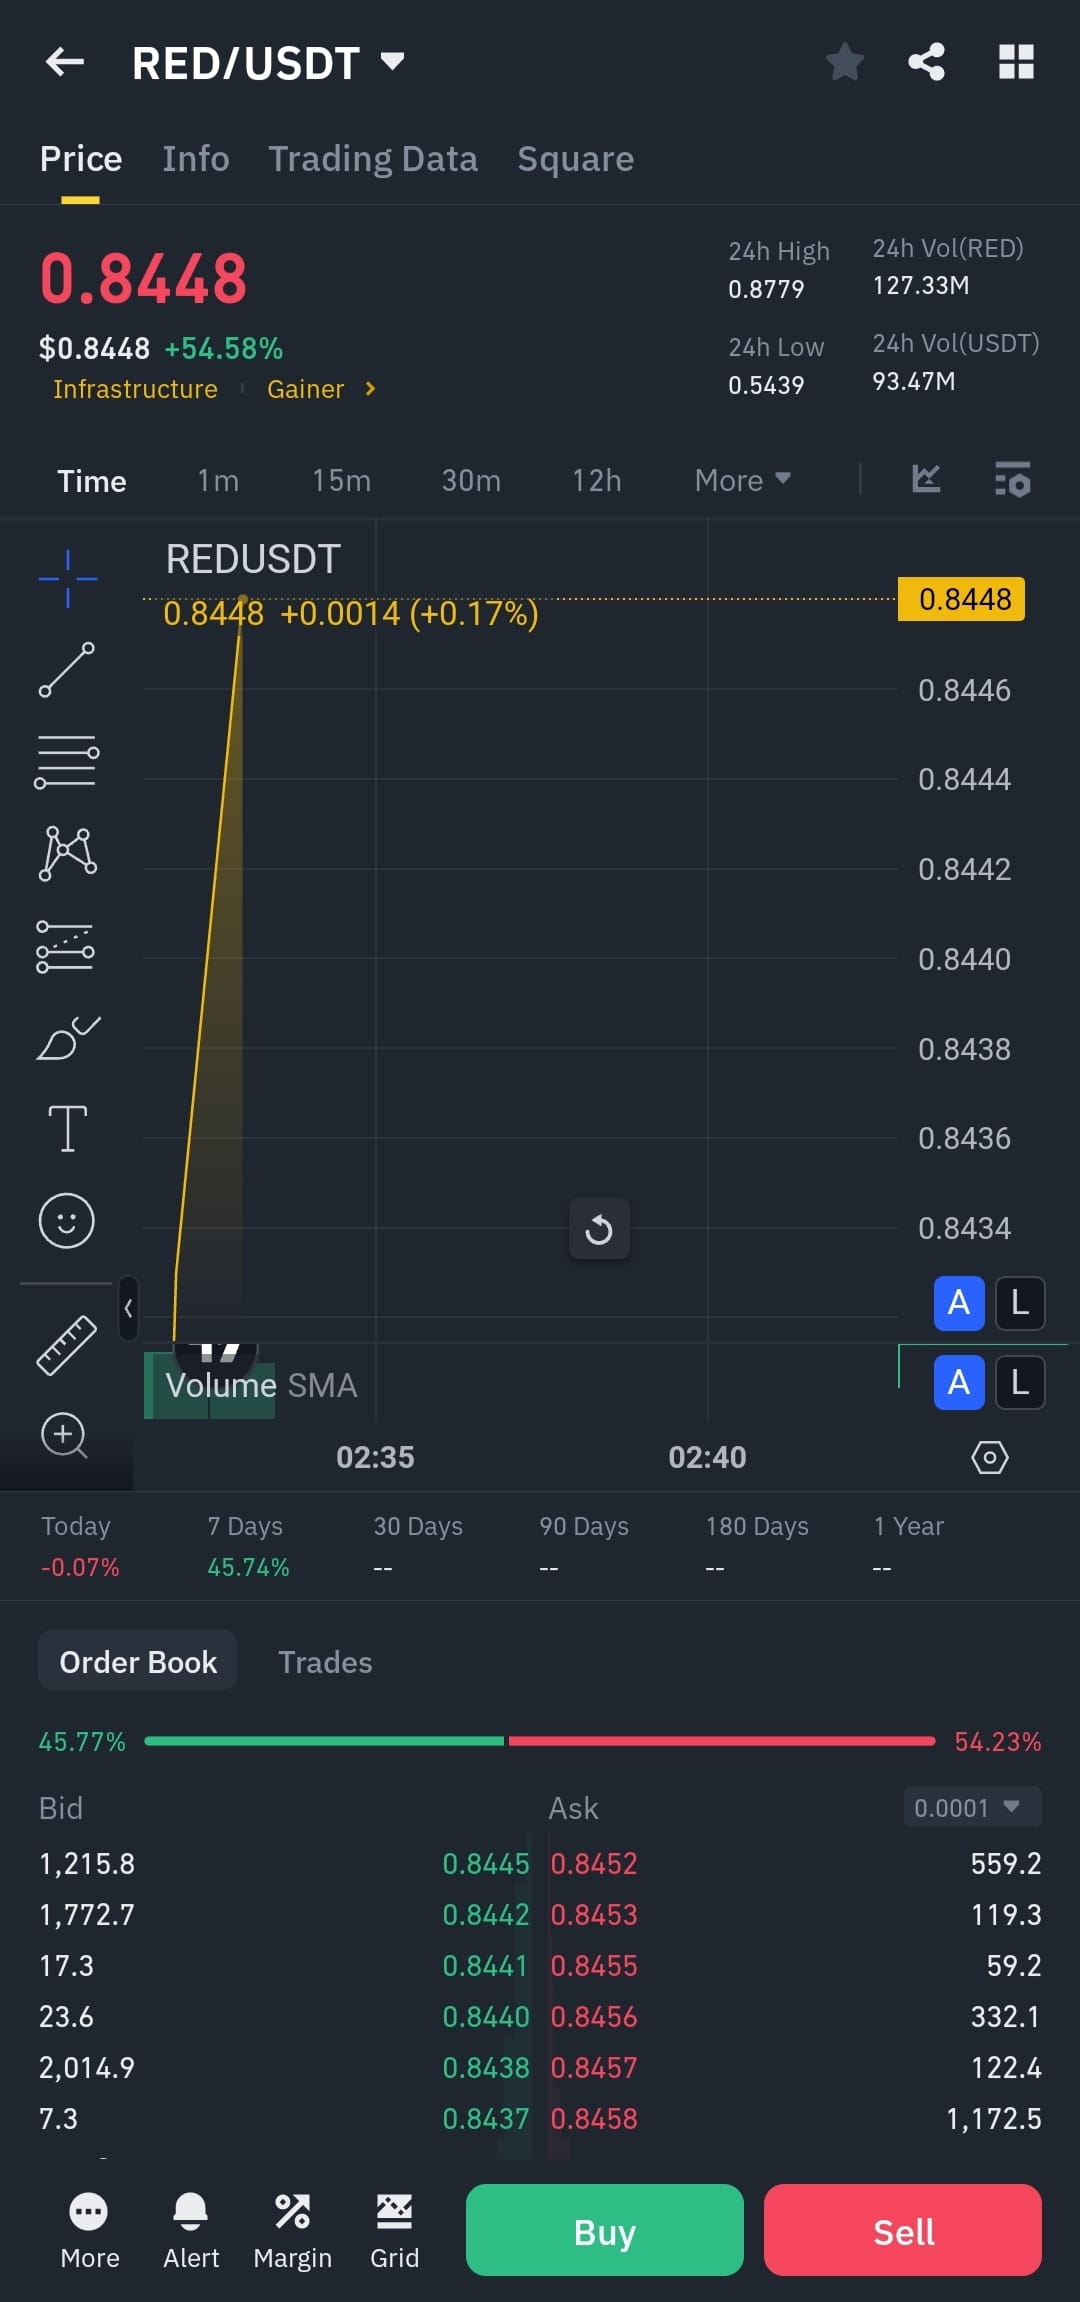
Bullishwhat's your thoughts on $RED
Will hit $1
Will hit $1
1
256
·
--
Bearish
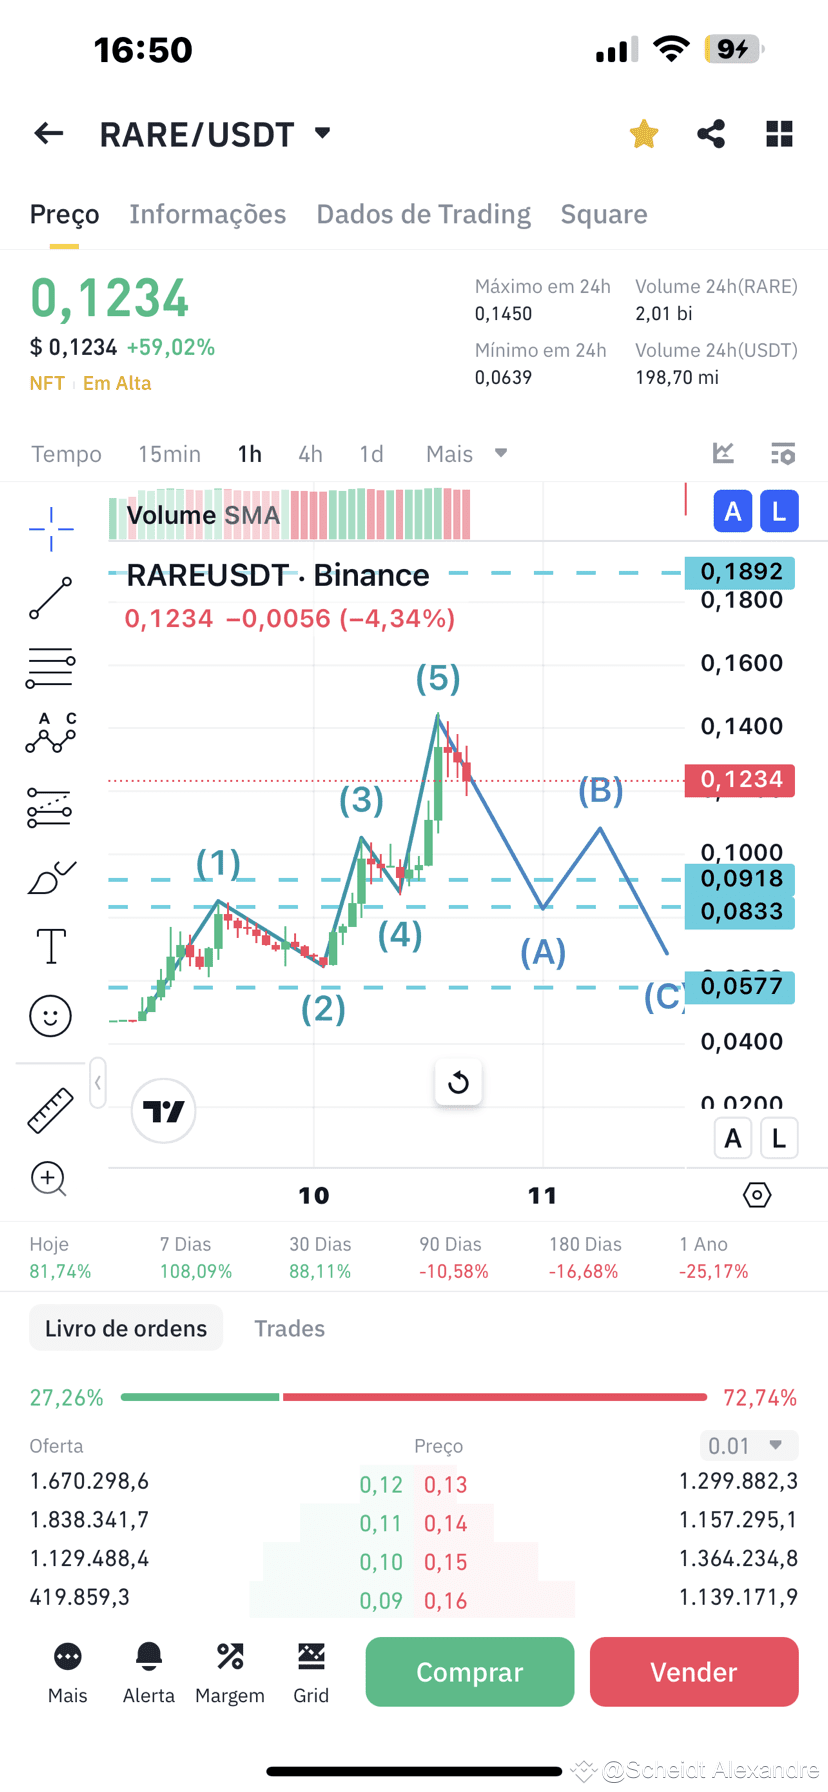
$RARE Correction Alert 🚨
Following the Elliott Wave Theory, the market has just completed its 5th Wave to start the correction of the A, B movement and enter wave C.
At the current moment, there is no possibility of buying.
( Many times the best thing to do is simply to do nothing.)
What should be done at this moment is to wait for the correction of A, B, and C to complete the first cycle represented in the 1-hour chart: (Complete movement of the Elliott Waves), to start a new cycle and act within a new wave 3 and 5 using all the necessary set of techniques such as: Understanding of trend, technical application of Fibonacci to consequently project the future.
$RARE Correction Alert 🚨
Following the Elliott Wave Theory, the market has just completed its 5th Wave to start the correction of the A, B movement and enter wave C.
At the current moment, there is no possibility of buying.
( Many times the best thing to do is simply to do nothing.)
What should be done at this moment is to wait for the correction of A, B, and C to complete the first cycle represented in the 1-hour chart: (Complete movement of the Elliott Waves), to start a new cycle and act within a new wave 3 and 5 using all the necessary set of techniques such as: Understanding of trend, technical application of Fibonacci to consequently project the future.
Following the Elliott Wave Theory, the market has just completed its 5th Wave to start the correction of the A, B movement and enter wave C.
At the current moment, there is no possibility of buying.
( Many times the best thing to do is simply to do nothing.)
What should be done at this moment is to wait for the correction of A, B, and C to complete the first cycle represented in the 1-hour chart: (Complete movement of the Elliott Waves), to start a new cycle and act within a new wave 3 and 5 using all the necessary set of techniques such as: Understanding of trend, technical application of Fibonacci to consequently project the future.
1
573
·
--
Bullish
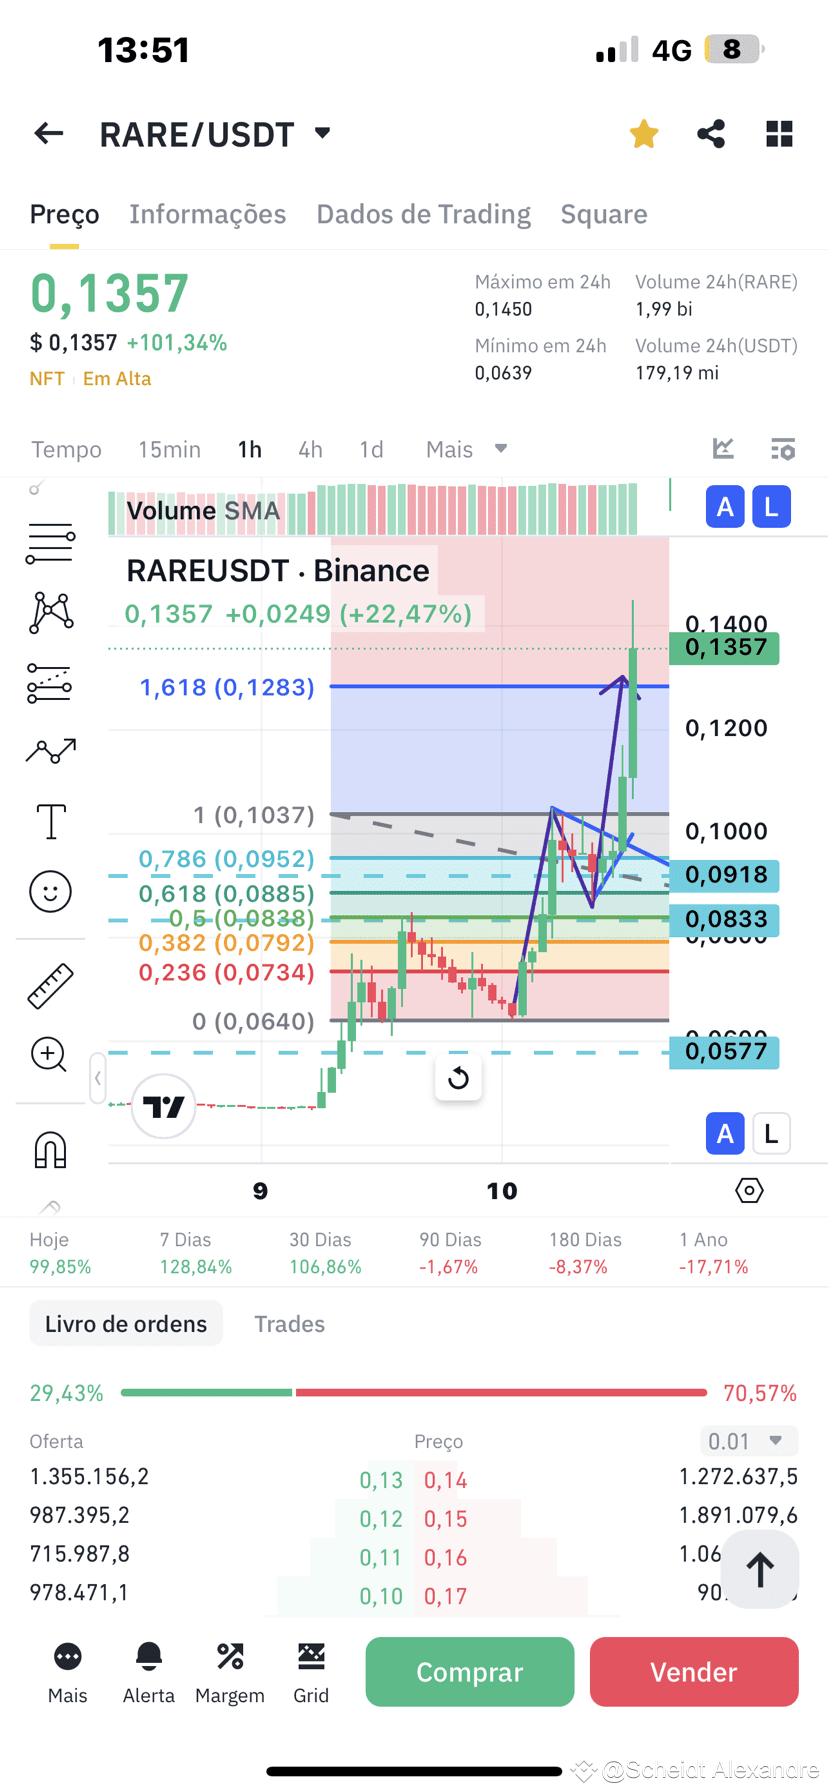
$RARE Daytrade successfully executed, the simple wins!!!
Understanding of trend and technical application of Fibonacci. Within the ongoing trend, a first bullish pivot was made (the wave advances, corrects, and advances again, completing a first cycle of rise)
From the second cycle, the market indicated a growing demand from the buying side, forming a new bullish pivot. Aligning this concept with the technical application of Fibonacci, the price corrected in the 61.8 region (Golden number) and projected to the 161.8 region achieving 100% of the movement
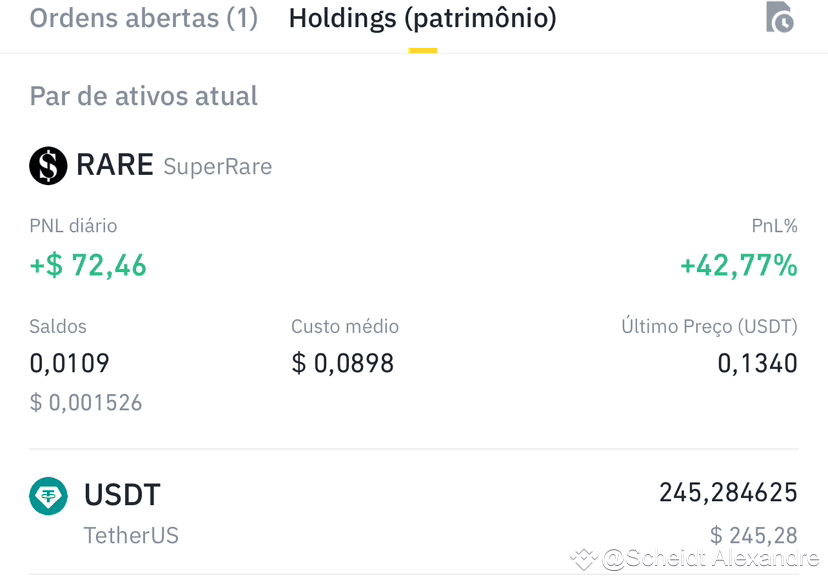
Entry made at 0.898 USD and technical exit in the region of 0.1300 USD
Totaling a profitability of approximately 420R$ in a single operation
Want to learn more? Follow me and I will show you the path to high performance!
$RARE Daytrade successfully executed, the simple wins!!!
Understanding of trend and technical application of Fibonacci. Within the ongoing trend, a first bullish pivot was made (the wave advances, corrects, and advances again, completing a first cycle of rise)
From the second cycle, the market indicated a growing demand from the buying side, forming a new bullish pivot. Aligning this concept with the technical application of Fibonacci, the price corrected in the 61.8 region (Golden number) and projected to the 161.8 region achieving 100% of the movement
Entry made at 0.898 USD and technical exit in the region of 0.1300 USD
Totaling a profitability of approximately 420R$ in a single operation
Want to learn more? Follow me and I will show you the path to high performance!
Understanding of trend and technical application of Fibonacci. Within the ongoing trend, a first bullish pivot was made (the wave advances, corrects, and advances again, completing a first cycle of rise)
From the second cycle, the market indicated a growing demand from the buying side, forming a new bullish pivot. Aligning this concept with the technical application of Fibonacci, the price corrected in the 61.8 region (Golden number) and projected to the 161.8 region achieving 100% of the movement
Entry made at 0.898 USD and technical exit in the region of 0.1300 USD
Totaling a profitability of approximately 420R$ in a single operation
Want to learn more? Follow me and I will show you the path to high performance!
8
5
19
19k
·
--
Bearish
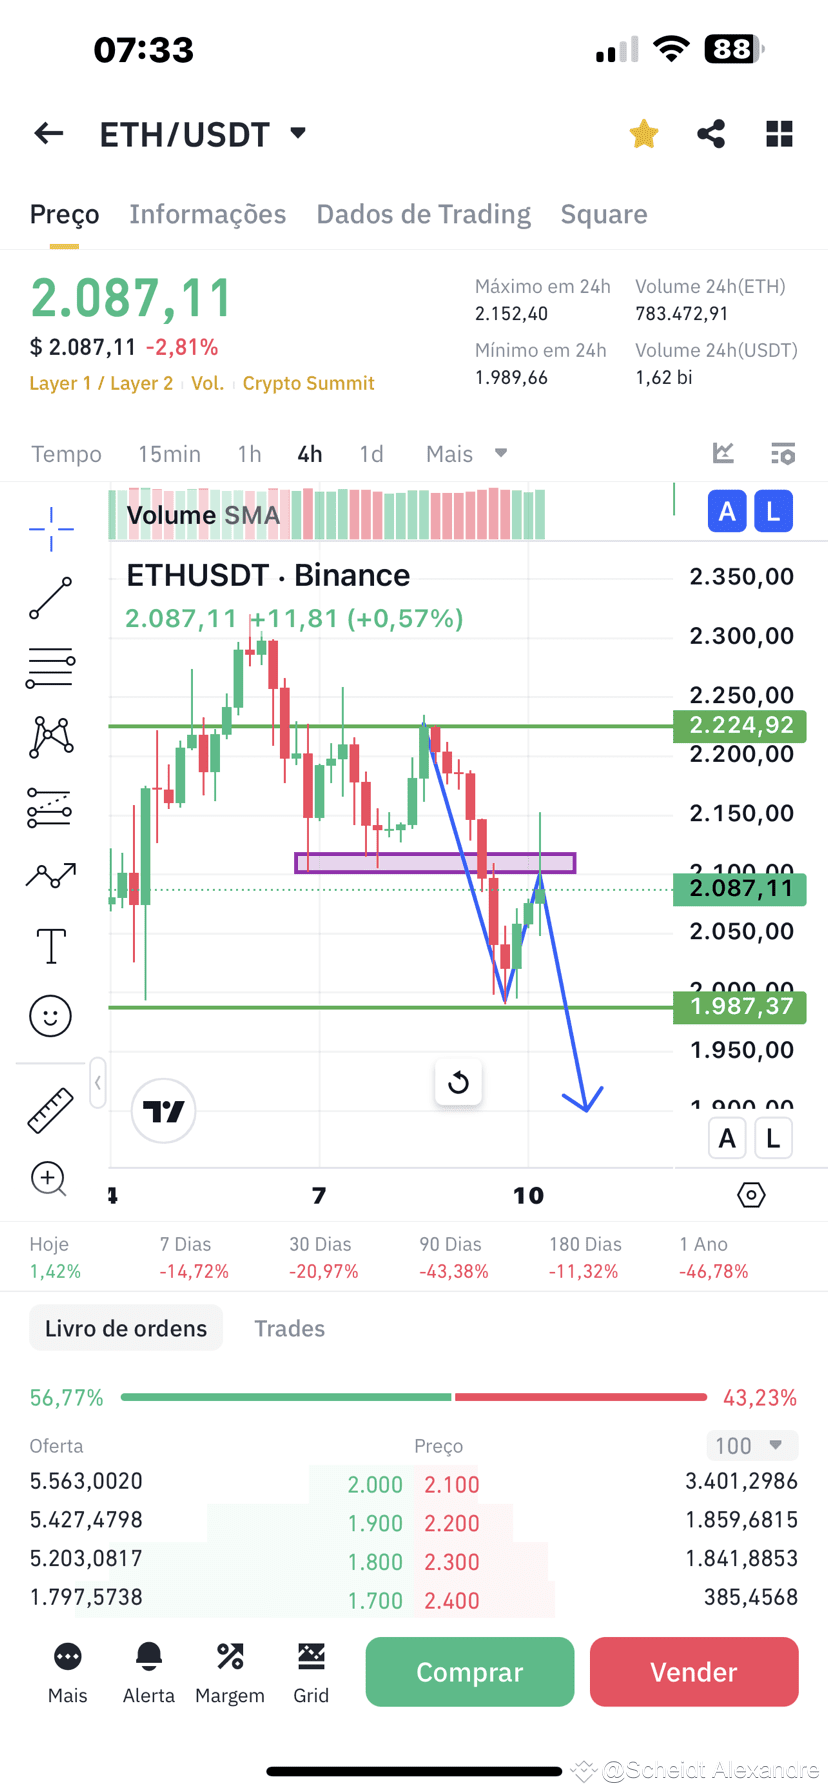
#ETH Movement Alert on $ETH
A pullback has just occurred in the region of 2,101.00 #USDT on the daily chart of 1h, demonstrating strength from the selling side towards Gaza Strip again at 2,000.00 USD.
Keeping in mind the confirmation of the pullback showing high demand from the selling side, the closest price defense levels are in the regions of:
1,900.00 USD
1,850.00 USD
1,730.00 USD
Within a financial strategy, putting all your capital in a single region would be foolish!
For example: (If you have 1,000.00 dollars available to invest, don't put it all in a single level, break that amount into several investments. This way, you will reduce your cost and stay close to the best buying levels within a future market uptrend.
#ETH Movement Alert on $ETH
A pullback has just occurred in the region of 2,101.00 #USDT on the daily chart of 1h, demonstrating strength from the selling side towards Gaza Strip again at 2,000.00 USD.
Keeping in mind the confirmation of the pullback showing high demand from the selling side, the closest price defense levels are in the regions of:
1,900.00 USD
1,850.00 USD
1,730.00 USD
Within a financial strategy, putting all your capital in a single region would be foolish!
For example: (If you have 1,000.00 dollars available to invest, don't put it all in a single level, break that amount into several investments. This way, you will reduce your cost and stay close to the best buying levels within a future market uptrend.
A pullback has just occurred in the region of 2,101.00 #USDT on the daily chart of 1h, demonstrating strength from the selling side towards Gaza Strip again at 2,000.00 USD.
Keeping in mind the confirmation of the pullback showing high demand from the selling side, the closest price defense levels are in the regions of:
1,900.00 USD
1,850.00 USD
1,730.00 USD
Within a financial strategy, putting all your capital in a single region would be foolish!
For example: (If you have 1,000.00 dollars available to invest, don't put it all in a single level, break that amount into several investments. This way, you will reduce your cost and stay close to the best buying levels within a future market uptrend.
1
625
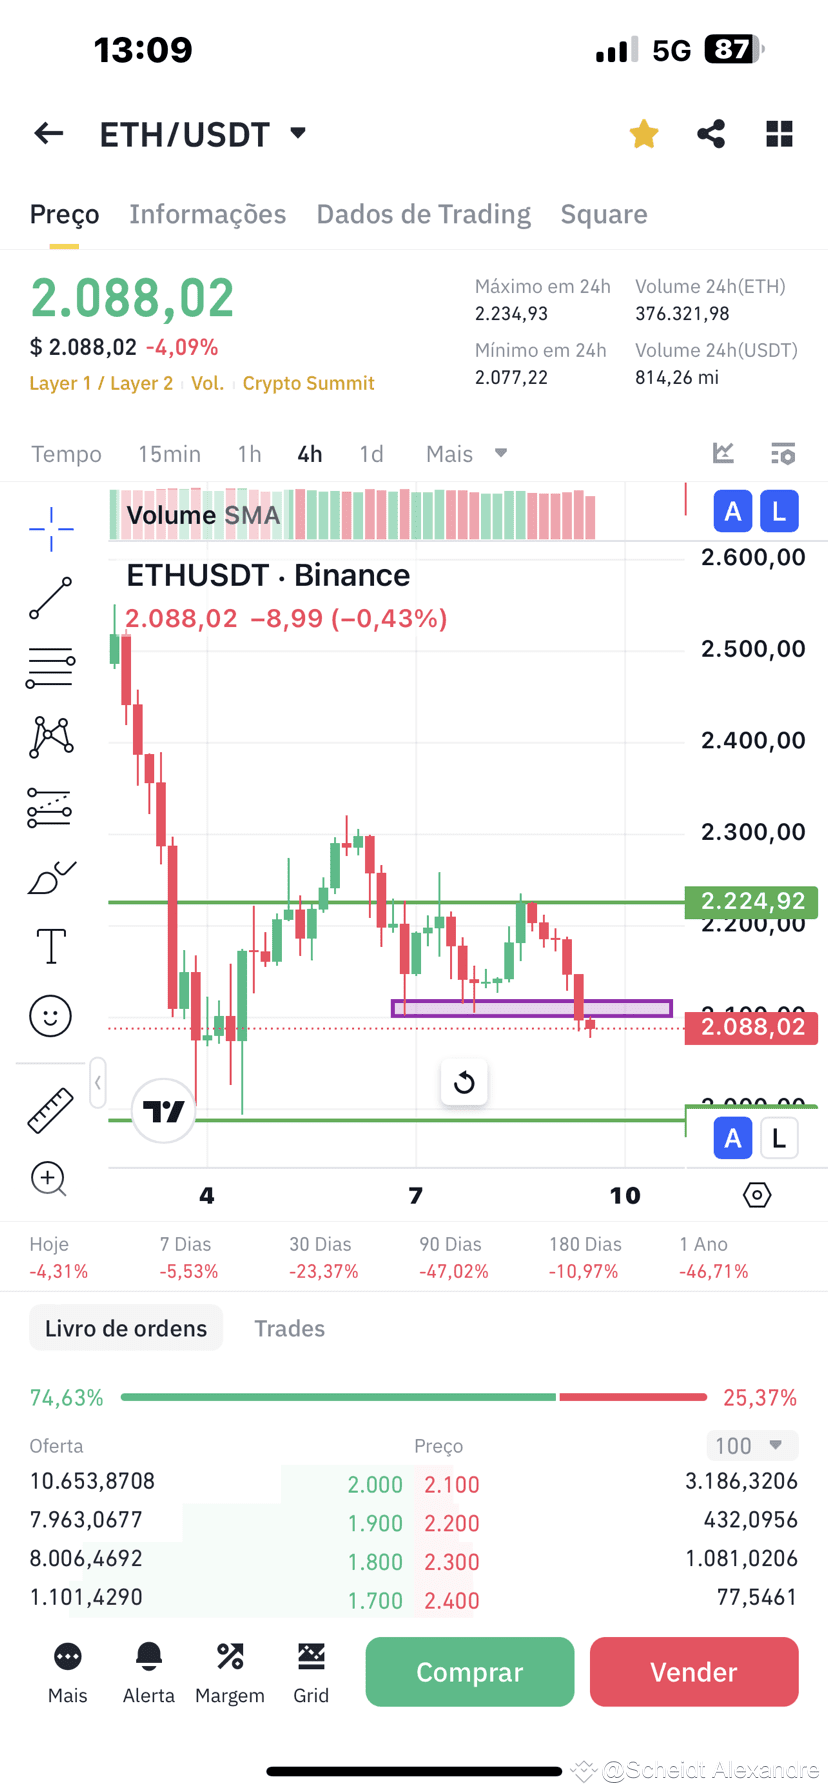
$ETH has just lost a psychological price level at around 2,100.00 USD, heading towards the Gaza Strip at around 2000 points. Critical alert on the monthly chart. If 1 candle on the monthly closes below 2,000.00 USD, we could see the quote approach around 1,100.00 USD
$ETH has just lost a psychological price level at around 2,100.00 USD, heading towards the Gaza Strip at around 2000 points. Critical alert on the monthly chart. If 1 candle on the monthly closes below 2,000.00 USD, we could see the quote approach around 1,100.00 USD
3
2
3
6.8k
·
--
Bearish
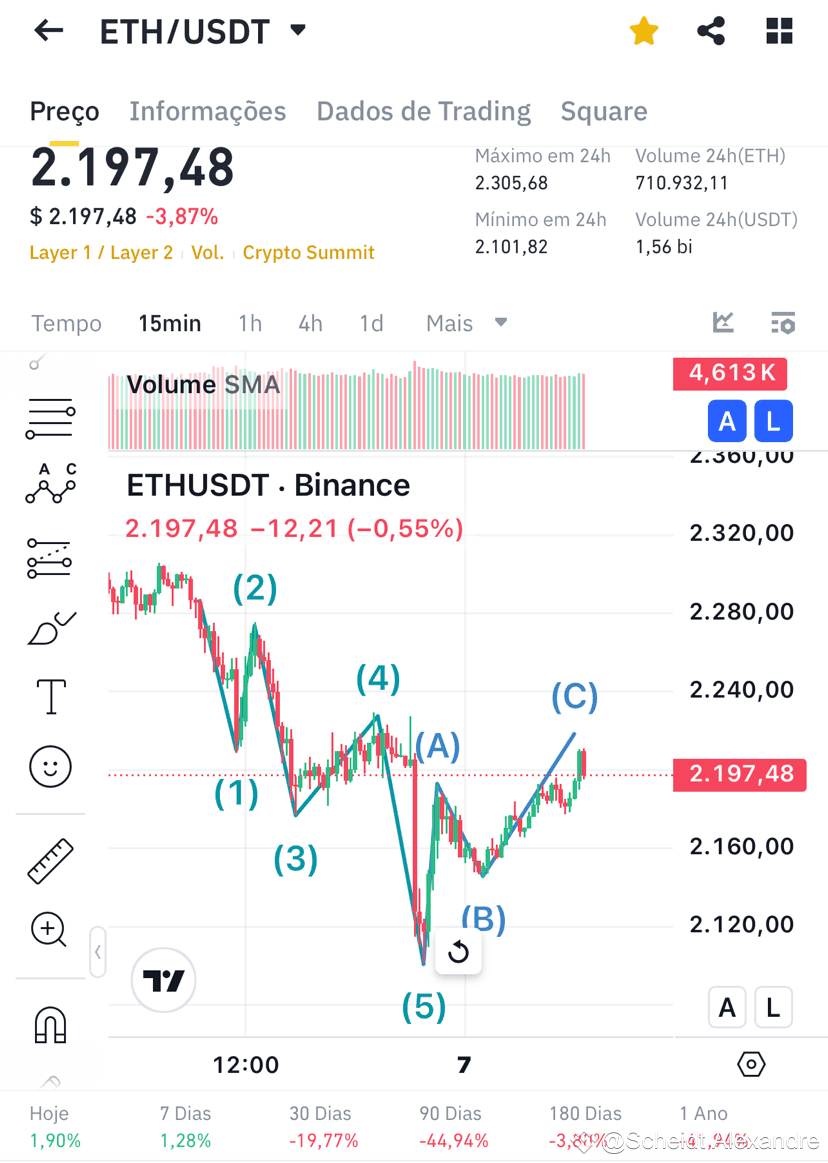
$ETH finishing its complete movement of Elliot waves: ( • FIRST CYCLE started its downward movement on the 1h chart. • SECOND CYCLE is clear on the 15-minute chart, having completed its complete wave movement 1,2,3,4,5 and is finalizing the correction A,B and C now. THIRD CYCLE can be analyzed on the 5-minute chart to refine the operation. Complete and rare movement to happen
According to Elliot's theory, considering the current downward trend, the market is finalizing its complete Elliot wave cycle in the downward trend to start a new downward cycle entering again into the Elliot waves keeping in mind that my FIRST CYCLE will be the 1H chart.
Future probabilities: The market of $ETH will look down again towards 2,000.00 #USD
If investors are not willing to take this risk at around 2,000.00 USD, on the monthly chart if a candle closes below 2,000.00 it may seek the fair price region around 1,100 #USD giving an opportunity for those already positioned to make new investments to mitigate their losses and subsequently return to positive
$ETH finishing its complete movement of Elliot waves: ( • FIRST CYCLE started its downward movement on the 1h chart. • SECOND CYCLE is clear on the 15-minute chart, having completed its complete wave movement 1,2,3,4,5 and is finalizing the correction A,B and C now. THIRD CYCLE can be analyzed on the 5-minute chart to refine the operation. Complete and rare movement to happen
According to Elliot's theory, considering the current downward trend, the market is finalizing its complete Elliot wave cycle in the downward trend to start a new downward cycle entering again into the Elliot waves keeping in mind that my FIRST CYCLE will be the 1H chart.
Future probabilities: The market of $ETH will look down again towards 2,000.00 #USD
If investors are not willing to take this risk at around 2,000.00 USD, on the monthly chart if a candle closes below 2,000.00 it may seek the fair price region around 1,100 #USD giving an opportunity for those already positioned to make new investments to mitigate their losses and subsequently return to positive
According to Elliot's theory, considering the current downward trend, the market is finalizing its complete Elliot wave cycle in the downward trend to start a new downward cycle entering again into the Elliot waves keeping in mind that my FIRST CYCLE will be the 1H chart.
Future probabilities: The market of $ETH will look down again towards 2,000.00 #USD
If investors are not willing to take this risk at around 2,000.00 USD, on the monthly chart if a candle closes below 2,000.00 it may seek the fair price region around 1,100 #USD giving an opportunity for those already positioned to make new investments to mitigate their losses and subsequently return to positive
8
2
14
7.5k
Log in to explore more content
Join global crypto users on Binance Square
⚡️ Get latest and useful information about crypto.
💬 Trusted by the world’s largest crypto exchange.
👍 Discover real insights from verified creators.
Email / Phone number
Trending Topics
CryptoSelloffTriggersMultipleWhaleLiquidations
53,046 views
732 Discussing
Crypto Liquidations Top $2B in 24 Hours as 329,000 Traders Are Wiped Out
Binance News
·27 Likes
·25.2k views
USSpotXRPETFsSeeLargestWeeklyOutflowIn8Months
79,876 views
946 Discussing
WillFOMCMinutesReinforceRateHikeExpectations?
12,835 views
299 Discussing