
Philippiens4-13
3.2k Posts

Philippiens4-13
Open Trade
High-Frequency Trader
4.2 Years
2.2K+ Following
247 Followers
45 Liked
Posts
Portfolio
All
Quotes
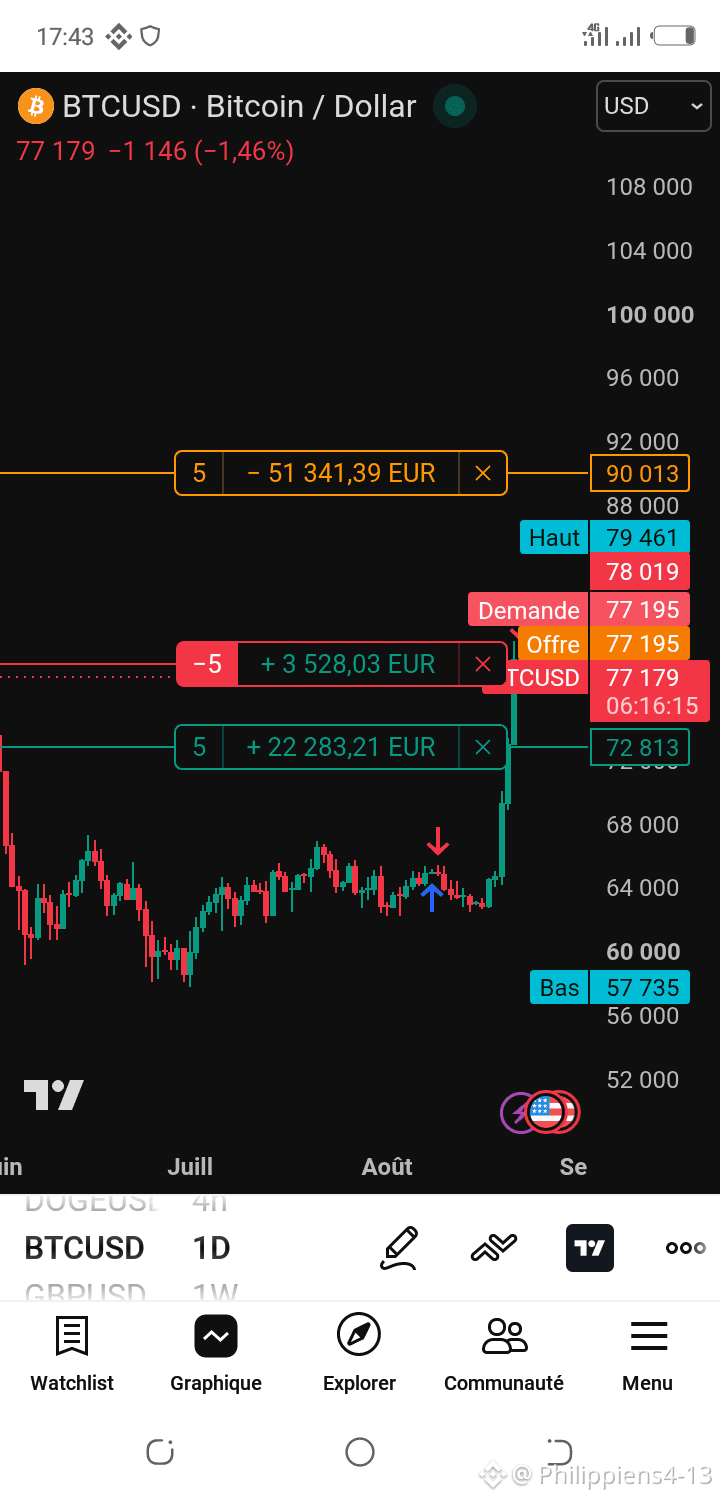
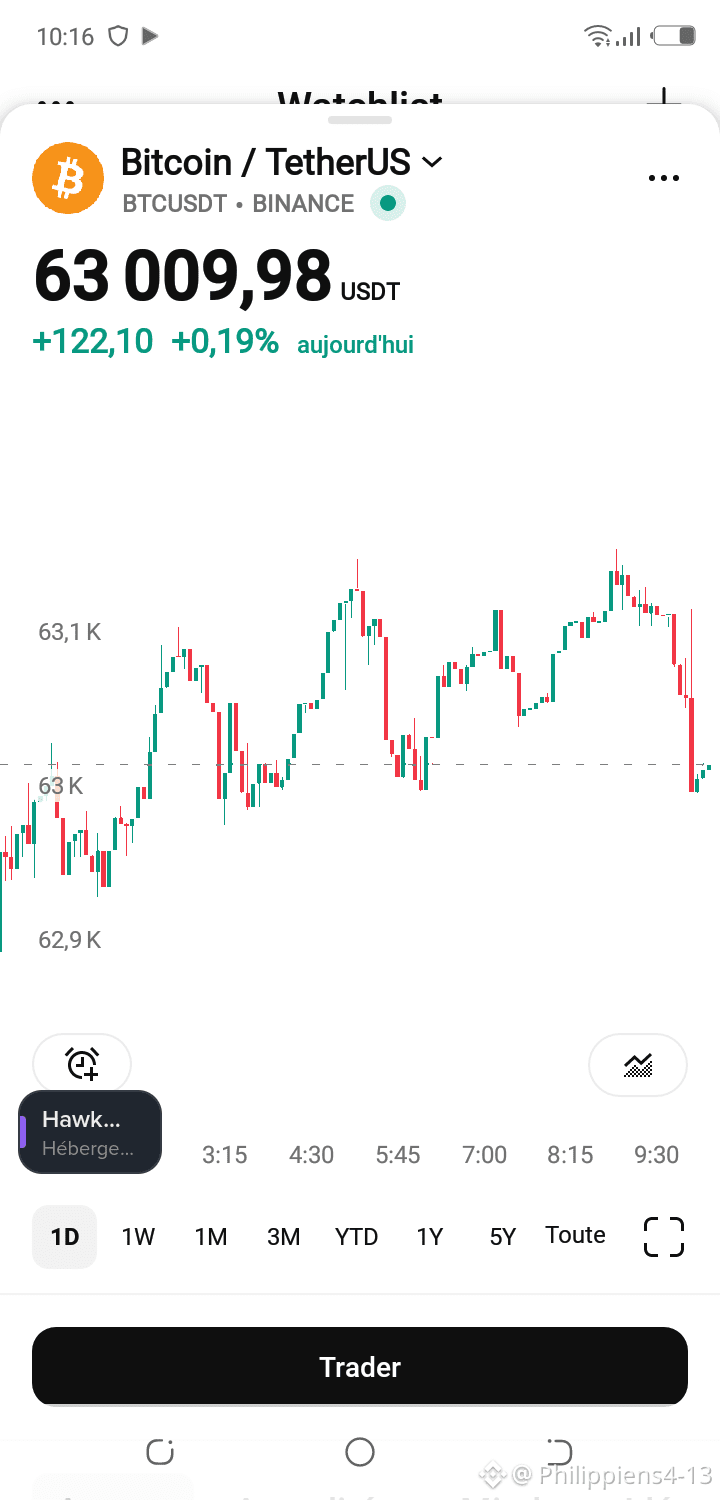
$BTC short I think that tomorrow the upward rebound will be fatal for my setup. It's the conviction that I have.
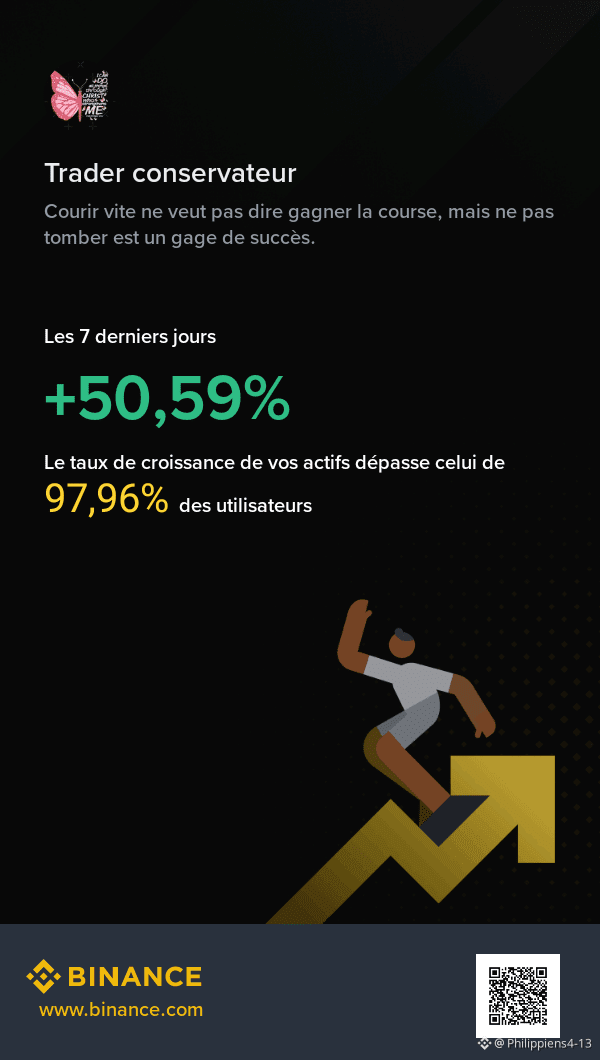
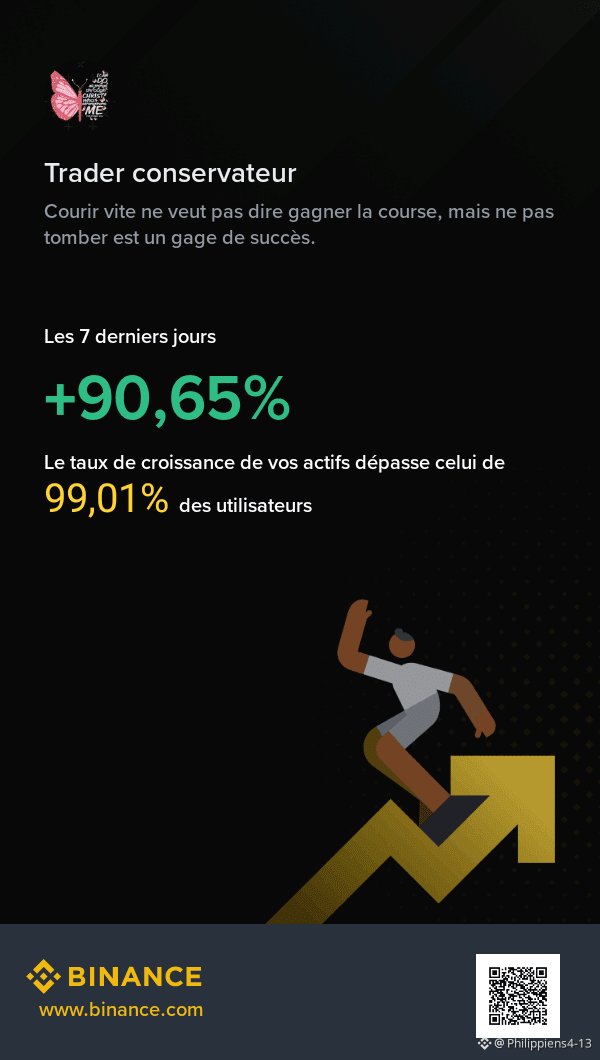
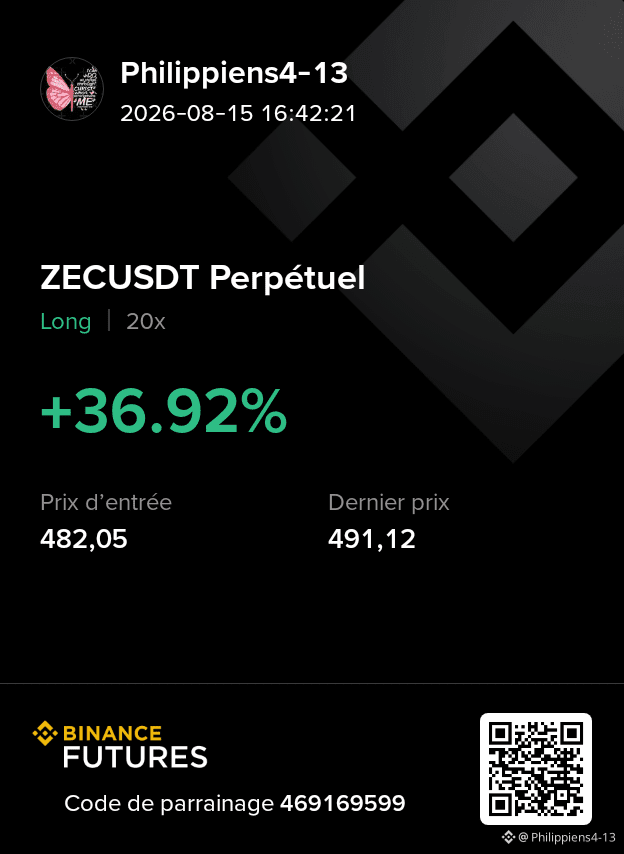
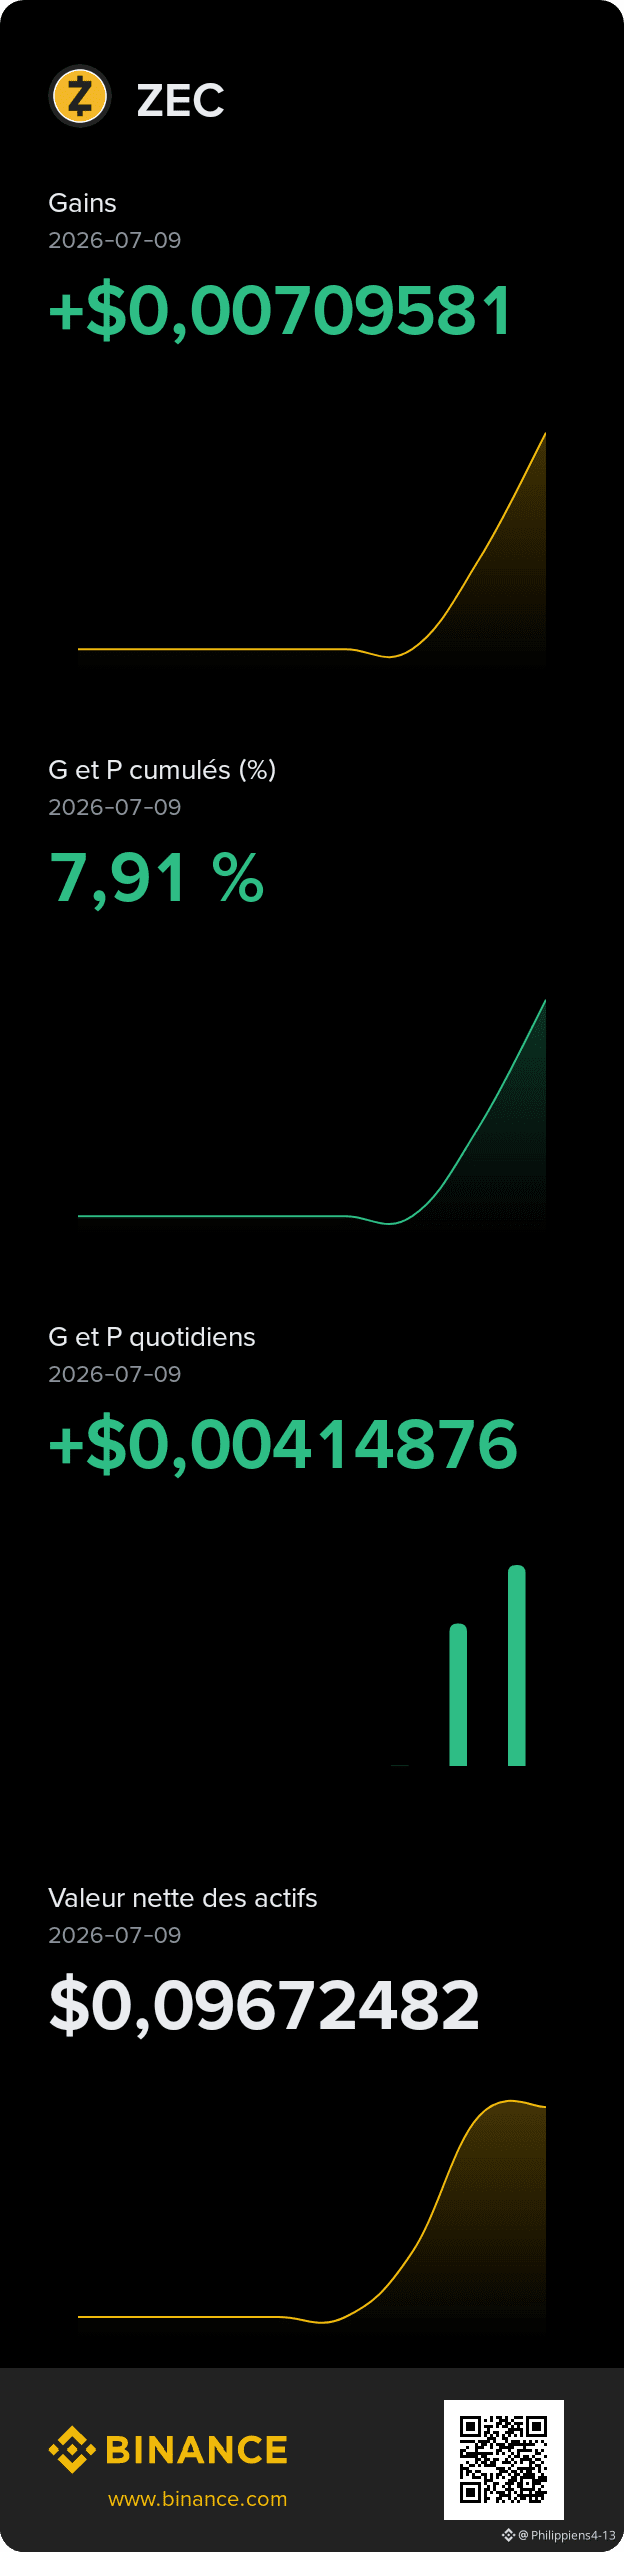
I think I had dreamed it up quickly, but it's just a rain check.. We're aiming for $1000 $ZEC d by September
Thanks
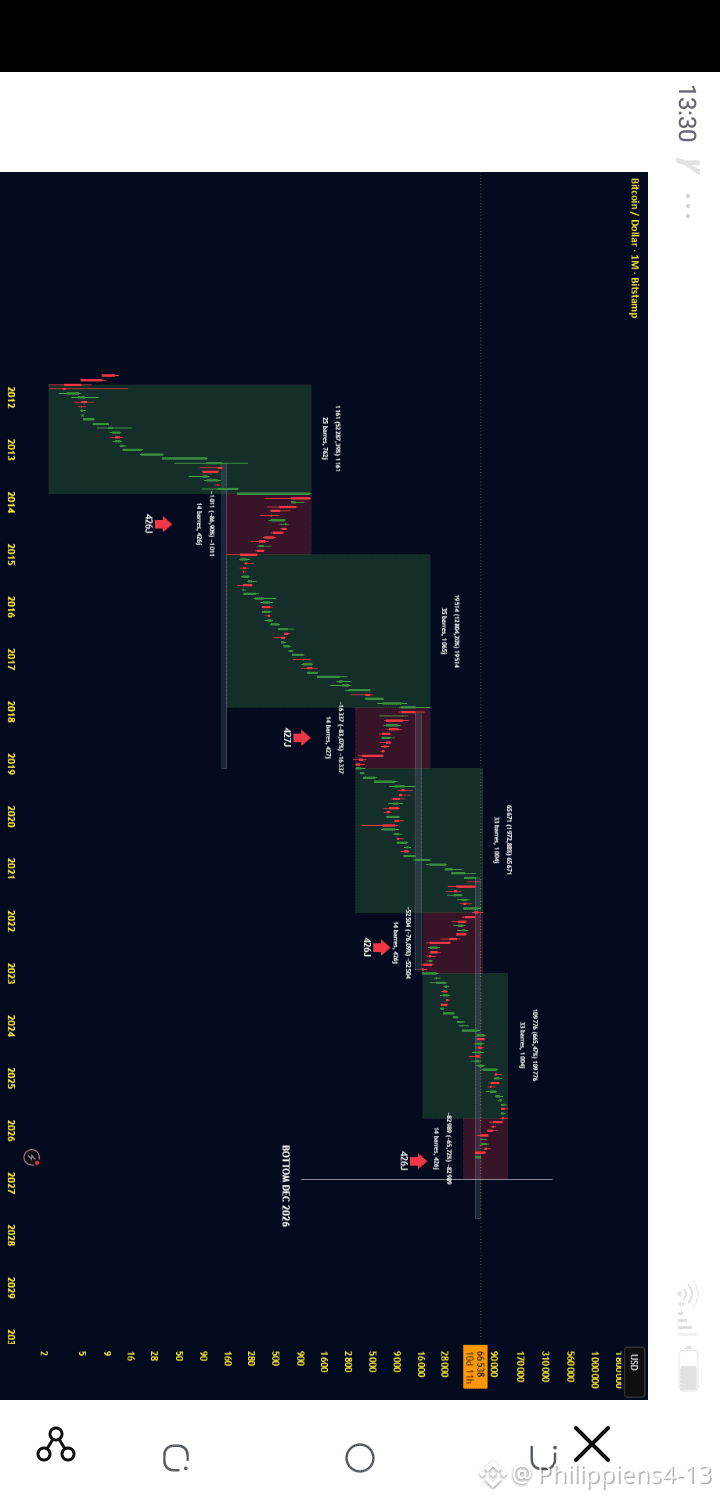
$BTC This type of chart is based on a **repeating cycle** assumption: each bearish phase (marked "426J") would last about the same number of days in every cycle, so the next trough would line up at the same time interval after the current peak—hence the projection to late 2026/early 2027.
A few things to keep in mind before you trust it:
- **Very small sample size**: we’re only talking about 3–4 historical cycles (2013, 2018, 2022...). Statistically, that’s not enough to establish a reliable rule—more like an ex post observation than a robust prediction.
- **The context changes**: past cycles were largely driven by the BTC halving (roughly every 4 years) and by a market that was still young and not very institutionalized. Today, with ETFs, institutional flows, and a much larger market cap, the market’s dynamics have changed—nothing guarantees the cycle mechanics remain identical.
- **Confirmation bias risk**: charts like this (rectangles + arrows with fixed durations) are often adjusted afterward to “fit” the past data, making them visually convincing without proving causation.
That said, the idea isn’t unreasonable by itself: the 4-year cycles tied to halving are still a framework used by many traders. But I’d suggest treating it as **one scenario among others**, not a certainty—one you should cross-check with on-chain data, market sentiment, and macro flows (rates, liquidity) rather than relying only on the chart’s geometry.
A few things to keep in mind before you trust it:
- **Very small sample size**: we’re only talking about 3–4 historical cycles (2013, 2018, 2022...). Statistically, that’s not enough to establish a reliable rule—more like an ex post observation than a robust prediction.
- **The context changes**: past cycles were largely driven by the BTC halving (roughly every 4 years) and by a market that was still young and not very institutionalized. Today, with ETFs, institutional flows, and a much larger market cap, the market’s dynamics have changed—nothing guarantees the cycle mechanics remain identical.
- **Confirmation bias risk**: charts like this (rectangles + arrows with fixed durations) are often adjusted afterward to “fit” the past data, making them visually convincing without proving causation.
That said, the idea isn’t unreasonable by itself: the 4-year cycles tied to halving are still a framework used by many traders. But I’d suggest treating it as **one scenario among others**, not a certainty—one you should cross-check with on-chain data, market sentiment, and macro flows (rates, liquidity) rather than relying only on the chart’s geometry.


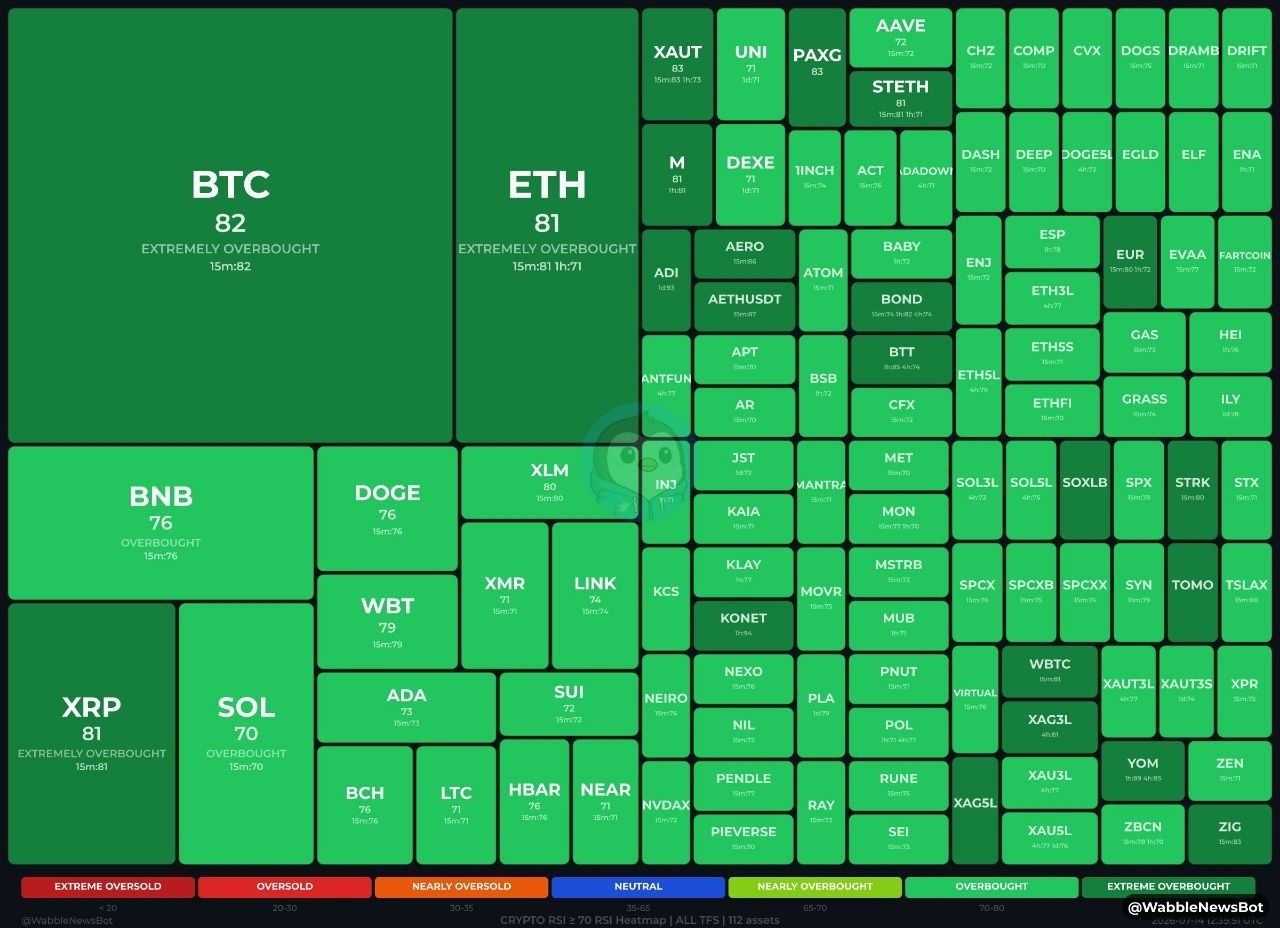
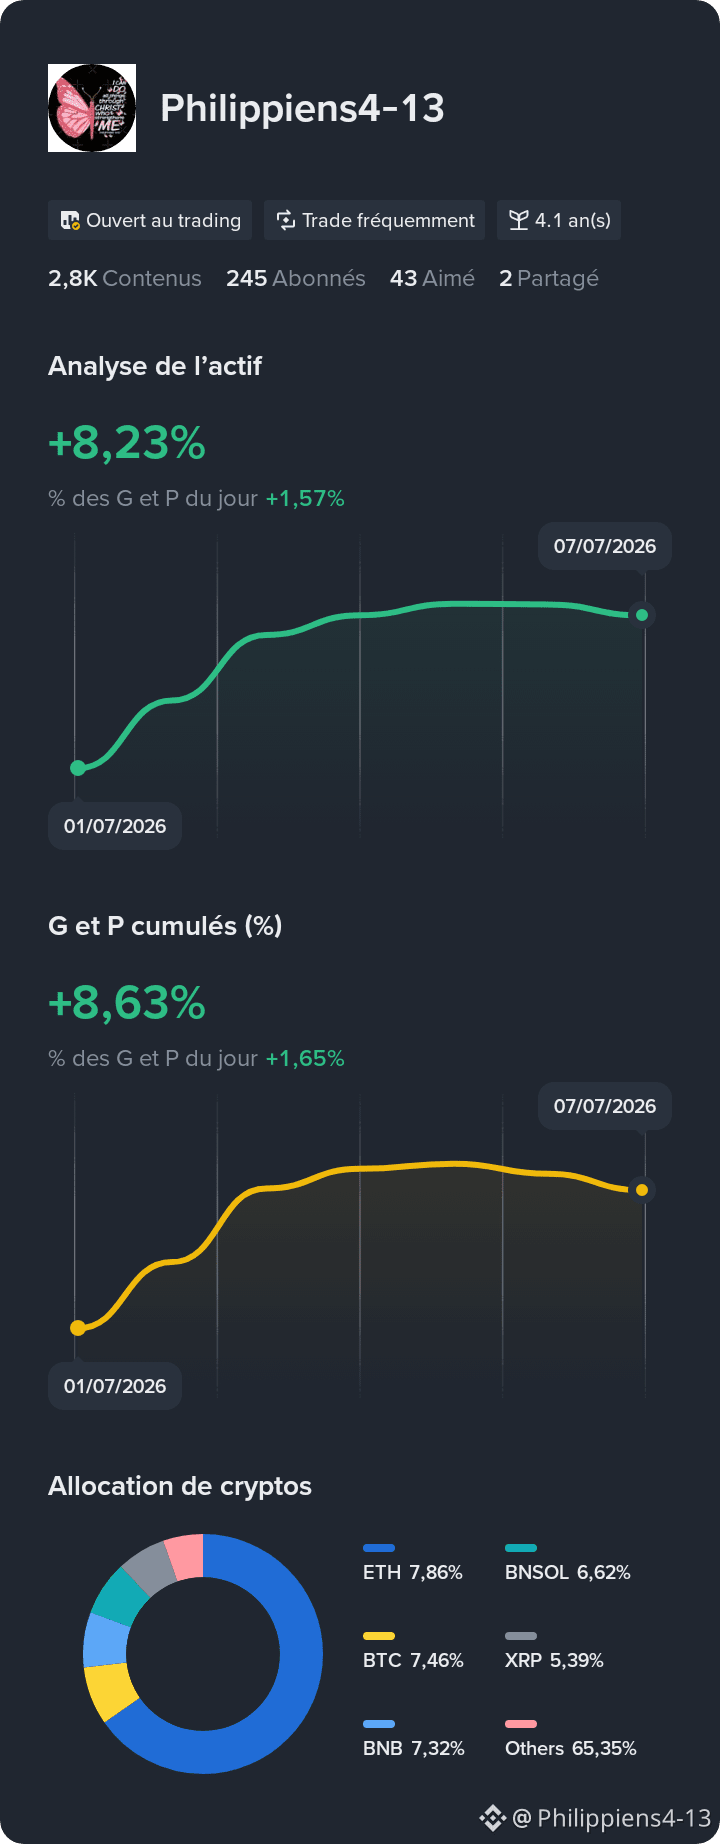
courage one day it will pay $BTC on we will #Millionnaire

Dramane crytos
·
--
In short, here are some of my collections. I wanted your advice on how to grow my collection—what pieces would you recommend for me right now?
#Binance #TradingTales
#Binance #TradingTales
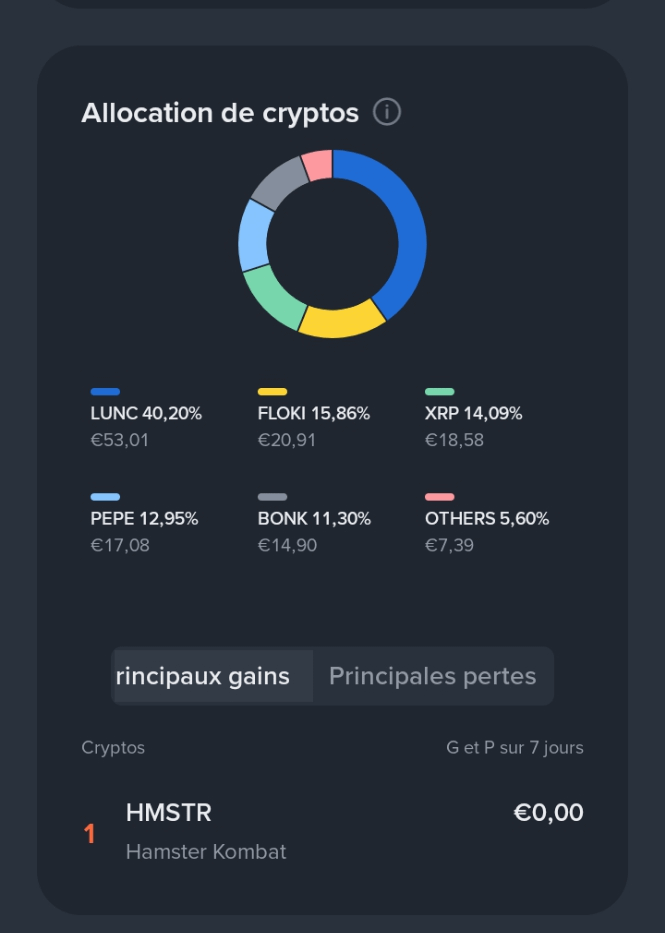
It's looking good in crypto, especially in trading. My next target. $BTC
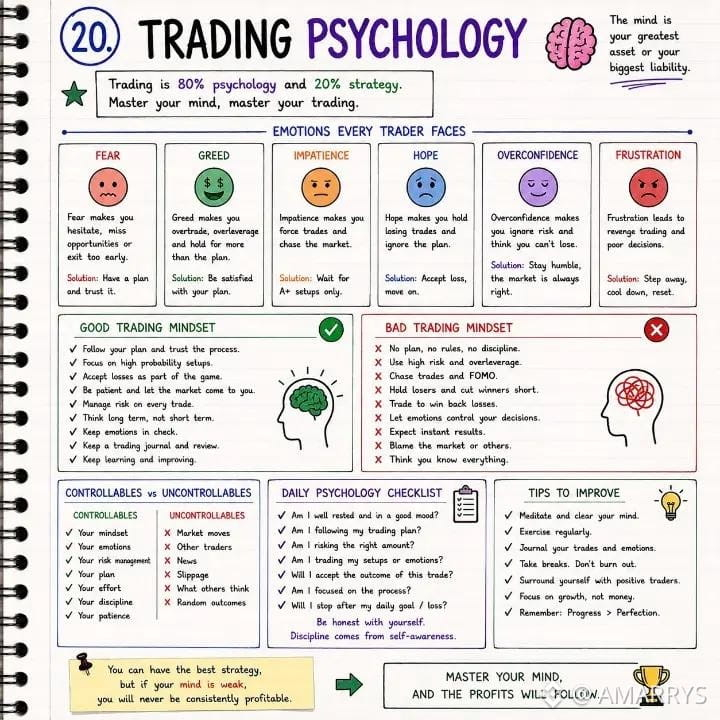

Meilleurs vœux !
From AMARRYS
Log in to explore more content