
EMA日报 _ EMA Daily
17 Posts

EMA日报 _ EMA Daily
Report
Block User
每日21:00(北京时间)更新EMA结构观察;1H跟踪,4H/日线看背景。盈亏如实复盘。
8 Following
51 Followers
16 Liked
Posts
Can BTC reclaim the EMA20 on the daily chart next week?
Can BTC reclaim the EMA20 on the daily chart next week?
能
不能
1 day(s) left
1.8k
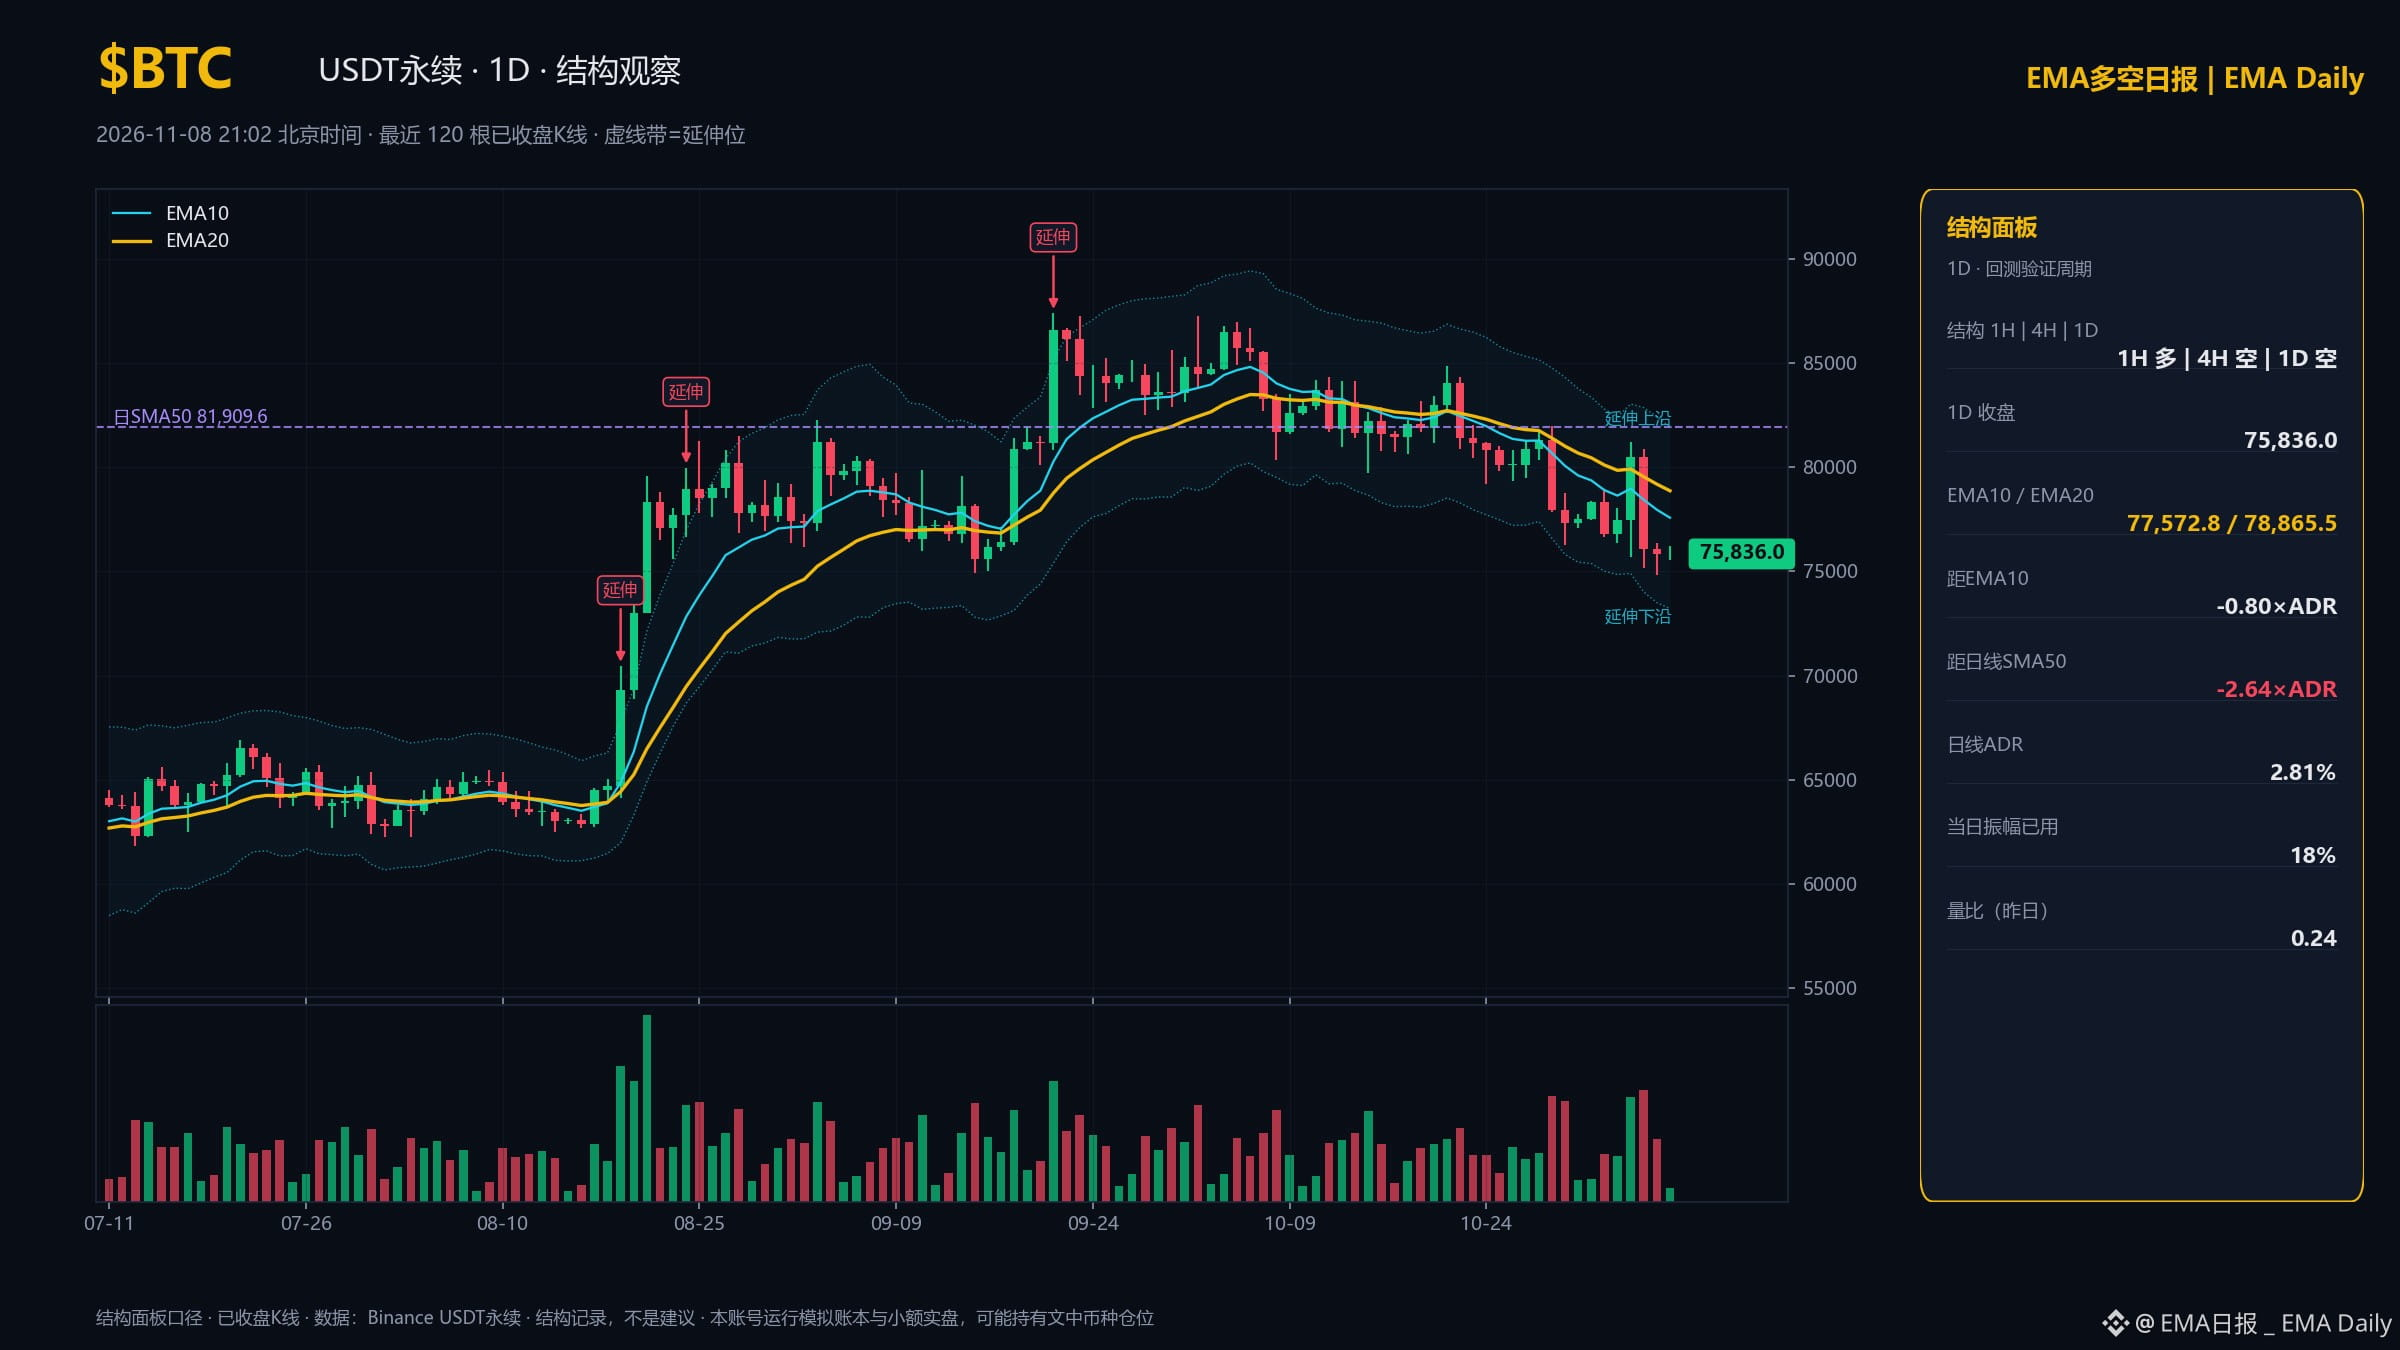
EMA Structure Daily Report | 2026-11-08 21:01 Beijing Time
Binance USDT Perpetuals | Based on the structure panel formula
Structure observation only; not a complete engine entry signal.
$BTC | 1H Long | 4H Short | Daily Short
1H close 75944.9; 4H EMA20 76385.8
Daily ADR 2.81% | Volume ratio 0.24
Daily distance from SMA50 -2.64×ADR; upper extension reference 81930.3
Today's range / average range over the previous 20 days: 17.0%
$ETH | 1H Short | 4H Short | Daily Short
1H close 2238.4; 4H EMA20 2256.2
Daily ADR 3.85% | Volume ratio 0.27
Daily distance from SMA50 -2.64×ADR; upper extension reference 2458.2
Today's range / average range over the previous 20 days: 15.6%
$SOL | 1H Short | 4H Short | Daily Short
1H close 89.51; 4H EMA20 90.57
Daily ADR 4.32% | Volume ratio 0.37
Daily distance from SMA50 -3.86×ADR; upper extension reference 101.52
Today's range / average range over the previous 20 days: 25.4%
BNB | 1H Long | 4H Short | Daily Short
1H close 699.59; 4H EMA20 698.31
Daily ADR 3.26% | Volume ratio 0.28
Daily distance from SMA50 -2.01×ADR; upper extension reference 752.17
Today's range / average range over the previous 20 days: 34.0%
Closed data as of (Beijing Time): 1H 11-08 21:00; 4H 11-08 20:00; Daily 11-08 08:00
Methodology: EMA10>EMA20 is Long; otherwise, classified as Short according to the original panel. This does not constitute permission to enter a trade. Daily ADR is the average of recent ranges and includes the most recently closed daily candle; the daily volume ratio likewise uses closed daily data.
Today's range accumulates only closed 1H candles; the UTC day starts at 08:00 Beijing Time. The range ratio can exceed 100%; this does not indicate remaining room. An extension reference level does not mean an exhaustion event has been triggered, and moving averages are not guaranteed support or resistance.
#EMA #Market Watch
Not investment advice.
EMA Structure Daily Report | 2026-11-08 21:01 Beijing Time
Binance USDT Perpetuals | Based on the structure panel formula
Structure observation only; not a complete engine entry signal.
$BTC | 1H Long | 4H Short | Daily Short
1H close 75944.9; 4H EMA20 76385.8
Daily ADR 2.81% | Volume ratio 0.24
Daily distance from SMA50 -2.64×ADR; upper extension reference 81930.3
Today's range / average range over the previous 20 days: 17.0%
$ETH | 1H Short | 4H Short | Daily Short
1H close 2238.4; 4H EMA20 2256.2
Daily ADR 3.85% | Volume ratio 0.27
Daily distance from SMA50 -2.64×ADR; upper extension reference 2458.2
Today's range / average range over the previous 20 days: 15.6%
$SOL | 1H Short | 4H Short | Daily Short
1H close 89.51; 4H EMA20 90.57
Daily ADR 4.32% | Volume ratio 0.37
Daily distance from SMA50 -3.86×ADR; upper extension reference 101.52
Today's range / average range over the previous 20 days: 25.4%
BNB | 1H Long | 4H Short | Daily Short
1H close 699.59; 4H EMA20 698.31
Daily ADR 3.26% | Volume ratio 0.28
Daily distance from SMA50 -2.01×ADR; upper extension reference 752.17
Today's range / average range over the previous 20 days: 34.0%
Closed data as of (Beijing Time): 1H 11-08 21:00; 4H 11-08 20:00; Daily 11-08 08:00
Methodology: EMA10>EMA20 is Long; otherwise, classified as Short according to the original panel. This does not constitute permission to enter a trade. Daily ADR is the average of recent ranges and includes the most recently closed daily candle; the daily volume ratio likewise uses closed daily data.
Today's range accumulates only closed 1H candles; the UTC day starts at 08:00 Beijing Time. The range ratio can exceed 100%; this does not indicate remaining room. An extension reference level does not mean an exhaustion event has been triggered, and moving averages are not guaranteed support or resistance.
#EMA #Market Watch
Not investment advice.
Binance USDT Perpetuals | Based on the structure panel formula
Structure observation only; not a complete engine entry signal.
$BTC | 1H Long | 4H Short | Daily Short
1H close 75944.9; 4H EMA20 76385.8
Daily ADR 2.81% | Volume ratio 0.24
Daily distance from SMA50 -2.64×ADR; upper extension reference 81930.3
Today's range / average range over the previous 20 days: 17.0%
$ETH | 1H Short | 4H Short | Daily Short
1H close 2238.4; 4H EMA20 2256.2
Daily ADR 3.85% | Volume ratio 0.27
Daily distance from SMA50 -2.64×ADR; upper extension reference 2458.2
Today's range / average range over the previous 20 days: 15.6%
$SOL | 1H Short | 4H Short | Daily Short
1H close 89.51; 4H EMA20 90.57
Daily ADR 4.32% | Volume ratio 0.37
Daily distance from SMA50 -3.86×ADR; upper extension reference 101.52
Today's range / average range over the previous 20 days: 25.4%
BNB | 1H Long | 4H Short | Daily Short
1H close 699.59; 4H EMA20 698.31
Daily ADR 3.26% | Volume ratio 0.28
Daily distance from SMA50 -2.01×ADR; upper extension reference 752.17
Today's range / average range over the previous 20 days: 34.0%
Closed data as of (Beijing Time): 1H 11-08 21:00; 4H 11-08 20:00; Daily 11-08 08:00
Methodology: EMA10>EMA20 is Long; otherwise, classified as Short according to the original panel. This does not constitute permission to enter a trade. Daily ADR is the average of recent ranges and includes the most recently closed daily candle; the daily volume ratio likewise uses closed daily data.
Today's range accumulates only closed 1H candles; the UTC day starts at 08:00 Beijing Time. The range ratio can exceed 100%; this does not indicate remaining room. An extension reference level does not mean an exhaustion event has been triggered, and moving averages are not guaranteed support or resistance.
#EMA #Market Watch
Not investment advice.
294
$BNB|Structure Watch 11-08 17:15 Beijing Time
1H long|4H short|Daily short
1H close 699.38; 4H EMA20 698.17; Daily SMA50 745.59
Daily ADR 3.26%|34% of the day's range used|Volume ratio 0.28
My view: 1H is rebounding, but 4H is still bearish. The area around EMA20 698.17 is a level to watch for resistance; only a 4H close above it would signal a bullish shift. Until then, treat it as a rebound.
Verification: I'll review this on Wednesday (11-11). A close below the 4H EMA20 means the bearish structure remains intact; otherwise, the structure is invalidated. I'll share the results.
Based on the OKCPA v38.6 base panel metrics; this is a structure watch, not an entry signal.
#EMA #MarketWatch
This does not constitute investment advice.
$BNB |Structure Watch 11-08 17:15 Beijing Time
1H long|4H short|Daily short
1H close 699.38; 4H EMA20 698.17; Daily SMA50 745.59
Daily ADR 3.26%|34% of the day's range used|Volume ratio 0.28
My view: 1H is rebounding, but 4H is still bearish. The area around EMA20 698.17 is a level to watch for resistance; only a 4H close above it would signal a bullish shift. Until then, treat it as a rebound.
Verification: I'll review this on Wednesday (11-11). A close below the 4H EMA20 means the bearish structure remains intact; otherwise, the structure is invalidated. I'll share the results.
Based on the OKCPA v38.6 base panel metrics; this is a structure watch, not an entry signal.
#EMA #MarketWatch
This does not constitute investment advice.
1H long|4H short|Daily short
1H close 699.38; 4H EMA20 698.17; Daily SMA50 745.59
Daily ADR 3.26%|34% of the day's range used|Volume ratio 0.28
My view: 1H is rebounding, but 4H is still bearish. The area around EMA20 698.17 is a level to watch for resistance; only a 4H close above it would signal a bullish shift. Until then, treat it as a rebound.
Verification: I'll review this on Wednesday (11-11). A close below the 4H EMA20 means the bearish structure remains intact; otherwise, the structure is invalidated. I'll share the results.
Based on the OKCPA v38.6 base panel metrics; this is a structure watch, not an entry signal.
#EMA #MarketWatch
This does not constitute investment advice.
50
EMA Long/Short Daily Report | This Week’s Strategy Tracking
Reporting period: November 2, 2026, 00:00–November 8, 13:58, Beijing time. This week is not yet over; statistics are based on exit time.
【Long B4+S1R】
0 trades closed this week, so no win rate can be calculated. Note: No closed trades does not mean no positions were opened or that there are no current positions.
【Short SD+S1R】
5 trades closed: 3 wins, 2 losses; win rate 60.0%.
Cumulative P&L: +2.75R.
Individual results:
$XLM: -1.23R, hard stop-loss hit intraday
$ICP: -0.40R, engine-driven exit at close
$TRUMP: +1.41R, exited after intraday stop-loss was triggered
$HUMA: +2.13R, exited after a three-candle reversal
$IRYS: +0.85R, exited under the maximum pain rule
This week’s observation: A triggered stop-loss does not necessarily mean a loss. For example, the TRUMP trade was recorded as a profitable exit in the ledger. Both losing trades are also included; only winning trades are not shown.
There are currently only 5 closed short trades in the sample, which is not enough to conclude that the strategy has a consistent edge. We will continue tracking the same ledger and recording P&L and exit reasons.
#EMA #TradeReview
This is not investment advice.
EMA Long/Short Daily Report | This Week’s Strategy Tracking
Reporting period: November 2, 2026, 00:00–November 8, 13:58, Beijing time. This week is not yet over; statistics are based on exit time.
【Long B4+S1R】
0 trades closed this week, so no win rate can be calculated. Note: No closed trades does not mean no positions were opened or that there are no current positions.
【Short SD+S1R】
5 trades closed: 3 wins, 2 losses; win rate 60.0%.
Cumulative P&L: +2.75R.
Individual results:
$XLM: -1.23R, hard stop-loss hit intraday
$ICP: -0.40R, engine-driven exit at close
$TRUMP: +1.41R, exited after intraday stop-loss was triggered
$HUMA: +2.13R, exited after a three-candle reversal
$IRYS: +0.85R, exited under the maximum pain rule
This week’s observation: A triggered stop-loss does not necessarily mean a loss. For example, the TRUMP trade was recorded as a profitable exit in the ledger. Both losing trades are also included; only winning trades are not shown.
There are currently only 5 closed short trades in the sample, which is not enough to conclude that the strategy has a consistent edge. We will continue tracking the same ledger and recording P&L and exit reasons.
#EMA #TradeReview
This is not investment advice.
Reporting period: November 2, 2026, 00:00–November 8, 13:58, Beijing time. This week is not yet over; statistics are based on exit time.
【Long B4+S1R】
0 trades closed this week, so no win rate can be calculated. Note: No closed trades does not mean no positions were opened or that there are no current positions.
【Short SD+S1R】
5 trades closed: 3 wins, 2 losses; win rate 60.0%.
Cumulative P&L: +2.75R.
Individual results:
$XLM: -1.23R, hard stop-loss hit intraday
$ICP: -0.40R, engine-driven exit at close
$TRUMP: +1.41R, exited after intraday stop-loss was triggered
$HUMA: +2.13R, exited after a three-candle reversal
$IRYS: +0.85R, exited under the maximum pain rule
This week’s observation: A triggered stop-loss does not necessarily mean a loss. For example, the TRUMP trade was recorded as a profitable exit in the ledger. Both losing trades are also included; only winning trades are not shown.
There are currently only 5 closed short trades in the sample, which is not enough to conclude that the strategy has a consistent edge. We will continue tracking the same ledger and recording P&L and exit reasons.
#EMA #TradeReview
This is not investment advice.
669
EMA Long/Short Daily Report | EMA Daily: Connection and currency tag test. EMA structure observations are planned to be updated at 21:00 Beijing time, with live and simulated trading recorded separately. This post contains no trading signals.$BTC $ETH #EMA
EMA Long/Short Daily Report | EMA Daily: Connection and currency tag test. EMA structure observations are planned to be updated at 21:00 Beijing time, with live and simulated trading recorded separately. This post contains no trading signals.$BTC $ETH #EMA
268
192
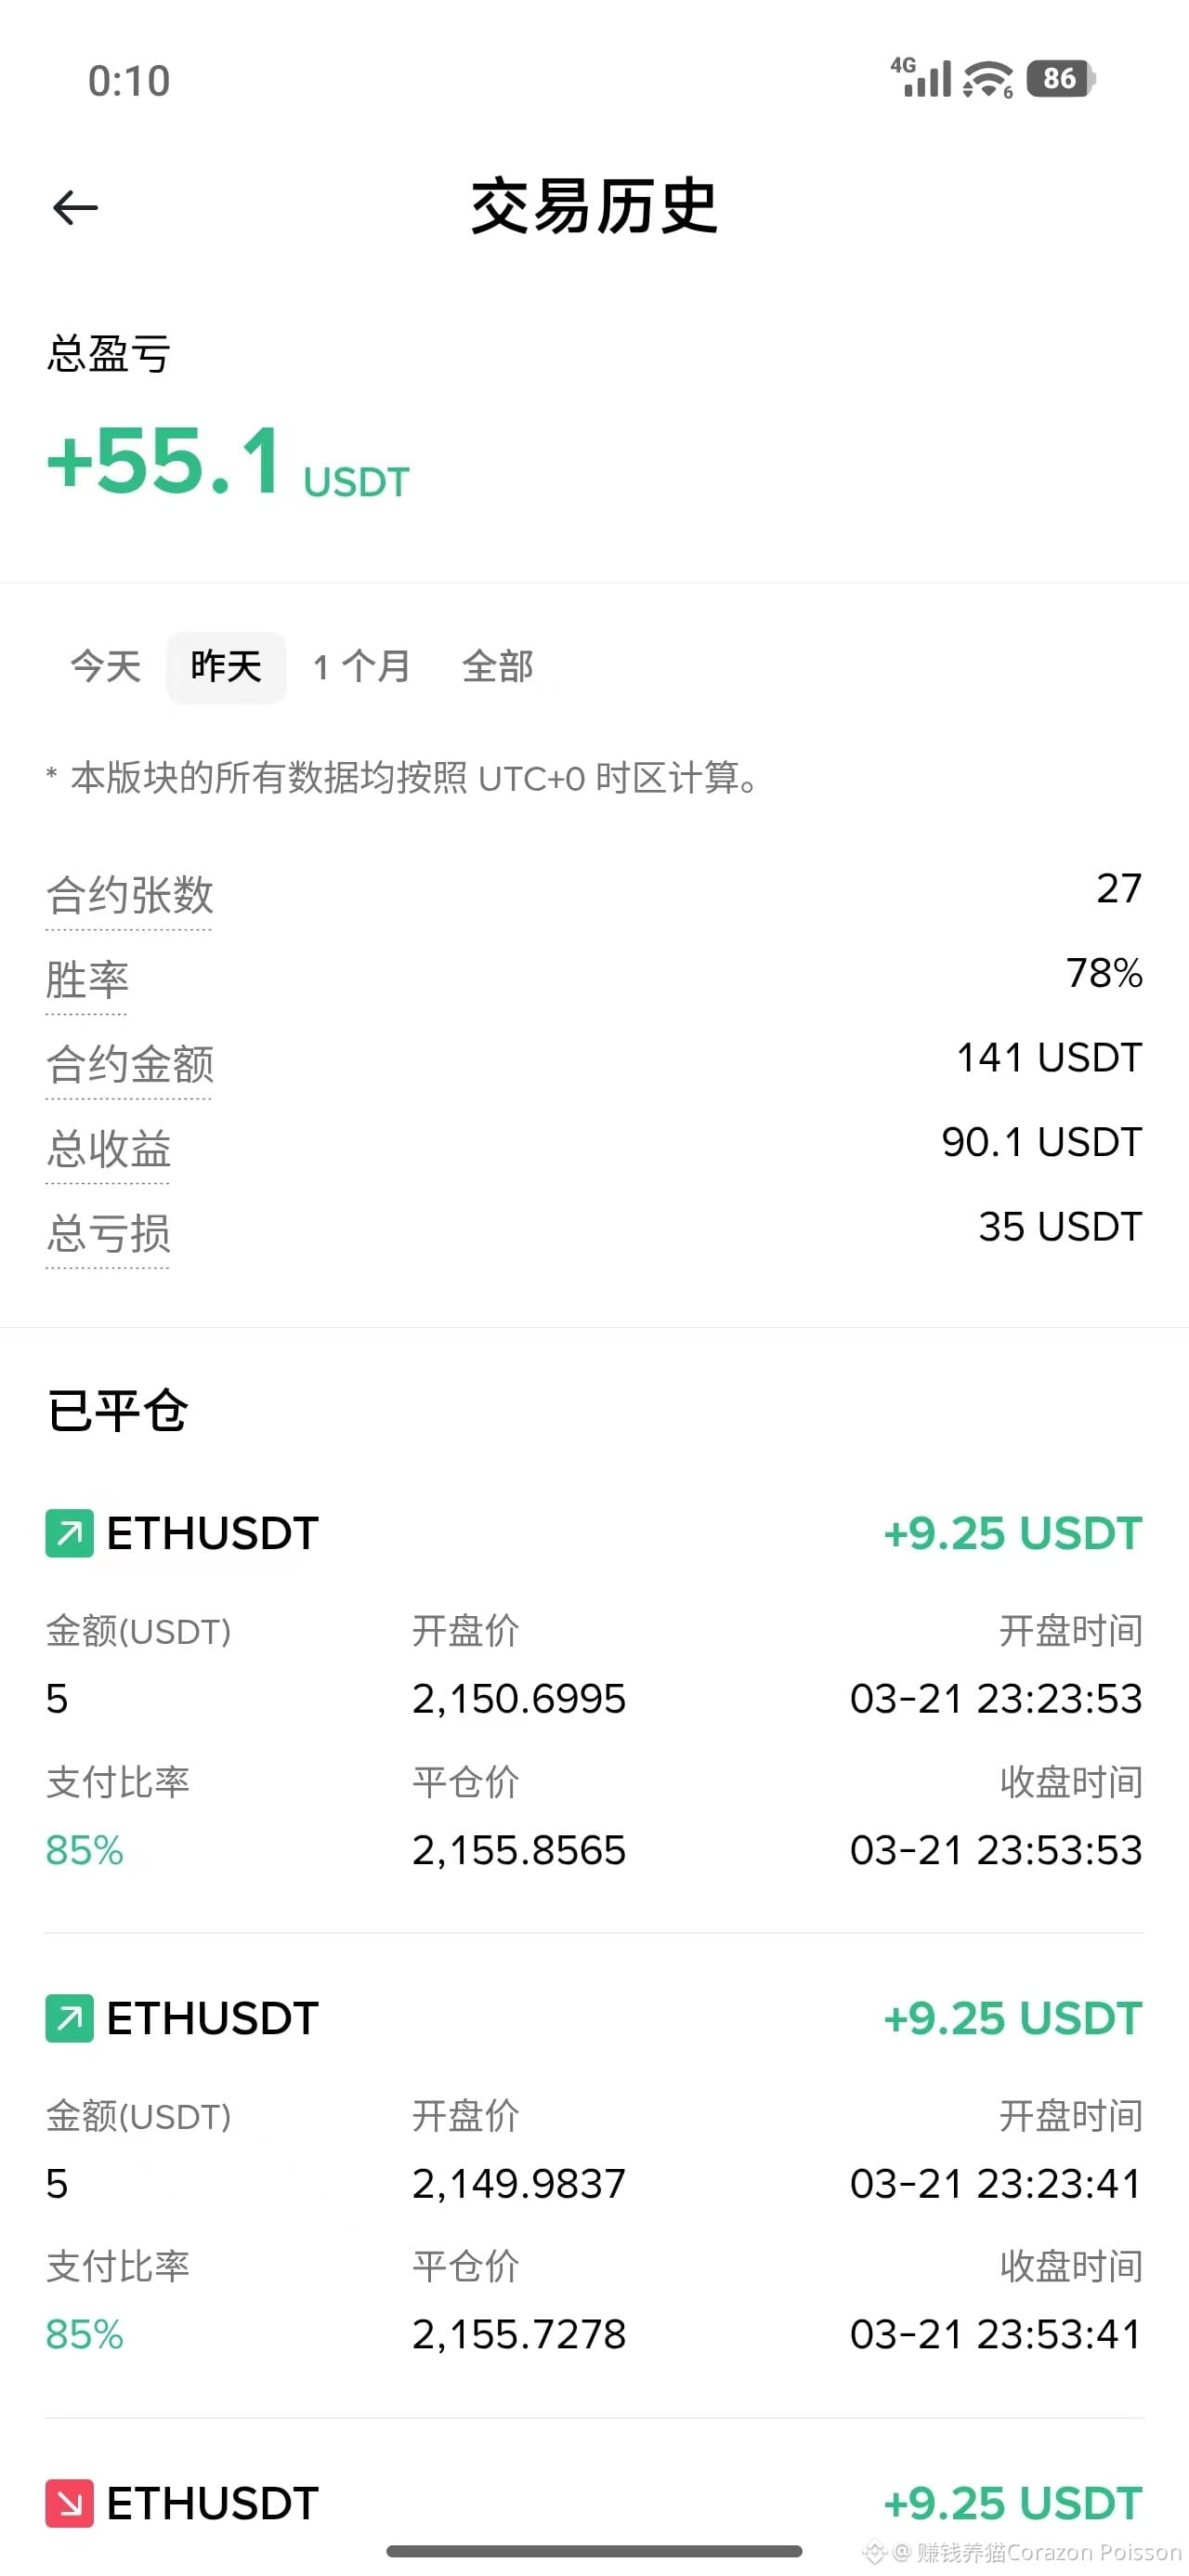
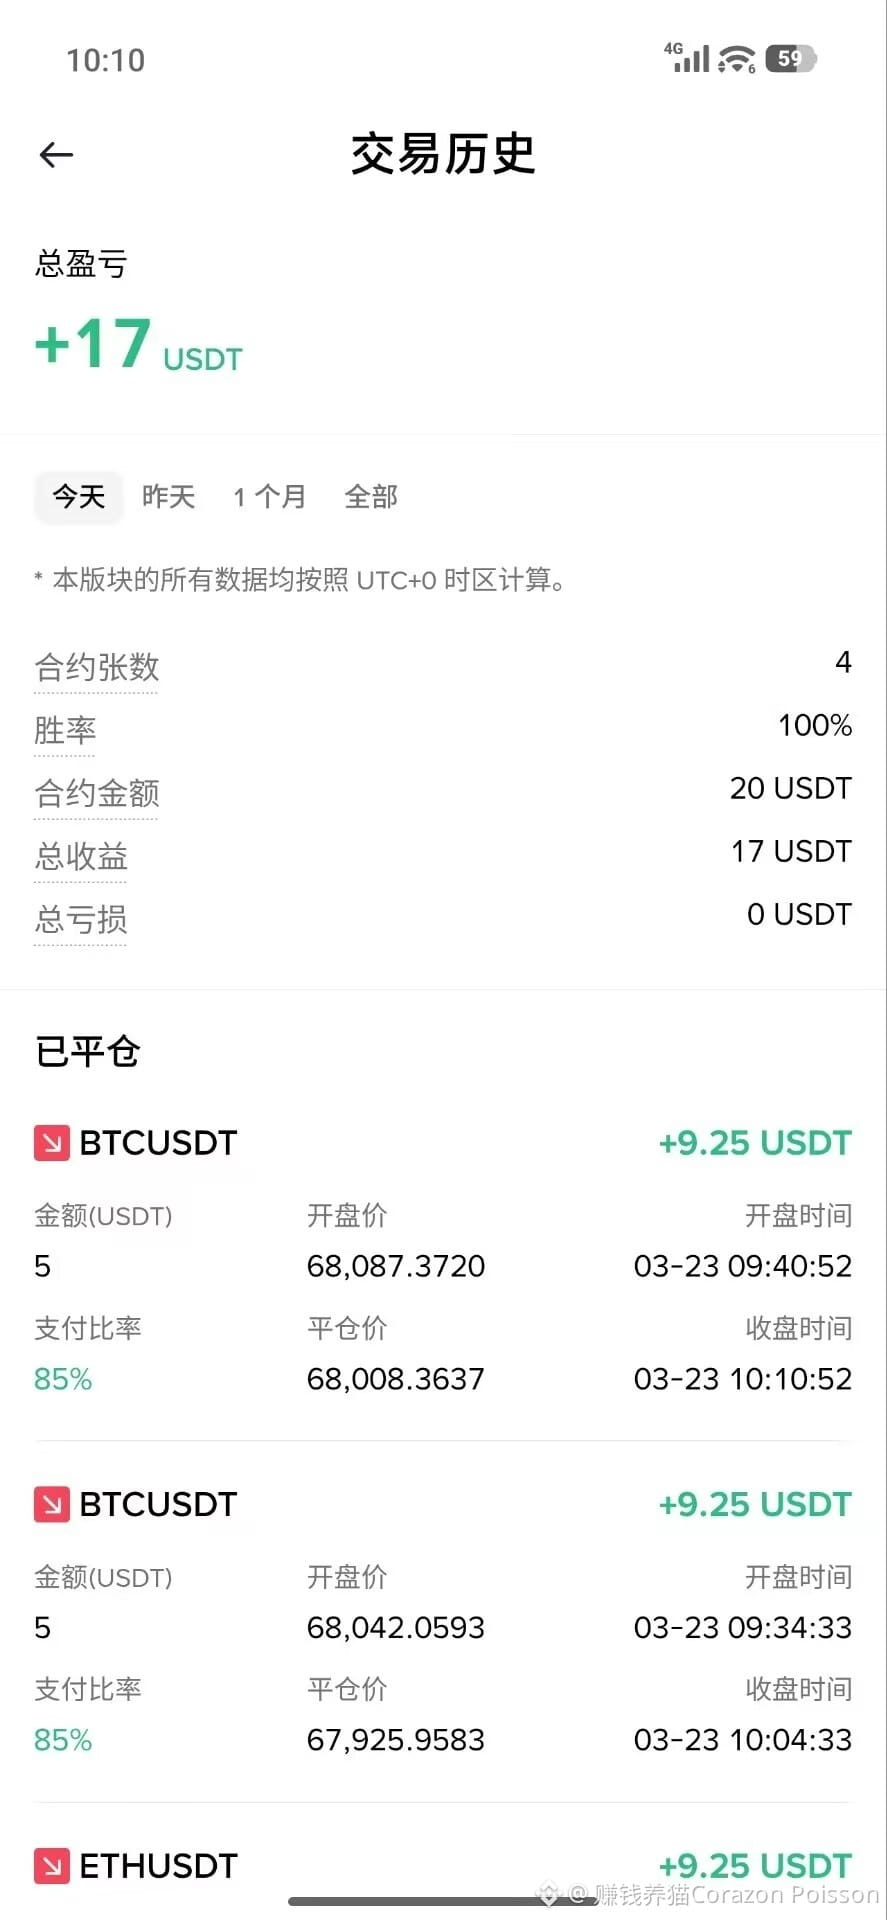
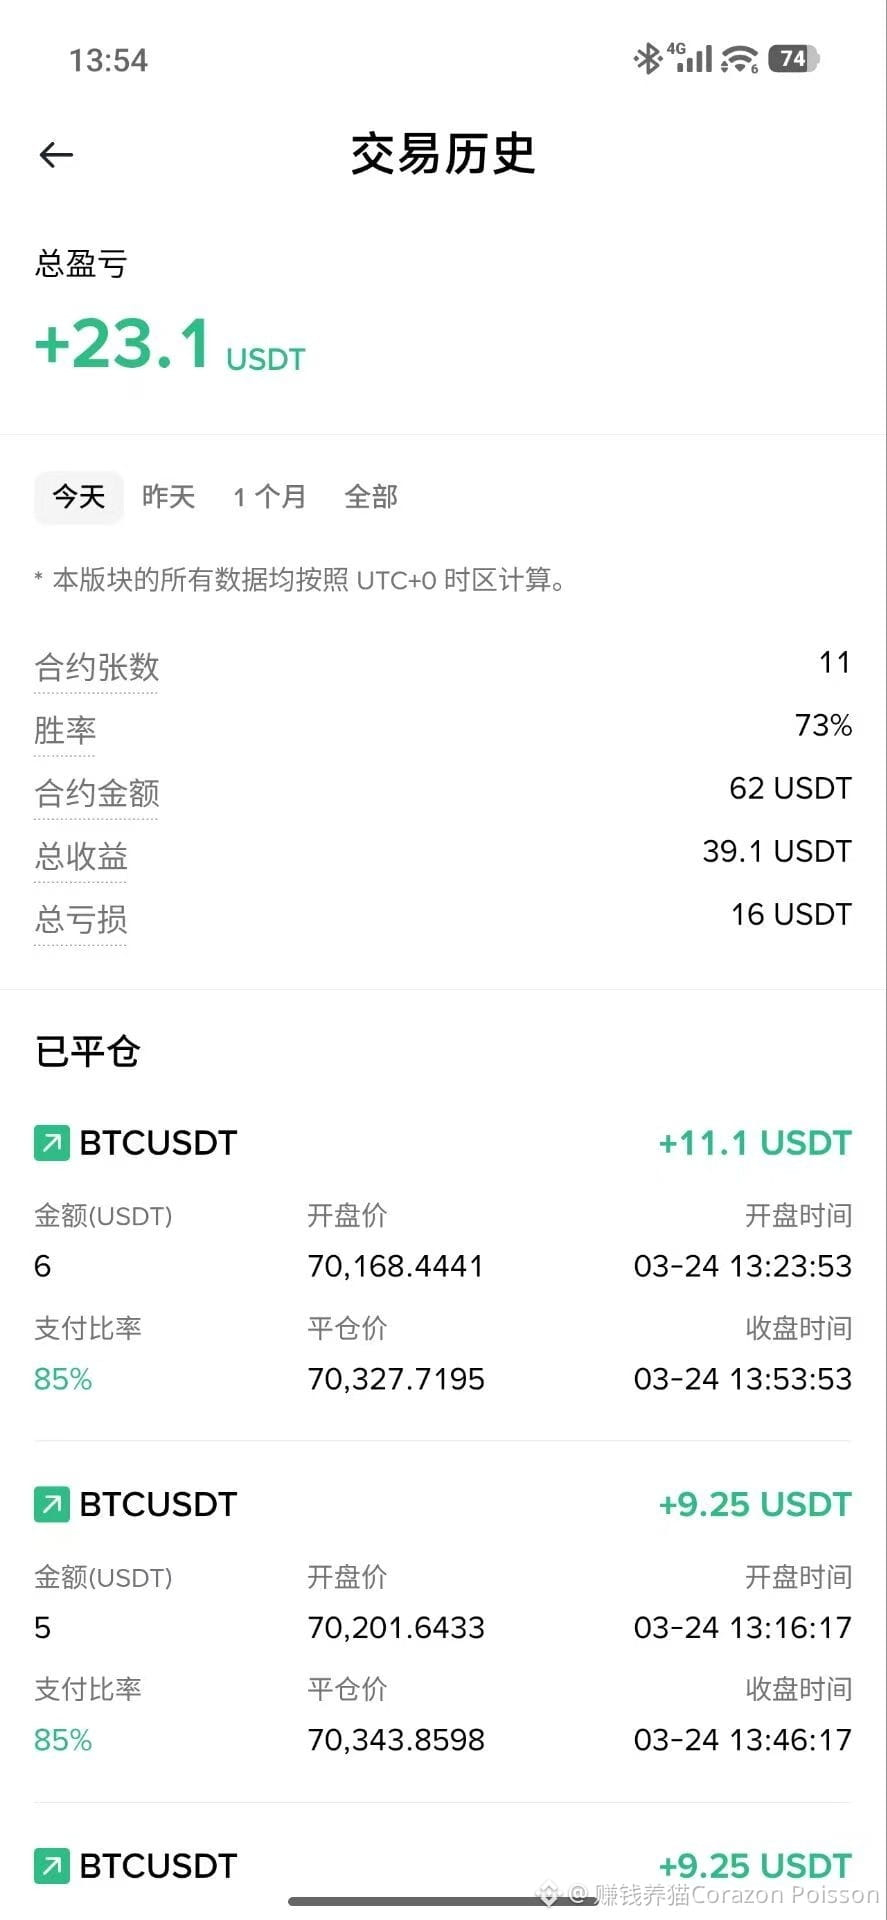
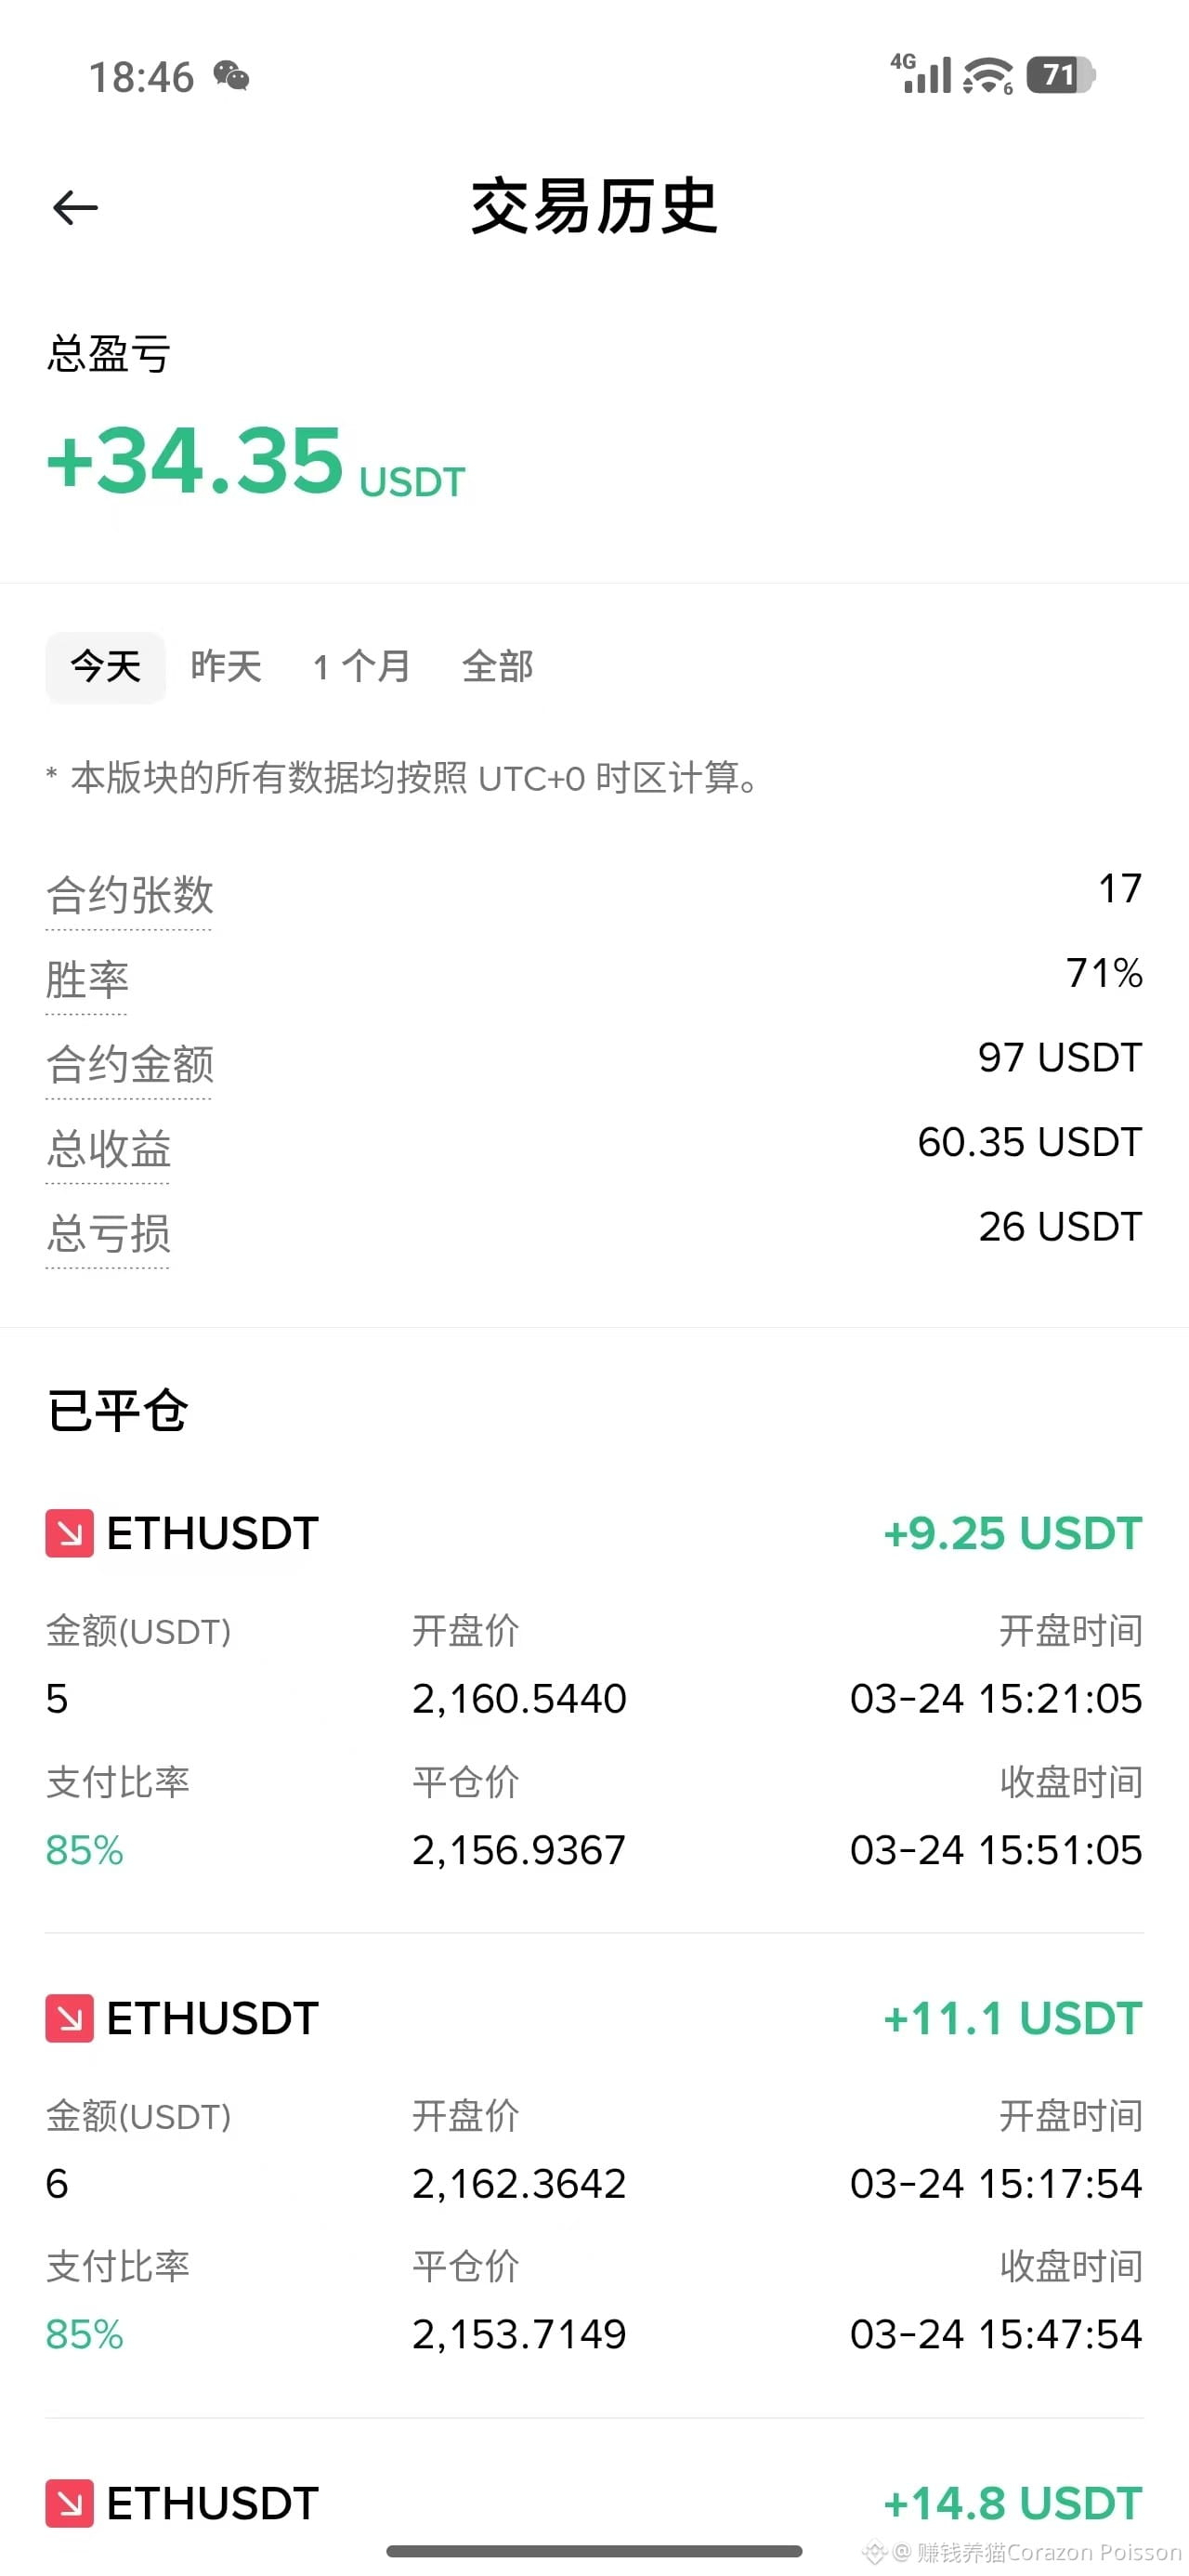
142
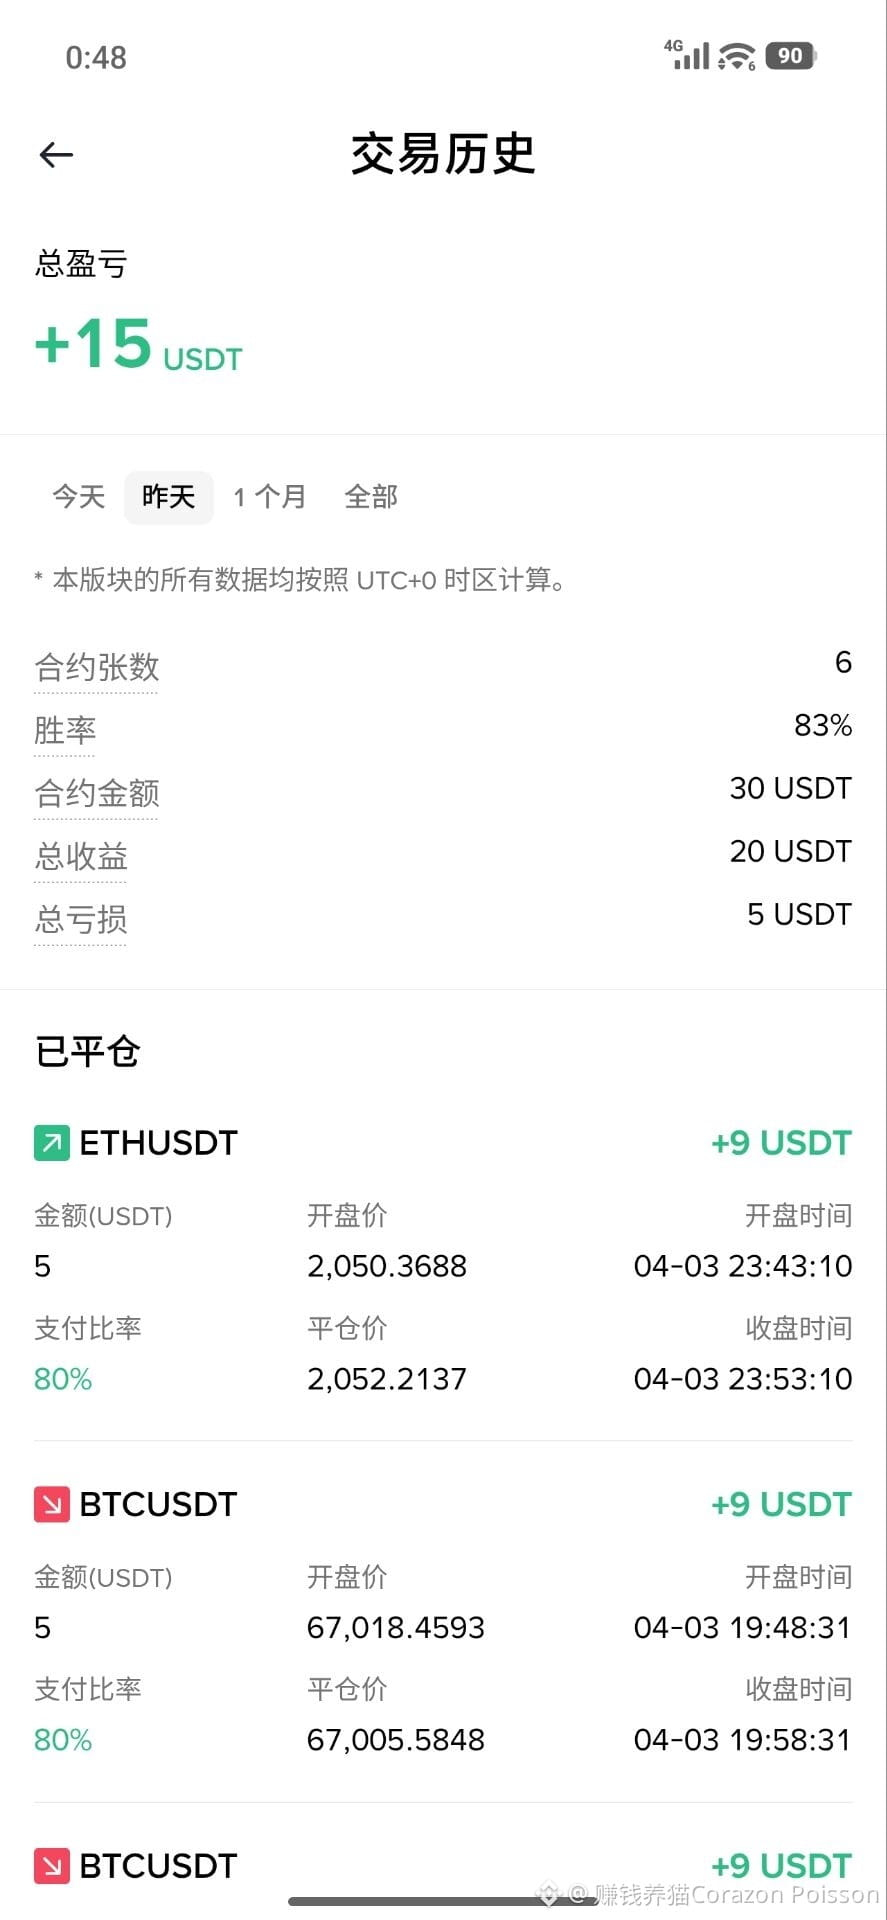
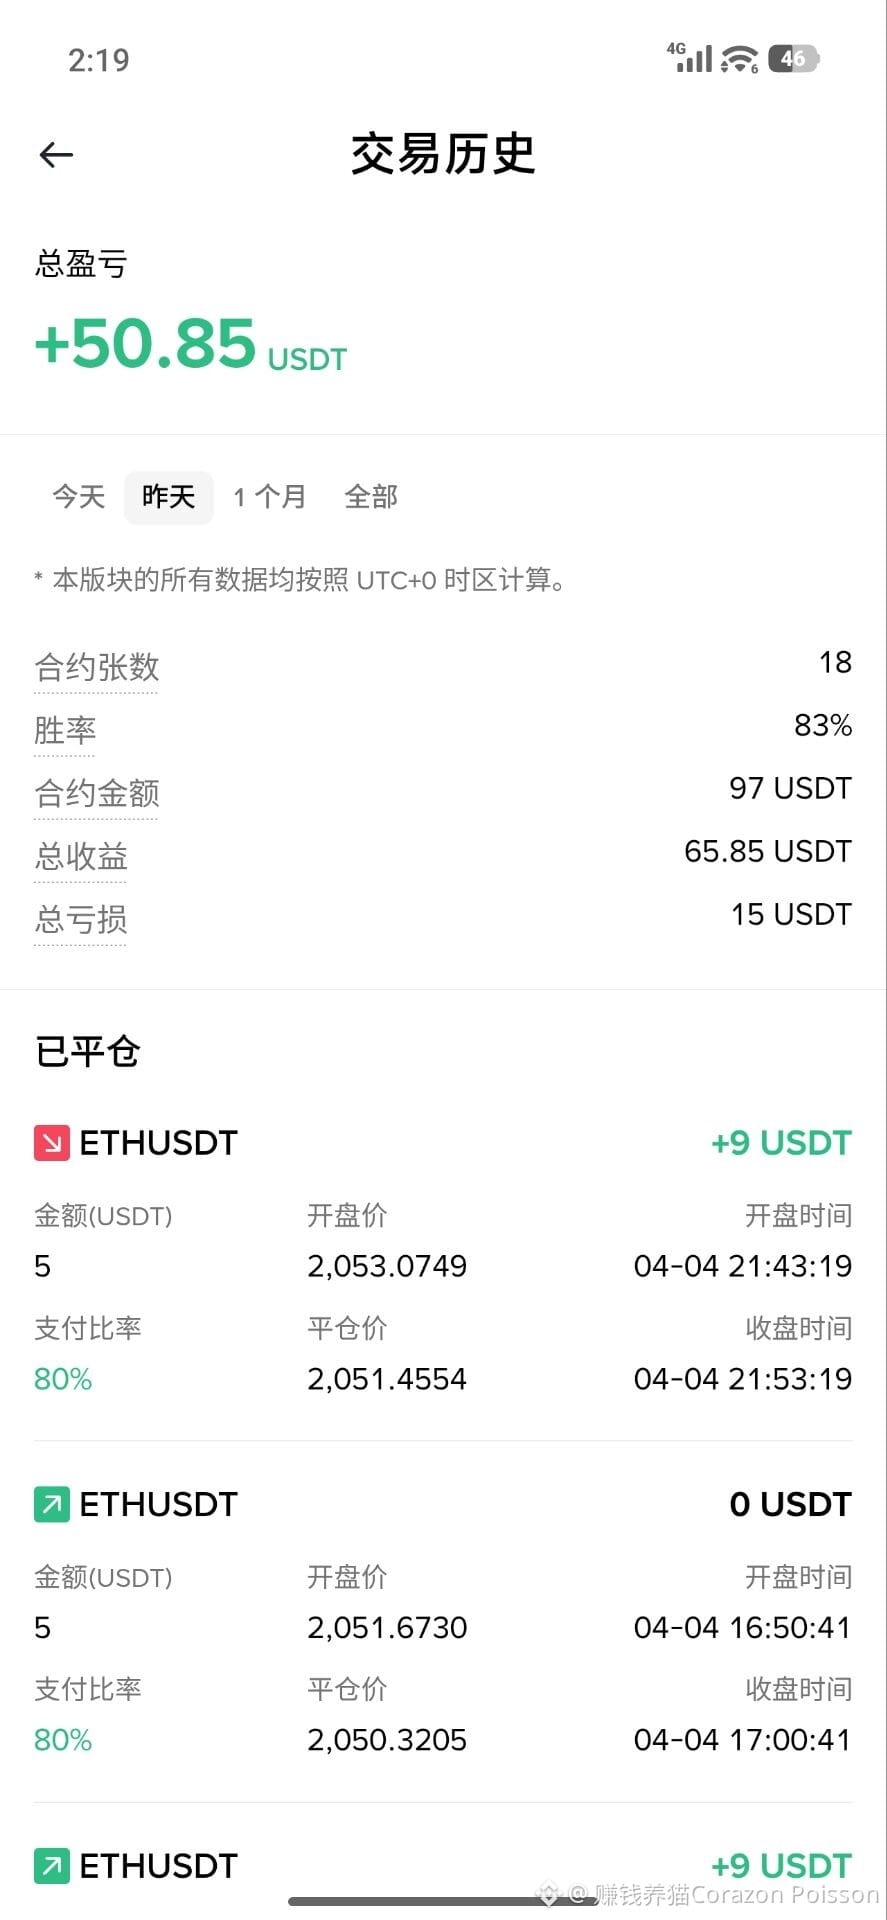
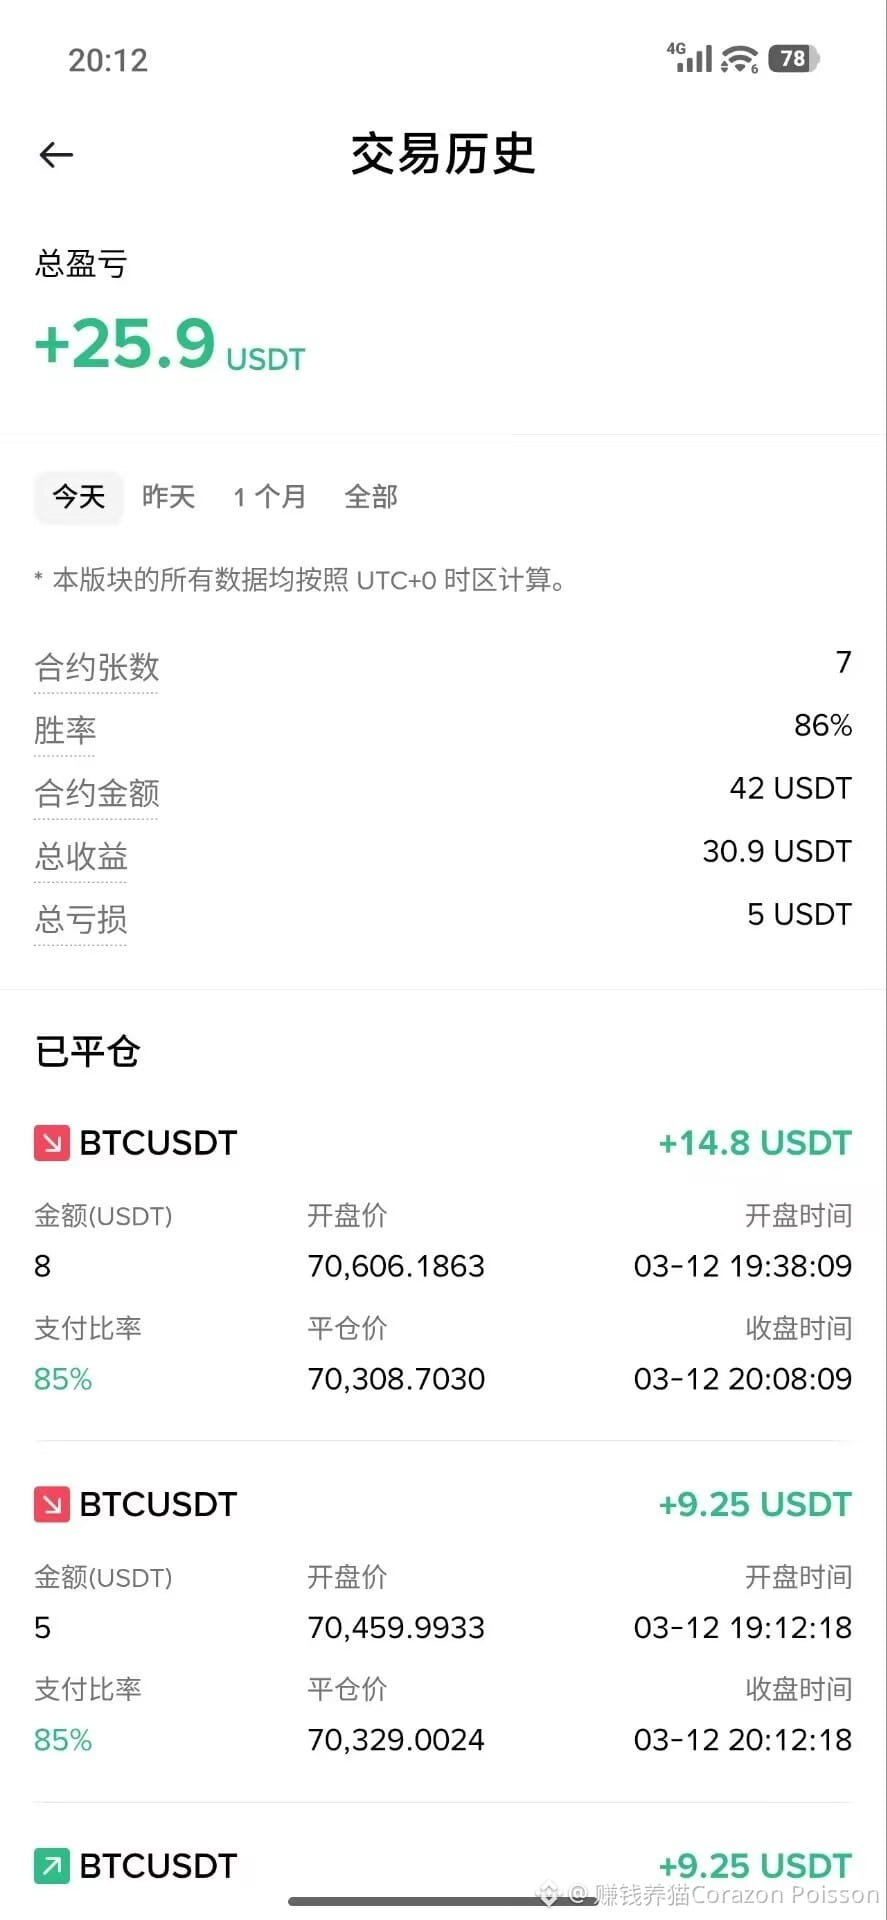
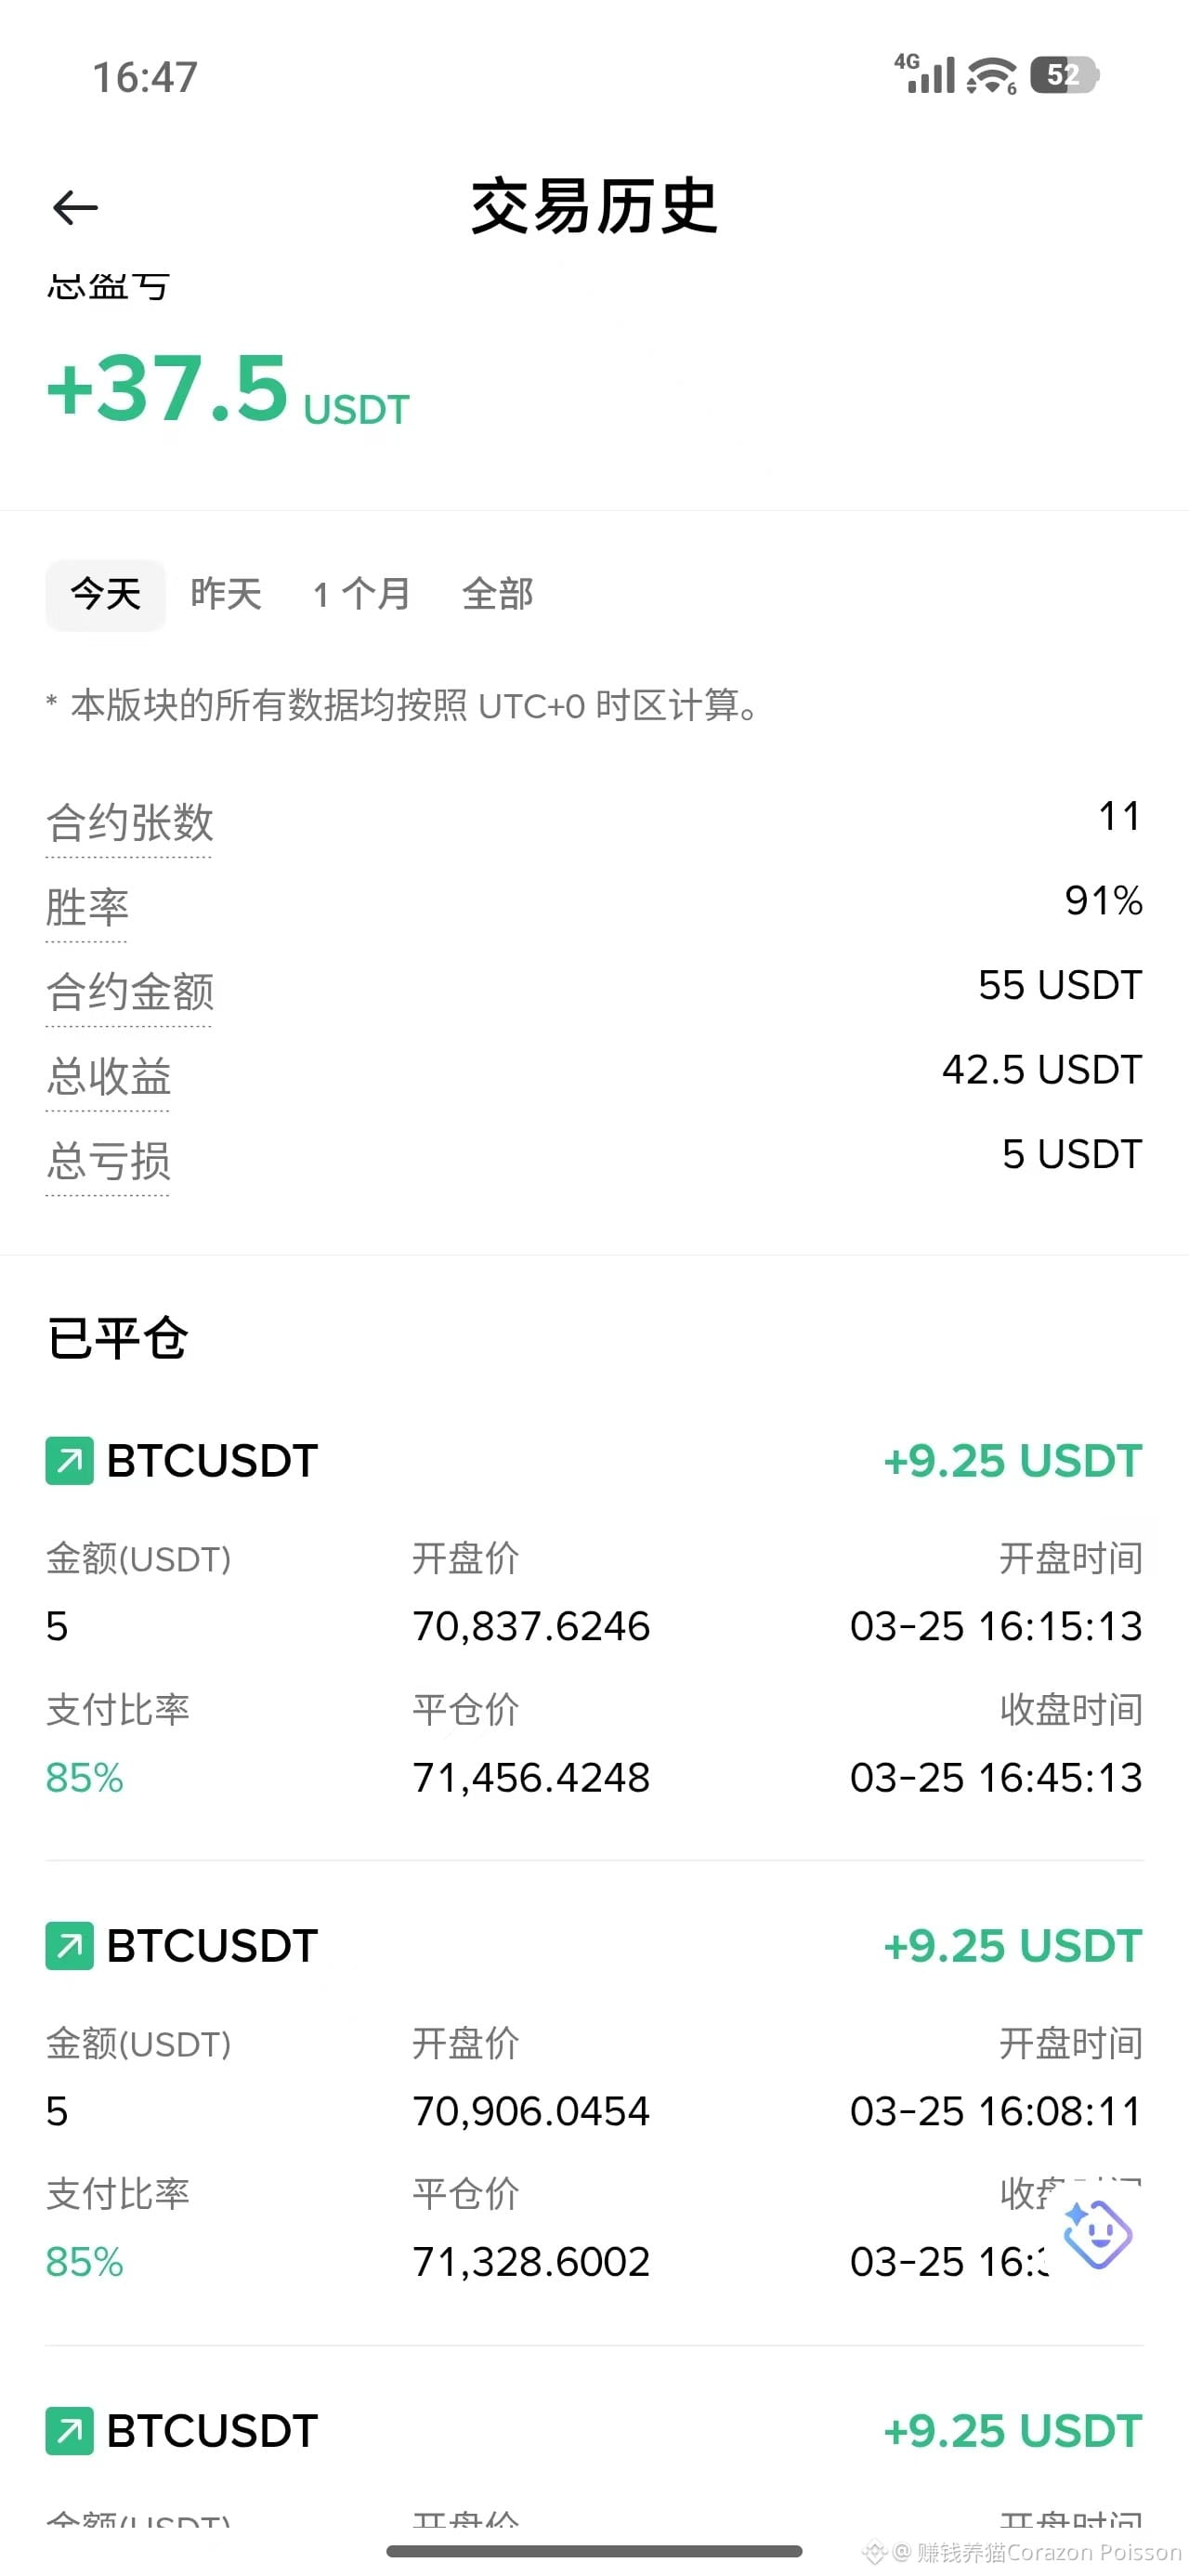
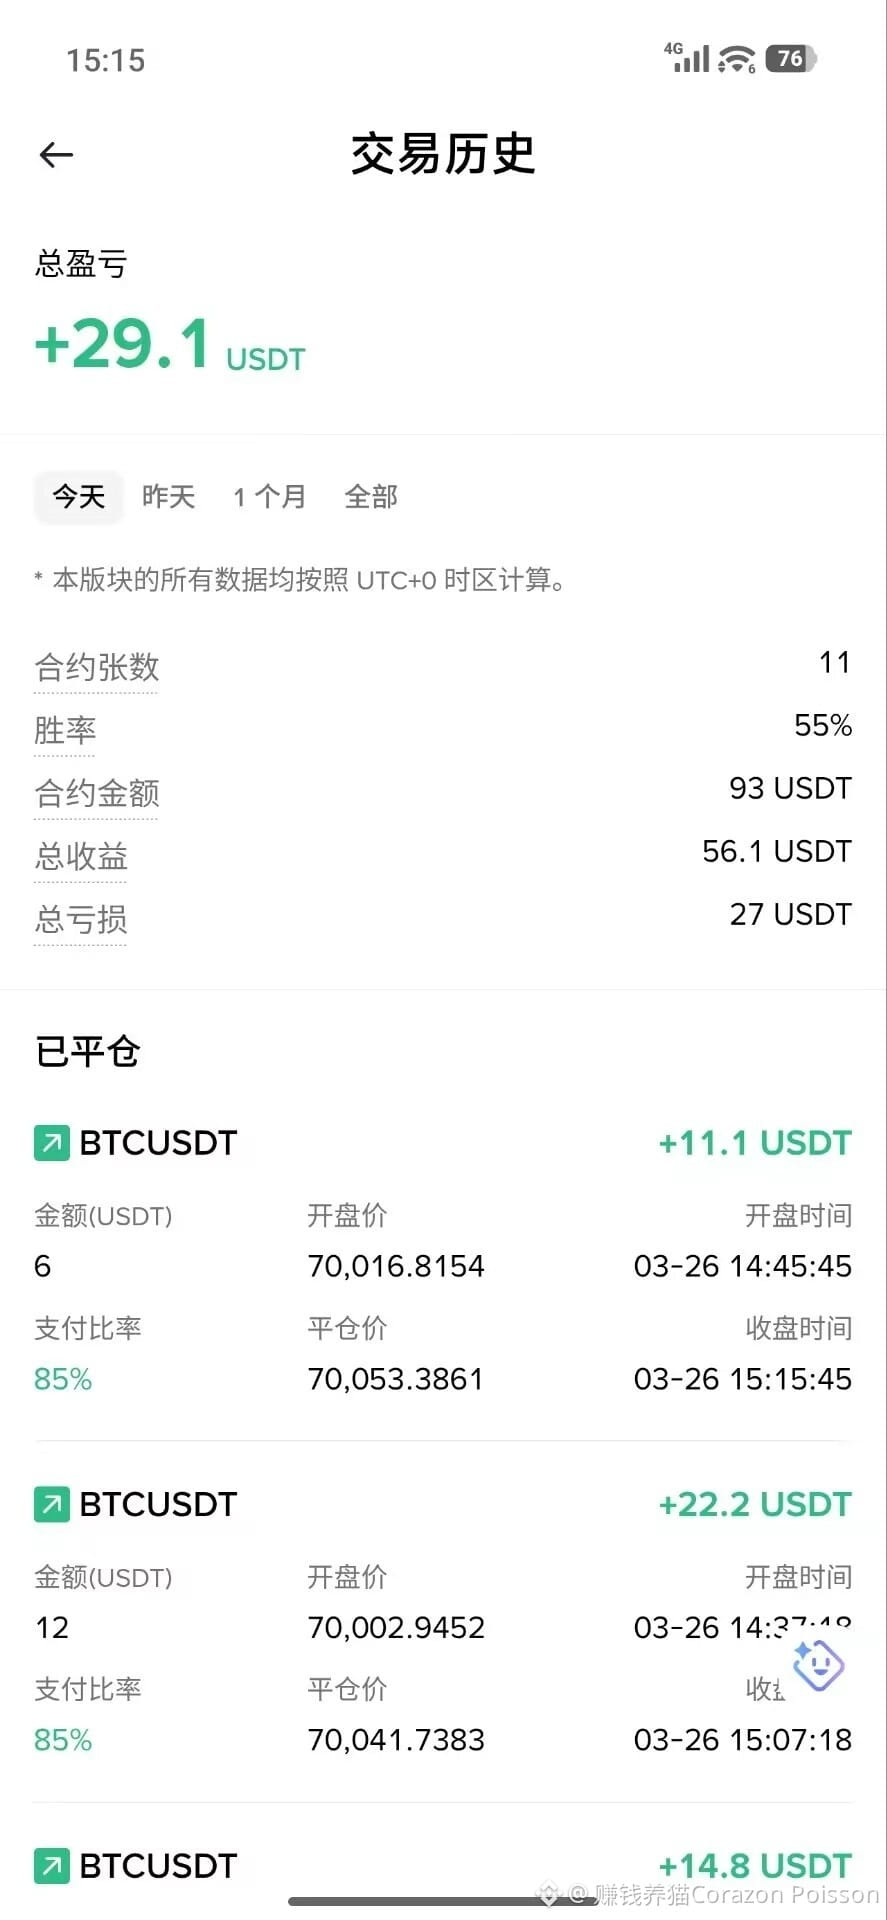
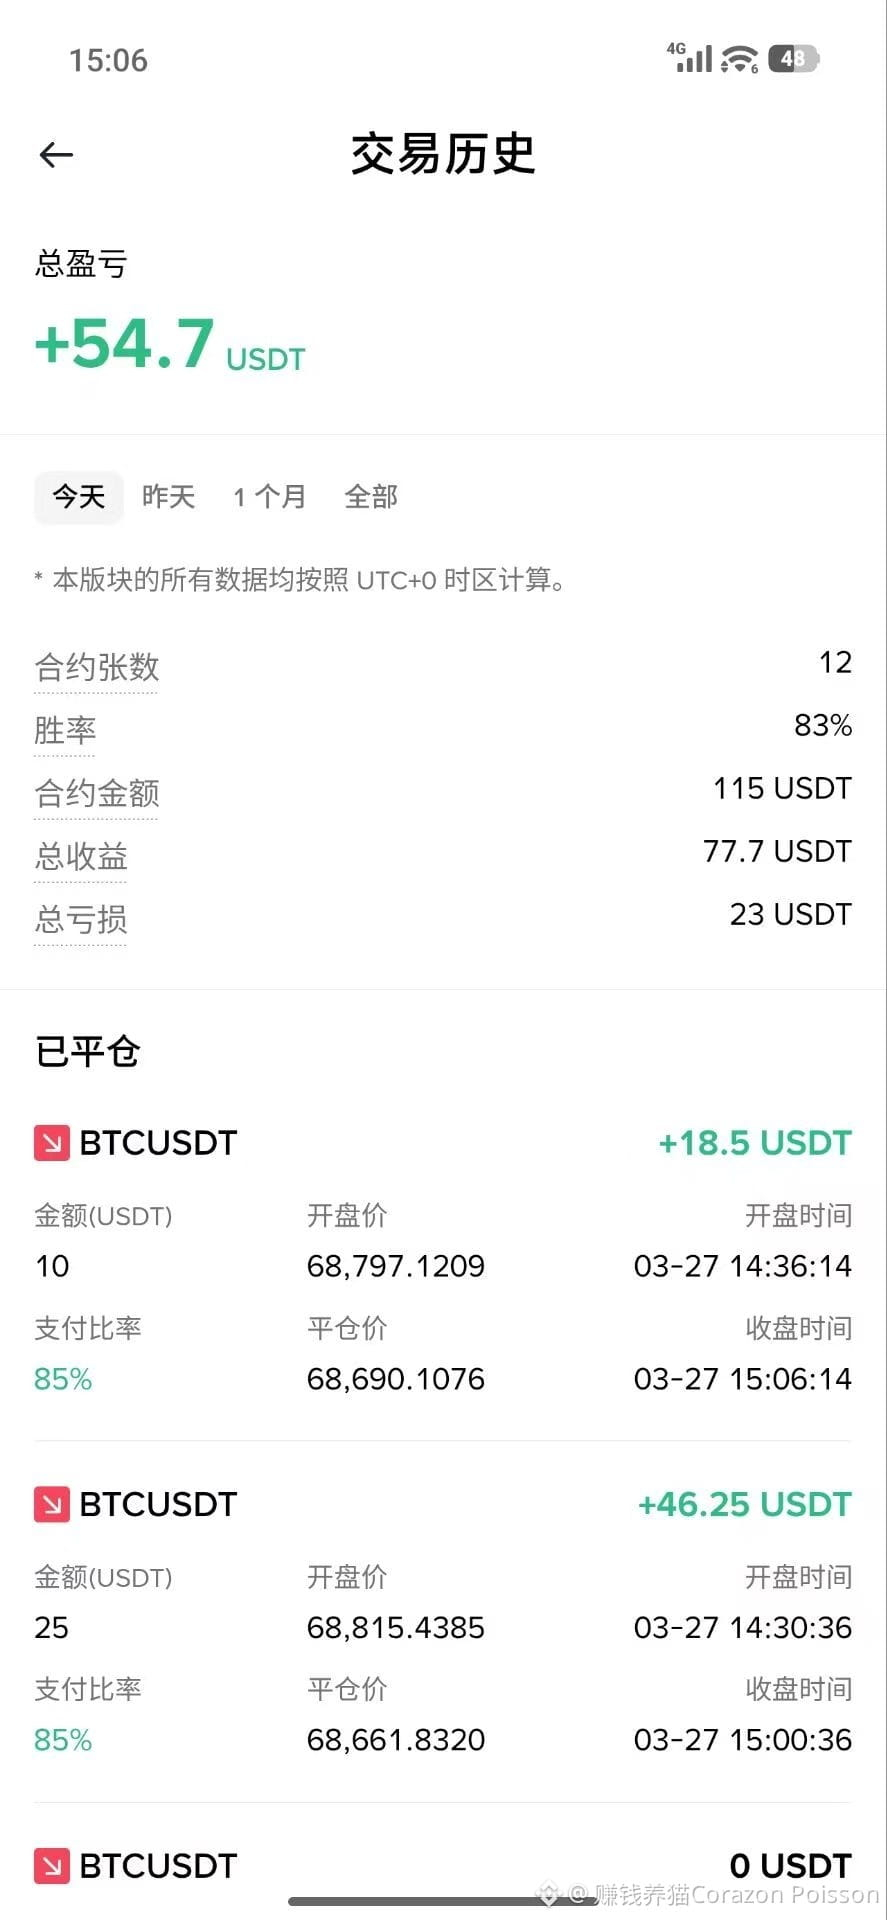
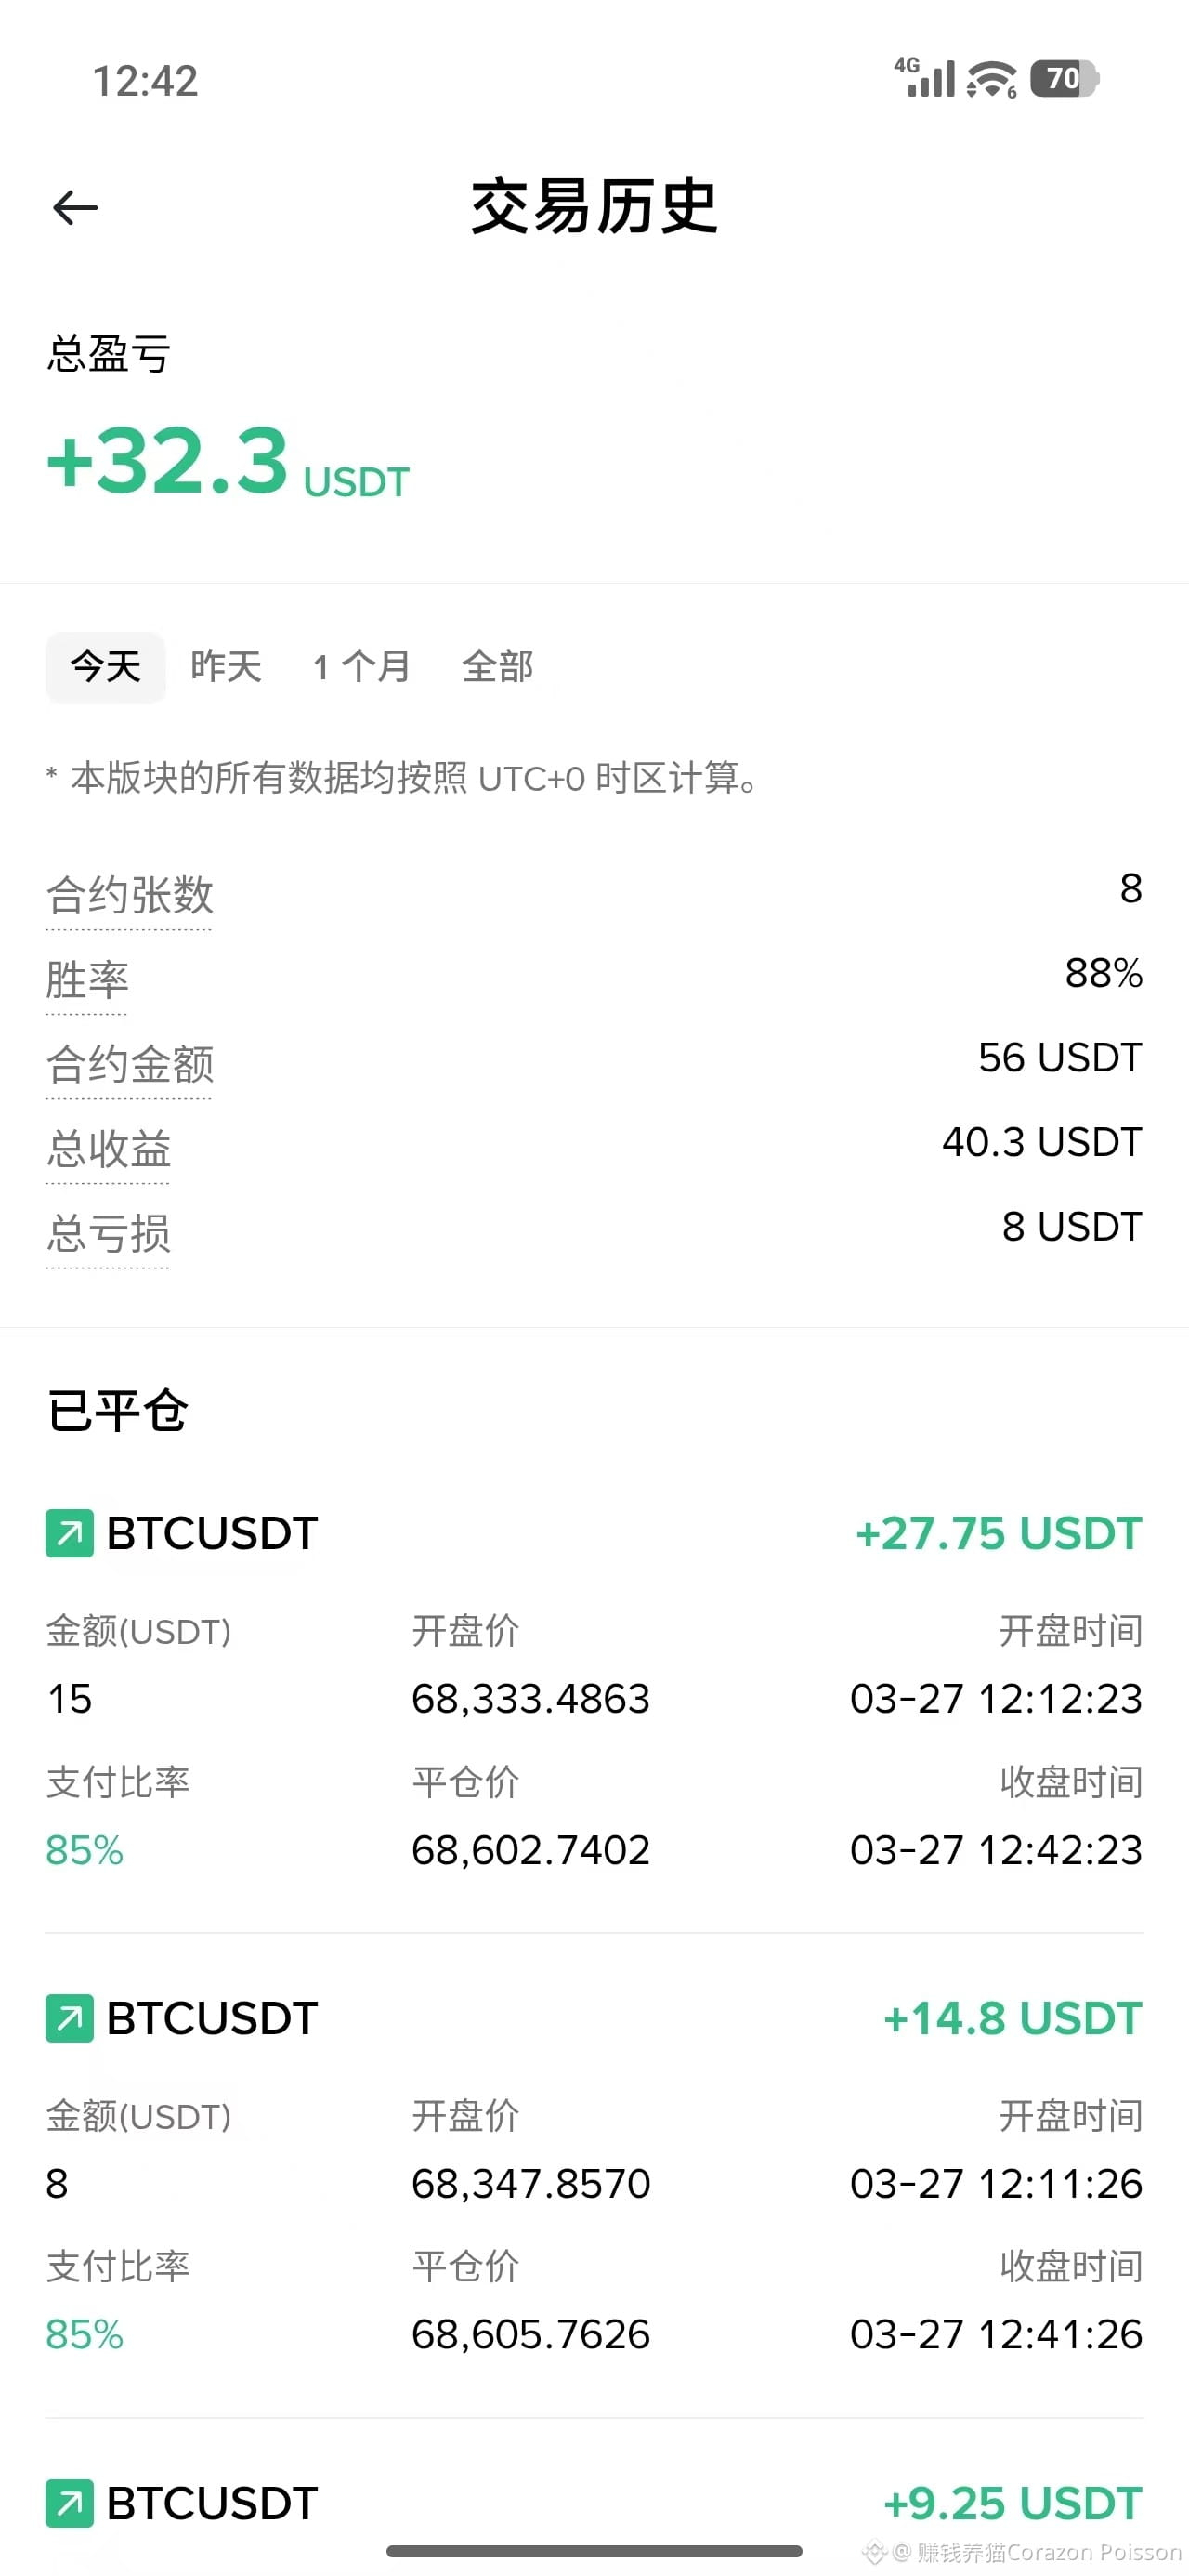
Event live performance record
You can only place 4 cards at a time, and there are 2 more posts (1/3)
Event live performance record
You can only place 4 cards at a time, and there are 2 more posts (1/3)
You can only place 4 cards at a time, and there are 2 more posts (1/3)
79
Log in to explore more content
Join global crypto users on Binance Square
⚡️ Get latest and useful information about crypto.
💬 Trusted by the world’s largest crypto exchange.
👍 Discover real insights from verified creators.
Email / Phone number
Trending Topics
BinanceReopensWithdrawalsForHYPE&APT
27,203 views
505 Discussing
Binance Re-Enables Withdrawals for HYPE and APT, Extends List of Restored Assets
Binance News
·18 Likes
·11.2k views
SouthKoreaDraftLawTargets15To20%ShareholderCap
32,724 views
353 Discussing
TradFiForBeginners
138,819 views
1,476 Discussing