

saqibzafar
1.7k Posts

saqibzafar
Report
Block User
Earn with Learn

SOL Holder
High-Frequency Trader
5.7 Years
4 Following
1.3K+ Followers
3.0K+ Liked
Posts
All
Quotes
·
--
Bullish
$SOL
How did macro risks impact SOL's recent performance?
Solana faced sharp headwinds as broader economic anxiety rippled across high-beta crypto assets.
Liquidity Drain & Risk-Off Sentiment
Geopolitical tensions and monetary policy uncertainty triggered widespread institutional de-risking. Because Solana offers high volatility, capital rapidly retreated toward safe havens, spurring heavy spot outflows and cascading derivative liquidations.
Technical Compression
This sudden macro pull shattered local support levels. While oversold conditions sparked brief technical bounces, persistent broader caution capped momentum beneath key moving averages, leaving overhead resistance firmly intact despite ongoing ecosystem development.
Solana remains tethered to global liquidity shifts, requiring stabilized macro sentiment before sustainable upside can emerge.
1
2
156
·
--
Bullish
$SOL
How did oversold RSI impact SOL's bounce?
Solana’s deeply depressed momentum indicators sparked an immediate, sharp relief rally as seller exhaustion set in.
Technical Mean Reversion
Extremely oversold RSI conditions signaled an unsustainable downward stretch, prompting bargain hunters and algorithmic buyers to trigger an aggressive technical bounce. This reflexive mean reversion offered temporary breathing room against intense institutional outflows across major exchanges.
Overhead Resistance Clamps Gains
However, the bounce quickly hit a wall. While the RSI reset relieved immediate selling pressure, dominant macro risk-off sentiment and declining dynamic moving averages capped further upside, converting the recovery into a classic bear-market relief move.
Until broader market liquidity returns, oversold bounces in SOL remain tactical pauses rather than full trend reversals.
169
·
--
Bullish
$SOL
1H support and resistance levels for SOL
Technical Support and Resistance
Market Update: Real-time 1-hour chart data for SOL is currently unavailable to compute exact technical levels.Recommended Action: Please try querying again shortly or specify an updated timeframe to retrieve current support and resistance metrics.
Conclusion
Key Takeaway: Awaiting fresh hourly price data to map key breakout and pivot levels accurately.
1
93
·
--
Bullish
$SOL
Traditional finance giant JPMorgan bringing tokenized funds on-chain provided a massive institutional validation boost for Solana, though broader market forces tempered its price reaction.
Institutional Credibility vs. Short-Term Outflows
The deployment reinforced Solana’s standing as a high-speed, enterprise-grade Layer-1 capable of hosting real-world assets. While this fundamentally expanded on-chain utility and anchored long-term sentiment, broader spot net selling and ETF redemptions largely overshadowed the headline, keeping immediate price action subdued.
Ecosystem Expansion
Crucially, native real-world asset integration deepens on-chain liquidity, bridging traditional capital into Solana’s decentralized finance landscape.
Ultimately, while institutional adoption couldn’t prevent short-term market pullbacks, it fundamentally cemented Solana’s status in enterprise-grade finance.
1
84
·
--
Bullish
$SOL
$SOL


WA7CRYPTOAR
·
--
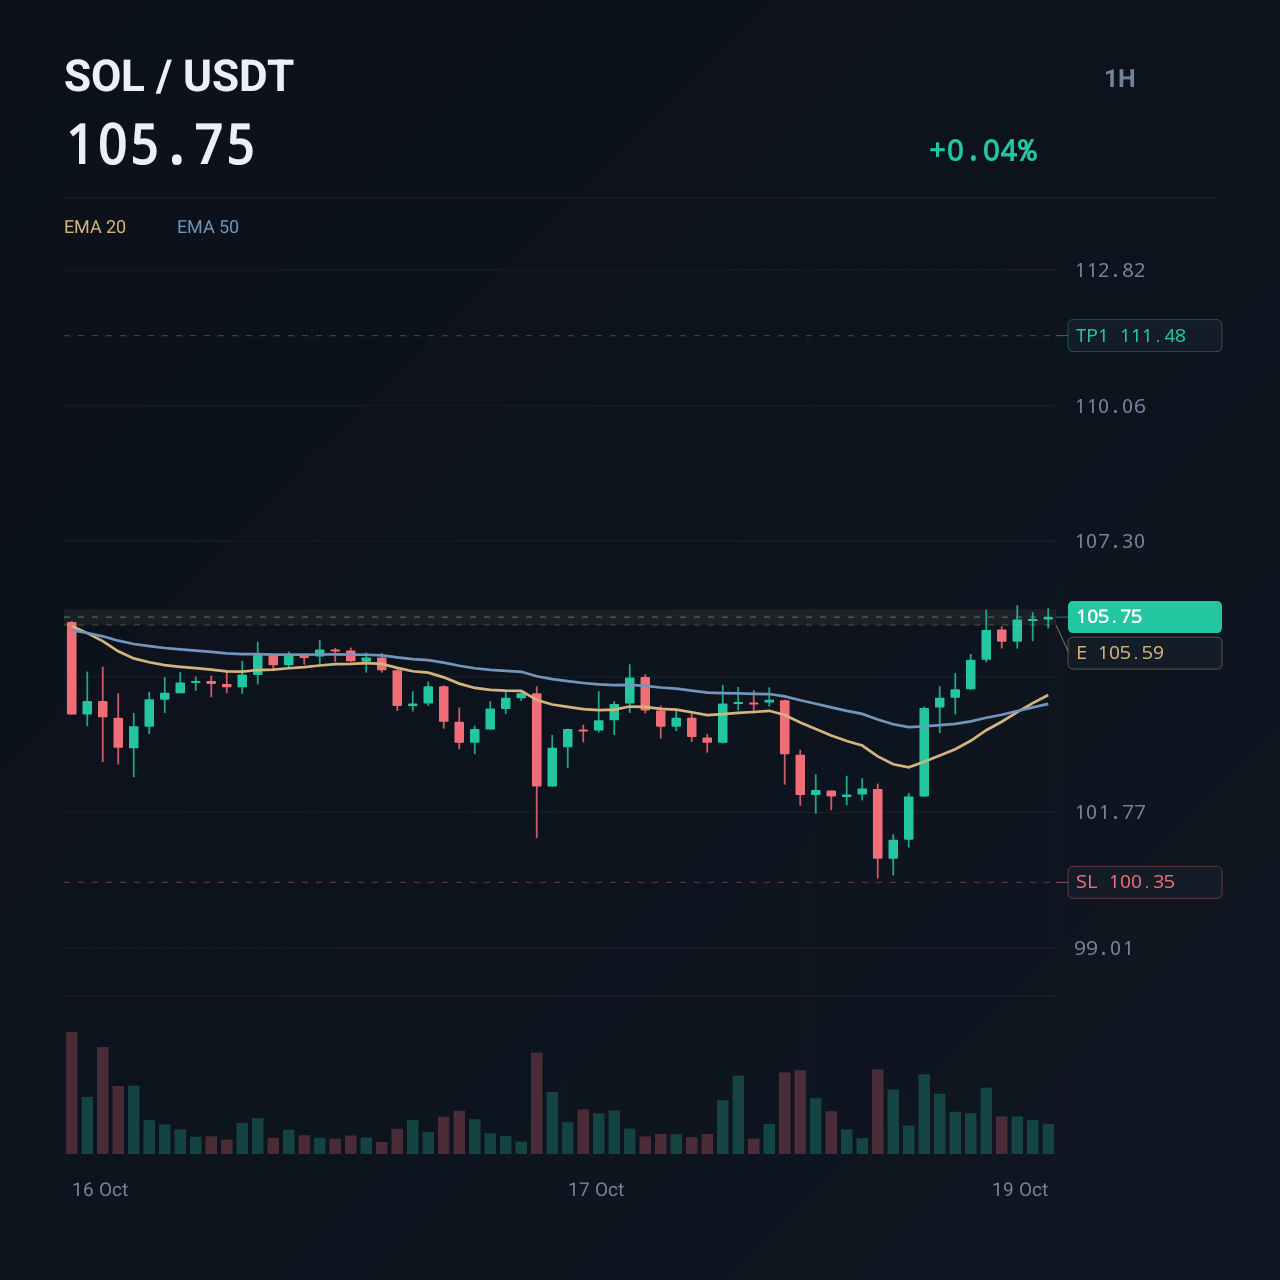
A careful examination of the current market context suggests a potential opportunity, yet the exact path remains uncertain and should be approached with prudence.
Long $SOL
Entry: 105.59 – 105.91
Stop Loss: 100.35
TP1: 111.48
TP2: 117.05
TP3: 122.62
TP4: 128.18
TP5: 133.75
The technical landscape indicates a leaning toward upward movement, yet the presence of a clear resistance threshold introduces doubt about sustained progress. While the momentum signals hint at a favorable trend, the proximity to a critical support level warns of possible reversal. Investors should consider a measured stance, balancing the subtle bullish tilt against the realistic risk of a short‑term pullback.
Trade $SOL here 👇
Not financial advice.
2
34
·
--
Bullish
🚀 $SOL / USDT (Spot Trading Signal)
Entry Zone: $103.50 – $104.80
Buy 1: $104.80 (50%) Buy 2: $103.50 (50%)
Targets (Take Profit):
TP 1: $106.30 TP 2: $107.50 TP 3: $108.80 TP 4: $110.00 TP 5: $111.50
Stop Loss (SL): $101.90
Trading Advice / Caption Tip:
After TP 1 is hit, move your Stop Loss to the entry price (Break-even) to make the trade risk-free.
Always trade with proper risk management.
#Follow_Like_Comment #FollowMeAndGetReward
{future}(SOLUSDT)
🚀 $SOL / USDT (Spot Trading Signal)
Entry Zone: $103.50 – $104.80
Buy 1: $104.80 (50%) Buy 2: $103.50 (50%)
Targets (Take Profit):
TP 1: $106.30 TP 2: $107.50 TP 3: $108.80 TP 4: $110.00 TP 5: $111.50
Stop Loss (SL): $101.90
Trading Advice / Caption Tip:
After TP 1 is hit, move your Stop Loss to the entry price (Break-even) to make the trade risk-free.
Always trade with proper risk management.
#Follow_Like_Comment #FollowMeAndGetReward
4
169
·
--
Bullish
$SOL
Current SOL Price~$75.70
Signal Type
Entry Zone$75.00 – $75.70
Take Profit 1 (TP1)$79.50
Take Profit 2 (TP2)$83.25
Stop Loss (SL)$73.05 (-3.5%)
$SOL
Current SOL Price~$75.70
Signal Type
Entry Zone$75.00 – $75.70
Take Profit 1 (TP1)$79.50
Take Profit 2 (TP2)$83.25
Stop Loss (SL)$73.05 (-3.5%)
Current SOL Price~$75.70
Signal Type
Entry Zone$75.00 – $75.70
Take Profit 1 (TP1)$79.50
Take Profit 2 (TP2)$83.25
Stop Loss (SL)$73.05 (-3.5%)
5
194
·
--
Bullish
$SOL Entry Zone: $75.85 – $76.20
TP 1: $77.20
TP 2: $77.85
TP 3: $78.50
SL: $74.85
$SOL Entry Zone: $75.85 – $76.20
TP 1: $77.20
TP 2: $77.85
TP 3: $78.50
SL: $74.85
TP 1: $77.20
TP 2: $77.85
TP 3: $78.50
SL: $74.85
5
197
·
--
$SOL what you think #solana touch?
$SOL what you think #solana touch?
$80
67%
$70
33%
3 votes • Voting closed
4
49
·
--
Bullish
2nd target done ✅🤌💝$SOL #FollowMeAndGetReward
2nd target done ✅🤌💝$SOL #FollowMeAndGetReward
saqibzafar
·
--
BullishBULLS EYE $78.50 NEXT! 💥
Entry: 76 – 76.60 ⚡
Target 1: 77.00 🚀
Target 2: 77.50 🚀
Target 3: 78.40 🚀
Stop Loss: 75.50 ⚠️
$SOL #solana #FollowMeAndGetReward
Entry: 76 – 76.60 ⚡
Target 1: 77.00 🚀
Target 2: 77.50 🚀
Target 3: 78.40 🚀
Stop Loss: 75.50 ⚠️
$SOL #solana #FollowMeAndGetReward
2
58
·
--
1st order ✅🤌💝
1st order ✅🤌💝
saqibzafar
·
--
BullishBULLS EYE $78.50 NEXT! 💥
Entry: 76 – 76.60 ⚡
Target 1: 77.00 🚀
Target 2: 77.50 🚀
Target 3: 78.40 🚀
Stop Loss: 75.50 ⚠️
$SOL #solana #FollowMeAndGetReward
Entry: 76 – 76.60 ⚡
Target 1: 77.00 🚀
Target 2: 77.50 🚀
Target 3: 78.40 🚀
Stop Loss: 75.50 ⚠️
$SOL #solana #FollowMeAndGetReward
2
29
·
--
Bullish
BULLS EYE $78.50 NEXT! 💥
Entry: 76 – 76.60 ⚡
Target 1: 77.00 🚀
Target 2: 77.50 🚀
Target 3: 78.40 🚀
Stop Loss: 75.50 ⚠️
$SOL #solana #FollowMeAndGetReward
BULLS EYE $78.50 NEXT! 💥
Entry: 76 – 76.60 ⚡
Target 1: 77.00 🚀
Target 2: 77.50 🚀
Target 3: 78.40 🚀
Stop Loss: 75.50 ⚠️
$SOL #solana #FollowMeAndGetReward
Entry: 76 – 76.60 ⚡
Target 1: 77.00 🚀
Target 2: 77.50 🚀
Target 3: 78.40 🚀
Stop Loss: 75.50 ⚠️
$SOL #solana #FollowMeAndGetReward
2
1
158
·
--
1st target ✅ #SolanaStrong $SOL
1st target ✅ #SolanaStrong $SOL
saqibzafar
·
--
Bullish$SOL Long Setup 🟢
Entry: Market Price 73.20 - 74
🎯 TP1: 74.65
🎯 TP2: 75.25
🎯 TP3: 76
🛑 Stop Loss: 72.50
#solana
Entry: Market Price 73.20 - 74
🎯 TP1: 74.65
🎯 TP2: 75.25
🎯 TP3: 76
🛑 Stop Loss: 72.50
#solana
2
54
·
--
Bullish
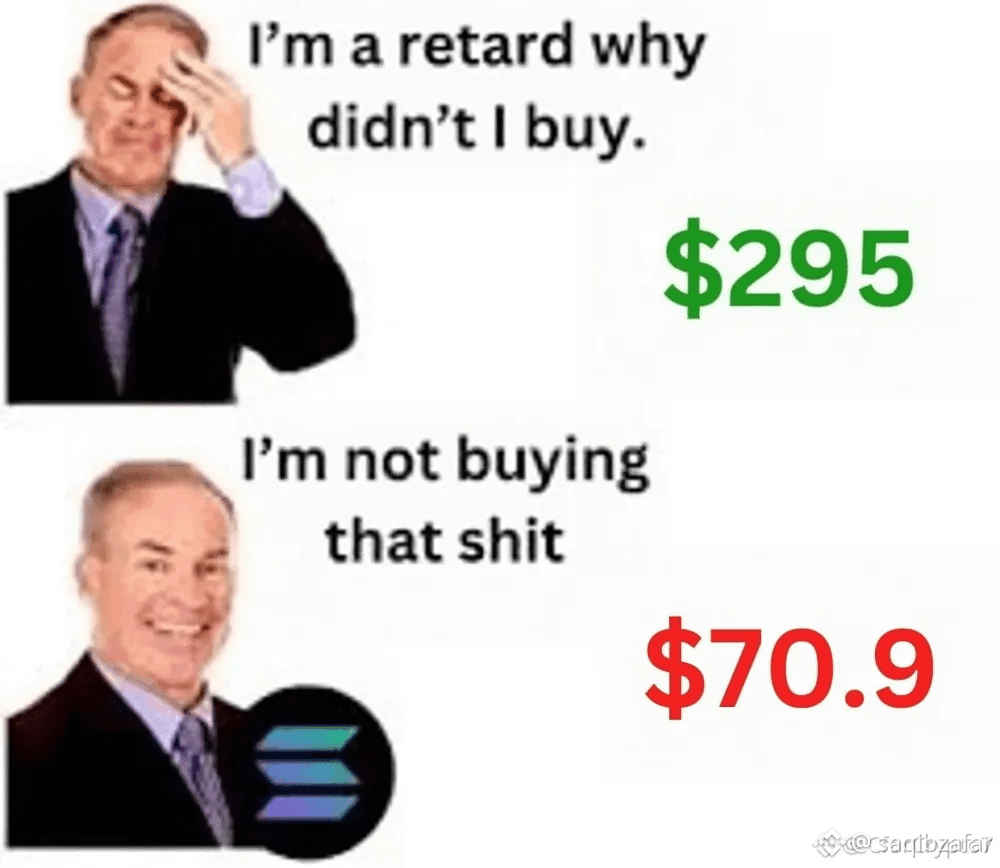
$SOL still a good zone to buy and hold #SolanaStrong
$SOL still a good zone to buy and hold #SolanaStrong
1
112
·
--
Bullish
$SOL Long Setup 🟢
Entry: Market Price 73.20 - 74
🎯 TP1: 74.65
🎯 TP2: 75.25
🎯 TP3: 76
🛑 Stop Loss: 72.50
#solana
$SOL Long Setup 🟢
Entry: Market Price 73.20 - 74
🎯 TP1: 74.65
🎯 TP2: 75.25
🎯 TP3: 76
🛑 Stop Loss: 72.50
#solana
Entry: Market Price 73.20 - 74
🎯 TP1: 74.65
🎯 TP2: 75.25
🎯 TP3: 76
🛑 Stop Loss: 72.50
#solana
1
1
123
·
--
Bullish
$SOL
1H technical analysis of SOL
Market Overview
Recent Price Action: SOL is currently trading around $73.52, having recently rebounded from a low of $71.09.Volume Dynamics: Trading volume fluctuated, with a notable increase during the price decline to $71.09, indicating selling pressure.
Technical Signals
RSI Momentum: The 6-period RSI is at 81.92, indicating overbought conditions on the 1-hour chart, suggesting potential for a short-term pullback.MACD Crossover: The MACD line (0.0519) has crossed above its signal line (-0.1693), with a positive MACD histogram (0.2212), signaling bullish momentum.Bollinger Bands: Price is near the upper Bollinger Band ($73.91), which often acts as resistance, while the middle band ($72.49) provides immediate support.
Key Levels
Entry Target: 72.49 (Bollinger Middle Band support, aligning with potential pullback from overbought RSI).Take Profit: 73.90 (Near Bollinger Upper Band resistance).Stop Loss: 71.90 (Below recent low and key support).
Conclusion
SOL shows bullish momentum on the 1H chart, but overbought RSI suggests caution and potential for a minor correction before further upward movement.
3
102
Log in to explore more content
Join global crypto users on Binance Square
⚡️ Get latest and useful information about crypto.
💬 Trusted by the world’s largest crypto exchange.
👍 Discover real insights from verified creators.
Email / Phone number
Trending Topics
BinancePick
3.4M views
165,811 Discussing
Join #EarningsSeason: Predict Earnings on Binance Pick, Share Your Take on Binance Square!
Binance Square Official
·420 Likes
·345.7k views
EarningsSeason
5.5M views
27,012 Discussing
StrategySkipsBitcoinPurchasesSpends$205MOnSTRCBuybacks
1,130 views
38 Discussing