
CRain1989
1.1k Posts

CRain1989
Twitter : https://x.com/crain531989 - Ko nhóm. Nhận định BTC-PAXG-BNB theo quan điểm cá nhân. Hỗ trợ dạy ptkt về sóng tăng/giảm thị trường
High-Frequency Trader
8.4 Years
6 Following
20.9K+ Followers
11.4K+ Liked
Posts
All
Quotes
PINNED
Hello everyone!
- It’s time for me to confidently say that I’ve already completed my own trading methodology (ptkt), so posting daily analysis (the main purpose was self-practice) is no longer necessary. Now I’m moving into the stage of focusing on making profits.
- I will still post my personal analysis based on longer key milestones and the important ones I pay attention to, like D4-W-W2-M.
- Interleaved with that are posts where I share my own experience for everyone to reference. There’s a lot to say, guys. Unfortunately, Square doesn’t have the feature to create albums for posts that need to be noted (Hopefully @Binance Vietnam can consider adding this feature).
- Of course, I’ll also share my own trading track record, with the single purpose of helping everyone understand one important issue: to make profits in this vast, wide market, the first thing is to focus on self-exploration and learning to improve your own mindset—not rushing headfirst based on someone else’s signals that you don’t truly understand. If you don’t grasp the core issues, then it’s definitely just gambling.
- I’m not setting up any group either, guys. After that phase is over— the reason is the first thing I want to share: in the simplest and most accurate way, this market is essentially one player taking money from another player. It’s not that you’re winning money from the platform. The platform never loses. The platform only loses when too few people participate, not enough profit to sustain operations. And since I’ve already perfected a methodology capable of generating profits, there’s no need to form a group to make separate money—what would that even be for?
- If you want to chat and connect, go to the Chat section on my personal page—no command calls, okay guys.
Keep going, everyone!
- It’s time for me to confidently say that I’ve already completed my own trading methodology (ptkt), so posting daily analysis (the main purpose was self-practice) is no longer necessary. Now I’m moving into the stage of focusing on making profits.
- I will still post my personal analysis based on longer key milestones and the important ones I pay attention to, like D4-W-W2-M.
- Interleaved with that are posts where I share my own experience for everyone to reference. There’s a lot to say, guys. Unfortunately, Square doesn’t have the feature to create albums for posts that need to be noted (Hopefully @Binance Vietnam can consider adding this feature).
- Of course, I’ll also share my own trading track record, with the single purpose of helping everyone understand one important issue: to make profits in this vast, wide market, the first thing is to focus on self-exploration and learning to improve your own mindset—not rushing headfirst based on someone else’s signals that you don’t truly understand. If you don’t grasp the core issues, then it’s definitely just gambling.
- I’m not setting up any group either, guys. After that phase is over— the reason is the first thing I want to share: in the simplest and most accurate way, this market is essentially one player taking money from another player. It’s not that you’re winning money from the platform. The platform never loses. The platform only loses when too few people participate, not enough profit to sustain operations. And since I’ve already perfected a methodology capable of generating profits, there’s no need to form a group to make separate money—what would that even be for?
- If you want to chat and connect, go to the Chat section on my personal page—no command calls, okay guys.
Keep going, everyone!
PINNED
• I just received a wonderful birthday gift from Binance 8YA!
• After nearly 2 years of sharing personal opinions and my own experiences, I have gained nearly 20k followers on square
• Thank you to the team @binance for this meaningful gift ❤️
#BinanceTurns8 #binanceswag
• After nearly 2 years of sharing personal opinions and my own experiences, I have gained nearly 20k followers on square
• Thank you to the team @binance for this meaningful gift ❤️
#BinanceTurns8 #binanceswag

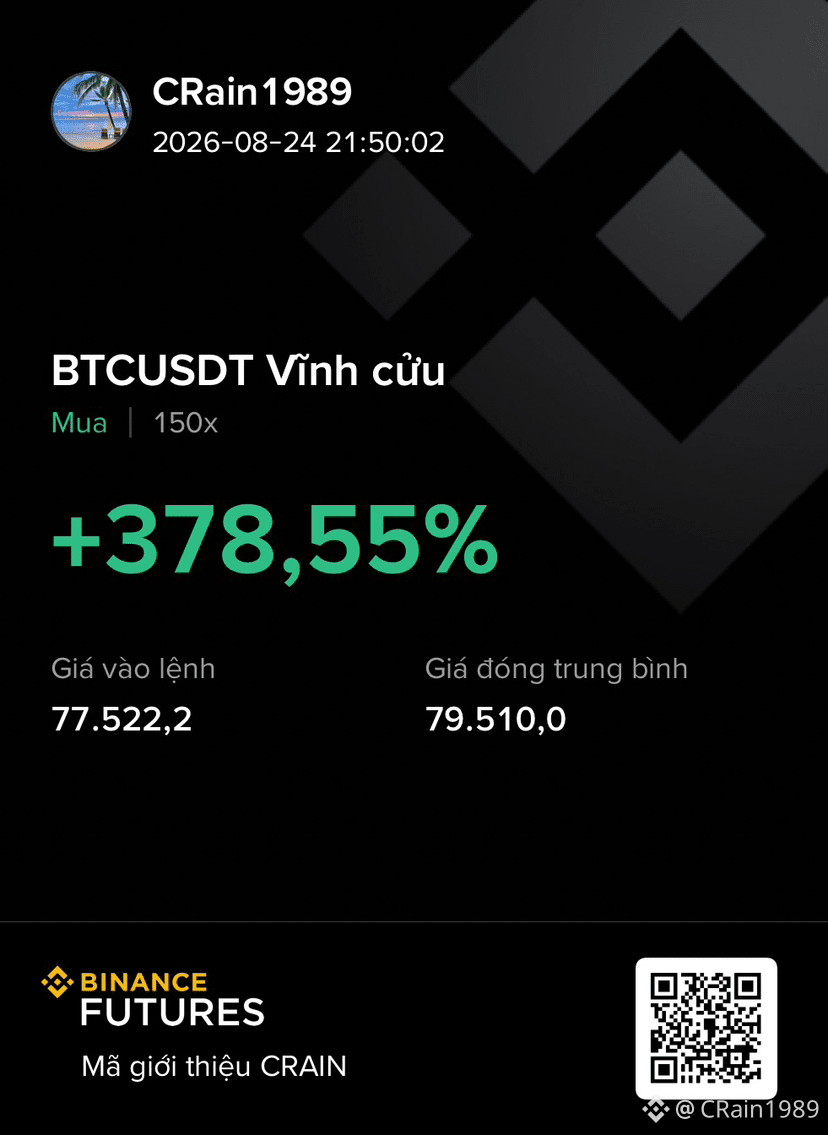
Eat thin 2000 price $BTC đ at the start of the week 24/8.
How’s the chart—eat quickly, crash quickly, nhé everyone. The price is too far from the support zone
How’s the chart—eat quickly, crash quickly, nhé everyone. The price is too far from the support zone
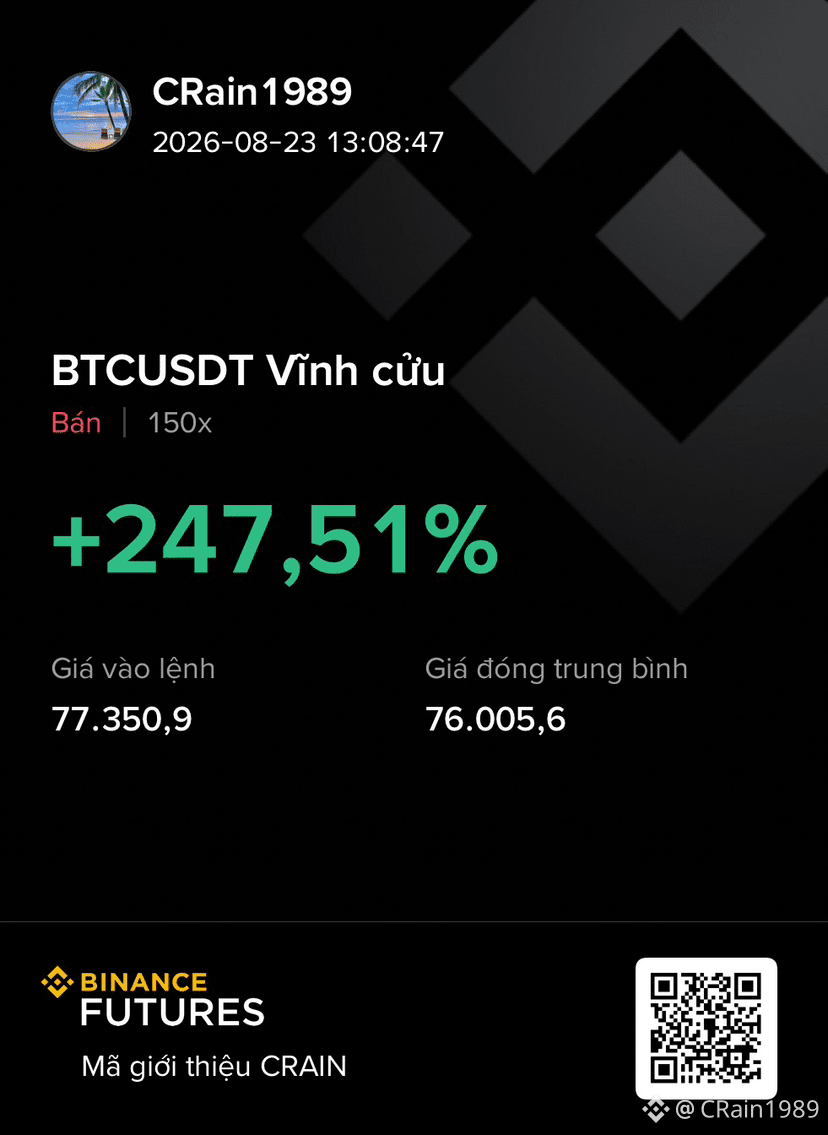
$BTC 23/8 :
- stl 200 price sticks, as well as btc breaking through the support zone 776xx, then shorting is completely reasonable per technical analysis ptkt r.
- But I only managed to catch an entry at 773xx and also took profit early by 1300 for the last day of the weekend.
Wait until tomorrow’s weekly candle closes, then I’ll update the trend assessment for everyone’s reference.
If BTC moves in a long price range from 63–79k, how could I not have to redo my plan from the start. All indicators change completely, everyone.
Wishing everyone good luck!
- stl 200 price sticks, as well as btc breaking through the support zone 776xx, then shorting is completely reasonable per technical analysis ptkt r.
- But I only managed to catch an entry at 773xx and also took profit early by 1300 for the last day of the weekend.
Wait until tomorrow’s weekly candle closes, then I’ll update the trend assessment for everyone’s reference.
If BTC moves in a long price range from 63–79k, how could I not have to redo my plan from the start. All indicators change completely, everyone.
Wishing everyone good luck!
CRain1989
·
--
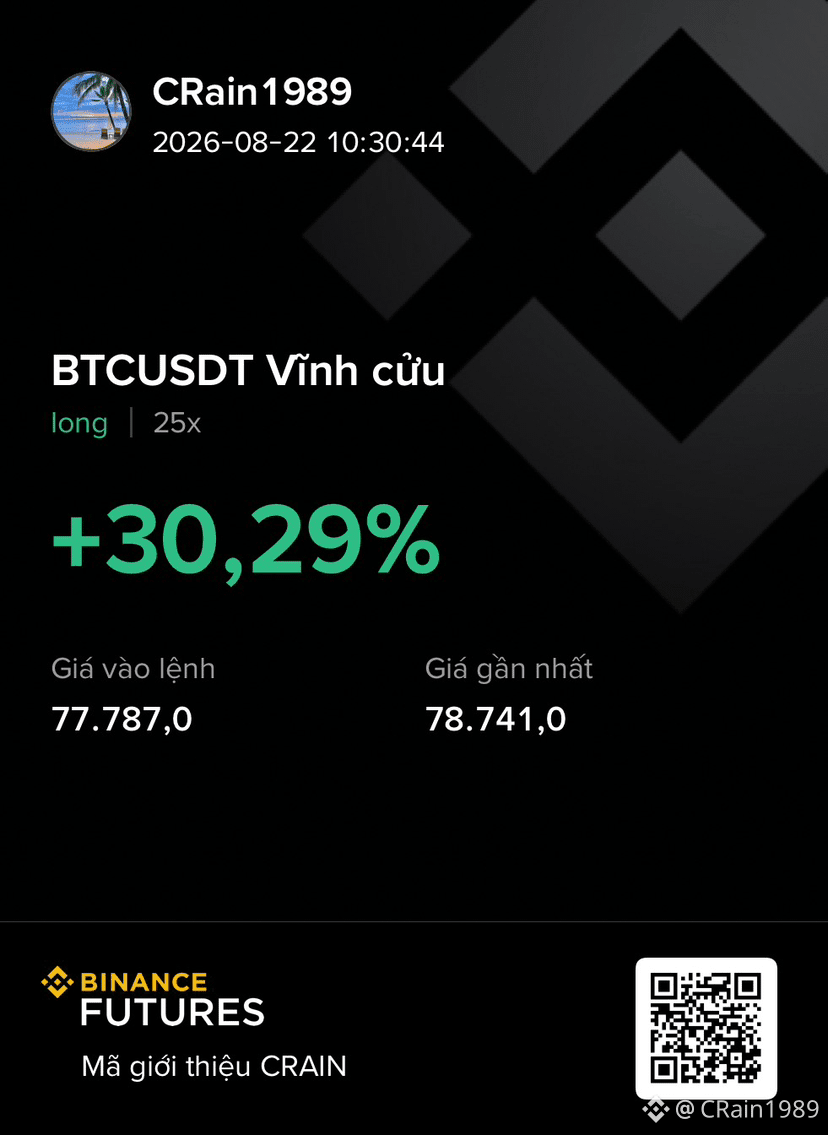
$BTC 22/8 :
- If there are big waves, then I ride the small ones. The short STLs shift continuously based on bullish signals; they keep appearing. As for bearish signals, I haven't seen any yet.
When the STL is bullish, I let the group around 767xx. The entry into this trade is 1000 points away.
Now it's moving up immediately to 775xx; the entry for this trade is 200 points away—pretty stable and solid.
Guys, try looking at the chart and analyze why I chose these STL levels.
- If there are big waves, then I ride the small ones. The short STLs shift continuously based on bullish signals; they keep appearing. As for bearish signals, I haven't seen any yet.
When the STL is bullish, I let the group around 767xx. The entry into this trade is 1000 points away.
Now it's moving up immediately to 775xx; the entry for this trade is 200 points away—pretty stable and solid.
Guys, try looking at the chart and analyze why I chose these STL levels.
$BTC 22/8 :
- If there are big waves, then I ride the small ones. The short STLs shift continuously based on bullish signals; they keep appearing. As for bearish signals, I haven't seen any yet.
When the STL is bullish, I let the group around 767xx. The entry into this trade is 1000 points away.
Now it's moving up immediately to 775xx; the entry for this trade is 200 points away—pretty stable and solid.
Guys, try looking at the chart and analyze why I chose these STL levels.
- If there are big waves, then I ride the small ones. The short STLs shift continuously based on bullish signals; they keep appearing. As for bearish signals, I haven't seen any yet.
When the STL is bullish, I let the group around 767xx. The entry into this trade is 1000 points away.
Now it's moving up immediately to 775xx; the entry for this trade is 200 points away—pretty stable and solid.
Guys, try looking at the chart and analyze why I chose these STL levels.
CRain1989
·
--
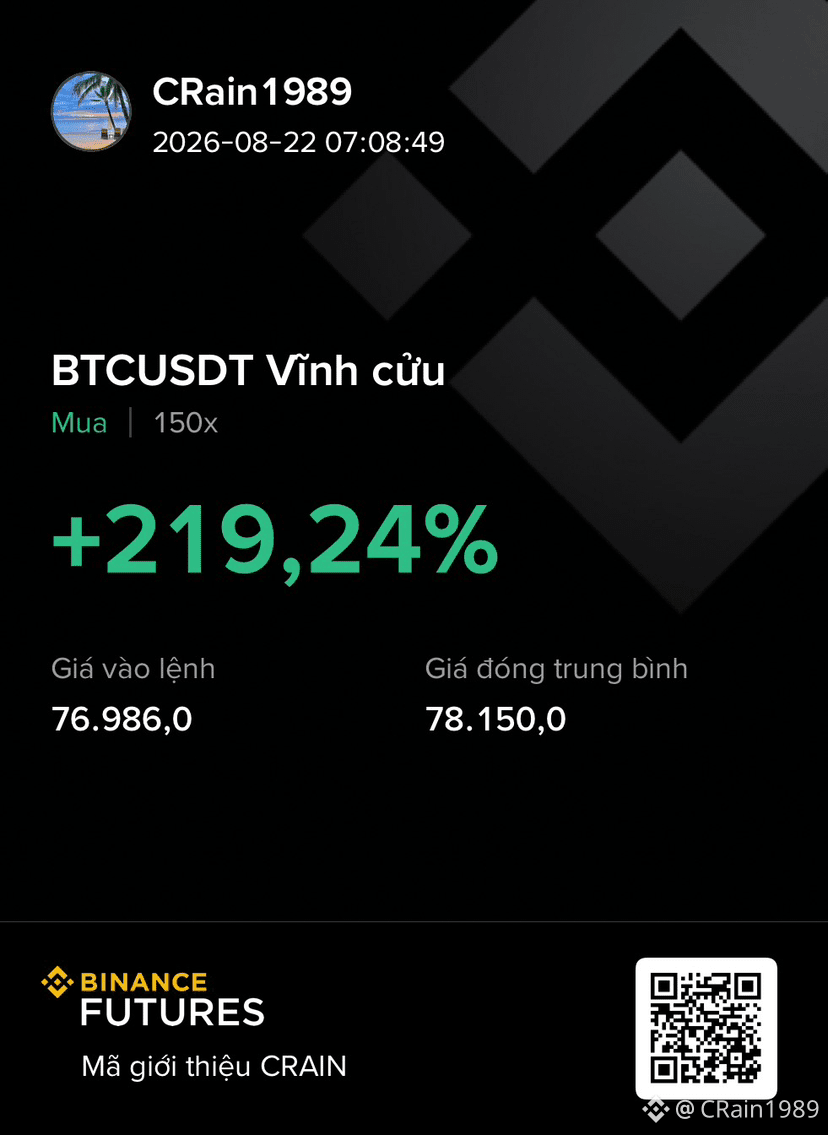
-$BTC 22/8:
Reduce 1100 points. It should have gone close to 2000 points.
Stl 761xx is correct: when the price touches 762xx, then it should increase again.
The order entry is because there hasn’t been any decrease signal appearing at all.
As for today, for the time being there is still none.
Stl moved up to 767xx. If it breaks through this zone, then Short is reasonable right away.
Reduce 1100 points. It should have gone close to 2000 points.
Stl 761xx is correct: when the price touches 762xx, then it should increase again.
The order entry is because there hasn’t been any decrease signal appearing at all.
As for today, for the time being there is still none.
Stl moved up to 767xx. If it breaks through this zone, then Short is reasonable right away.
-$BTC 22/8:
Reduce 1100 points. It should have gone close to 2000 points.
Stl 761xx is correct: when the price touches 762xx, then it should increase again.
The order entry is because there hasn’t been any decrease signal appearing at all.
As for today, for the time being there is still none.
Stl moved up to 767xx. If it breaks through this zone, then Short is reasonable right away.
Reduce 1100 points. It should have gone close to 2000 points.
Stl 761xx is correct: when the price touches 762xx, then it should increase again.
The order entry is because there hasn’t been any decrease signal appearing at all.
As for today, for the time being there is still none.
Stl moved up to 767xx. If it breaks through this zone, then Short is reasonable right away.
CRain1989
·
--
Waited all day just seeing increase and increase. Haven’t seen any sign of a reversal, guys.
Stl 761xx
$BTC
Stl 761xx
$BTC
Waited all day just seeing increase and increase. Haven’t seen any sign of a reversal, guys.
Stl 761xx
$BTC
Stl 761xx
$BTC
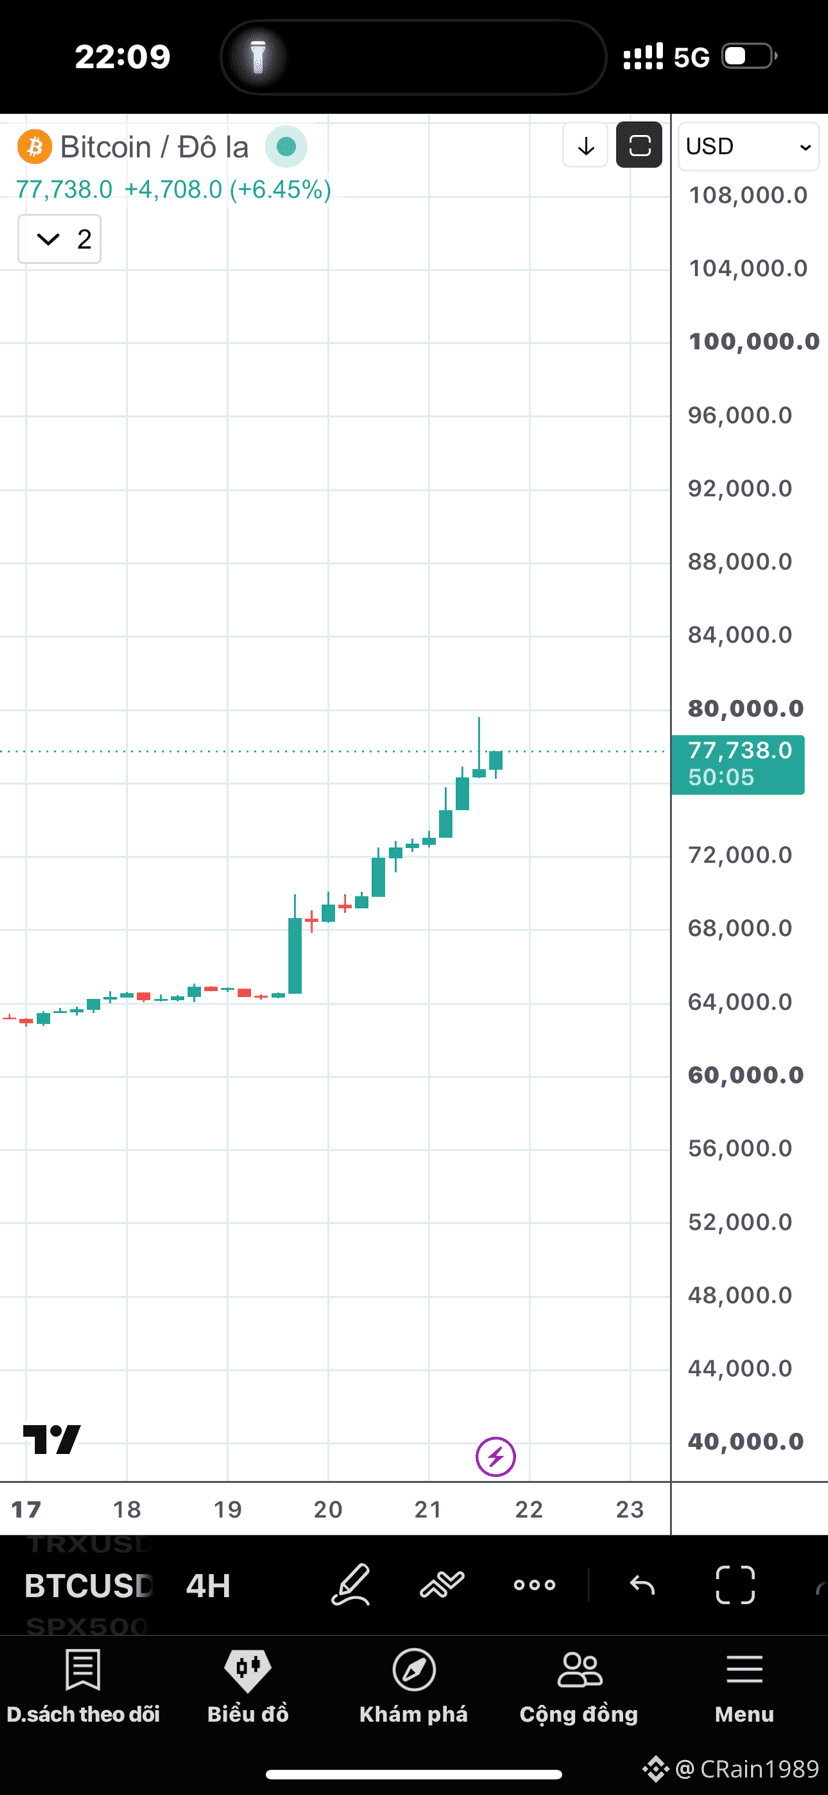
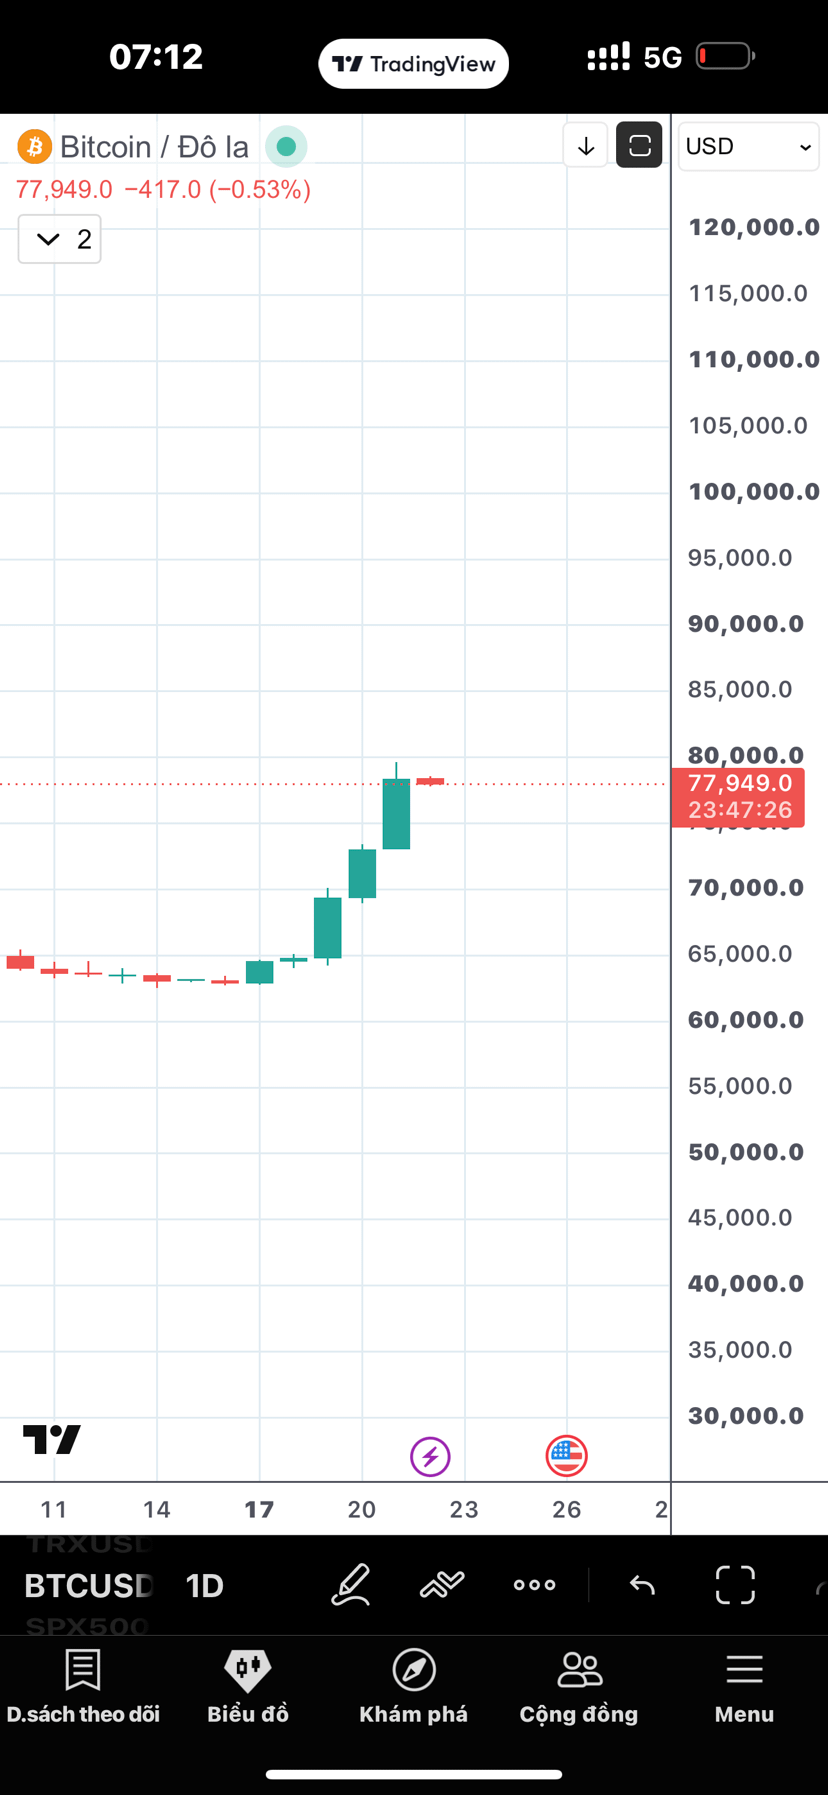
Comfort yourself with: “swallowing saliva is better than swallowing tears”
When the stock price surged, it jumped by nearly 20,000 in just 1 week :(
$BTC
When the stock price surged, it jumped by nearly 20,000 in just 1 week :(
$BTC
Still observing and waiting. I’m still focusing on waiting for a bearish reversal signal, guys.
Whenever it appears, we’ll post it for you to reference afterwards.
If this upward wave doesn’t trip the STL, then it can still make you around 2000 price—just decent for now 😓
$BTC
Whenever it appears, we’ll post it for you to reference afterwards.
If this upward wave doesn’t trip the STL, then it can still make you around 2000 price—just decent for now 😓
$BTC
Quick sweep 800 at $BTC in this area you should wait for the reversal signal, everyone.
Near the resistance zone of the M frame r
Near the resistance zone of the M frame r
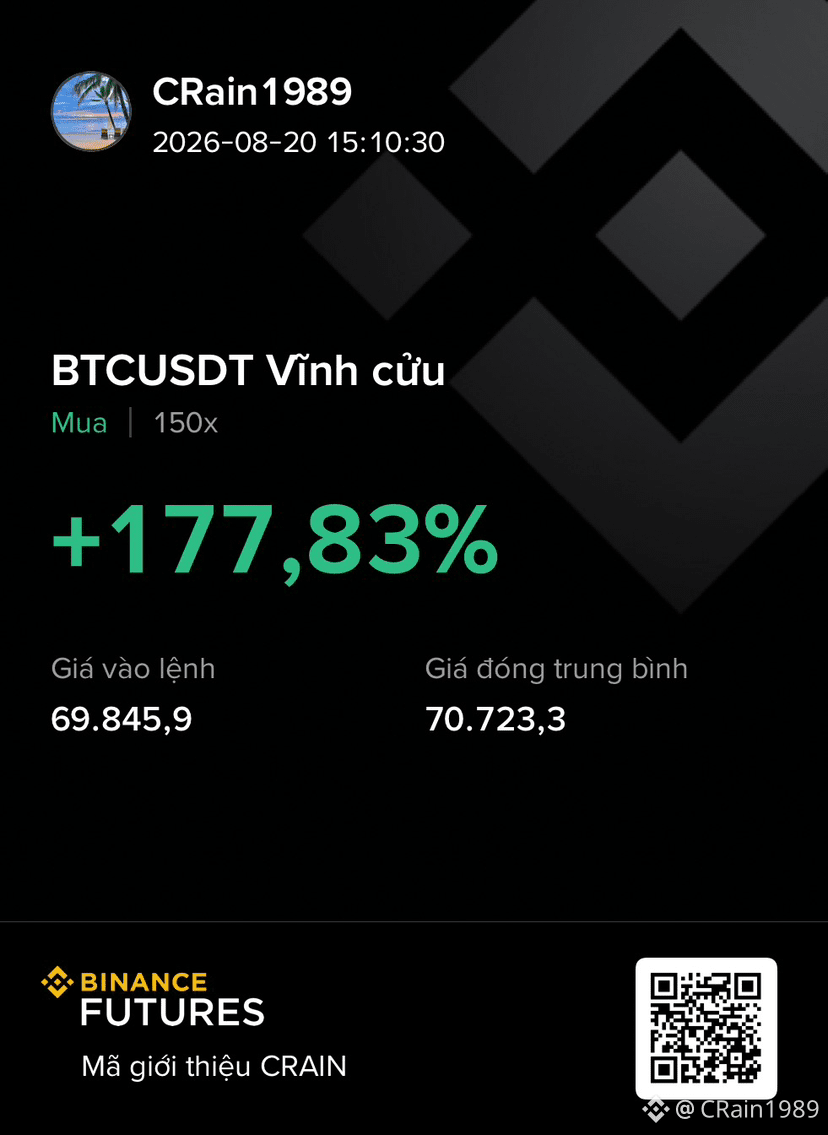
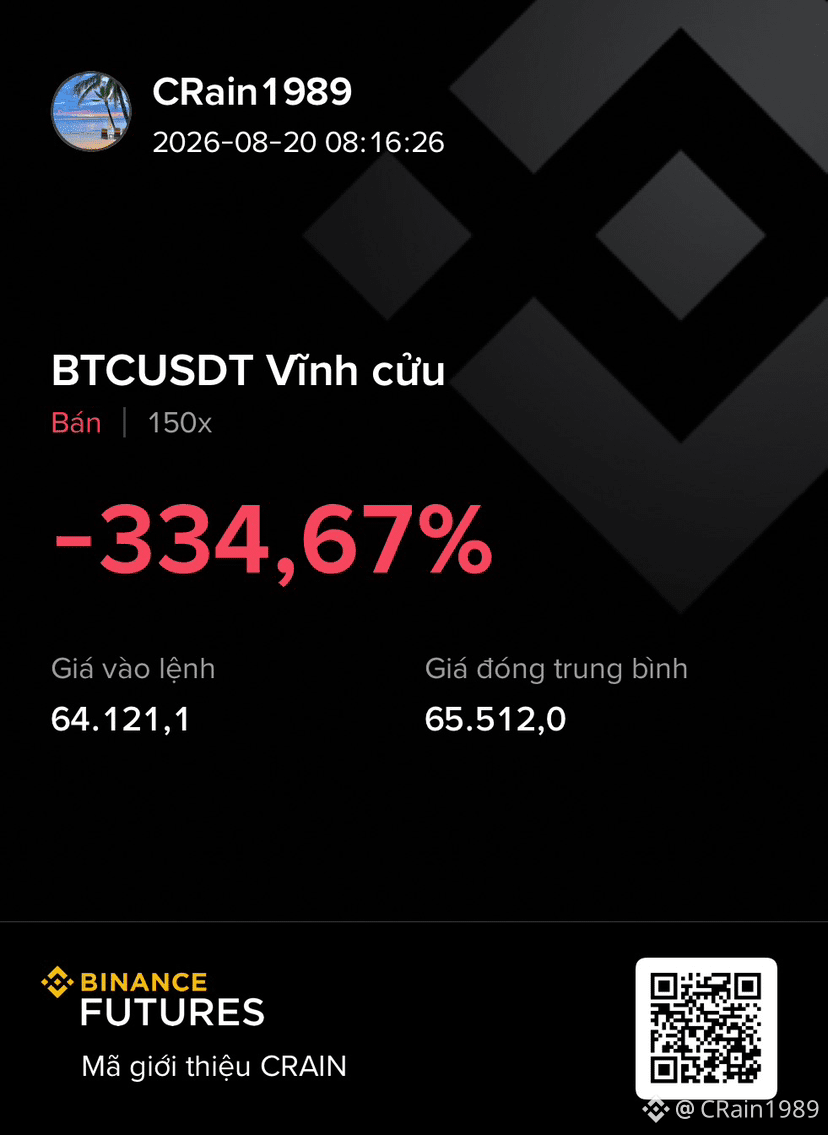
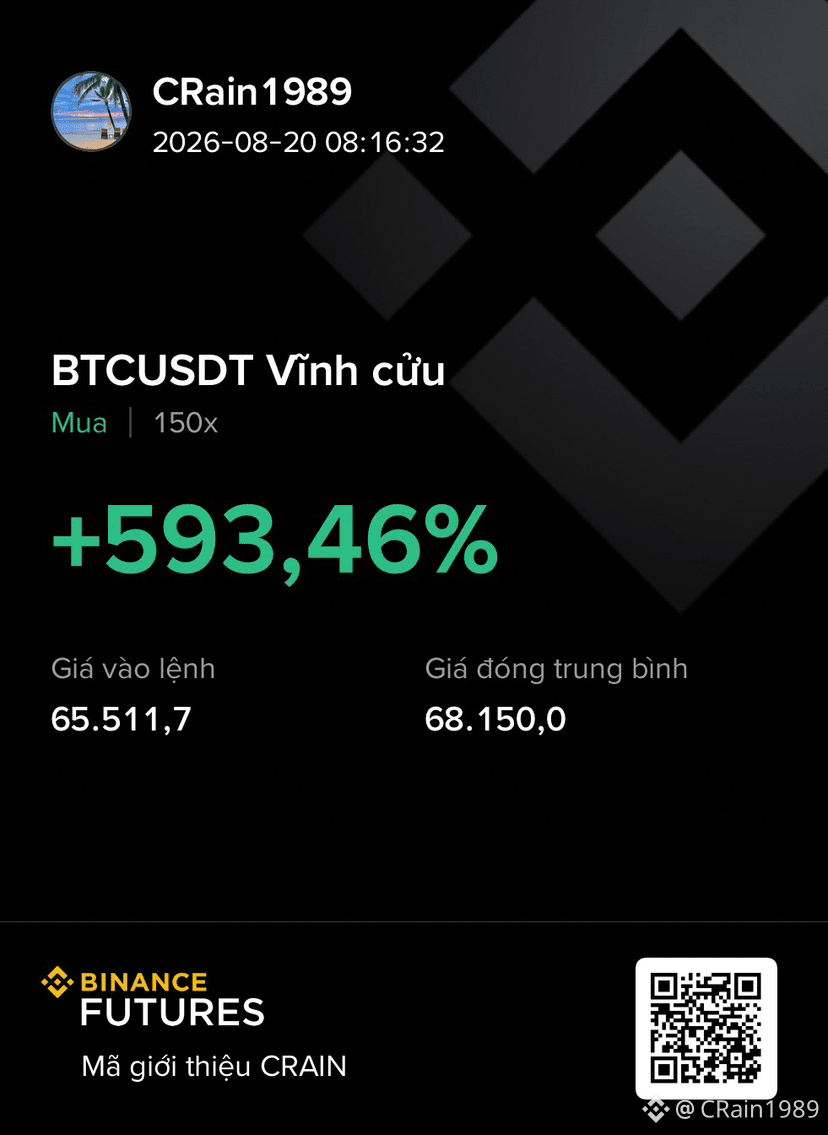
Stl $BTC 1400 stuck, price is 2.600 to buy, 2.600 price. Pretty stable.
The main resistance zone according to the W–W2 chart that I mentioned is the area around 65,300–65,500. So when BTC breaks above the stuck stl, it means the bearish view is wrong and there will be a new plan right away.
Because this resistance zone is very close to yesterday’s 64,4xx price area, setting up a short order is still fine; if BTC doesn’t break through, it may drop back to the lower boundary, as low as 55,000. The risk-to-reward ratio is very lopsided.
Of course, if the stl is triggered, then this view is canceled.
I’m waiting for a few more signals to see what happens. Because around 70,000 is the main resistance of the M timeframe. If it breaks through, then the view for the whole market over the next 1–2 years that I laid out will have to be changed completely.
That’s why identifying the stl zone is extremely, extremely important, everyone.
In the final stage of fully completing my technical analysis method, everything revolves around the stl zone.
Wishing you all good luck!
The main resistance zone according to the W–W2 chart that I mentioned is the area around 65,300–65,500. So when BTC breaks above the stuck stl, it means the bearish view is wrong and there will be a new plan right away.
Because this resistance zone is very close to yesterday’s 64,4xx price area, setting up a short order is still fine; if BTC doesn’t break through, it may drop back to the lower boundary, as low as 55,000. The risk-to-reward ratio is very lopsided.
Of course, if the stl is triggered, then this view is canceled.
I’m waiting for a few more signals to see what happens. Because around 70,000 is the main resistance of the M timeframe. If it breaks through, then the view for the whole market over the next 1–2 years that I laid out will have to be changed completely.
That’s why identifying the stl zone is extremely, extremely important, everyone.
In the final stage of fully completing my technical analysis method, everything revolves around the stl zone.
Wishing you all good luck!
CRain1989
·
--
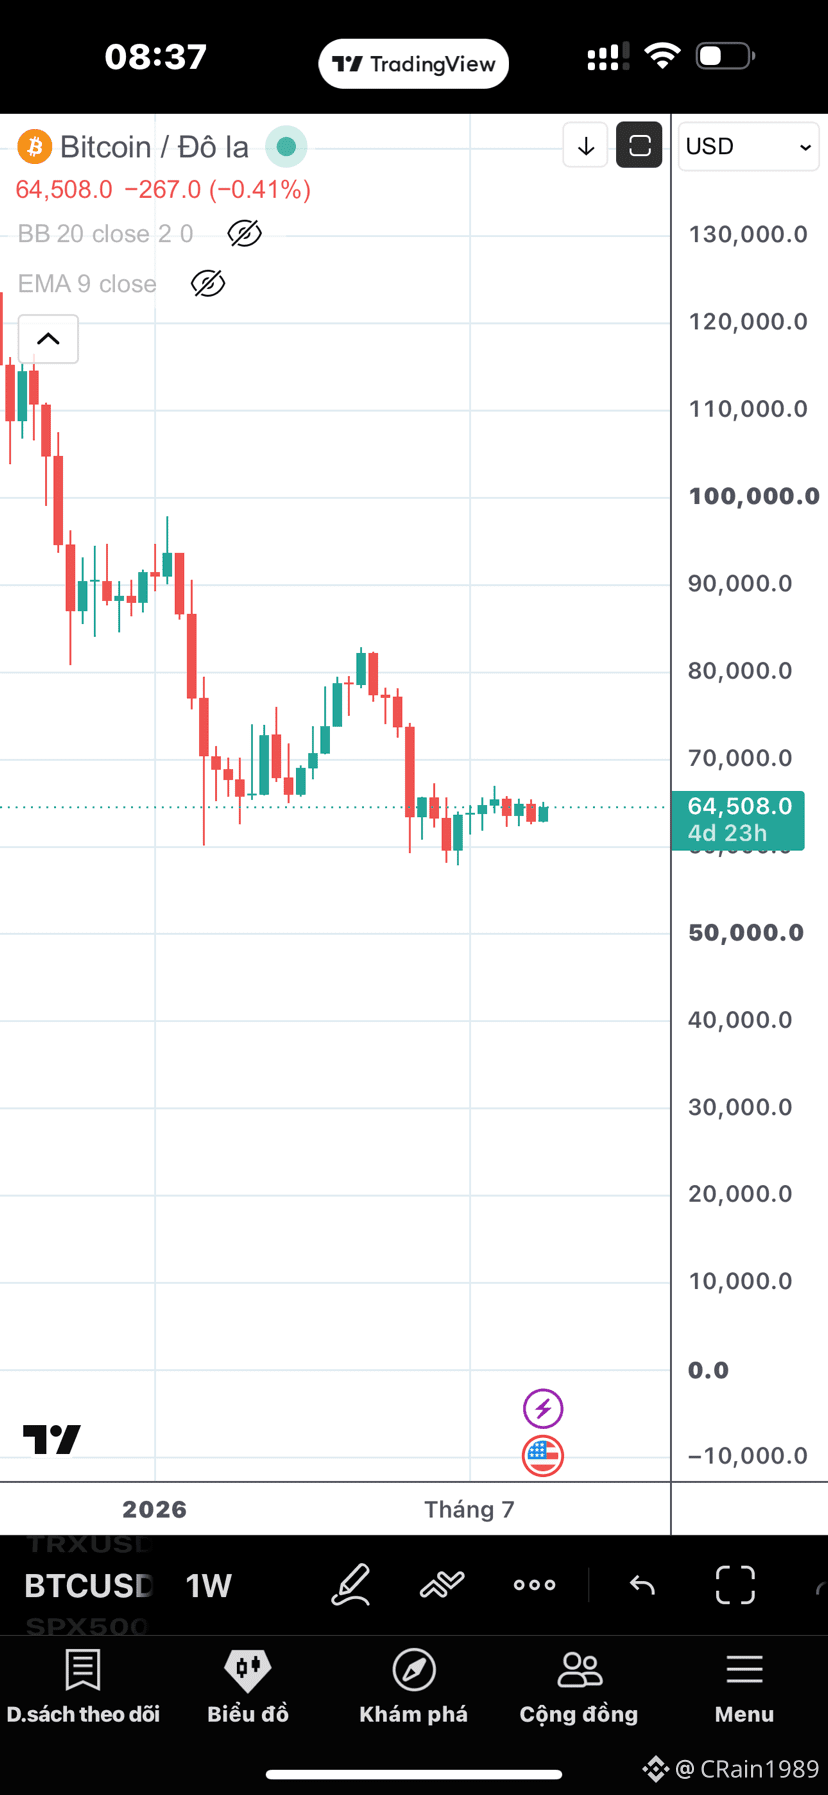
Review $BTC and Gold $PAXG on 19/8:
- Today a new D4 candle opened, and it’s also the time I’m going on a trip with my family, so I’ll post my personal trading review for everyone to reference if needed.
- D timeframe: Gold is being strongly pushed downwards in line with the main wave. The overall chart still follows what I predicted earlier: the higher Gold rises, the stronger and deeper the pullback will be. Overall, I still expect Gold to drop sharply this week and next week.
- BTC is very much a trap right now. The abnormal up-move over the past two days has brought the BTC D chart back into an up-wave. The surrounding timeframes also look very good. However, on the W-W2 timeframe there’s something noteworthy: the main resistance zone of these two larger frames lies just above the current price area—extremely, extremely close. So I think this is still a trap. I’m setting up a Short entry there, because the stop-loss at resistance is very tight.
- Usually, if this resistance zone is rejected, price will fall back to the lower boundary. But the lower boundary for BTC is extremely far down (very deep).
- With the new D4 candle opening, the bearish force is clearly stronger for Gold. For BTC it’s 50/50, the price action is squeezed and likely to swing (sw). It doesn’t look like an uptrend chart.
=> Personal view: Price will fall this week and next week, and there will soon be a very long candle.
Wishing everyone good luck!
Va
- Today a new D4 candle opened, and it’s also the time I’m going on a trip with my family, so I’ll post my personal trading review for everyone to reference if needed.
- D timeframe: Gold is being strongly pushed downwards in line with the main wave. The overall chart still follows what I predicted earlier: the higher Gold rises, the stronger and deeper the pullback will be. Overall, I still expect Gold to drop sharply this week and next week.
- BTC is very much a trap right now. The abnormal up-move over the past two days has brought the BTC D chart back into an up-wave. The surrounding timeframes also look very good. However, on the W-W2 timeframe there’s something noteworthy: the main resistance zone of these two larger frames lies just above the current price area—extremely, extremely close. So I think this is still a trap. I’m setting up a Short entry there, because the stop-loss at resistance is very tight.
- Usually, if this resistance zone is rejected, price will fall back to the lower boundary. But the lower boundary for BTC is extremely far down (very deep).
- With the new D4 candle opening, the bearish force is clearly stronger for Gold. For BTC it’s 50/50, the price action is squeezed and likely to swing (sw). It doesn’t look like an uptrend chart.
=> Personal view: Price will fall this week and next week, and there will soon be a very long candle.
Wishing everyone good luck!
Va
Stick all the 24k gold stl $PAXG and $BTC .
The market is rising strongly to break all the bearish signals. There’s a high chance it will be put into a short-term uptrend wave. Wait to see whether today’s candle closes above the main resistance or not
The market is rising strongly to break all the bearish signals. There’s a high chance it will be put into a short-term uptrend wave. Wait to see whether today’s candle closes above the main resistance or not
Review $BTC and Gold $PAXG on 19/8:
- Today a new D4 candle opened, and it’s also the time I’m going on a trip with my family, so I’ll post my personal trading review for everyone to reference if needed.
- D timeframe: Gold is being strongly pushed downwards in line with the main wave. The overall chart still follows what I predicted earlier: the higher Gold rises, the stronger and deeper the pullback will be. Overall, I still expect Gold to drop sharply this week and next week.
- BTC is very much a trap right now. The abnormal up-move over the past two days has brought the BTC D chart back into an up-wave. The surrounding timeframes also look very good. However, on the W-W2 timeframe there’s something noteworthy: the main resistance zone of these two larger frames lies just above the current price area—extremely, extremely close. So I think this is still a trap. I’m setting up a Short entry there, because the stop-loss at resistance is very tight.
- Usually, if this resistance zone is rejected, price will fall back to the lower boundary. But the lower boundary for BTC is extremely far down (very deep).
- With the new D4 candle opening, the bearish force is clearly stronger for Gold. For BTC it’s 50/50, the price action is squeezed and likely to swing (sw). It doesn’t look like an uptrend chart.
=> Personal view: Price will fall this week and next week, and there will soon be a very long candle.
Wishing everyone good luck!
Va
- Today a new D4 candle opened, and it’s also the time I’m going on a trip with my family, so I’ll post my personal trading review for everyone to reference if needed.
- D timeframe: Gold is being strongly pushed downwards in line with the main wave. The overall chart still follows what I predicted earlier: the higher Gold rises, the stronger and deeper the pullback will be. Overall, I still expect Gold to drop sharply this week and next week.
- BTC is very much a trap right now. The abnormal up-move over the past two days has brought the BTC D chart back into an up-wave. The surrounding timeframes also look very good. However, on the W-W2 timeframe there’s something noteworthy: the main resistance zone of these two larger frames lies just above the current price area—extremely, extremely close. So I think this is still a trap. I’m setting up a Short entry there, because the stop-loss at resistance is very tight.
- Usually, if this resistance zone is rejected, price will fall back to the lower boundary. But the lower boundary for BTC is extremely far down (very deep).
- With the new D4 candle opening, the bearish force is clearly stronger for Gold. For BTC it’s 50/50, the price action is squeezed and likely to swing (sw). It doesn’t look like an uptrend chart.
=> Personal view: Price will fall this week and next week, and there will soon be a very long candle.
Wishing everyone good luck!
Va
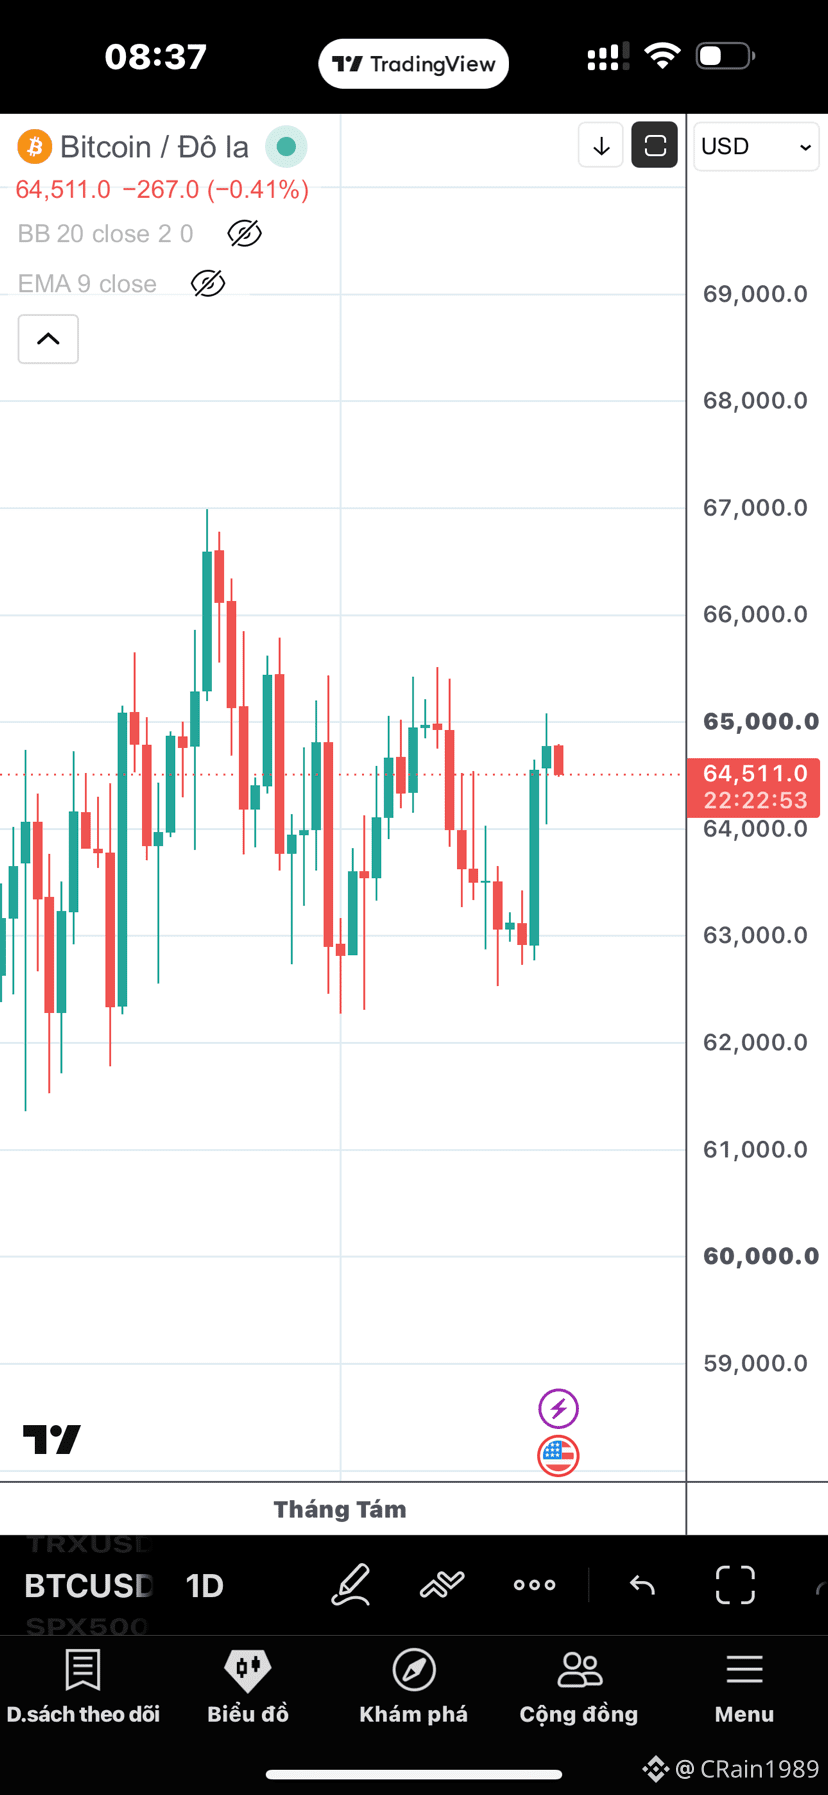
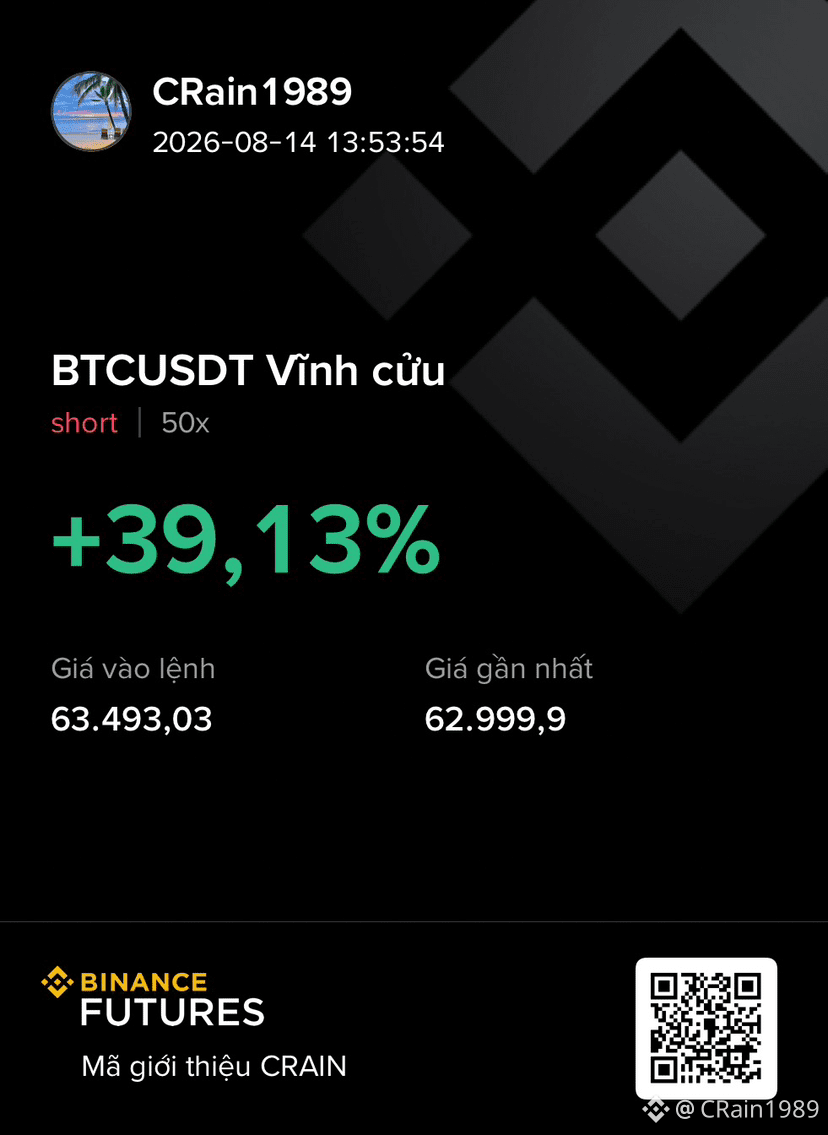
Order -$BTC is also running. I set this order with a short stl, around a price of 500-600.
After going through all the stages, I’ll share with you: identifying the stl zone is very important. If it’s wrong, you’re stuck with the wrong conclusion and have to accept it. Not moving the stl or continuing DCA… this has been improved much more than before.
Sometimes the stl only needs to be 200-300 points away, but it is the key reference point for the whole long-term trend of 5000-10000 points—that’s normal.
I’m still holding my Gold order to see what the D4 signal looks like tomorrow: whether there is confirmation of a bearish trend or not
After going through all the stages, I’ll share with you: identifying the stl zone is very important. If it’s wrong, you’re stuck with the wrong conclusion and have to accept it. Not moving the stl or continuing DCA… this has been improved much more than before.
Sometimes the stl only needs to be 200-300 points away, but it is the key reference point for the whole long-term trend of 5000-10000 points—that’s normal.
I’m still holding my Gold order to see what the D4 signal looks like tomorrow: whether there is confirmation of a bearish trend or not
CRain1989
·
--
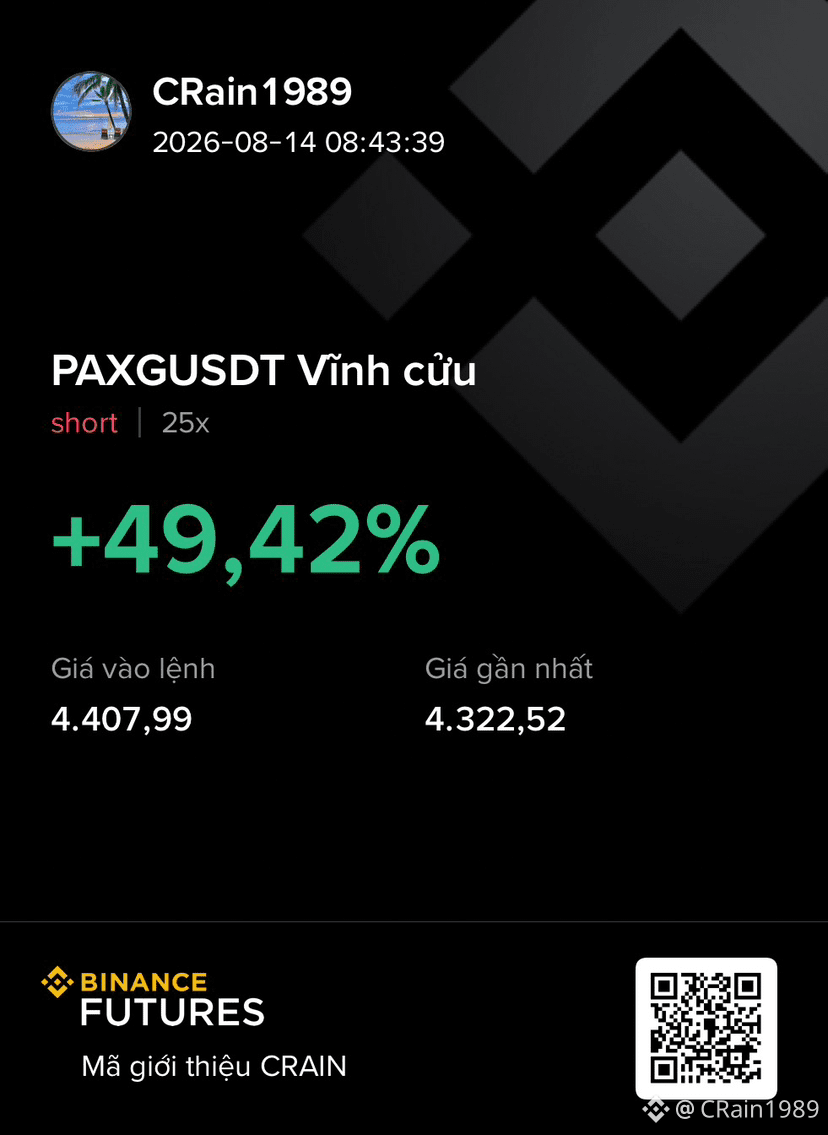
Nearly 100 gold prices $PAXG
Correctly viewing the gold going up means it will rise faster; once the momentum is done, it will then drop more strongly and deeper in the upcoming time.
The expected target (Tp) is still very deep.
$BTC for now still has buying aggregation force, so the price will only decrease slightly.
Tomorrow morning will open a new D4 candle; it is likely there will be a clearer sell signal.
Wishing everyone good luck!
Correctly viewing the gold going up means it will rise faster; once the momentum is done, it will then drop more strongly and deeper in the upcoming time.
The expected target (Tp) is still very deep.
$BTC for now still has buying aggregation force, so the price will only decrease slightly.
Tomorrow morning will open a new D4 candle; it is likely there will be a clearer sell signal.
Wishing everyone good luck!
Nearly 100 gold prices $PAXG
Correctly viewing the gold going up means it will rise faster; once the momentum is done, it will then drop more strongly and deeper in the upcoming time.
The expected target (Tp) is still very deep.
$BTC for now still has buying aggregation force, so the price will only decrease slightly.
Tomorrow morning will open a new D4 candle; it is likely there will be a clearer sell signal.
Wishing everyone good luck!
Correctly viewing the gold going up means it will rise faster; once the momentum is done, it will then drop more strongly and deeper in the upcoming time.
The expected target (Tp) is still very deep.
$BTC for now still has buying aggregation force, so the price will only decrease slightly.
Tomorrow morning will open a new D4 candle; it is likely there will be a clearer sell signal.
Wishing everyone good luck!
CRain1989
·
--
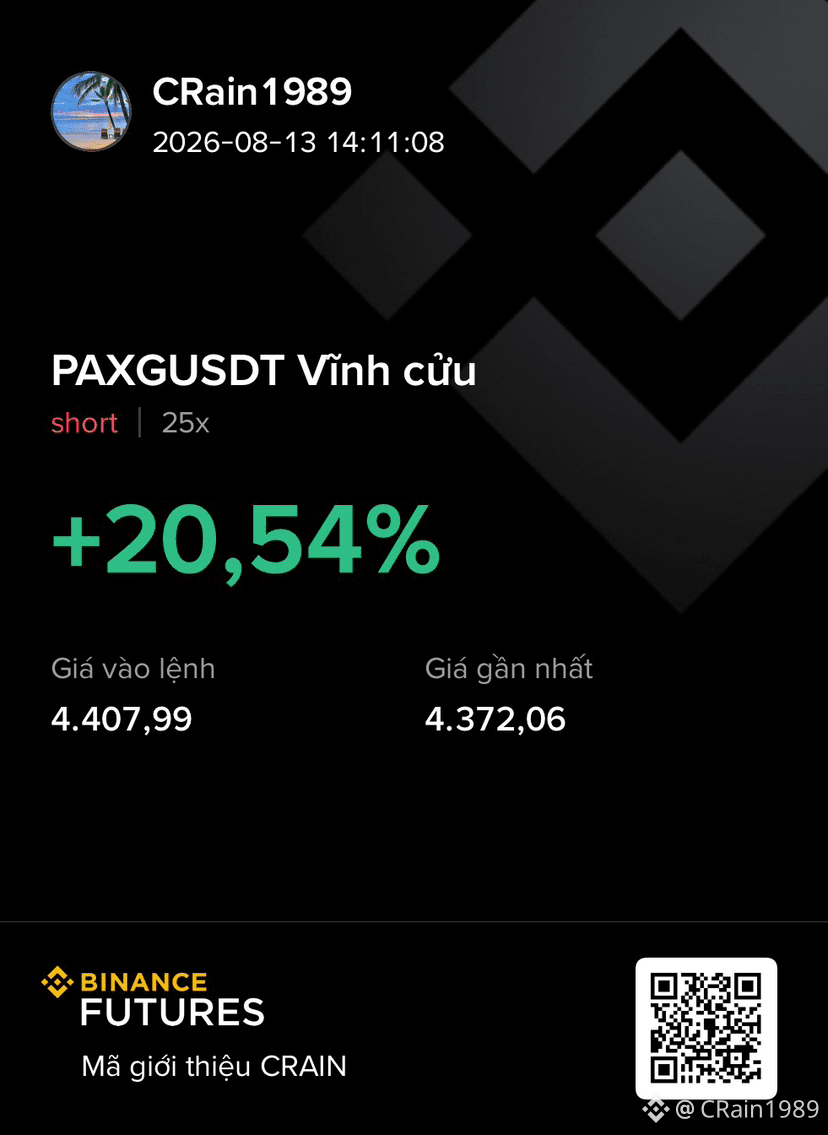
$BTC v and Gold $PAXG 13/8 :
- In 2 more days, we will close the D4 candle for both Gold and $BTC. BTC still has accumulation strength with the W2 chart, so the price is moving within short trading range; currently it is gradually decreasing.
As for Gold: if D4 closes as a red candle, it will be a disaster for the entire market. Because Gold’s long wave has already fallen into a downtrend. Therefore, at this time, the higher it rises, the faster and stronger the decline will be. The main focus is to wait for and catch the correct signal of a bearish reversal. This is something that everyone should spend time to research and learn— it will be very beneficial for investment.
Wishing you good luck!
- In 2 more days, we will close the D4 candle for both Gold and $BTC. BTC still has accumulation strength with the W2 chart, so the price is moving within short trading range; currently it is gradually decreasing.
As for Gold: if D4 closes as a red candle, it will be a disaster for the entire market. Because Gold’s long wave has already fallen into a downtrend. Therefore, at this time, the higher it rises, the faster and stronger the decline will be. The main focus is to wait for and catch the correct signal of a bearish reversal. This is something that everyone should spend time to research and learn— it will be very beneficial for investment.
Wishing you good luck!
$PAXG đang chạy. Stl 50 price
$BTC quite firm
$BTC quite firm
CRain1989
·
--
$BTC v and Gold $PAXG 13/8 :
- In 2 more days, we will close the D4 candle for both Gold and $BTC. BTC still has accumulation strength with the W2 chart, so the price is moving within short trading range; currently it is gradually decreasing.
As for Gold: if D4 closes as a red candle, it will be a disaster for the entire market. Because Gold’s long wave has already fallen into a downtrend. Therefore, at this time, the higher it rises, the faster and stronger the decline will be. The main focus is to wait for and catch the correct signal of a bearish reversal. This is something that everyone should spend time to research and learn— it will be very beneficial for investment.
Wishing you good luck!
- In 2 more days, we will close the D4 candle for both Gold and $BTC. BTC still has accumulation strength with the W2 chart, so the price is moving within short trading range; currently it is gradually decreasing.
As for Gold: if D4 closes as a red candle, it will be a disaster for the entire market. Because Gold’s long wave has already fallen into a downtrend. Therefore, at this time, the higher it rises, the faster and stronger the decline will be. The main focus is to wait for and catch the correct signal of a bearish reversal. This is something that everyone should spend time to research and learn— it will be very beneficial for investment.
Wishing you good luck!
$BTC v and Gold $PAXG 13/8 :
- In 2 more days, we will close the D4 candle for both Gold and $BTC . BTC still has accumulation strength with the W2 chart, so the price is moving within short trading range; currently it is gradually decreasing.
As for Gold: if D4 closes as a red candle, it will be a disaster for the entire market. Because Gold’s long wave has already fallen into a downtrend. Therefore, at this time, the higher it rises, the faster and stronger the decline will be. The main focus is to wait for and catch the correct signal of a bearish reversal. This is something that everyone should spend time to research and learn— it will be very beneficial for investment.
Wishing you good luck!
- In 2 more days, we will close the D4 candle for both Gold and $BTC . BTC still has accumulation strength with the W2 chart, so the price is moving within short trading range; currently it is gradually decreasing.
As for Gold: if D4 closes as a red candle, it will be a disaster for the entire market. Because Gold’s long wave has already fallen into a downtrend. Therefore, at this time, the higher it rises, the faster and stronger the decline will be. The main focus is to wait for and catch the correct signal of a bearish reversal. This is something that everyone should spend time to research and learn— it will be very beneficial for investment.
Wishing you good luck!
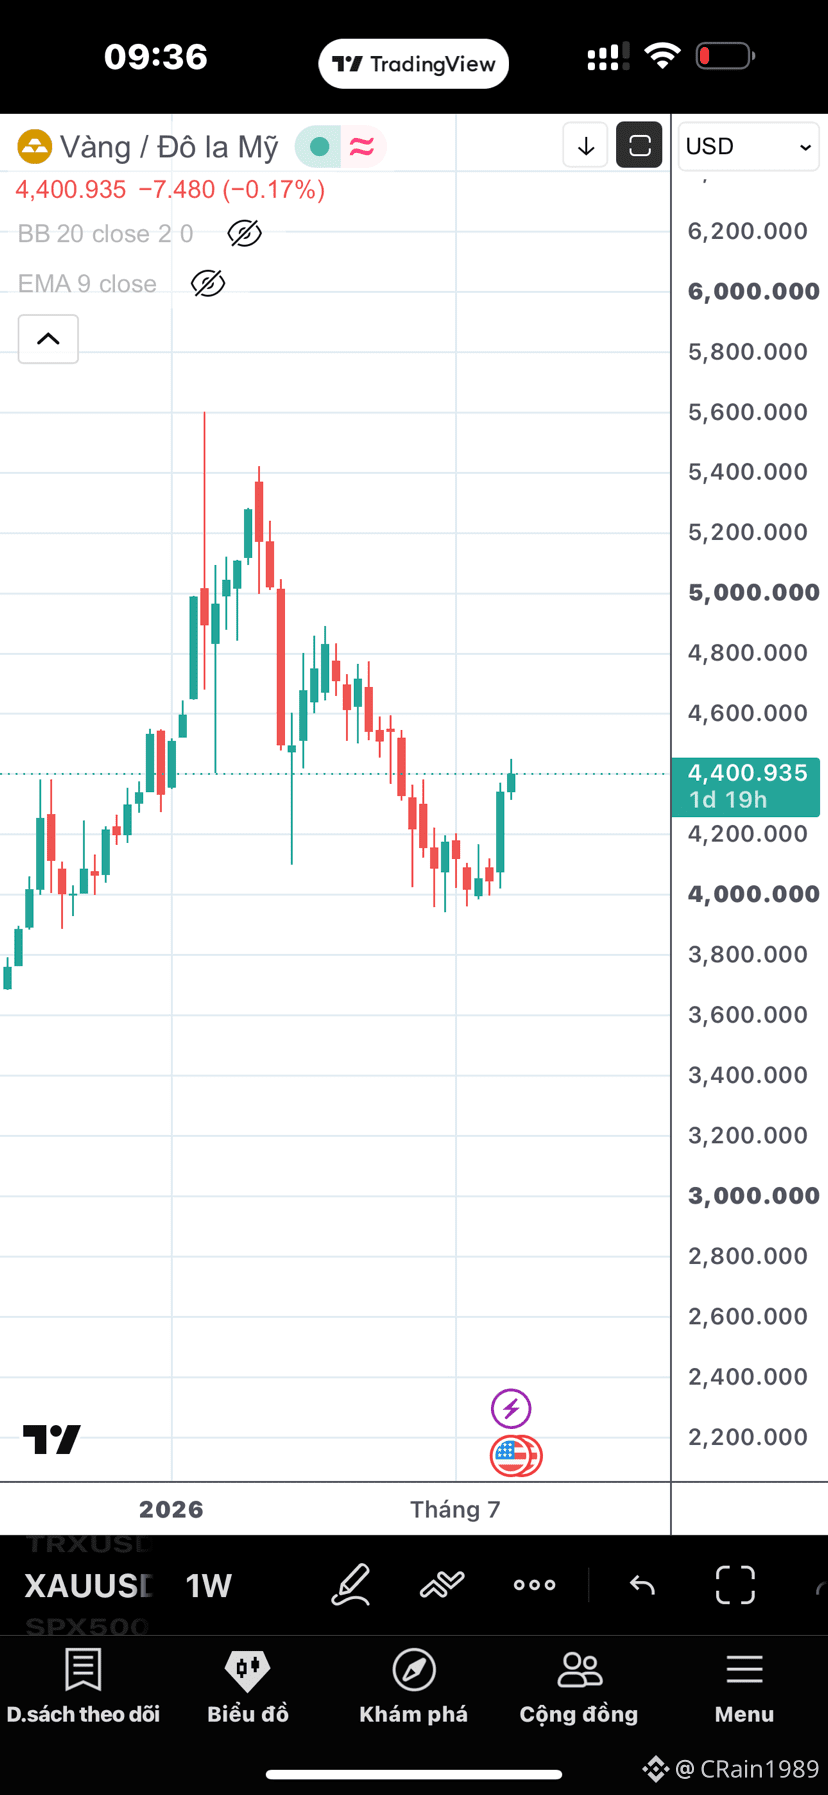
$BTC and Gold $PAXG on day 12/8:
- BTC signals are still very hard to predict. The dump from 65-63 I didn’t get into any order, and I even got hit with an stl because this zone, like two weeks ago, is also a blind spot that’s hard to analyze.
- However, if we look at Gold, I see a lot of risk. This rise to 44xx is abnormal. Most likely, the market ahead will turn red for a long time.
- I have continued setting up 1 trade, with stl also very short on gold, about 30-40 points.
Ae should pay attention to this part.
- BTC signals are still very hard to predict. The dump from 65-63 I didn’t get into any order, and I even got hit with an stl because this zone, like two weeks ago, is also a blind spot that’s hard to analyze.
- However, if we look at Gold, I see a lot of risk. This rise to 44xx is abnormal. Most likely, the market ahead will turn red for a long time.
- I have continued setting up 1 trade, with stl also very short on gold, about 30-40 points.
Ae should pay attention to this part.
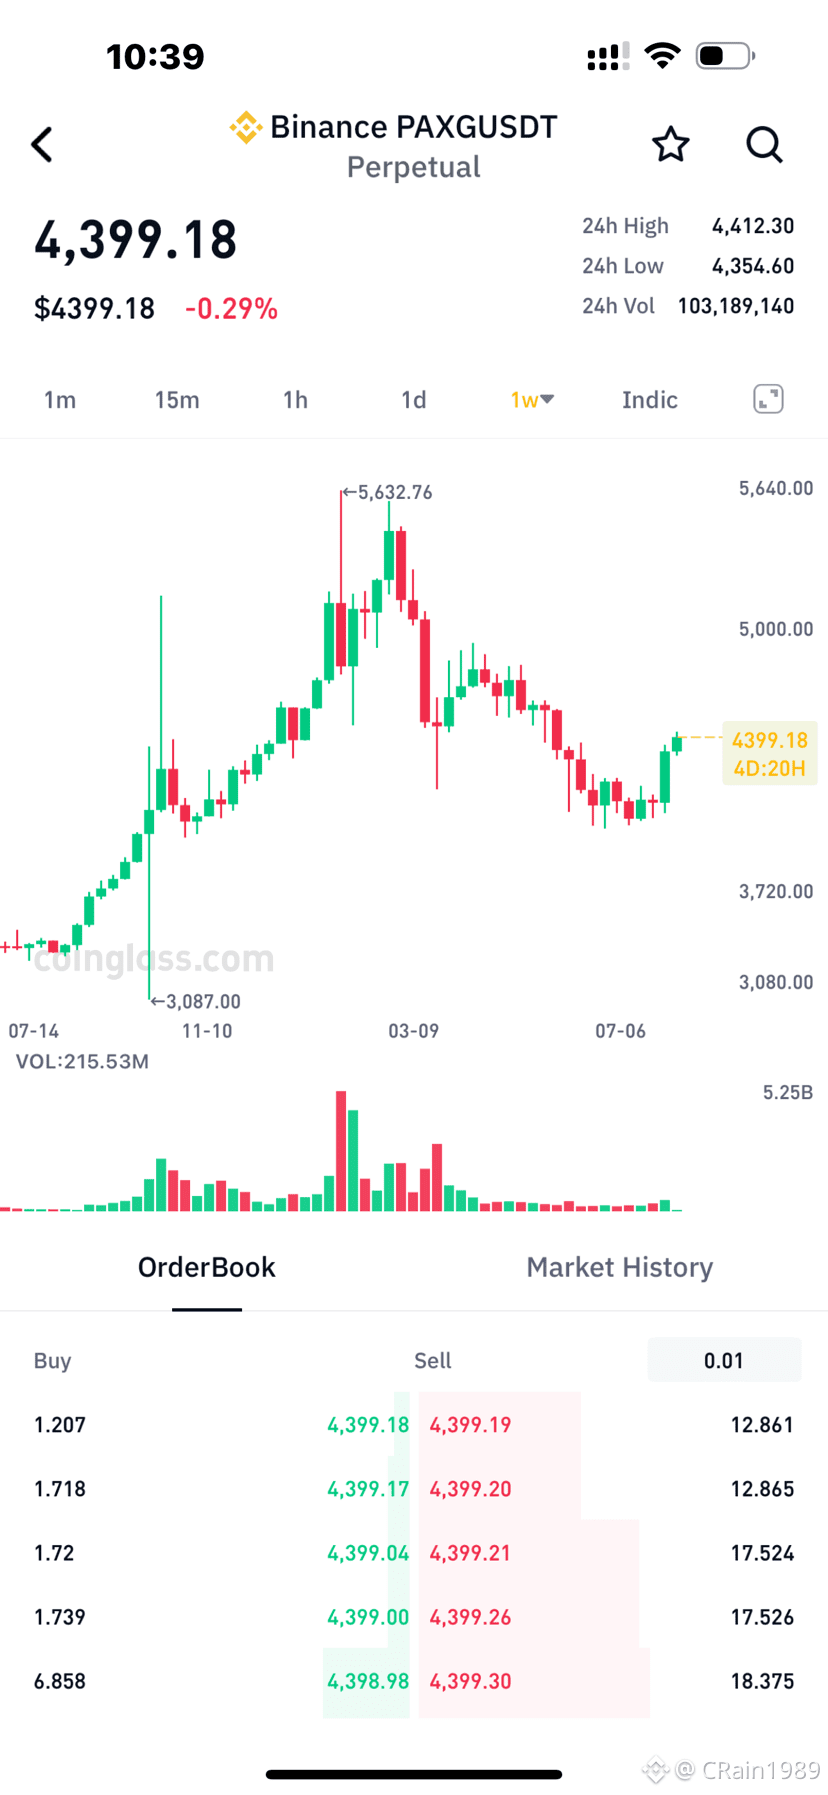
Usually this section $BTC will have 1 strong up/down move to confirm the trend.
I think this move will happen within today only.
I’ve also set up a BTC.Ae order—choose which side yourself. I don’t share it. But personally, I think in this section everyone should set a short STL around a price of 700–800. But the TP should be 3000–5000.
I think this move will happen within today only.
I’ve also set up a BTC.Ae order—choose which side yourself. I don’t share it. But personally, I think in this section everyone should set a short STL around a price of 700–800. But the TP should be 3000–5000.
CRain1989
·
--
$BTC và Gold $PAXG đóng candlestick tuần 10/8 is very hard to predict. This is not a pretty chart when the closing price is sitting right below the main resistance line.
Need to wait for more information from the D-D4 candles to open new candles tomorrow to determine the trade.
So exciting, everyone!!!!
Need to wait for more information from the D-D4 candles to open new candles tomorrow to determine the trade.
So exciting, everyone!!!!
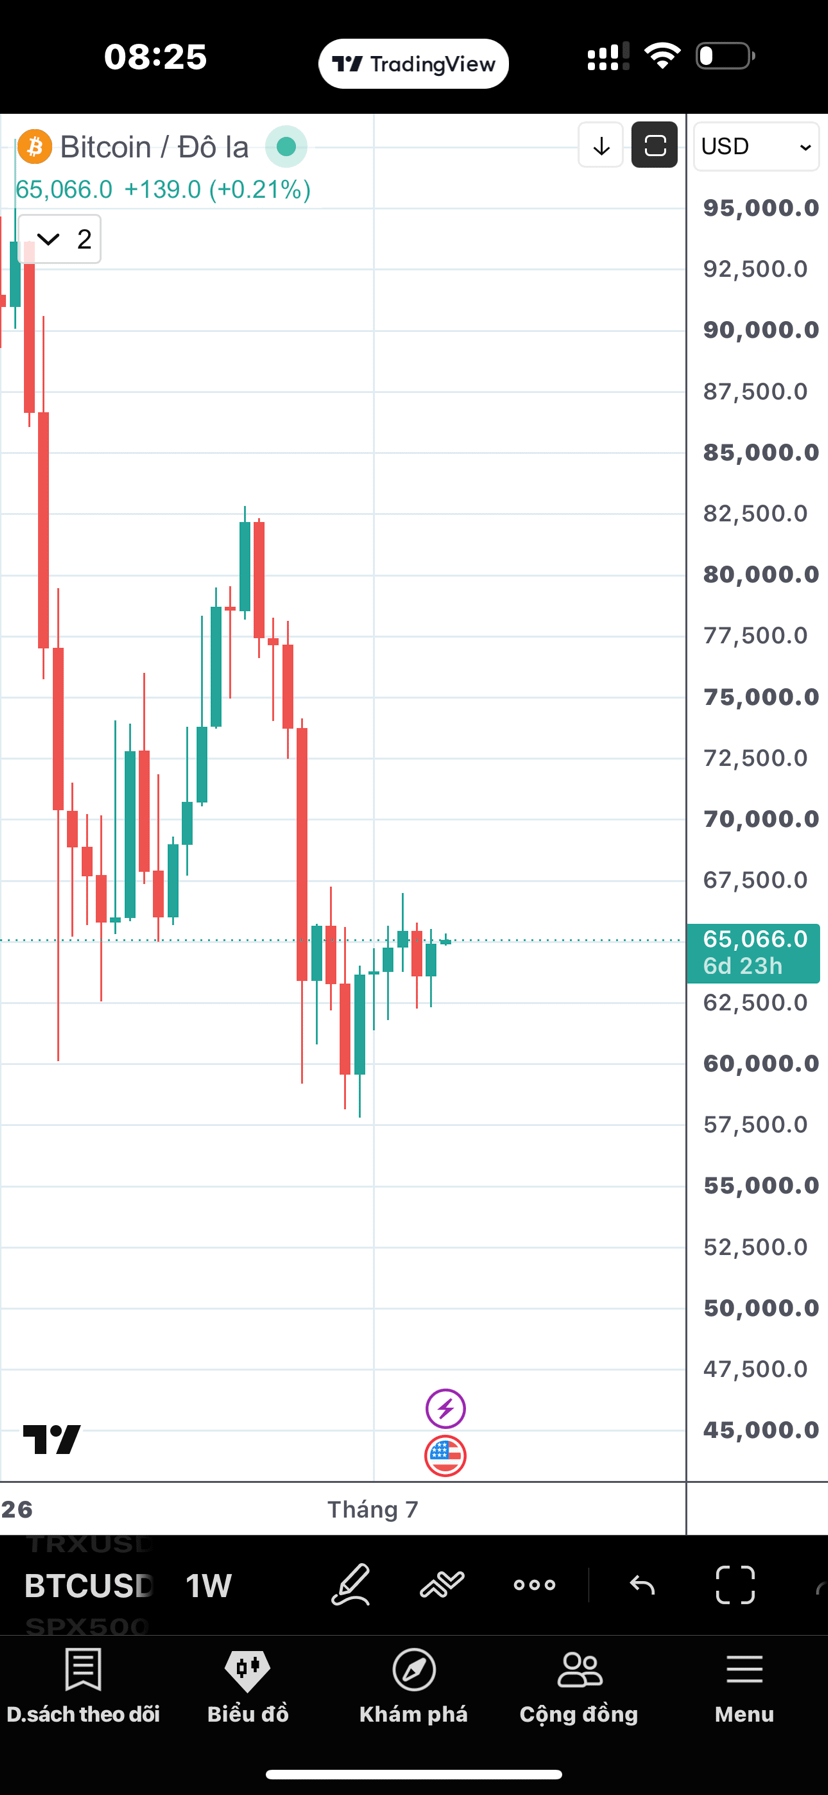
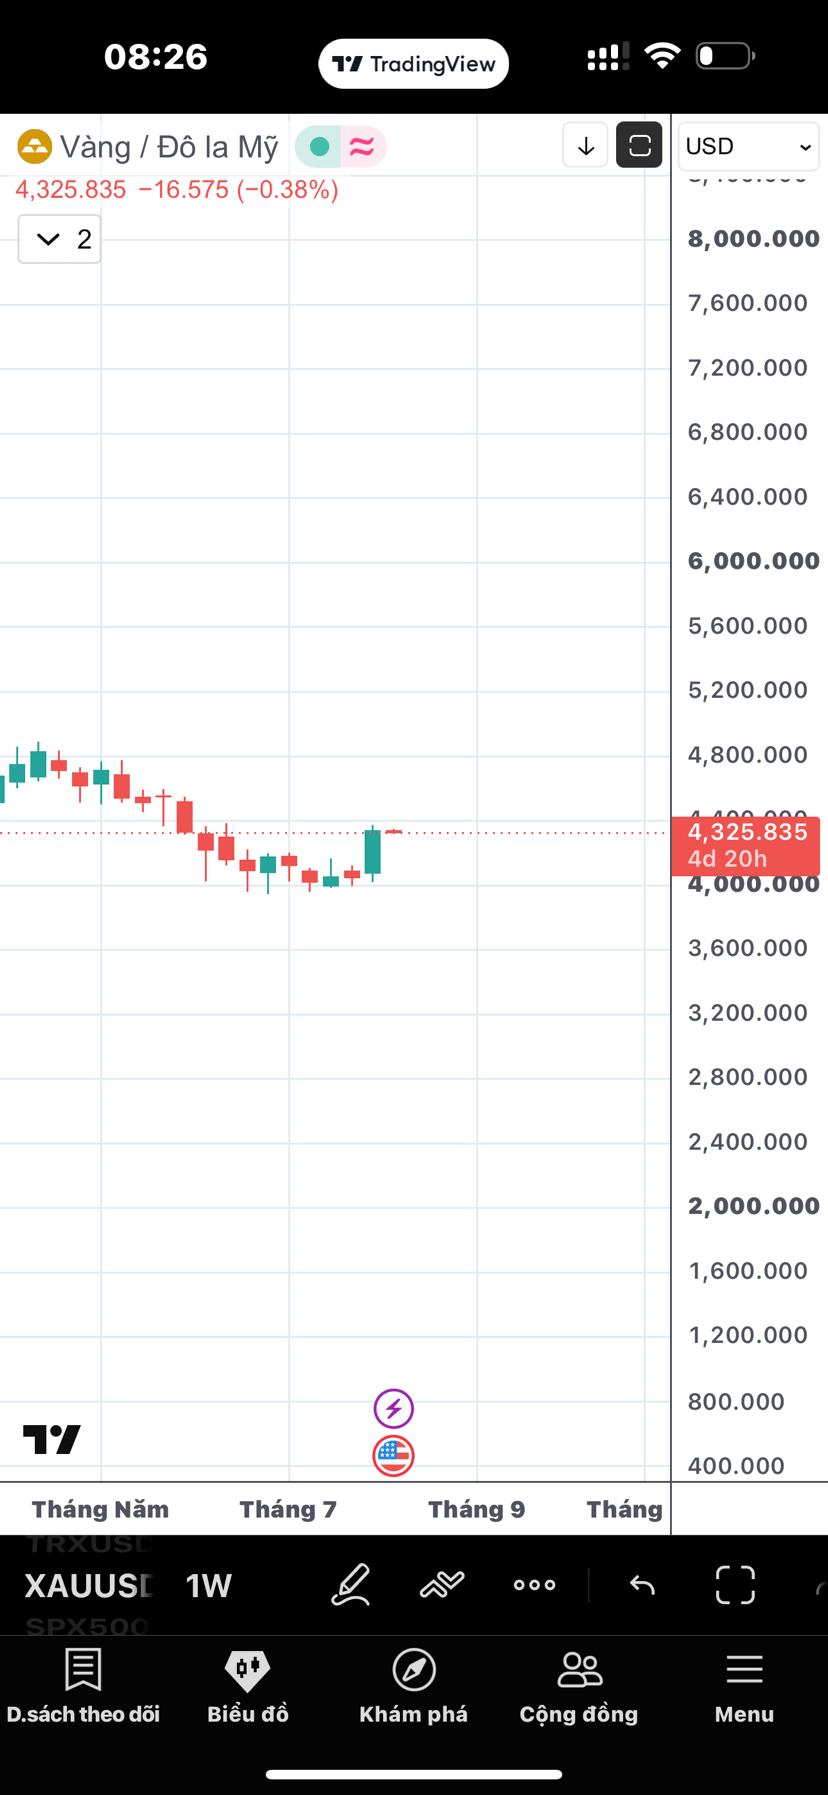
$BTC và Gold $PAXG đóng candlestick tuần 10/8 is very hard to predict. This is not a pretty chart when the closing price is sitting right below the main resistance line.
Need to wait for more information from the D-D4 candles to open new candles tomorrow to determine the trade.
So exciting, everyone!!!!
Need to wait for more information from the D-D4 candles to open new candles tomorrow to determine the trade.
So exciting, everyone!!!!
Log in to explore more content