
Decrypted Labs
1.4k Posts

Decrypted Labs
Report
Block User
Sharing insights on Crypto, NFTs, WEB 3 | BNB - BTC HOLDER
Occasional Trader
5.6 Years
14 Following
23.5K+ Followers
13.9K+ Liked
Posts
All
Quotes
Videos
PINNED
I made $2M from $8k in 2023, here are my top 60 tokens for 2024 bull run:
➮ AI: $TAO, $AGRS, $PAAL, $RNDR, $AKT, $FET, $PRIME, $AIOZ, $ORAI, $ABT, $ALEPH, $GHX, $AIT, $OPSEC, $NMT
➮ DePin: $FIL, $RNDR, $HNT, $THETA, $OCEAN, $ANKR, $HONEY
➮ L1: $KAS, $INJ, $KUJI, $MONAD, $ASTR, $RON, $SUI, $SEI
➮ GameFi: $MAVIA, $RON, $GALA, #BIGTIME, $ALICE, $MAGIC, $WILD, $SIDUS
➮ RWA: $SNX, $MKR, $CFG, $RBN, $POLYX
➮ L2: #STRK, #ARB, #METIS, #BOBA, #IMX
➮ BRC-20: $SAVM, #MUBI, #ORDI
➮ Modular: #TIA, #DYM, #GEL
Restaking : #RSTK, #EIGEN
Derivatives : #MCB, #AEVO, #DYDX
#Write2Earn
I made $2M from $8k in 2023, here are my top 60 tokens for 2024 bull run:
➮ AI: $TAO, $AGRS, $PAAL, $RNDR, $AKT, $FET, $PRIME, $AIOZ, $ORAI, $ABT, $ALEPH, $GHX, $AIT, $OPSEC, $NMT
➮ DePin: $FIL, $RNDR, $HNT, $THETA, $OCEAN, $ANKR, $HONEY
➮ L1: $KAS, $INJ, $KUJI, $MONAD, $ASTR, $RON, $SUI, $SEI
➮ GameFi: $MAVIA, $RON, $GALA, #BIGTIME, $ALICE, $MAGIC, $WILD, $SIDUS
➮ RWA: $SNX, $MKR, $CFG, $RBN, $POLYX
➮ L2: #STRK, #ARB, #METIS, #BOBA, #IMX
➮ BRC-20: $SAVM, #MUBI, #ORDI
➮ Modular: #TIA, #DYM, #GEL
Restaking : #RSTK, #EIGEN
Derivatives : #MCB, #AEVO, #DYDX
#Write2Earn
➮ AI: $TAO, $AGRS, $PAAL, $RNDR, $AKT, $FET, $PRIME, $AIOZ, $ORAI, $ABT, $ALEPH, $GHX, $AIT, $OPSEC, $NMT
➮ DePin: $FIL, $RNDR, $HNT, $THETA, $OCEAN, $ANKR, $HONEY
➮ L1: $KAS, $INJ, $KUJI, $MONAD, $ASTR, $RON, $SUI, $SEI
➮ GameFi: $MAVIA, $RON, $GALA, #BIGTIME, $ALICE, $MAGIC, $WILD, $SIDUS
➮ RWA: $SNX, $MKR, $CFG, $RBN, $POLYX
➮ L2: #STRK, #ARB, #METIS, #BOBA, #IMX
➮ BRC-20: $SAVM, #MUBI, #ORDI
➮ Modular: #TIA, #DYM, #GEL
Restaking : #RSTK, #EIGEN
Derivatives : #MCB, #AEVO, #DYDX
#Write2Earn

71
9
205
443.3k
PINNED

Article
Finding New CoinsSome of the craziest returns of 5X, 10X, 50X, or even more are achieved by people who find new coins early on-chain and hold them as they explode in growth. Here’s how you can start researching and finding these coins for yourself 👇🏼 Finding New Coins:There are a few key metrics to look at to determine how early you are to a coin:-Market Cap:This is the most important metric to check as it directly affects how much room for future growth a coin has. With new high risk / high reward coins, you are going to be looking for gains of multiple Xs. If a coin is at a market cap of $500k then it can 20X and still only be at a market cap of $10M. However, if a coin is already at a market cap of $2M then reaching that same $10M market cap target would be a 5X. What market cap range you look for when deciding whether to buy a coin or when to take profit depends on your personal view of the potential of the coin. If you find a project with real utility in a sector of crypto with a lot of demand, or a project that offers improvements over existing products/services then you may aim for higher. On the other hand, if you were just lucky to be early to a coin taking advantage of a short term source of hype then you may want to take profits on the way up rather than hold longer term.-Liquidity:Most new coins do not launch with significant liquidity. If you are working with less capital then this can actually be an advantage for you in some cases. When a coin has lower liquidity, it means that large buys/sells will move price more. It also means that volatility will generally be greater as it takes less volume to move price significantly. If a coin has real potential but low liquidity, then entering with a small amount can allow you to be early without suffering too much from slippage. Then, if the coin takes off, liquidity can improve as more is added or it gets listed on more exchanges (centralized or decentralized) which can allow larger players to then buy as well.-Holders:You can check on-chain how many holders a coin has. Clearly, the lower the number of holders is, the earlier you are.-Age:You can also check on-chain to see when the smart contract for a coin was deployed and when it was first listed on a decentralized exchange to determine exactly how new a project is.Strategy:The easiest way to start scanning new coins and checking the characteristics I just covered is through DexScreener. Very new coins won’t always be listed on CoinGecko or CoinMarketCap yet, but DexScreener lists coins as soon as they are added to a dex. It also displays price, market cap, volume, liquidity, FDV, and other metrics to make it easy to decide which coins to give a deeper look. You can also filter all the new coins by characteristics such as age, liquidity, what chain they are on, price change, and more. There are a few reasons a coin may catch your attention: large number of trades being taken, large price increases, significant liquidity being added early on, or even just the name of the coin. Regardless, once you see a coin you want to learn more about you can click on it to open the chart and see more details. Here’s what to check next:-Name/Contract Address:You can search the name and/or contract address of a coin on twitter and do a quick scan for any red flags or or positive signs. Red flags would include credible information that the coin may be a scam/rug or that the team/dev is dumping early on. Positive signs could include an active twitter page for the project, a community around it, or traders with strong track records following/mentioning it.-Holders/Liquidity Providers:If one or a few addresses hold a significant portion of a coin’s supply it is worth figuring out why. One of the larger holders will usually be the liquidity pool for the dex, but it is also possible that a team/dev reserved a large portion of the tokens for themselves. It is a good sign if the LP tokens for the pool and any team/dev allocations are locked at least for a fair period of time as this incentivizes them to grow the project and removes concerns about immediate dumping. Another reason an address may hold a large portion of the supply is if they were extremely early or sniped the token launch to buy a lot of coins for very cheap. If this is the case, they will almost always dump the tokens at some point. However, if the project has real potential then that dump could provide a good entry.Risk Management:It is absolutely essential to practice strong risk management when trading new coins. It is completely possible for a new coin to go to 0 and for your investment to end up worthless. That is the risk you take in exchange for the potentially massive rewards. However, if you implement risk management procedures then you can lower that risk.-Portfolio Allocation:You should not be risking any amount you are not willing to lose on new coins. Even if a new coin does end up going 10X or more, it is very common for there to be corrections of -50% or more during that uptrend due to the extreme volatility of microcap coins. If you are overinvested then these corrections could cause you to panic sell and miss out on the subsequent gains. On the other hand, if you are comfortable with the amount you invested then you will be able to remain calm and hold through the volatility.-Taking Profits:So you did the research, found a promising coin early on, and have made some crazy returns … don’t be scared to take profits if the amount you made is significant to you personally. It is very easy to see someone else on twitter making a 6 figure trade or holding a memecoin for 1000X and feel like your own gains are small in comparison. Unfortunately, this has led to many people refusing to take profits and giving back life-changing profits. Don’t let that happen to you. You can always take at least partial profits and continue holding some coins in case the uptrend continues.
Finding New Coins
Some of the craziest returns of 5X, 10X, 50X, or even more are achieved by people who find new coins early on-chain and hold them as they explode in growth. Here’s how you can start researching and finding these coins for yourself 👇🏼 Finding New Coins:There are a few key metrics to look at to determine how early you are to a coin:-Market Cap:This is the most important metric to check as it directly affects how much room for future growth a coin has. With new high risk / high reward coins, you are going to be looking for gains of multiple Xs. If a coin is at a market cap of $500k then it can 20X and still only be at a market cap of $10M. However, if a coin is already at a market cap of $2M then reaching that same $10M market cap target would be a 5X. What market cap range you look for when deciding whether to buy a coin or when to take profit depends on your personal view of the potential of the coin. If you find a project with real utility in a sector of crypto with a lot of demand, or a project that offers improvements over existing products/services then you may aim for higher. On the other hand, if you were just lucky to be early to a coin taking advantage of a short term source of hype then you may want to take profits on the way up rather than hold longer term.-Liquidity:Most new coins do not launch with significant liquidity. If you are working with less capital then this can actually be an advantage for you in some cases. When a coin has lower liquidity, it means that large buys/sells will move price more. It also means that volatility will generally be greater as it takes less volume to move price significantly. If a coin has real potential but low liquidity, then entering with a small amount can allow you to be early without suffering too much from slippage. Then, if the coin takes off, liquidity can improve as more is added or it gets listed on more exchanges (centralized or decentralized) which can allow larger players to then buy as well.-Holders:You can check on-chain how many holders a coin has. Clearly, the lower the number of holders is, the earlier you are.-Age:You can also check on-chain to see when the smart contract for a coin was deployed and when it was first listed on a decentralized exchange to determine exactly how new a project is.Strategy:The easiest way to start scanning new coins and checking the characteristics I just covered is through DexScreener. Very new coins won’t always be listed on CoinGecko or CoinMarketCap yet, but DexScreener lists coins as soon as they are added to a dex. It also displays price, market cap, volume, liquidity, FDV, and other metrics to make it easy to decide which coins to give a deeper look. You can also filter all the new coins by characteristics such as age, liquidity, what chain they are on, price change, and more. There are a few reasons a coin may catch your attention: large number of trades being taken, large price increases, significant liquidity being added early on, or even just the name of the coin. Regardless, once you see a coin you want to learn more about you can click on it to open the chart and see more details. Here’s what to check next:-Name/Contract Address:You can search the name and/or contract address of a coin on twitter and do a quick scan for any red flags or or positive signs. Red flags would include credible information that the coin may be a scam/rug or that the team/dev is dumping early on. Positive signs could include an active twitter page for the project, a community around it, or traders with strong track records following/mentioning it.-Holders/Liquidity Providers:If one or a few addresses hold a significant portion of a coin’s supply it is worth figuring out why. One of the larger holders will usually be the liquidity pool for the dex, but it is also possible that a team/dev reserved a large portion of the tokens for themselves. It is a good sign if the LP tokens for the pool and any team/dev allocations are locked at least for a fair period of time as this incentivizes them to grow the project and removes concerns about immediate dumping. Another reason an address may hold a large portion of the supply is if they were extremely early or sniped the token launch to buy a lot of coins for very cheap. If this is the case, they will almost always dump the tokens at some point. However, if the project has real potential then that dump could provide a good entry.Risk Management:It is absolutely essential to practice strong risk management when trading new coins. It is completely possible for a new coin to go to 0 and for your investment to end up worthless. That is the risk you take in exchange for the potentially massive rewards. However, if you implement risk management procedures then you can lower that risk.-Portfolio Allocation:You should not be risking any amount you are not willing to lose on new coins. Even if a new coin does end up going 10X or more, it is very common for there to be corrections of -50% or more during that uptrend due to the extreme volatility of microcap coins. If you are overinvested then these corrections could cause you to panic sell and miss out on the subsequent gains. On the other hand, if you are comfortable with the amount you invested then you will be able to remain calm and hold through the volatility.-Taking Profits:So you did the research, found a promising coin early on, and have made some crazy returns … don’t be scared to take profits if the amount you made is significant to you personally. It is very easy to see someone else on twitter making a 6 figure trade or holding a memecoin for 1000X and feel like your own gains are small in comparison. Unfortunately, this has led to many people refusing to take profits and giving back life-changing profits. Don’t let that happen to you. You can always take at least partial profits and continue holding some coins in case the uptrend continues.
17
12
98
35.5k
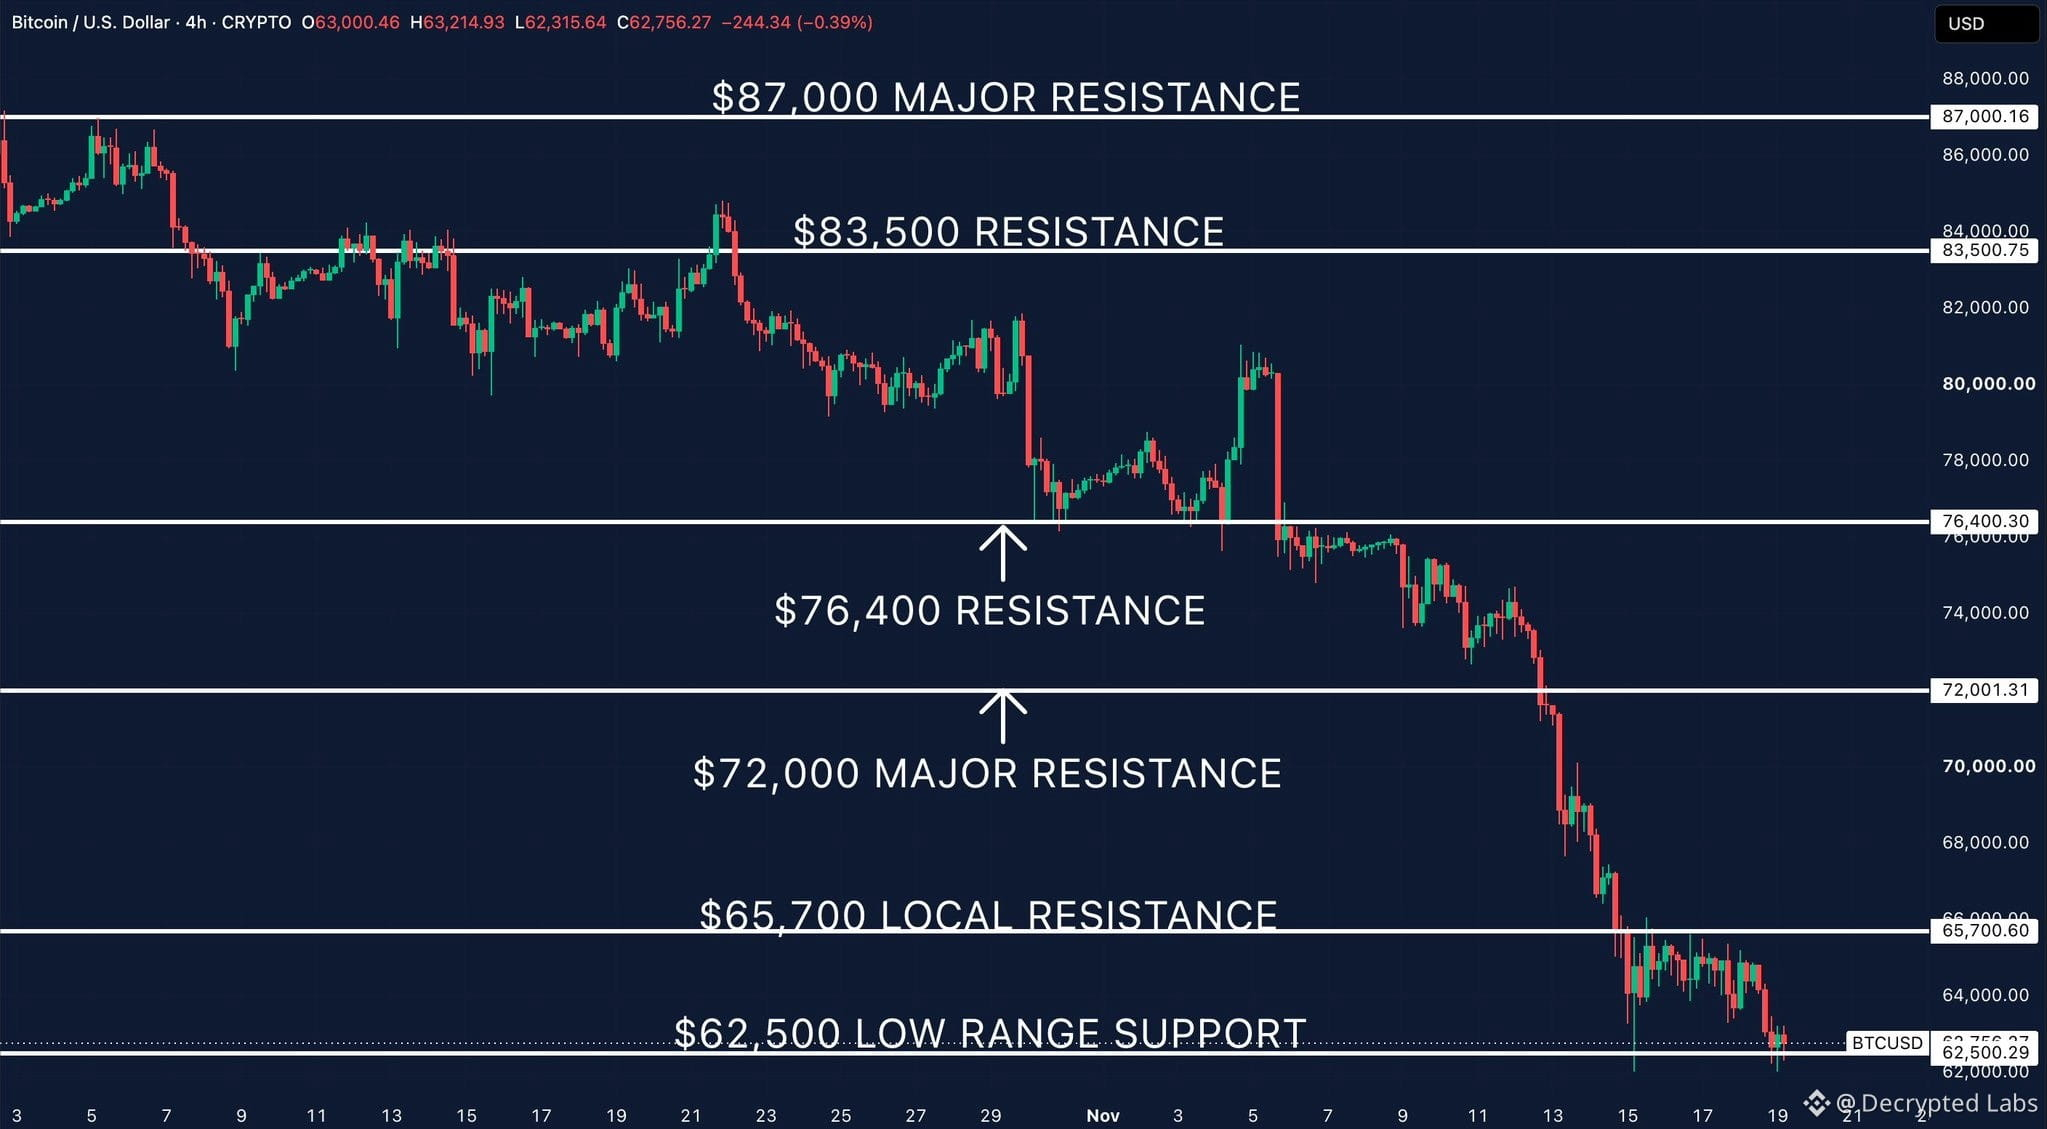
Bitcoin has now fallen to $62,500.
And the 4H chart is starting to look increasingly uncomfortable for bulls.
We've seen a series of lower highs and lower lows, with every attempted recovery failing to regain meaningful ground.
The $65,700 level has been lost, followed by $62,500, which was the lower boundary of the previous trading range.
Here's what I'm looking at now:
$62,500 is the immediate level Bitcoin needs to reclaim. Losing it on a confirmed 4H close would leave the door open to further downside.
$65,700 is the first major hurdle on any recovery.
$72,000 is the next important resistance above that.
The bigger picture is difficult to ignore.
Bitcoin has fallen from around $87,000 to the $62,500 region, and buyers have yet to demonstrate a convincing change in momentum.
I wouldn't be rushing to call a bottom here.
I want to see Bitcoin reclaim lost levels, hold them, and start forming higher lows before becoming more constructive.
Until then, the trend is still pointing down.
#BTCRemainsUnderPressureAfterHawkishFOMCMinutes #
Bitcoin has now fallen to $62,500.
And the 4H chart is starting to look increasingly uncomfortable for bulls.
We've seen a series of lower highs and lower lows, with every attempted recovery failing to regain meaningful ground.
The $65,700 level has been lost, followed by $62,500, which was the lower boundary of the previous trading range.
Here's what I'm looking at now:
$62,500 is the immediate level Bitcoin needs to reclaim. Losing it on a confirmed 4H close would leave the door open to further downside.
$65,700 is the first major hurdle on any recovery.
$72,000 is the next important resistance above that.
The bigger picture is difficult to ignore.
Bitcoin has fallen from around $87,000 to the $62,500 region, and buyers have yet to demonstrate a convincing change in momentum.
I wouldn't be rushing to call a bottom here.
I want to see Bitcoin reclaim lost levels, hold them, and start forming higher lows before becoming more constructive.
Until then, the trend is still pointing down.
#BTCRemainsUnderPressureAfterHawkishFOMCMinutes #
And the 4H chart is starting to look increasingly uncomfortable for bulls.
We've seen a series of lower highs and lower lows, with every attempted recovery failing to regain meaningful ground.
The $65,700 level has been lost, followed by $62,500, which was the lower boundary of the previous trading range.
Here's what I'm looking at now:
$62,500 is the immediate level Bitcoin needs to reclaim. Losing it on a confirmed 4H close would leave the door open to further downside.
$65,700 is the first major hurdle on any recovery.
$72,000 is the next important resistance above that.
The bigger picture is difficult to ignore.
Bitcoin has fallen from around $87,000 to the $62,500 region, and buyers have yet to demonstrate a convincing change in momentum.
I wouldn't be rushing to call a bottom here.
I want to see Bitcoin reclaim lost levels, hold them, and start forming higher lows before becoming more constructive.
Until then, the trend is still pointing down.
#BTCRemainsUnderPressureAfterHawkishFOMCMinutes #
89
🚨 WHAT THE ACTUAL ****
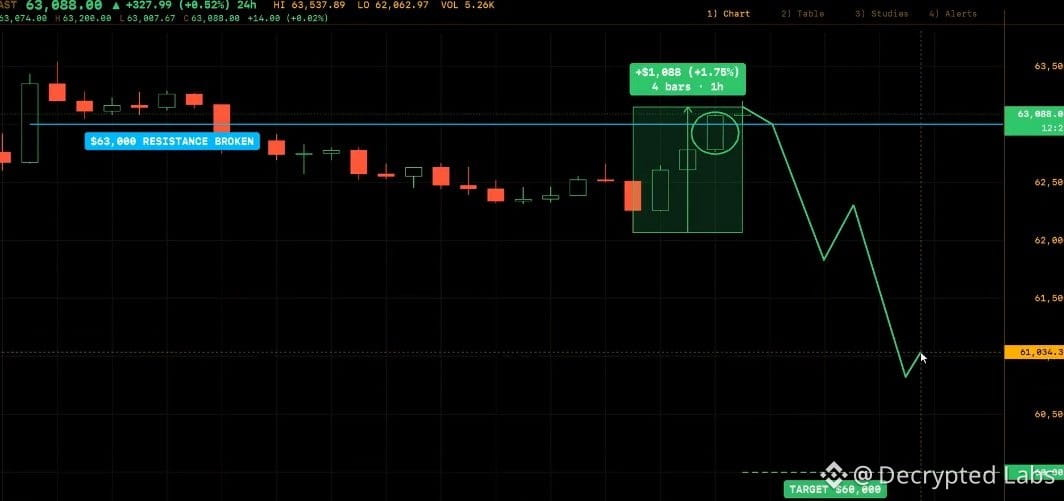
THIS IS EXACTLY WHAT THE CHART WARNED ABOUT.
$BTC was setting up for one FINAL Bull Trap before the real dump.
Now Bitcoin just jumped +$1,088 in about an hour and reclaimed $63,000.
Over $380 MILLION in $BTC market buys hit Binance futures in 60 minutes.
The roadmap:
$62K → $63K → $60K
We are now entering the exact $63K area to watch.
Everyone will see this pump and think the bull run is back.
I see the trap I’ve been waiting for.
My plan hasn't changed.
Enjoy the squeeze.
The REAL move comes next.
🚨 WHAT THE ACTUAL ****
THIS IS EXACTLY WHAT THE CHART WARNED ABOUT.
$BTC was setting up for one FINAL Bull Trap before the real dump.
Now Bitcoin just jumped +$1,088 in about an hour and reclaimed $63,000.
Over $380 MILLION in $BTC market buys hit Binance futures in 60 minutes.
The roadmap:
$62K → $63K → $60K
We are now entering the exact $63K area to watch.
Everyone will see this pump and think the bull run is back.
I see the trap I’ve been waiting for.
My plan hasn't changed.
Enjoy the squeeze.
The REAL move comes next.
THIS IS EXACTLY WHAT THE CHART WARNED ABOUT.
$BTC was setting up for one FINAL Bull Trap before the real dump.
Now Bitcoin just jumped +$1,088 in about an hour and reclaimed $63,000.
Over $380 MILLION in $BTC market buys hit Binance futures in 60 minutes.
The roadmap:
$62K → $63K → $60K
We are now entering the exact $63K area to watch.
Everyone will see this pump and think the bull run is back.
I see the trap I’ve been waiting for.
My plan hasn't changed.
Enjoy the squeeze.
The REAL move comes next.
192
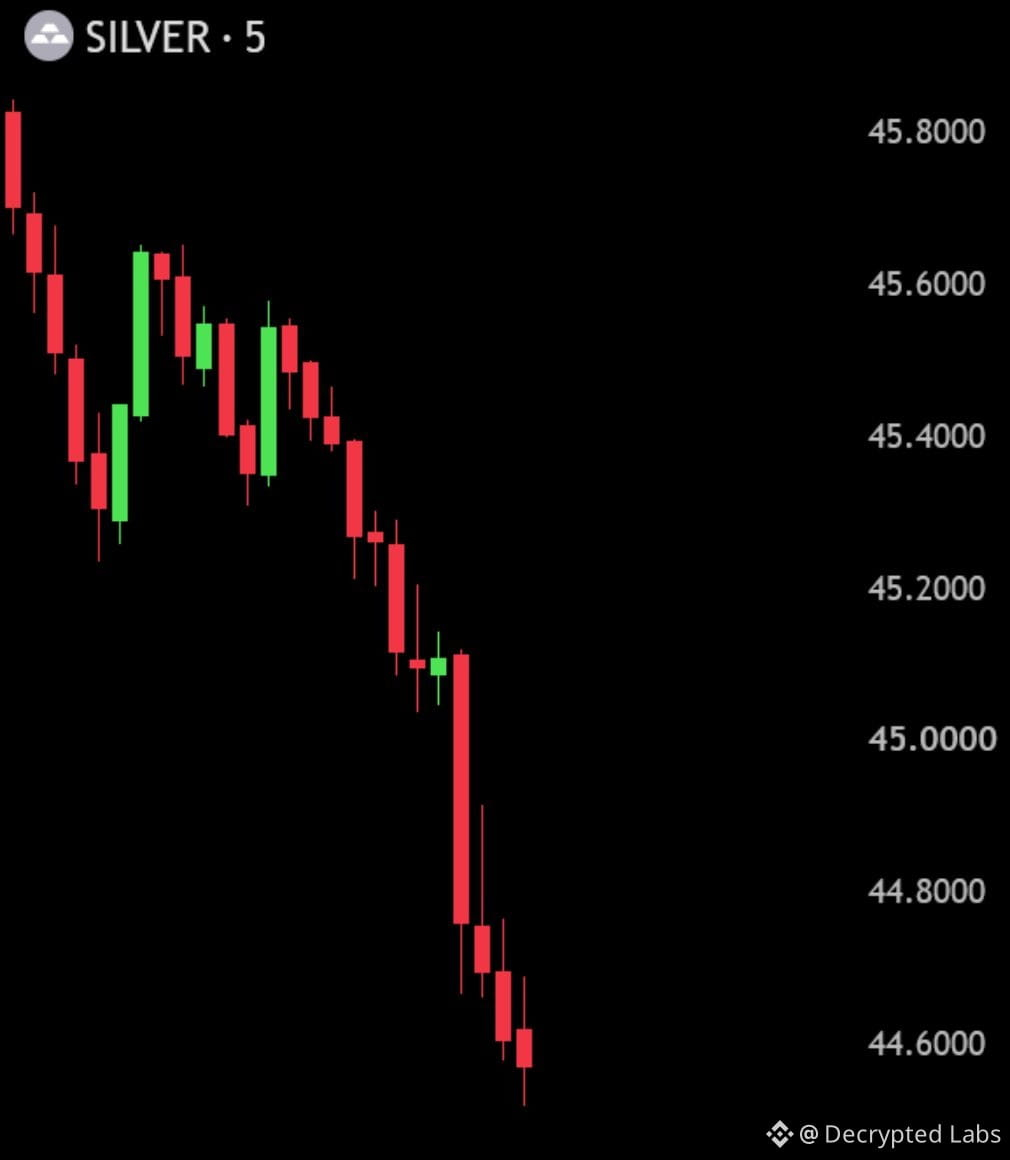
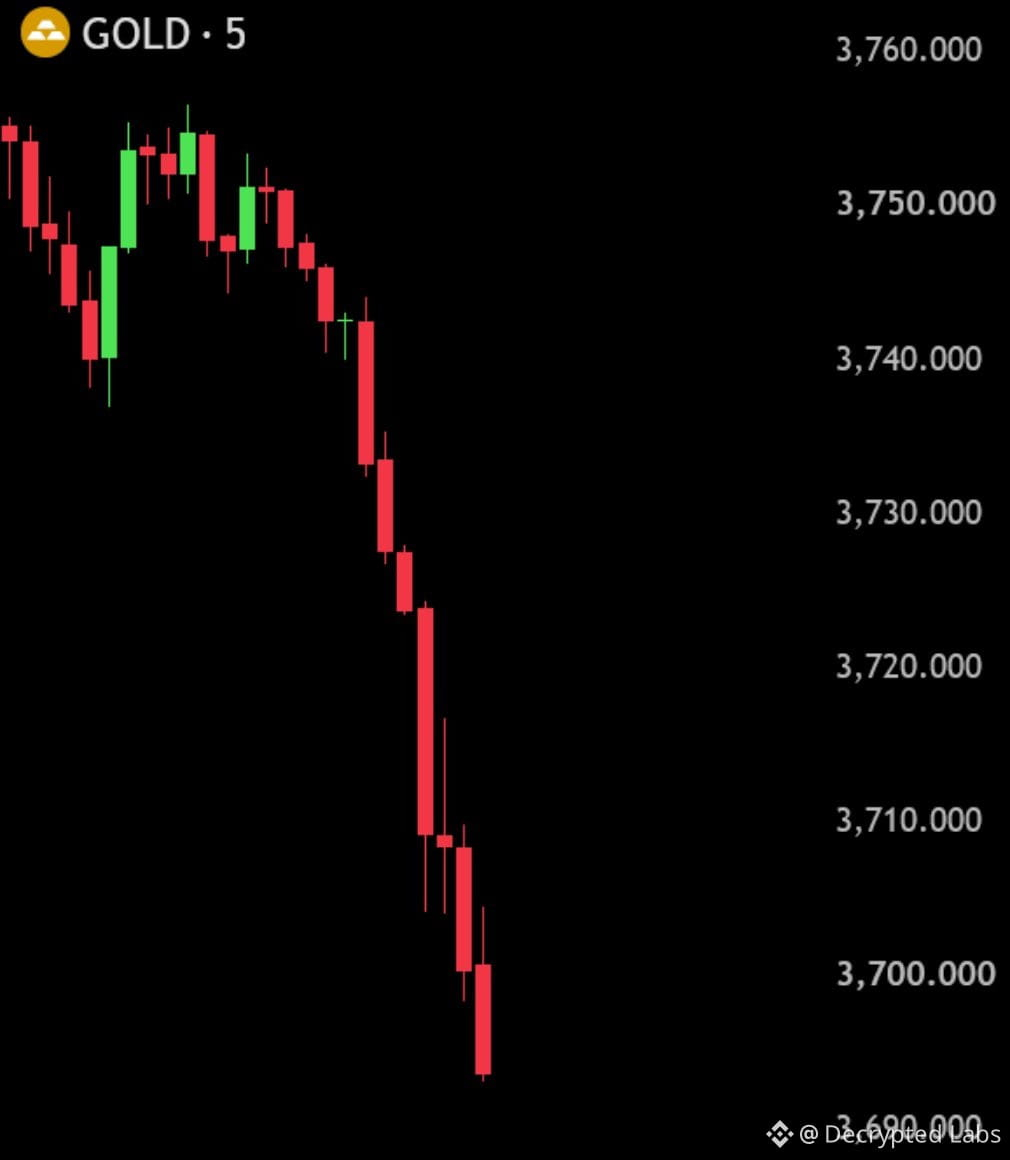
🚨 GOLD and SILVER ARE COLLAPSING
$470,000,000,000 wiped out from Gold and Silver in just 60 mins.
🚨 GOLD and SILVER ARE COLLAPSING
$470,000,000,000 wiped out from Gold and Silver in just 60 mins.
$470,000,000,000 wiped out from Gold and Silver in just 60 mins.
132
SELL INDICATORS.
Cut losses at 7%–8% below your buy price.
Buying extended stocks leads to frequent shakeouts.
SELL INDICATORS
Watch earnings, price action, industry strength, profitability, and volume.
These are the same factors used when buying.
Sell if earnings growth slows or falls below average.
Avoid stocks with EPS ratings below 70.
Strong stocks outperform 80% of the market.
Sell when relative strength trends down.
Avoid stocks with RS ratings below 70.
Leaders come from strong industry groups.
Sell stocks in lagging industries.
Look for high margins and strong ROE.
Sell when profitability drops below average.
Institutions should be accumulating, not selling.
Sell on signs of distribution.
TAKING PROFITS
Selling well is as important as buying well.
The best sells happen when stocks still look strong.
Sell on the second stock split in 12 months.
Sell if price rises but RS line lags.
Sell when price breaks below the 10-week line on heavy volume.
Sell after a fast 25%–50% run in 1–2 weeks.
Sell when earnings growth decelerates.
Sell when most leaders in the group top.
Sell on weak-volume breakouts.
Sell after a long run and a price gap up.
Sell when the general market tops.
Sell on repeated heavy-volume declines.
Sell on the fourth base breakout.
Sell when everyone is excited.
Sell your weakest stocks first.
SELL INDICATORS.
Cut losses at 7%–8% below your buy price.
Buying extended stocks leads to frequent shakeouts.
SELL INDICATORS
Watch earnings, price action, industry strength, profitability, and volume.
These are the same factors used when buying.
Sell if earnings growth slows or falls below average.
Avoid stocks with EPS ratings below 70.
Strong stocks outperform 80% of the market.
Sell when relative strength trends down.
Avoid stocks with RS ratings below 70.
Leaders come from strong industry groups.
Sell stocks in lagging industries.
Look for high margins and strong ROE.
Sell when profitability drops below average.
Institutions should be accumulating, not selling.
Sell on signs of distribution.
TAKING PROFITS
Selling well is as important as buying well.
The best sells happen when stocks still look strong.
Sell on the second stock split in 12 months.
Sell if price rises but RS line lags.
Sell when price breaks below the 10-week line on heavy volume.
Sell after a fast 25%–50% run in 1–2 weeks.
Sell when earnings growth decelerates.
Sell when most leaders in the group top.
Sell on weak-volume breakouts.
Sell after a long run and a price gap up.
Sell when the general market tops.
Sell on repeated heavy-volume declines.
Sell on the fourth base breakout.
Sell when everyone is excited.
Sell your weakest stocks first.
Cut losses at 7%–8% below your buy price.
Buying extended stocks leads to frequent shakeouts.
SELL INDICATORS
Watch earnings, price action, industry strength, profitability, and volume.
These are the same factors used when buying.
Sell if earnings growth slows or falls below average.
Avoid stocks with EPS ratings below 70.
Strong stocks outperform 80% of the market.
Sell when relative strength trends down.
Avoid stocks with RS ratings below 70.
Leaders come from strong industry groups.
Sell stocks in lagging industries.
Look for high margins and strong ROE.
Sell when profitability drops below average.
Institutions should be accumulating, not selling.
Sell on signs of distribution.
TAKING PROFITS
Selling well is as important as buying well.
The best sells happen when stocks still look strong.
Sell on the second stock split in 12 months.
Sell if price rises but RS line lags.
Sell when price breaks below the 10-week line on heavy volume.
Sell after a fast 25%–50% run in 1–2 weeks.
Sell when earnings growth decelerates.
Sell when most leaders in the group top.
Sell on weak-volume breakouts.
Sell after a long run and a price gap up.
Sell when the general market tops.
Sell on repeated heavy-volume declines.
Sell on the fourth base breakout.
Sell when everyone is excited.
Sell your weakest stocks first.
1
1
245
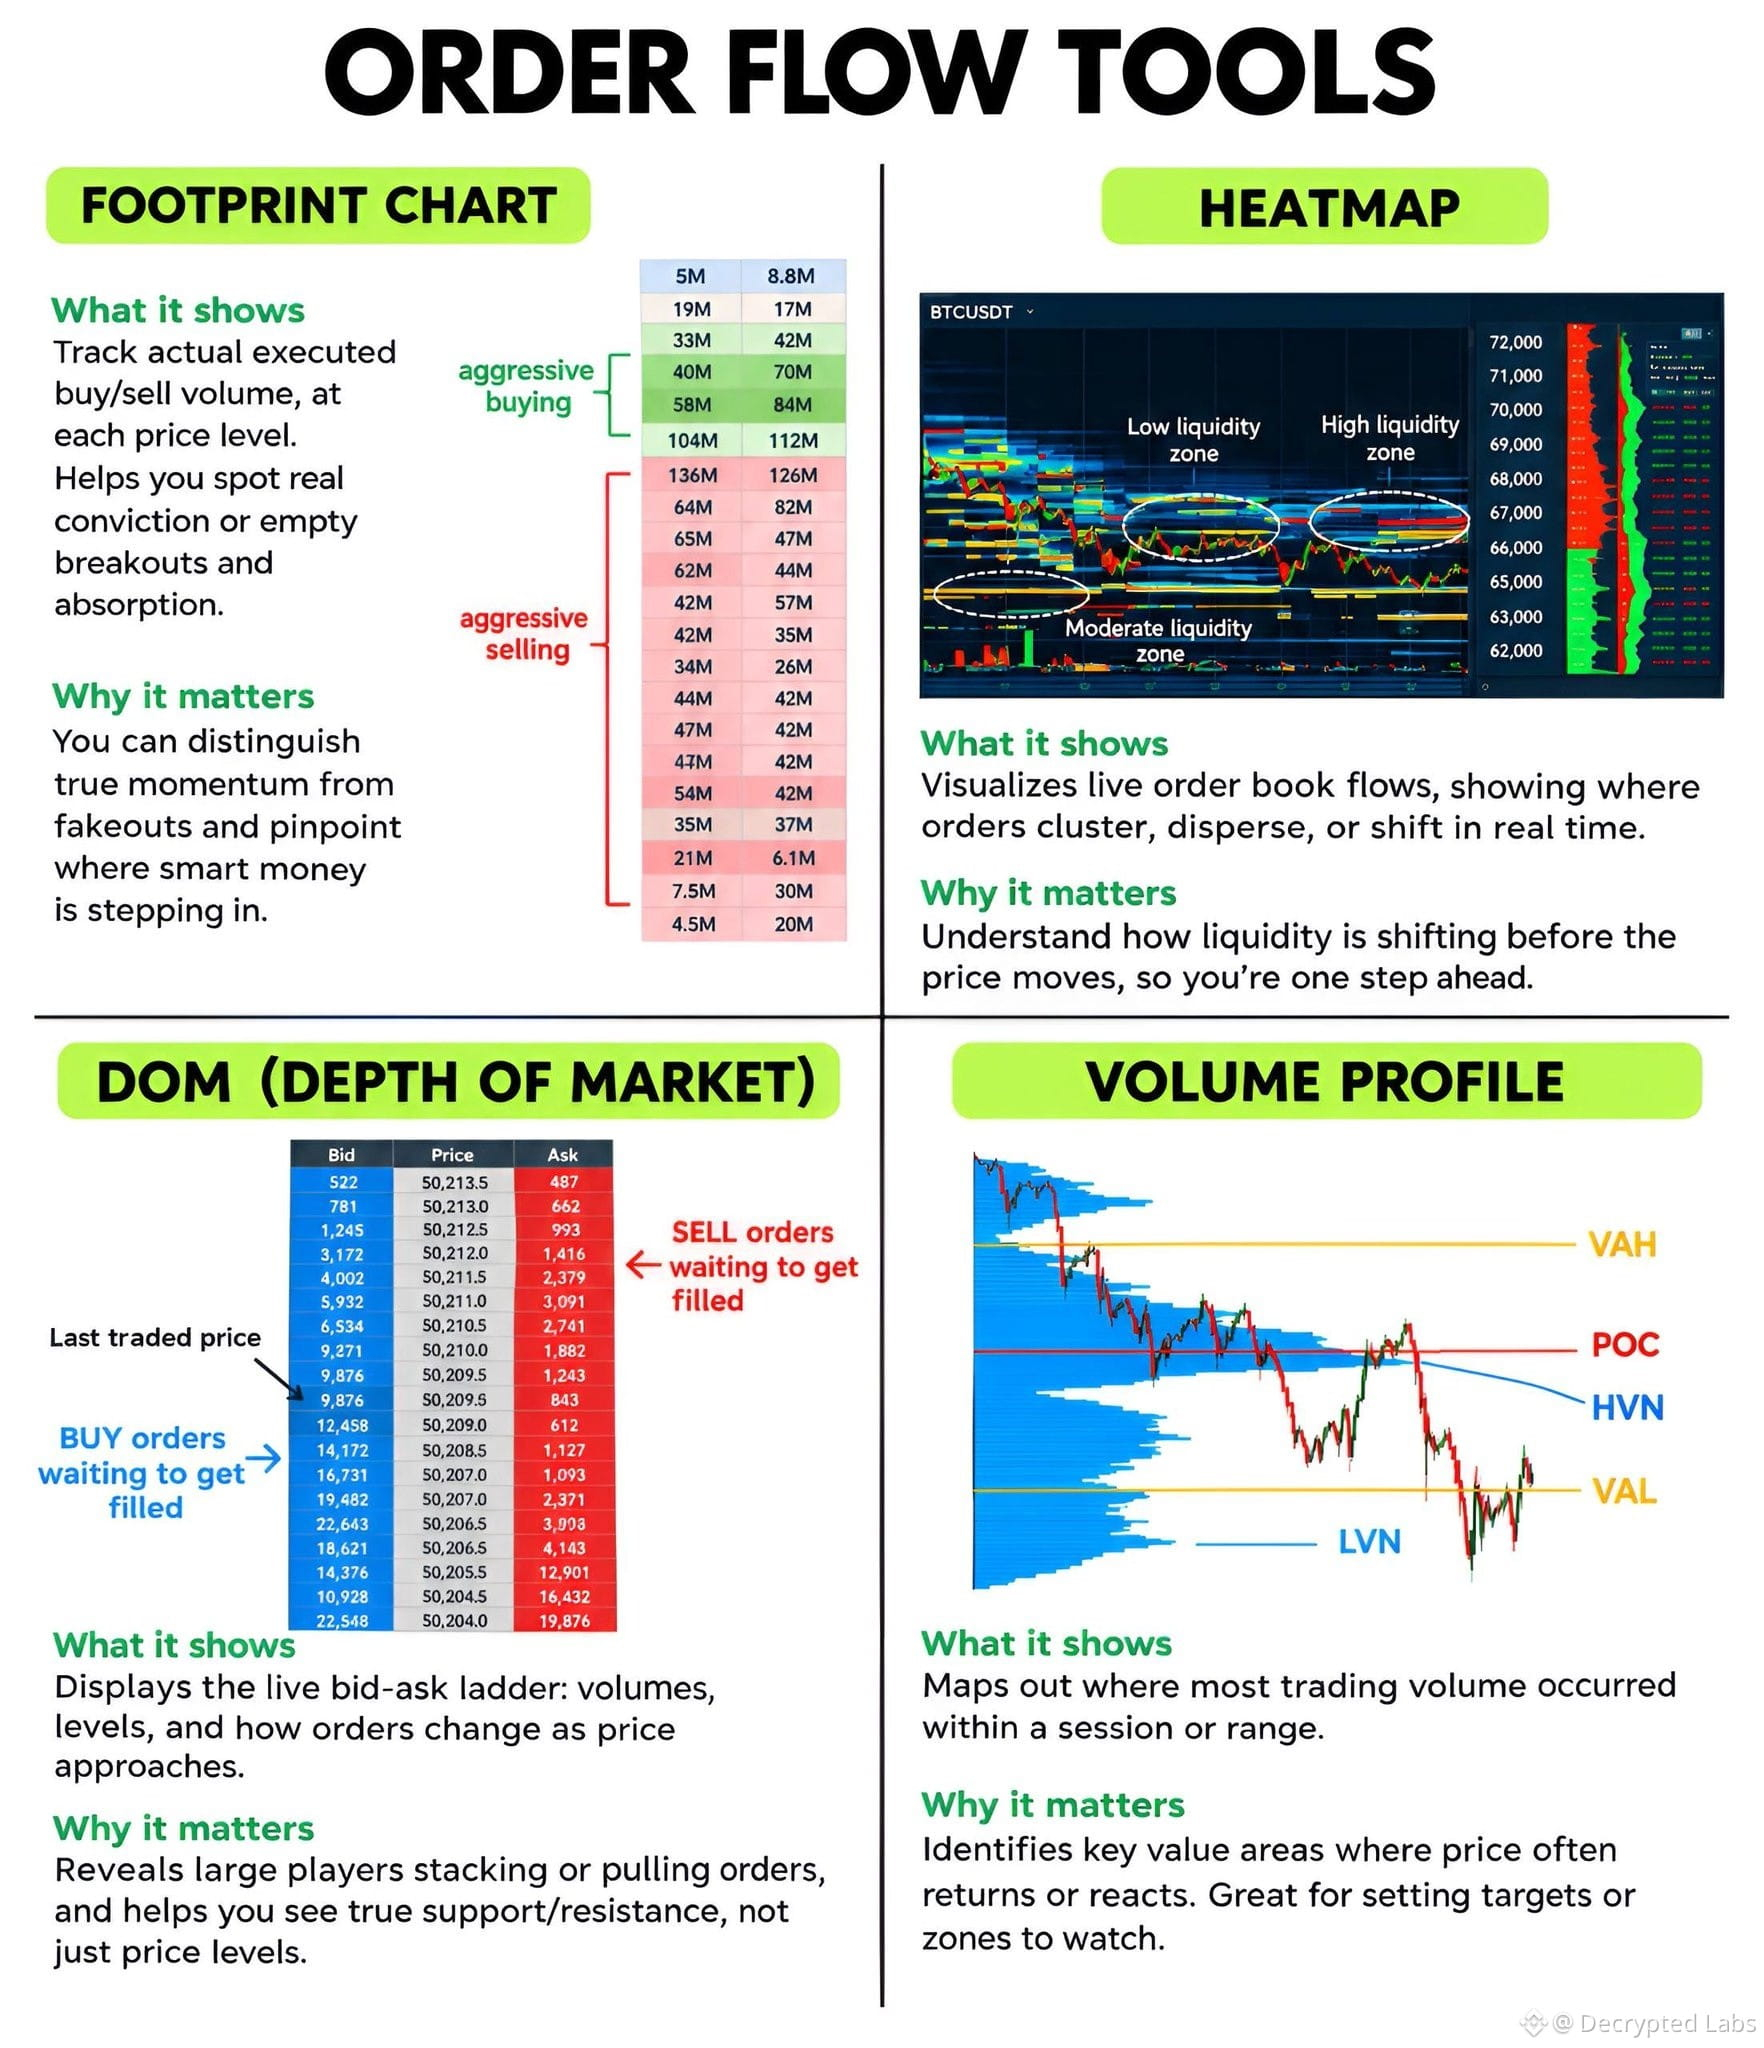
Order Flow Tools
1. Footprint chart
2. Heatmap
3. DOM
4. Volume profile
Which one do you use the most?
Order Flow Tools
1. Footprint chart
2. Heatmap
3. DOM
4. Volume profile
Which one do you use the most?
1. Footprint chart
2. Heatmap
3. DOM
4. Volume profile
Which one do you use the most?
2
361
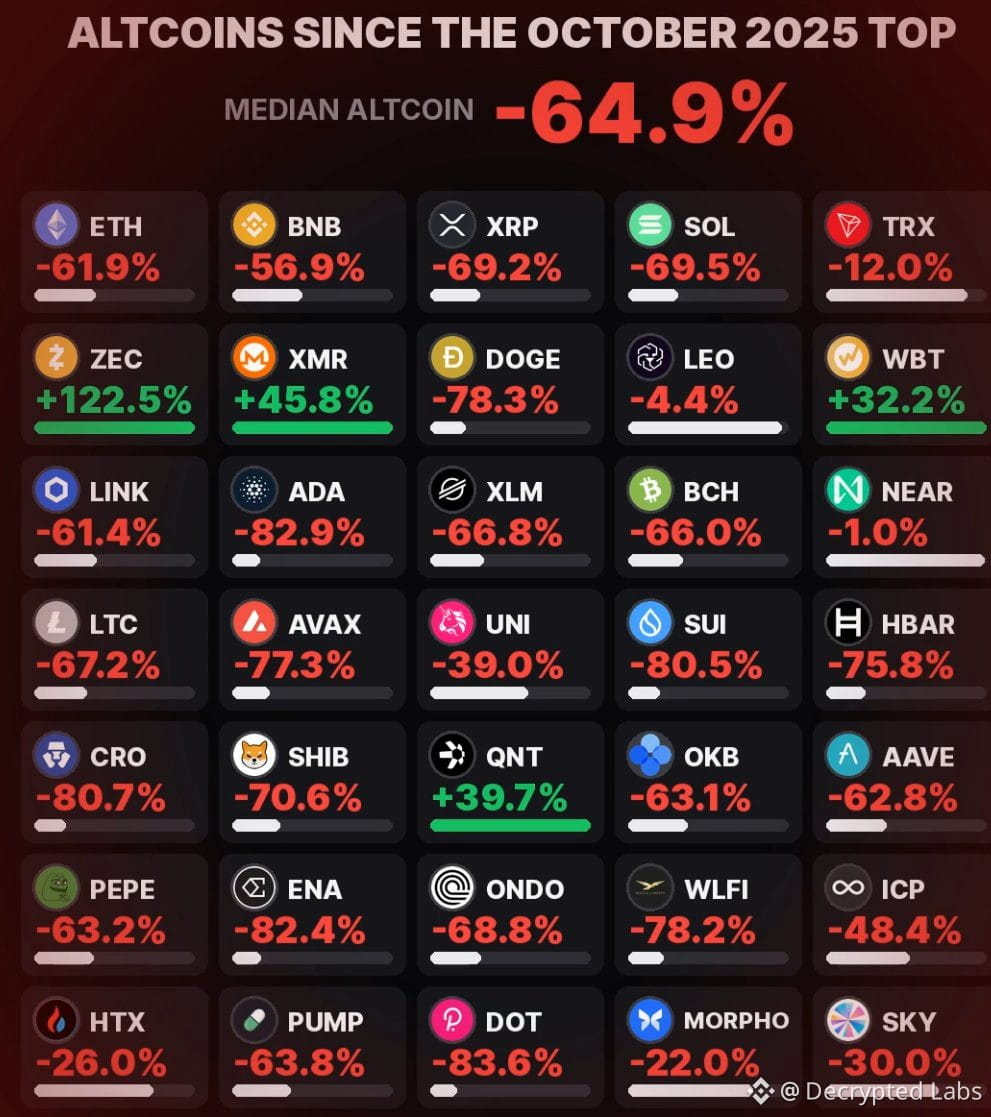
Altcoins are in a full-blown crisis.
Since the October 2025 top:
Polkadot: -83.6%
Cardano: -82.9%
Sui: -80.5%
Dogecoin: -78.3%
Avalanche: -77.3%
Solana: -69.5%
XRP: -69.2%
Ethereum: -61.9%
27 of the top 40 altcoins have lost more than 50% of their value.
Even Bitcoin is down 49%, and alts are bleeding far worse.
Altcoins are in a full-blown crisis.
Since the October 2025 top:
Polkadot: -83.6%
Cardano: -82.9%
Sui: -80.5%
Dogecoin: -78.3%
Avalanche: -77.3%
Solana: -69.5%
XRP: -69.2%
Ethereum: -61.9%
27 of the top 40 altcoins have lost more than 50% of their value.
Even Bitcoin is down 49%, and alts are bleeding far worse.
Since the October 2025 top:
Polkadot: -83.6%
Cardano: -82.9%
Sui: -80.5%
Dogecoin: -78.3%
Avalanche: -77.3%
Solana: -69.5%
XRP: -69.2%
Ethereum: -61.9%
27 of the top 40 altcoins have lost more than 50% of their value.
Even Bitcoin is down 49%, and alts are bleeding far worse.
1
222
🚨 SOMETHING VERY STRANGE JUST HAPPENED TO BITCOIN.
And almost nobody is talking about the REAL reason.
$BTC crashed to $62K.
-12% in a SINGLE DAY.
Over $4 BILLION liquidated on Binance in 24 hours.
Right after a black swan hack.
Right when leverage was stacked.
And right as billions are being pulled out of Bitcoin ETFs.
THIS WAS NOT A NORMAL DUMP.
Everyone is panicking.
But nobody is asking the most important question:
WHO JUST GOT PAID?
Because look at what happened at the exact same time:
→ Binance hack
→ $4B+ in liquidations
→ $1.9B leaving Bitcoin ETFs
→ Another Fed hike getting priced in
→ Capital rotating toward the Anthropic IPO
All at once.
Coincidence?
No.
It’s market mechanics.
The hack was the trigger.
Leverage was the fuel.
And the liquidation machine did the rest.
Forced liquidations at this scale do one thing:
They create MASSIVE forced order flow.
And eventually traders aren’t selling because they WANT to.
They’re selling because they HAVE to.
That’s how BTC goes from a normal correction to $62K almost overnight.
And here’s the part almost everyone is missing:
More than half of the hack losses just got offset by the liquidation machine.
At the SAME TIME, liquidity is leaving crypto elsewhere.
U.S. spot Bitcoin ETFs saw roughly $1.9 BILLION in outflows over seven trading sessions.
And CZ just pointed to another possible reason:
ANTHROPIC.
One of the biggest IPOs in the world is approaching.
Funds need cash.
Institutions need allocation.
And when enormous new deals need funding...
That money has to come from somewhere.
We’ve seen this movie before.
Remember October 10th?
But do NOT confuse a liquidity flush with the end of the cycle.
Bull markets don’t die from a single hack.
They reset. They clean the book.
And they go higher.
The bloodbath is almost over.
And the next move belongs to whoever was buying while everyone else was being FORCED to sell.
Reminder: I’ve called every major market top and bottom for the last 15 years, including Bitcoin at $16,000 and the top at $126,000.
🚨 SOMETHING VERY STRANGE JUST HAPPENED TO BITCOIN.
And almost nobody is talking about the REAL reason.
$BTC crashed to $62K.
-12% in a SINGLE DAY.
Over $4 BILLION liquidated on Binance in 24 hours.
Right after a black swan hack.
Right when leverage was stacked.
And right as billions are being pulled out of Bitcoin ETFs.
THIS WAS NOT A NORMAL DUMP.
Everyone is panicking.
But nobody is asking the most important question:
WHO JUST GOT PAID?
Because look at what happened at the exact same time:
→ Binance hack
→ $4B+ in liquidations
→ $1.9B leaving Bitcoin ETFs
→ Another Fed hike getting priced in
→ Capital rotating toward the Anthropic IPO
All at once.
Coincidence?
No.
It’s market mechanics.
The hack was the trigger.
Leverage was the fuel.
And the liquidation machine did the rest.
Forced liquidations at this scale do one thing:
They create MASSIVE forced order flow.
And eventually traders aren’t selling because they WANT to.
They’re selling because they HAVE to.
That’s how BTC goes from a normal correction to $62K almost overnight.
And here’s the part almost everyone is missing:
More than half of the hack losses just got offset by the liquidation machine.
At the SAME TIME, liquidity is leaving crypto elsewhere.
U.S. spot Bitcoin ETFs saw roughly $1.9 BILLION in outflows over seven trading sessions.
And CZ just pointed to another possible reason:
ANTHROPIC.
One of the biggest IPOs in the world is approaching.
Funds need cash.
Institutions need allocation.
And when enormous new deals need funding...
That money has to come from somewhere.
We’ve seen this movie before.
Remember October 10th?
But do NOT confuse a liquidity flush with the end of the cycle.
Bull markets don’t die from a single hack.
They reset. They clean the book.
And they go higher.
The bloodbath is almost over.
And the next move belongs to whoever was buying while everyone else was being FORCED to sell.
Reminder: I’ve called every major market top and bottom for the last 15 years, including Bitcoin at $16,000 and the top at $126,000.
And almost nobody is talking about the REAL reason.
$BTC crashed to $62K.
-12% in a SINGLE DAY.
Over $4 BILLION liquidated on Binance in 24 hours.
Right after a black swan hack.
Right when leverage was stacked.
And right as billions are being pulled out of Bitcoin ETFs.
THIS WAS NOT A NORMAL DUMP.
Everyone is panicking.
But nobody is asking the most important question:
WHO JUST GOT PAID?
Because look at what happened at the exact same time:
→ Binance hack
→ $4B+ in liquidations
→ $1.9B leaving Bitcoin ETFs
→ Another Fed hike getting priced in
→ Capital rotating toward the Anthropic IPO
All at once.
Coincidence?
No.
It’s market mechanics.
The hack was the trigger.
Leverage was the fuel.
And the liquidation machine did the rest.
Forced liquidations at this scale do one thing:
They create MASSIVE forced order flow.
And eventually traders aren’t selling because they WANT to.
They’re selling because they HAVE to.
That’s how BTC goes from a normal correction to $62K almost overnight.
And here’s the part almost everyone is missing:
More than half of the hack losses just got offset by the liquidation machine.
At the SAME TIME, liquidity is leaving crypto elsewhere.
U.S. spot Bitcoin ETFs saw roughly $1.9 BILLION in outflows over seven trading sessions.
And CZ just pointed to another possible reason:
ANTHROPIC.
One of the biggest IPOs in the world is approaching.
Funds need cash.
Institutions need allocation.
And when enormous new deals need funding...
That money has to come from somewhere.
We’ve seen this movie before.
Remember October 10th?
But do NOT confuse a liquidity flush with the end of the cycle.
Bull markets don’t die from a single hack.
They reset. They clean the book.
And they go higher.
The bloodbath is almost over.
And the next move belongs to whoever was buying while everyone else was being FORCED to sell.
Reminder: I’ve called every major market top and bottom for the last 15 years, including Bitcoin at $16,000 and the top at $126,000.
5
1
23
29.8k
Partly True
Article
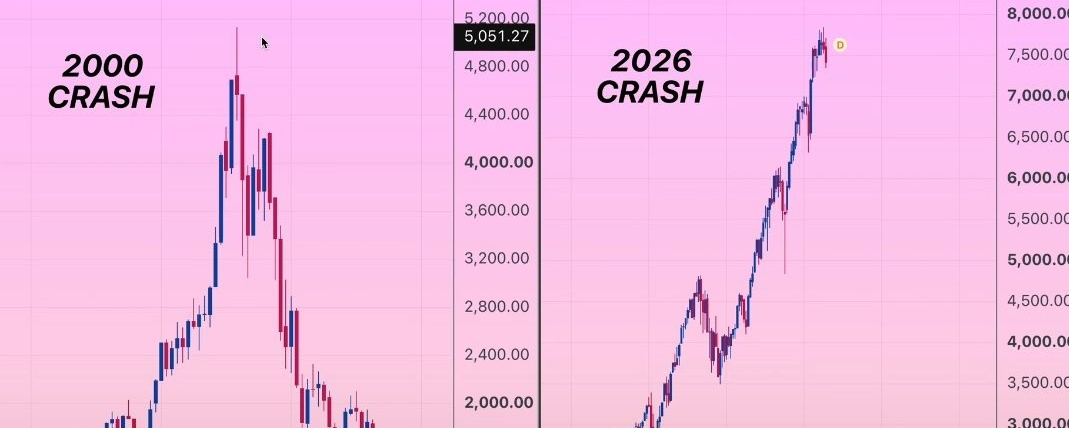
THE S&P 500 IS FLASHING THE SAME WARNING SIGNS AS THE 2000 DOT-COM BUBBLE.And I believe the next 48 hours could be CRITICAL for the entire stock market.
If you own stocks, Bitcoin or any risk assets, LOOK AT THIS CHART.
The similarities are getting seriously concerning.
In 2000, Wall Street looked unstoppable.
Stocks kept breaking records.
Investors believed the internet had changed everything.
Every dip was another buying opportunity.
UNTIL IT WASN'T.
What followed?
NASDAQ 100: -82.9%.
S&P 500: -49.1%.
Nearly 2.5 YEARS of destruction.
And here's what should worry investors today.
THE CURRENT S&P 500 STRUCTURE LOOKS DISTURBINGLY SIMILAR.
The breakout.
The overextension.
The crowded positioning.
The confidence that every correction will be bought.
Now look at the warning signs from the current setup:
→ NASDAQ 100: Down 12.5% from its October 6 peak.
→ NVIDIA: Down 33.7% ahead of its earnings announcement.
→ VIX: Up 11.6% in a single session.
→ S&P 500: Just 4.5% below its peak.
READ THAT AGAIN.
The broader market is still relatively close to its highs.
But some of the biggest technology names have already suffered much deeper declines.
And that divergence is exactly what I'm watching.
Because major market reversals don't always begin with everything crashing at once.
Sometimes the leaders weaken FIRST.
Then the rest of the market catches up.
NOW HERE'S THE PART MOST INVESTORS ARE IGNORING.
The historical 2000 comparison on this chart points toward approximately 3,976 on the S&P 500.
That's NOT my guaranteed target.
It's the downside scenario I'm monitoring if the historical pattern continues.
And there are THREE possible outcomes.
SCENARIO 1: THE RESET.
Volatility cools.
Selling pressure fades.
The market consolidates and eventually recovers.
SCENARIO 2: THE DEEP CORRECTION.
Major support levels break.
Institutional selling accelerates.
Technology stocks lead another leg lower.
Bitcoin and other speculative assets come under pressure.
SCENARIO 3: THE DOT-COM-STYLE COLLAPSE.
This is the scenario that concerns me MOST.
Confidence disappears.
Leveraged positions unwind.
Liquidity deteriorates.
And what started as an ordinary correction turns into a prolonged bear market.
BUT HERE'S THE KEY DIFFERENCE.
A similar-looking chart doesn't guarantee the same outcome.
Markets don't crash simply because two historical patterns resemble each other.
That's why I'm watching three things closely:
PRICE ACTION.
LIQUIDITY.
VOLATILITY.
If all three deteriorate together, the risk of a much deeper selloff becomes harder to ignore.
And the next 48 hours could provide important clues.
REMEMBER WHAT HAPPENED IN 2000.
The internet revolution was REAL.
The companies were changing the world.
But investors still lost fortunes because valuations had moved too far ahead of reality.
Now AI is transforming the global economy.
And the market could be facing a similar test.
THE TECHNOLOGY CAN SUCCEED WHILE THE STOCKS COLLAPSE.
That's the lesson investors keep forgetting.
SAVE THIS CHART.
Watch the S&P 500 over the next 48 hours.
I'm tracking this setup closely, and I'll share my next major market call HERE FIRST.
Follow and turn on notifications.
Because if this historical pattern starts playing out, the most dangerous mistake could be assuming every dip is another buying opportunity.
THE MARKET DOESN'T NEED TO REPEAT 2000 EXACTLY TO CAUSE SERIOUS DAMAGE.
DON'T BECOME EXIT LIQUIDITY.
THE S&P 500 IS FLASHING THE SAME WARNING SIGNS AS THE 2000 DOT-COM BUBBLE.
And I believe the next 48 hours could be CRITICAL for the entire stock market.
If you own stocks, Bitcoin or any risk assets, LOOK AT THIS CHART.
The similarities are getting seriously concerning.
In 2000, Wall Street looked unstoppable.
Stocks kept breaking records.
Investors believed the internet had changed everything.
Every dip was another buying opportunity.
UNTIL IT WASN'T.
What followed?
NASDAQ 100: -82.9%.
S&P 500: -49.1%.
Nearly 2.5 YEARS of destruction.
And here's what should worry investors today.
THE CURRENT S&P 500 STRUCTURE LOOKS DISTURBINGLY SIMILAR.
The breakout.
The overextension.
The crowded positioning.
The confidence that every correction will be bought.
Now look at the warning signs from the current setup:
→ NASDAQ 100: Down 12.5% from its October 6 peak.
→ NVIDIA: Down 33.7% ahead of its earnings announcement.
→ VIX: Up 11.6% in a single session.
→ S&P 500: Just 4.5% below its peak.
READ THAT AGAIN.
The broader market is still relatively close to its highs.
But some of the biggest technology names have already suffered much deeper declines.
And that divergence is exactly what I'm watching.
Because major market reversals don't always begin with everything crashing at once.
Sometimes the leaders weaken FIRST.
Then the rest of the market catches up.
NOW HERE'S THE PART MOST INVESTORS ARE IGNORING.
The historical 2000 comparison on this chart points toward approximately 3,976 on the S&P 500.
That's NOT my guaranteed target.
It's the downside scenario I'm monitoring if the historical pattern continues.
And there are THREE possible outcomes.
SCENARIO 1: THE RESET.
Volatility cools.
Selling pressure fades.
The market consolidates and eventually recovers.
SCENARIO 2: THE DEEP CORRECTION.
Major support levels break.
Institutional selling accelerates.
Technology stocks lead another leg lower.
Bitcoin and other speculative assets come under pressure.
SCENARIO 3: THE DOT-COM-STYLE COLLAPSE.
This is the scenario that concerns me MOST.
Confidence disappears.
Leveraged positions unwind.
Liquidity deteriorates.
And what started as an ordinary correction turns into a prolonged bear market.
BUT HERE'S THE KEY DIFFERENCE.
A similar-looking chart doesn't guarantee the same outcome.
Markets don't crash simply because two historical patterns resemble each other.
That's why I'm watching three things closely:
PRICE ACTION.
LIQUIDITY.
VOLATILITY.
If all three deteriorate together, the risk of a much deeper selloff becomes harder to ignore.
And the next 48 hours could provide important clues.
REMEMBER WHAT HAPPENED IN 2000.
The internet revolution was REAL.
The companies were changing the world.
But investors still lost fortunes because valuations had moved too far ahead of reality.
Now AI is transforming the global economy.
And the market could be facing a similar test.
THE TECHNOLOGY CAN SUCCEED WHILE THE STOCKS COLLAPSE.
That's the lesson investors keep forgetting.
SAVE THIS CHART.
Watch the S&P 500 over the next 48 hours.
I'm tracking this setup closely, and I'll share my next major market call HERE FIRST.
Follow and turn on notifications.
Because if this historical pattern starts playing out, the most dangerous mistake could be assuming every dip is another buying opportunity.
THE MARKET DOESN'T NEED TO REPEAT 2000 EXACTLY TO CAUSE SERIOUS DAMAGE.
DON'T BECOME EXIT LIQUIDITY.
If you own stocks, Bitcoin or any risk assets, LOOK AT THIS CHART.
The similarities are getting seriously concerning.
In 2000, Wall Street looked unstoppable.
Stocks kept breaking records.
Investors believed the internet had changed everything.
Every dip was another buying opportunity.
UNTIL IT WASN'T.
What followed?
NASDAQ 100: -82.9%.
S&P 500: -49.1%.
Nearly 2.5 YEARS of destruction.
And here's what should worry investors today.
THE CURRENT S&P 500 STRUCTURE LOOKS DISTURBINGLY SIMILAR.
The breakout.
The overextension.
The crowded positioning.
The confidence that every correction will be bought.
Now look at the warning signs from the current setup:
→ NASDAQ 100: Down 12.5% from its October 6 peak.
→ NVIDIA: Down 33.7% ahead of its earnings announcement.
→ VIX: Up 11.6% in a single session.
→ S&P 500: Just 4.5% below its peak.
READ THAT AGAIN.
The broader market is still relatively close to its highs.
But some of the biggest technology names have already suffered much deeper declines.
And that divergence is exactly what I'm watching.
Because major market reversals don't always begin with everything crashing at once.
Sometimes the leaders weaken FIRST.
Then the rest of the market catches up.
NOW HERE'S THE PART MOST INVESTORS ARE IGNORING.
The historical 2000 comparison on this chart points toward approximately 3,976 on the S&P 500.
That's NOT my guaranteed target.
It's the downside scenario I'm monitoring if the historical pattern continues.
And there are THREE possible outcomes.
SCENARIO 1: THE RESET.
Volatility cools.
Selling pressure fades.
The market consolidates and eventually recovers.
SCENARIO 2: THE DEEP CORRECTION.
Major support levels break.
Institutional selling accelerates.
Technology stocks lead another leg lower.
Bitcoin and other speculative assets come under pressure.
SCENARIO 3: THE DOT-COM-STYLE COLLAPSE.
This is the scenario that concerns me MOST.
Confidence disappears.
Leveraged positions unwind.
Liquidity deteriorates.
And what started as an ordinary correction turns into a prolonged bear market.
BUT HERE'S THE KEY DIFFERENCE.
A similar-looking chart doesn't guarantee the same outcome.
Markets don't crash simply because two historical patterns resemble each other.
That's why I'm watching three things closely:
PRICE ACTION.
LIQUIDITY.
VOLATILITY.
If all three deteriorate together, the risk of a much deeper selloff becomes harder to ignore.
And the next 48 hours could provide important clues.
REMEMBER WHAT HAPPENED IN 2000.
The internet revolution was REAL.
The companies were changing the world.
But investors still lost fortunes because valuations had moved too far ahead of reality.
Now AI is transforming the global economy.
And the market could be facing a similar test.
THE TECHNOLOGY CAN SUCCEED WHILE THE STOCKS COLLAPSE.
That's the lesson investors keep forgetting.
SAVE THIS CHART.
Watch the S&P 500 over the next 48 hours.
I'm tracking this setup closely, and I'll share my next major market call HERE FIRST.
Follow and turn on notifications.
Because if this historical pattern starts playing out, the most dangerous mistake could be assuming every dip is another buying opportunity.
THE MARKET DOESN'T NEED TO REPEAT 2000 EXACTLY TO CAUSE SERIOUS DAMAGE.
DON'T BECOME EXIT LIQUIDITY.
3
1.8k
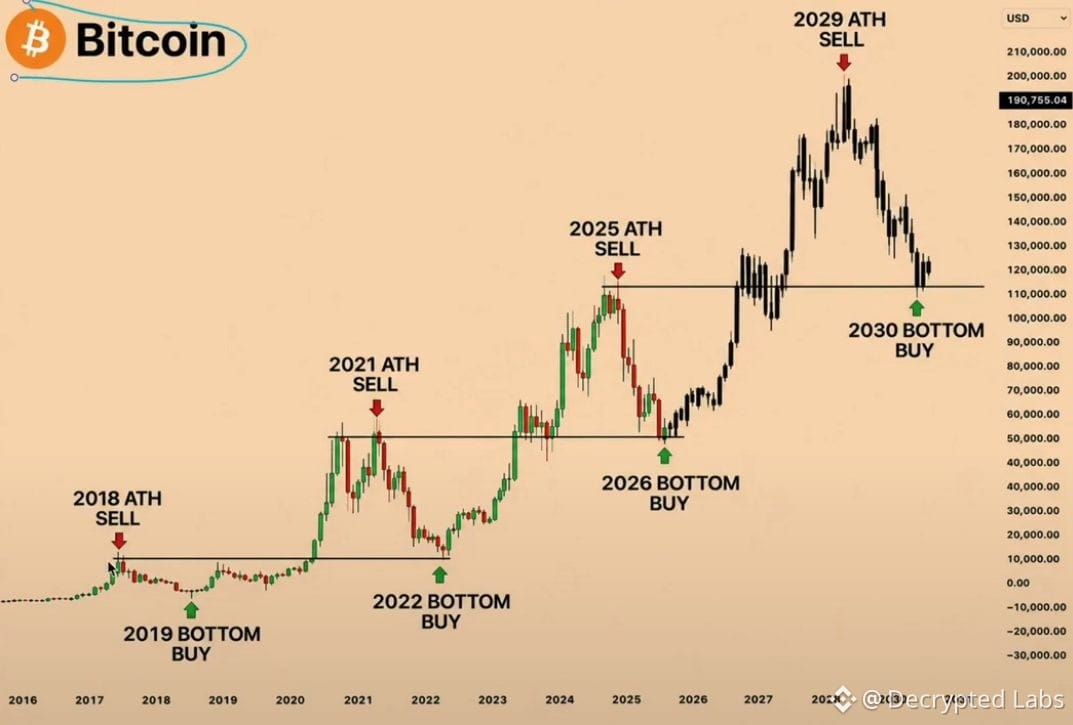
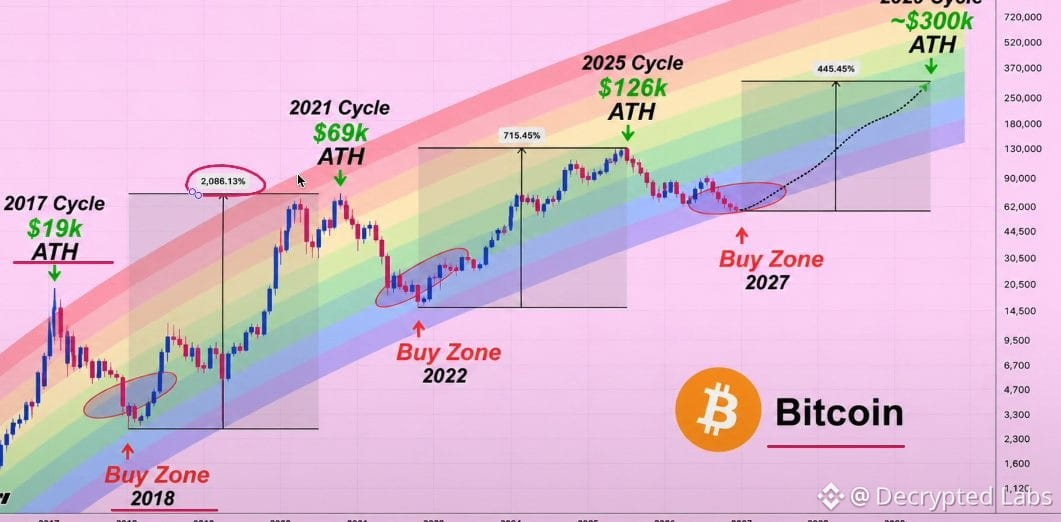
🚨 BITCOIN'S FINAL CRASH BEFORE $300,000 IS GETTING CLOSER.
And I believe most investors will make the same mistake they made in every previous cycle.
They'll panic at the bottom and buy back when it's too late.
LOOK AT THIS CHART.
My Bitcoin roadmap hasn't changed:
$126K → $87K → $64K → $55K → $300K
I believe we're already 60% through the bear market.
But the most important move may still be ahead.
HERE'S WHAT I'M WATCHING:
→ $55K: Final capitulation target.\
→ 2027: Potential bear market bottom.\
→ $300K: My long-term target for the next major cycle.
READ THAT AGAIN.
I'M EXPECTING ANOTHER CRASH BEFORE THE BIGGEST RALLY.
And that's exactly why I'm not blindly buying every bounce.
The final phase of a bear market is where patience gets tested.
Retail loses confidence.
Everyone starts predicting lower prices.
And the investors who were begging to buy Bitcoin cheaper suddenly become too terrified to touch it.
We've seen this psychology before.
REMEMBER MY PREVIOUS CALLS?
November 2022: Bitcoin bottomed at $15,476.
October 2025: Bitcoin topped near $126,200.
Now I'm watching for the next major turning point.
And I believe this next call could be even more important.
Does $55K guarantee the bottom? No.
I'll be watching for confirmation before treating it as the final accumulation opportunity.
But one thing is certain about my strategy:
WHEN I DECIDE TO EXIT THE MARKET COMPLETELY, I'LL POST IT HERE PUBLICLY.
Just like my previous major market calls.
SAVE THIS CHART.
Come back in 2027 and see how the roadmap played out.
Follow and turn notifications on.
You won't want to miss my next major Bitcoin signal.
THE BIGGEST MISTAKE ISN'T MISSING THE TOP.
IT'S SURVIVING THE ENTIRE BEAR MARKET ONLY TO SELL RIGHT BEFORE THE NEXT BULL RUN.
🚨 BITCOIN'S FINAL CRASH BEFORE $300,000 IS GETTING CLOSER.
And I believe most investors will make the same mistake they made in every previous cycle.
They'll panic at the bottom and buy back when it's too late.
LOOK AT THIS CHART.
My Bitcoin roadmap hasn't changed:
$126K → $87K → $64K → $55K → $300K
I believe we're already 60% through the bear market.
But the most important move may still be ahead.
HERE'S WHAT I'M WATCHING:
→ $55K: Final capitulation target.\
→ 2027: Potential bear market bottom.\
→ $300K: My long-term target for the next major cycle.
READ THAT AGAIN.
I'M EXPECTING ANOTHER CRASH BEFORE THE BIGGEST RALLY.
And that's exactly why I'm not blindly buying every bounce.
The final phase of a bear market is where patience gets tested.
Retail loses confidence.
Everyone starts predicting lower prices.
And the investors who were begging to buy Bitcoin cheaper suddenly become too terrified to touch it.
We've seen this psychology before.
REMEMBER MY PREVIOUS CALLS?
November 2022: Bitcoin bottomed at $15,476.
October 2025: Bitcoin topped near $126,200.
Now I'm watching for the next major turning point.
And I believe this next call could be even more important.
Does $55K guarantee the bottom? No.
I'll be watching for confirmation before treating it as the final accumulation opportunity.
But one thing is certain about my strategy:
WHEN I DECIDE TO EXIT THE MARKET COMPLETELY, I'LL POST IT HERE PUBLICLY.
Just like my previous major market calls.
SAVE THIS CHART.
Come back in 2027 and see how the roadmap played out.
Follow and turn notifications on.
You won't want to miss my next major Bitcoin signal.
THE BIGGEST MISTAKE ISN'T MISSING THE TOP.
IT'S SURVIVING THE ENTIRE BEAR MARKET ONLY TO SELL RIGHT BEFORE THE NEXT BULL RUN.
And I believe most investors will make the same mistake they made in every previous cycle.
They'll panic at the bottom and buy back when it's too late.
LOOK AT THIS CHART.
My Bitcoin roadmap hasn't changed:
$126K → $87K → $64K → $55K → $300K
I believe we're already 60% through the bear market.
But the most important move may still be ahead.
HERE'S WHAT I'M WATCHING:
→ $55K: Final capitulation target.\
→ 2027: Potential bear market bottom.\
→ $300K: My long-term target for the next major cycle.
READ THAT AGAIN.
I'M EXPECTING ANOTHER CRASH BEFORE THE BIGGEST RALLY.
And that's exactly why I'm not blindly buying every bounce.
The final phase of a bear market is where patience gets tested.
Retail loses confidence.
Everyone starts predicting lower prices.
And the investors who were begging to buy Bitcoin cheaper suddenly become too terrified to touch it.
We've seen this psychology before.
REMEMBER MY PREVIOUS CALLS?
November 2022: Bitcoin bottomed at $15,476.
October 2025: Bitcoin topped near $126,200.
Now I'm watching for the next major turning point.
And I believe this next call could be even more important.
Does $55K guarantee the bottom? No.
I'll be watching for confirmation before treating it as the final accumulation opportunity.
But one thing is certain about my strategy:
WHEN I DECIDE TO EXIT THE MARKET COMPLETELY, I'LL POST IT HERE PUBLICLY.
Just like my previous major market calls.
SAVE THIS CHART.
Come back in 2027 and see how the roadmap played out.
Follow and turn notifications on.
You won't want to miss my next major Bitcoin signal.
THE BIGGEST MISTAKE ISN'T MISSING THE TOP.
IT'S SURVIVING THE ENTIRE BEAR MARKET ONLY TO SELL RIGHT BEFORE THE NEXT BULL RUN.
12
1
46
44.8k
Bitcoin Weekly Analysis
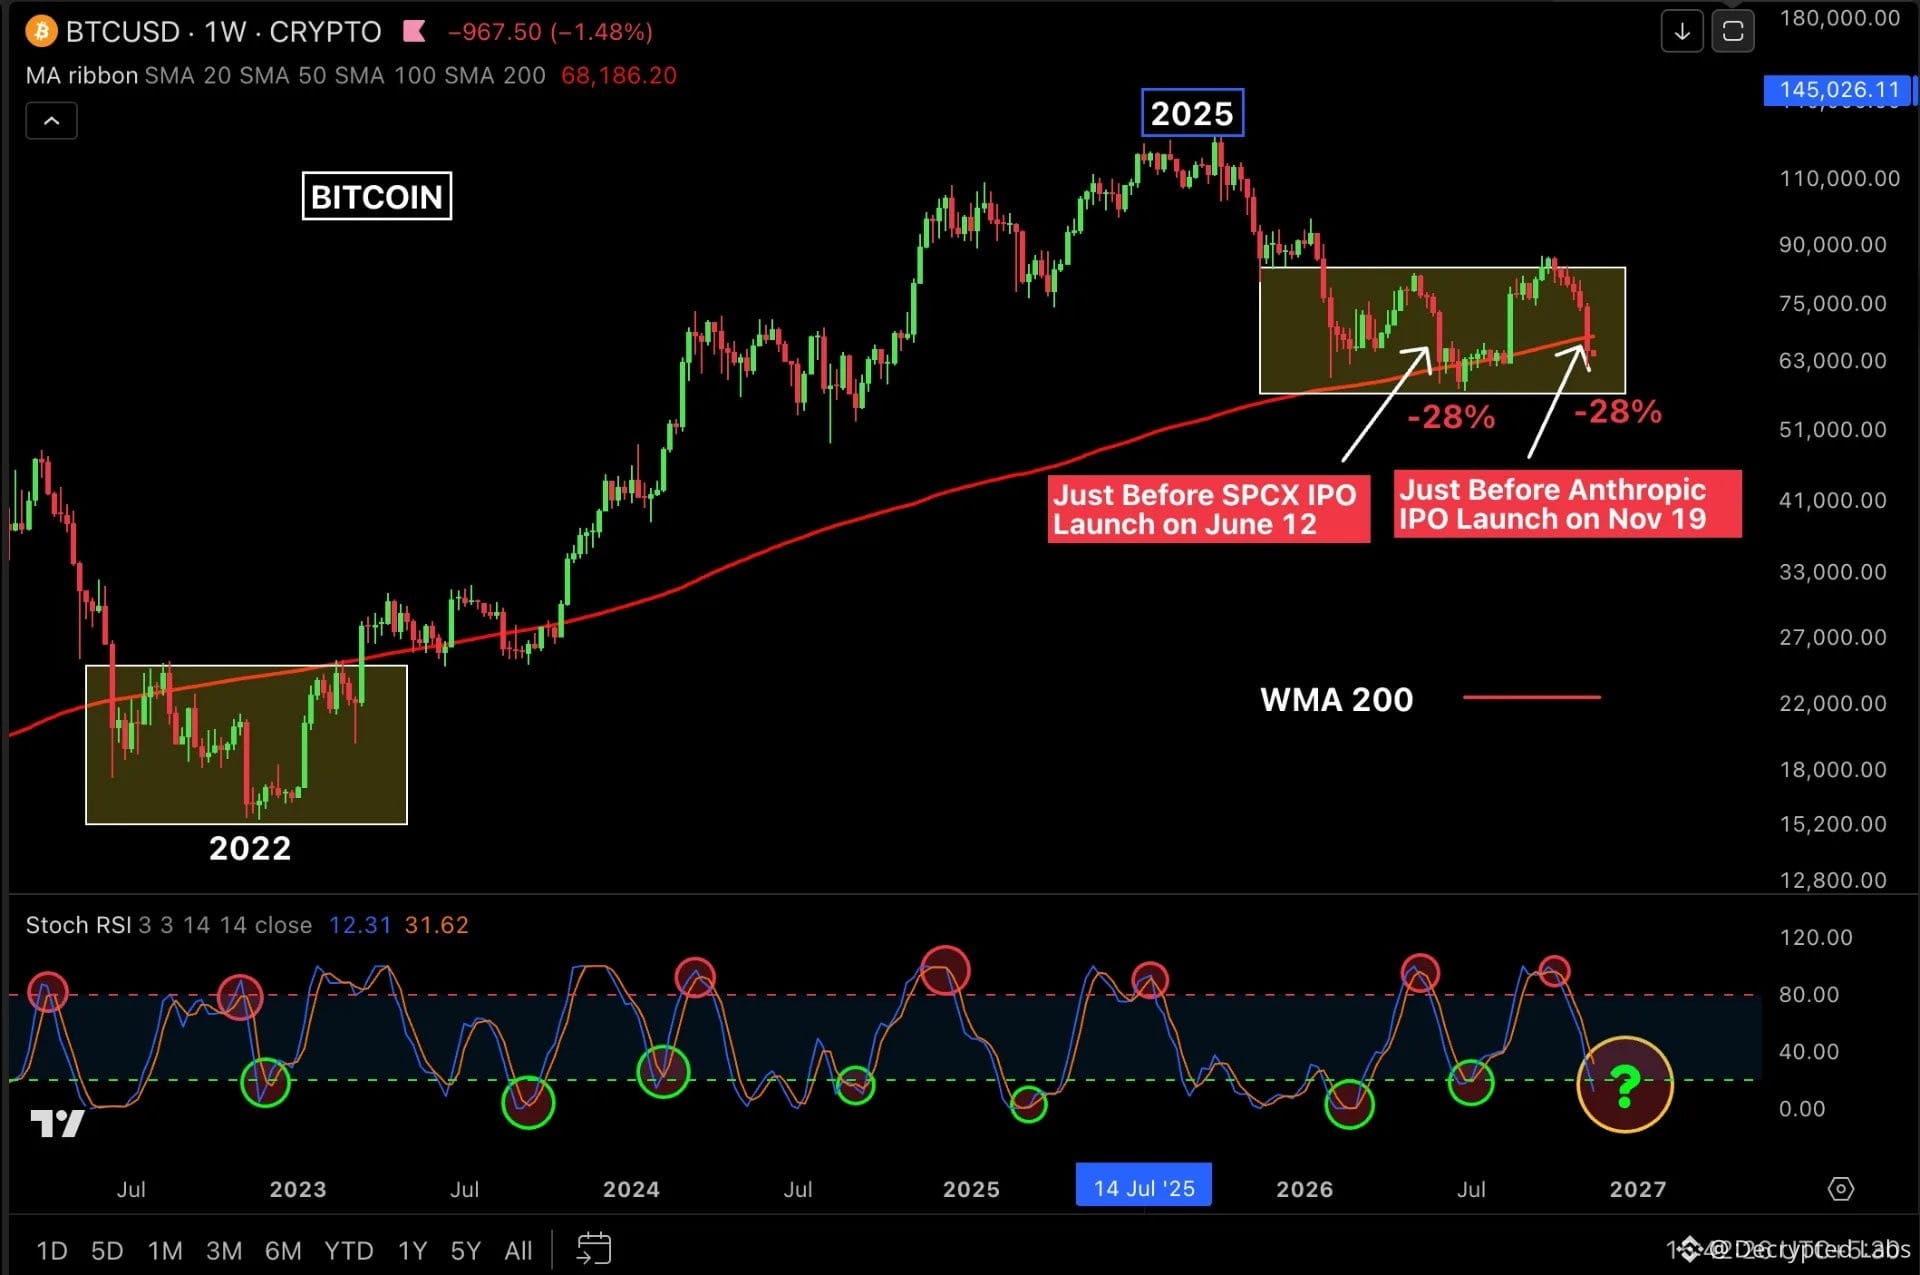
$BTC closed its sixth consecutive red weekly candle, down 12.5% this week, and fell below its weekly 200 MA near $68,000.
Key levels to watch:
- Support: $58,000
- Resistance: $68,200 (Weekly MA 200)
- Major resistance: $74,500 (Weekly MA 50)
Reasons behind this correction:
1. Technical: Bitcoin failed to break above $82K, which made sellers quickly take control.
2. Cycle behaviour: Every BTC cycle has seen a panic-style capitulation in the final quarter of the bear phase, and we are seeing the same pattern again.
3. US Midterm Elections: BTC has historically corrected after November midterms. It fell 50% in 2018 and about 28% around the 2022 midterms. From the recent high, it is again down about 28%.
4. Large IPO liquidity drain: Bitcoin dropped roughly 28% ahead of the SpaceX IPO on June 12. Now, with Anthropic's IPO expected on November 19, we're seeing another major correction.
None of this is new. Bitcoin has seen this in previous cycles too. November panic has historically been a good time to accumulate for the long term.
#BitcoinExtendsLosingStreakToSixWeeks
Bitcoin Weekly Analysis
$BTC closed its sixth consecutive red weekly candle, down 12.5% this week, and fell below its weekly 200 MA near $68,000.
Key levels to watch:
- Support: $58,000
- Resistance: $68,200 (Weekly MA 200)
- Major resistance: $74,500 (Weekly MA 50)
Reasons behind this correction:
1. Technical: Bitcoin failed to break above $82K, which made sellers quickly take control.
2. Cycle behaviour: Every BTC cycle has seen a panic-style capitulation in the final quarter of the bear phase, and we are seeing the same pattern again.
3. US Midterm Elections: BTC has historically corrected after November midterms. It fell 50% in 2018 and about 28% around the 2022 midterms. From the recent high, it is again down about 28%.
4. Large IPO liquidity drain: Bitcoin dropped roughly 28% ahead of the SpaceX IPO on June 12. Now, with Anthropic's IPO expected on November 19, we're seeing another major correction.
None of this is new. Bitcoin has seen this in previous cycles too. November panic has historically been a good time to accumulate for the long term.
#BitcoinExtendsLosingStreakToSixWeeks
$BTC closed its sixth consecutive red weekly candle, down 12.5% this week, and fell below its weekly 200 MA near $68,000.
Key levels to watch:
- Support: $58,000
- Resistance: $68,200 (Weekly MA 200)
- Major resistance: $74,500 (Weekly MA 50)
Reasons behind this correction:
1. Technical: Bitcoin failed to break above $82K, which made sellers quickly take control.
2. Cycle behaviour: Every BTC cycle has seen a panic-style capitulation in the final quarter of the bear phase, and we are seeing the same pattern again.
3. US Midterm Elections: BTC has historically corrected after November midterms. It fell 50% in 2018 and about 28% around the 2022 midterms. From the recent high, it is again down about 28%.
4. Large IPO liquidity drain: Bitcoin dropped roughly 28% ahead of the SpaceX IPO on June 12. Now, with Anthropic's IPO expected on November 19, we're seeing another major correction.
None of this is new. Bitcoin has seen this in previous cycles too. November panic has historically been a good time to accumulate for the long term.
#BitcoinExtendsLosingStreakToSixWeeks
236
If you missed buying:
$ETH in 2021
$ETH in 2022
$ETH in 2023
$ETH in 2024
$ETH in 2025
Don't worry, you can buy it today at the same price.
If you missed buying:
$ETH in 2021
$ETH in 2022
$ETH in 2023
$ETH in 2024
$ETH in 2025
Don't worry, you can buy it today at the same price.
$ETH in 2021
$ETH in 2022
$ETH in 2023
$ETH in 2024
$ETH in 2025
Don't worry, you can buy it today at the same price.

Gift
From Decrypted Labs
242
My targets for the next 6-8 months:
$BTC: $100K - $150K
$ETH: $3K - $6K
$SOL: $250 - $500
$XRP: $3 - $5
$DOGE: $0.50 - $1
Save this.
My targets for the next 6-8 months:
$BTC: $100K - $150K
$ETH: $3K - $6K
$SOL: $250 - $500
$XRP: $3 - $5
$DOGE: $0.50 - $1
Save this.
$BTC: $100K - $150K
$ETH: $3K - $6K
$SOL: $250 - $500
$XRP: $3 - $5
$DOGE: $0.50 - $1
Save this.
Red Packet
From Decrypted Labs
1
2
180
THE GLOBAL MARKETS COULD FACE HUGE PRESSURE NEXT WEEK.
Bitcoin has a history of reacting early when things are not looking good in the global markets.
And next week, we have several major events that could shake things:
1. Nvidia will report its earnings
2. The October Fed meeting minutes will hint at a December rate hike
3. Anthropic is expected to launch its IPO, and investors might sell existing stocks to free up capital for the new offering
4. A historic meeting between Donald Trump, and Vladimir Putin could have a major impact on financial markets.
Manage your risk and avoid high-leverage trading.
#BitcoinActiveSupplyInProfitDropsBelow45%
THE GLOBAL MARKETS COULD FACE HUGE PRESSURE NEXT WEEK.
Bitcoin has a history of reacting early when things are not looking good in the global markets.
And next week, we have several major events that could shake things:
1. Nvidia will report its earnings
2. The October Fed meeting minutes will hint at a December rate hike
3. Anthropic is expected to launch its IPO, and investors might sell existing stocks to free up capital for the new offering
4. A historic meeting between Donald Trump, and Vladimir Putin could have a major impact on financial markets.
Manage your risk and avoid high-leverage trading.
#BitcoinActiveSupplyInProfitDropsBelow45%
Bitcoin has a history of reacting early when things are not looking good in the global markets.
And next week, we have several major events that could shake things:
1. Nvidia will report its earnings
2. The October Fed meeting minutes will hint at a December rate hike
3. Anthropic is expected to launch its IPO, and investors might sell existing stocks to free up capital for the new offering
4. A historic meeting between Donald Trump, and Vladimir Putin could have a major impact on financial markets.
Manage your risk and avoid high-leverage trading.
#BitcoinActiveSupplyInProfitDropsBelow45%
125
Article
BITCOIN IS CRASHING, AND I BELIEVE WALL STREET HAS CHANGED THE GAME FOREVER.It's NOT just the AI bubble.
It's NOT just inflation.
And it's NOT simply retail investors panic selling.
Something much bigger has been happening to Bitcoin for YEARS.
And almost nobody understands what it means.
LOOK AT THIS CHART.
Bitcoin was built around one revolutionary idea:
ONLY 21 MILLION BTC WILL EVER EXIST.
No central bank can print more.
No government can increase the supply.
Absolute scarcity.
But here's the question nobody wants to ask.
WHAT HAPPENS WHEN WALL STREET CAN CREATE VIRTUALLY UNLIMITED FINANCIAL EXPOSURE TO AN ASSET WITH LIMITED SUPPLY?
That's where things get interesting.
And potentially VERY dangerous.
The market trading Bitcoin today is fundamentally different from the market that existed a decade ago.
We now have:
→ Cash-settled futures.
→ Perpetual swaps.
→ Options.
→ Spot Bitcoin ETFs.
→ Institutional lending.
→ Wrapped BTC.
→ Total return swaps.
All built around the SAME underlying asset.
And here's what most investors are missing.
YOU DON'T NEED TO OWN ACTUAL BITCOIN TO TRADE ITS PRICE.
A trader can take a massive BTC position through derivatives without ever touching the blockchain.
An institution can hedge billions in exposure.
A leveraged fund can be liquidated.
And those transactions can influence prices across the entire market.
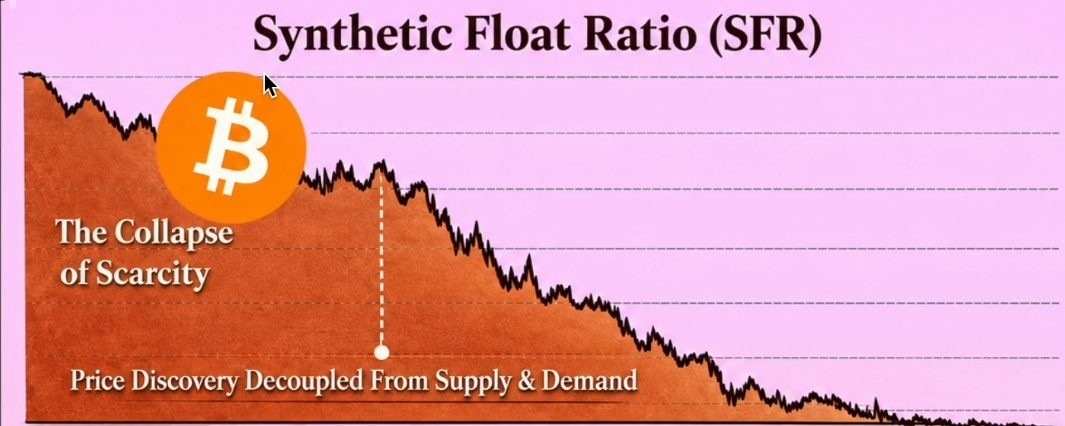
This is where the concept of the Synthetic Float Ratio (SFR) becomes important.
It attempts to measure the relationship between synthetic Bitcoin exposure and the underlying supply available for trading.
But here's the critical distinction.
Synthetic exposure doesn't create additional real BTC.
The 21 million supply cap remains intact.
What it DOES create is an enormous layer of financial claims and leveraged positions around that limited supply.
And that changes how price discovery works.
Think about it.
One Bitcoin can be connected to multiple financial exposures through:
→ ETF holdings.
→ Futures contracts.
→ Options positions.
→ Broker lending.
→ Wrapped assets.
→ Structured products.
These aren't necessarily six separate ownership claims on the same coin.
But they demonstrate how much financial activity can develop around a relatively small amount of underlying BTC.
And when leverage becomes excessive, the consequences can be BRUTAL.
Here's the mechanism I'm watching.
PHASE 1: THE LEVERAGE BUILDS.
Traders open increasingly aggressive positions.
Derivatives activity expands.
Everyone expects the next major rally.
PHASE 2: THE SELLING BEGINS.
Large positions are unwound.
Hedging flows amplify price movements.
Leveraged traders start getting liquidated.
PHASE 3: THE LIQUIDATION CASCADE.
Forced selling creates more selling.
Support levels break.
Liquidations accelerate.
And suddenly Bitcoin is falling much faster than spot-market demand alone might suggest.
PHASE 4: THE OPPORTUNITY.
Leverage gets flushed out.
Selling pressure eventually fades.
And investors start looking for signs of genuine accumulation.
THIS IS WHY UNDERSTANDING BITCOIN'S DERIVATIVES MARKET MATTERS.
We've seen financialization transform price discovery in gold, silver, oil and equities.
Now Bitcoin is increasingly exposed to similar forces.
Does this prove Wall Street is deliberately manipulating every Bitcoin crash?
NO.
And it doesn't mean derivatives have destroyed Bitcoin's scarcity.
But it DOES mean that understanding Bitcoin's price requires looking beyond the 21 million supply cap.
The blockchain hasn't changed.
THE MARKET STRUCTURE HAS.
And I believe investors who ignore that distinction could be caught completely off guard during the next major liquidation event.
Remember my previous market calls:
2022: I publicly called Bitcoin's bottom around $17K.
2025: I called the $126K cycle top.
2026: I identified the $57K local bottom.
Now I'm watching for the next major turning point.
And this time, I'm paying particularly close attention to leverage, derivatives positioning and liquidation levels.
SAVE THIS CHART.
Because the next major Bitcoin move might have less to do with retail sentiment than most people realize.
Follow and turn on notifications.
I'll share my next major Bitcoin call HERE FIRST.
BITCOIN'S SUPPLY IS STILL LIMITED TO 21 MILLION.
BUT THE FINANCIAL EXPOSURE BUILT AROUND IT ISN'T.
UNDERSTAND THE DIFFERENCE BEFORE THE NEXT LIQUIDATION WAVE.
BITCOIN IS CRASHING, AND I BELIEVE WALL STREET HAS CHANGED THE GAME FOREVER.
It's NOT just the AI bubble.
It's NOT just inflation.
And it's NOT simply retail investors panic selling.
Something much bigger has been happening to Bitcoin for YEARS.
And almost nobody understands what it means.
LOOK AT THIS CHART.
Bitcoin was built around one revolutionary idea:
ONLY 21 MILLION BTC WILL EVER EXIST.
No central bank can print more.
No government can increase the supply.
Absolute scarcity.
But here's the question nobody wants to ask.
WHAT HAPPENS WHEN WALL STREET CAN CREATE VIRTUALLY UNLIMITED FINANCIAL EXPOSURE TO AN ASSET WITH LIMITED SUPPLY?
That's where things get interesting.
And potentially VERY dangerous.
The market trading Bitcoin today is fundamentally different from the market that existed a decade ago.
We now have:
→ Cash-settled futures.
→ Perpetual swaps.
→ Options.
→ Spot Bitcoin ETFs.
→ Institutional lending.
→ Wrapped BTC.
→ Total return swaps.
All built around the SAME underlying asset.
And here's what most investors are missing.
YOU DON'T NEED TO OWN ACTUAL BITCOIN TO TRADE ITS PRICE.
A trader can take a massive BTC position through derivatives without ever touching the blockchain.
An institution can hedge billions in exposure.
A leveraged fund can be liquidated.
And those transactions can influence prices across the entire market.
This is where the concept of the Synthetic Float Ratio (SFR) becomes important.
It attempts to measure the relationship between synthetic Bitcoin exposure and the underlying supply available for trading.
But here's the critical distinction.
Synthetic exposure doesn't create additional real BTC.
The 21 million supply cap remains intact.
What it DOES create is an enormous layer of financial claims and leveraged positions around that limited supply.
And that changes how price discovery works.
Think about it.
One Bitcoin can be connected to multiple financial exposures through:
→ ETF holdings.
→ Futures contracts.
→ Options positions.
→ Broker lending.
→ Wrapped assets.
→ Structured products.
These aren't necessarily six separate ownership claims on the same coin.
But they demonstrate how much financial activity can develop around a relatively small amount of underlying BTC.
And when leverage becomes excessive, the consequences can be BRUTAL.
Here's the mechanism I'm watching.
PHASE 1: THE LEVERAGE BUILDS.
Traders open increasingly aggressive positions.
Derivatives activity expands.
Everyone expects the next major rally.
PHASE 2: THE SELLING BEGINS.
Large positions are unwound.
Hedging flows amplify price movements.
Leveraged traders start getting liquidated.
PHASE 3: THE LIQUIDATION CASCADE.
Forced selling creates more selling.
Support levels break.
Liquidations accelerate.
And suddenly Bitcoin is falling much faster than spot-market demand alone might suggest.
PHASE 4: THE OPPORTUNITY.
Leverage gets flushed out.
Selling pressure eventually fades.
And investors start looking for signs of genuine accumulation.
THIS IS WHY UNDERSTANDING BITCOIN'S DERIVATIVES MARKET MATTERS.
We've seen financialization transform price discovery in gold, silver, oil and equities.
Now Bitcoin is increasingly exposed to similar forces.
Does this prove Wall Street is deliberately manipulating every Bitcoin crash?
NO.
And it doesn't mean derivatives have destroyed Bitcoin's scarcity.
But it DOES mean that understanding Bitcoin's price requires looking beyond the 21 million supply cap.
The blockchain hasn't changed.
THE MARKET STRUCTURE HAS.
And I believe investors who ignore that distinction could be caught completely off guard during the next major liquidation event.
Remember my previous market calls:
2022: I publicly called Bitcoin's bottom around $17K.
2025: I called the $126K cycle top.
2026: I identified the $57K local bottom.
Now I'm watching for the next major turning point.
And this time, I'm paying particularly close attention to leverage, derivatives positioning and liquidation levels.
SAVE THIS CHART.
Because the next major Bitcoin move might have less to do with retail sentiment than most people realize.
Follow and turn on notifications.
I'll share my next major Bitcoin call HERE FIRST.
BITCOIN'S SUPPLY IS STILL LIMITED TO 21 MILLION.
BUT THE FINANCIAL EXPOSURE BUILT AROUND IT ISN'T.
UNDERSTAND THE DIFFERENCE BEFORE THE NEXT LIQUIDATION WAVE.
It's NOT just inflation.
And it's NOT simply retail investors panic selling.
Something much bigger has been happening to Bitcoin for YEARS.
And almost nobody understands what it means.
LOOK AT THIS CHART.
Bitcoin was built around one revolutionary idea:
ONLY 21 MILLION BTC WILL EVER EXIST.
No central bank can print more.
No government can increase the supply.
Absolute scarcity.
But here's the question nobody wants to ask.
WHAT HAPPENS WHEN WALL STREET CAN CREATE VIRTUALLY UNLIMITED FINANCIAL EXPOSURE TO AN ASSET WITH LIMITED SUPPLY?
That's where things get interesting.
And potentially VERY dangerous.
The market trading Bitcoin today is fundamentally different from the market that existed a decade ago.
We now have:
→ Cash-settled futures.
→ Perpetual swaps.
→ Options.
→ Spot Bitcoin ETFs.
→ Institutional lending.
→ Wrapped BTC.
→ Total return swaps.
All built around the SAME underlying asset.
And here's what most investors are missing.
YOU DON'T NEED TO OWN ACTUAL BITCOIN TO TRADE ITS PRICE.
A trader can take a massive BTC position through derivatives without ever touching the blockchain.
An institution can hedge billions in exposure.
A leveraged fund can be liquidated.
And those transactions can influence prices across the entire market.
This is where the concept of the Synthetic Float Ratio (SFR) becomes important.
It attempts to measure the relationship between synthetic Bitcoin exposure and the underlying supply available for trading.
But here's the critical distinction.
Synthetic exposure doesn't create additional real BTC.
The 21 million supply cap remains intact.
What it DOES create is an enormous layer of financial claims and leveraged positions around that limited supply.
And that changes how price discovery works.
Think about it.
One Bitcoin can be connected to multiple financial exposures through:
→ ETF holdings.
→ Futures contracts.
→ Options positions.
→ Broker lending.
→ Wrapped assets.
→ Structured products.
These aren't necessarily six separate ownership claims on the same coin.
But they demonstrate how much financial activity can develop around a relatively small amount of underlying BTC.
And when leverage becomes excessive, the consequences can be BRUTAL.
Here's the mechanism I'm watching.
PHASE 1: THE LEVERAGE BUILDS.
Traders open increasingly aggressive positions.
Derivatives activity expands.
Everyone expects the next major rally.
PHASE 2: THE SELLING BEGINS.
Large positions are unwound.
Hedging flows amplify price movements.
Leveraged traders start getting liquidated.
PHASE 3: THE LIQUIDATION CASCADE.
Forced selling creates more selling.
Support levels break.
Liquidations accelerate.
And suddenly Bitcoin is falling much faster than spot-market demand alone might suggest.
PHASE 4: THE OPPORTUNITY.
Leverage gets flushed out.
Selling pressure eventually fades.
And investors start looking for signs of genuine accumulation.
THIS IS WHY UNDERSTANDING BITCOIN'S DERIVATIVES MARKET MATTERS.
We've seen financialization transform price discovery in gold, silver, oil and equities.
Now Bitcoin is increasingly exposed to similar forces.
Does this prove Wall Street is deliberately manipulating every Bitcoin crash?
NO.
And it doesn't mean derivatives have destroyed Bitcoin's scarcity.
But it DOES mean that understanding Bitcoin's price requires looking beyond the 21 million supply cap.
The blockchain hasn't changed.
THE MARKET STRUCTURE HAS.
And I believe investors who ignore that distinction could be caught completely off guard during the next major liquidation event.
Remember my previous market calls:
2022: I publicly called Bitcoin's bottom around $17K.
2025: I called the $126K cycle top.
2026: I identified the $57K local bottom.
Now I'm watching for the next major turning point.
And this time, I'm paying particularly close attention to leverage, derivatives positioning and liquidation levels.
SAVE THIS CHART.
Because the next major Bitcoin move might have less to do with retail sentiment than most people realize.
Follow and turn on notifications.
I'll share my next major Bitcoin call HERE FIRST.
BITCOIN'S SUPPLY IS STILL LIMITED TO 21 MILLION.
BUT THE FINANCIAL EXPOSURE BUILT AROUND IT ISN'T.
UNDERSTAND THE DIFFERENCE BEFORE THE NEXT LIQUIDATION WAVE.
6
855
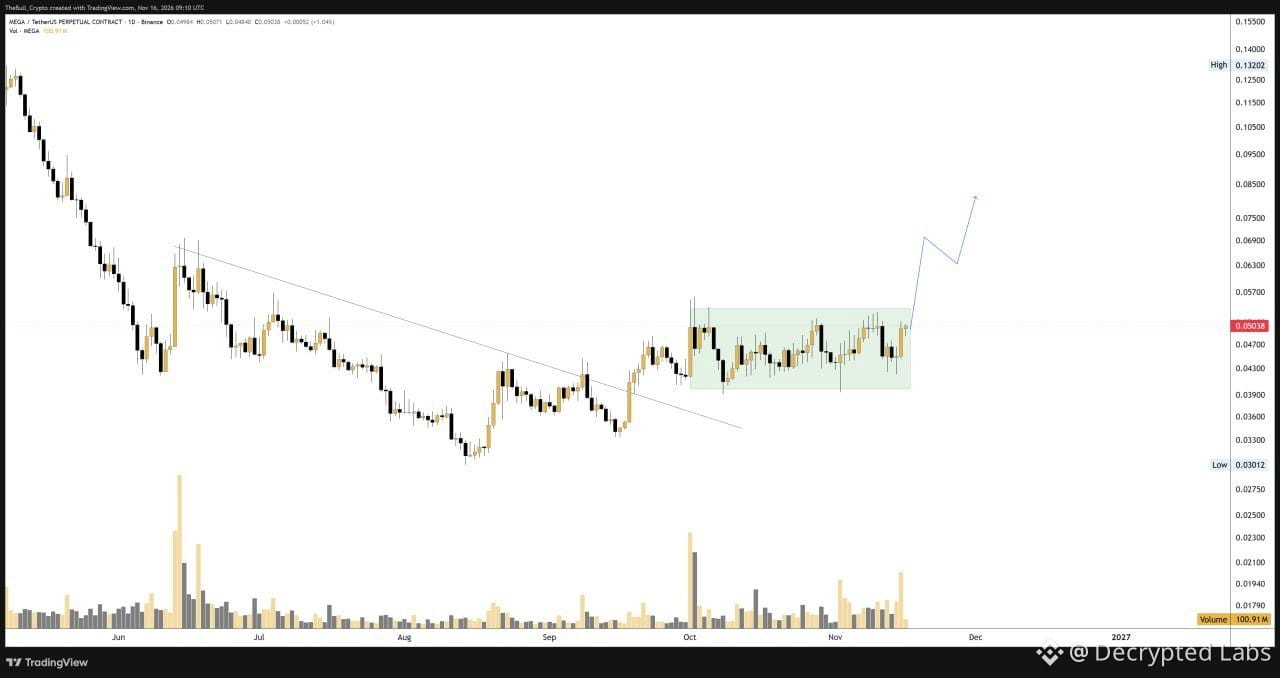
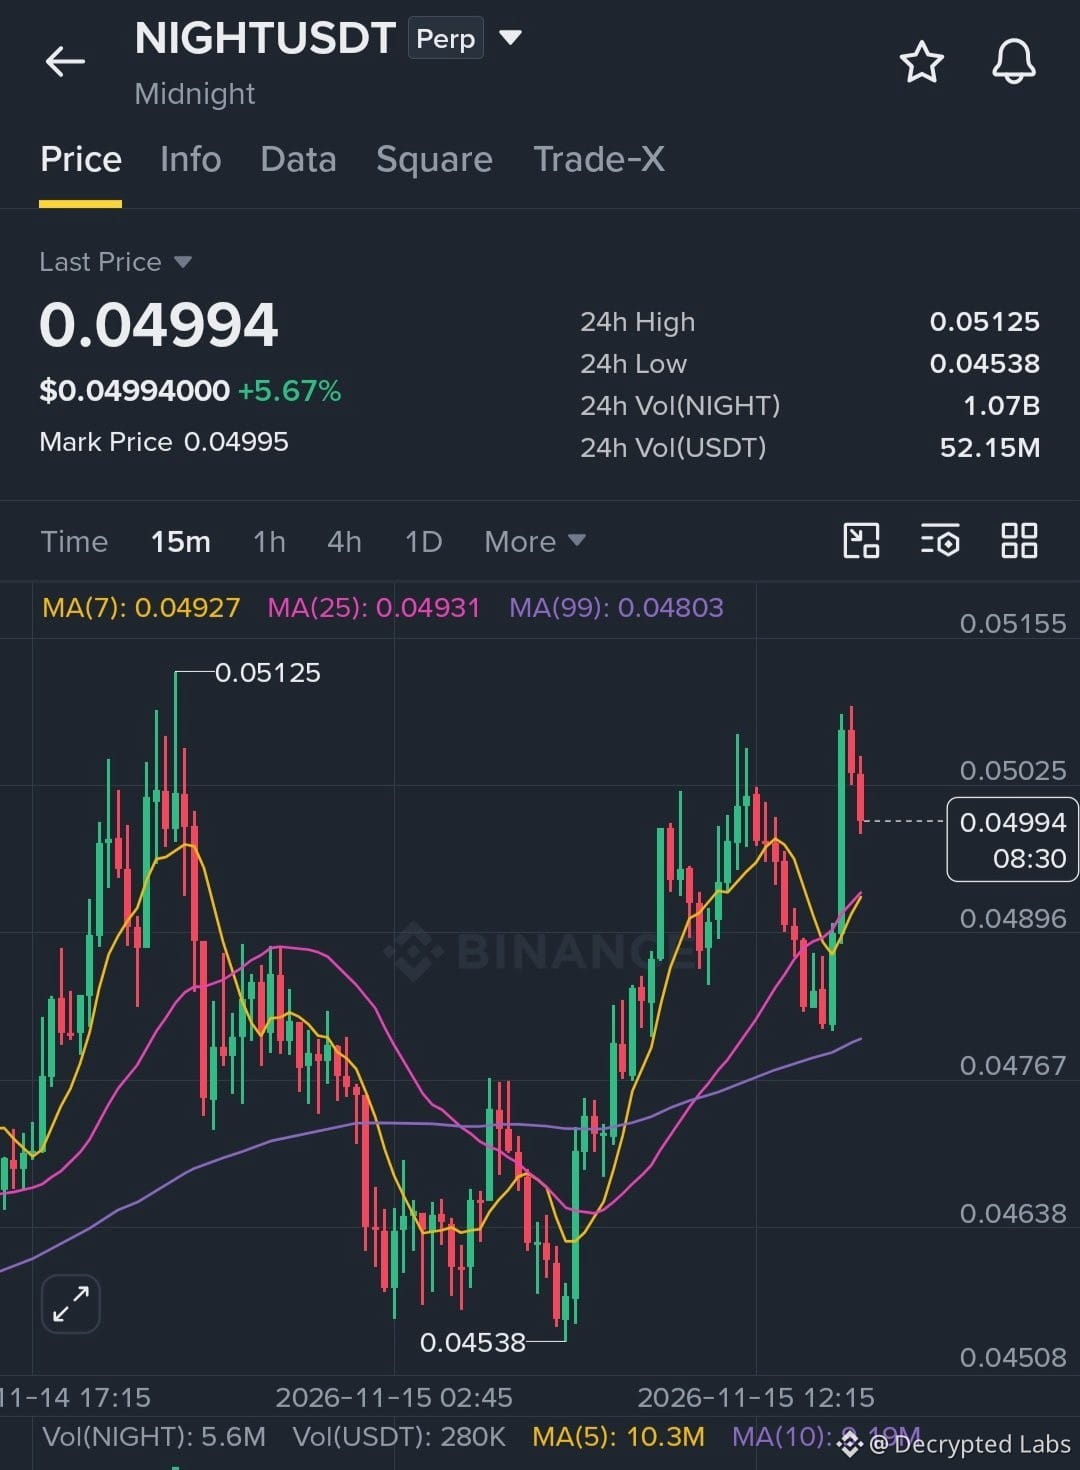
$NIGHT can trigger another big rally
Long $NIGHT
Entry: $0.0475 – $0.0495
SL: $0.0455
TP1: $0.0512
TP2: $0.0525
TP3: $0.0540
TP4: $0.0560
Trade smart. DYOR.
{spot}(NIGHTUSDT)
$NIGHT can trigger another big rally
Long $NIGHT
Entry: $0.0475 – $0.0495
SL: $0.0455
TP1: $0.0512
TP2: $0.0525
TP3: $0.0540
TP4: $0.0560
Trade smart. DYOR.
Long $NIGHT
Entry: $0.0475 – $0.0495
SL: $0.0455
TP1: $0.0512
TP2: $0.0525
TP3: $0.0540
TP4: $0.0560
Trade smart. DYOR.
126
🚨 PRE-MARKET STOCKS WATCHLIST — NOV 16, 2026
$AKAN
Current Price: $1.86
Entry Zone: Above $1.94
Pullback Entry: $1.67–$1.73
Targets: $2.00 → $2.15 → $2.30 → $2.50 → $2.75 → $3.00+
$CLRO
Current Price: $4.28
Entry Zone: $4.50–$4.56
Pullback Entry: $4.10–$4.25
Targets: $4.70 → $4.90 → $5.10 → $5.35 → $5.65 → $6.00+
$VTSI.US
Current Price: $4.27
Entry Zone: $4.31–$4.36 (after holding above $4.30)
Pullback Entry: $4.15–$4.23
Targets: $4.45 → $4.60 → $4.80 → $5.00 → $5.20 → $5.45+
$POLA.US
Current Price: $0.385
Entry Zone: $0.405–$0.420 (after regaining momentum)
Pullback Entry: $0.365–$0.380
Targets: $0.44 → $0.4705 → $0.50 → $0.55 → $0.60+
$GIPR
Current Price: $0.40
Entry Zone: $0.425–$0.435
Pullback Entry: $0.375–$0.390
Targets: $0.46 → $0.50 → $0.55 → $0.60 → $0.68+
$FCUV.US
Current Price: $5.15
Entry Zone: $5.40–$5.55
Pullback Entry: $4.90–$5.05
Targets: $5.75 → $6.00 → $6.35 → $6.70 → $7.05 → $7.50+
============================= =====
CONTINUATION WATCH:
$NMAX
Breakout Level: $9.90–$10.00
$SBC
Reclaim Level: $7.20
Breakout Level: $7.38–$7.50
$NU
Reclaim Level: $13.25
Confirmation: Hold above $13.30
$HTZ
Breakout Level: $1.76–$1.80
⚠️ Wait for confirmation. Don't chase extended candles. Manage risk.
❤️ Enjoyed the watchlist? Follow, like & share.
DYOR
🚨 PRE-MARKET STOCKS WATCHLIST — NOV 16, 2026
$AKAN
Current Price: $1.86
Entry Zone: Above $1.94
Pullback Entry: $1.67–$1.73
Targets: $2.00 → $2.15 → $2.30 → $2.50 → $2.75 → $3.00+
$CLRO
Current Price: $4.28
Entry Zone: $4.50–$4.56
Pullback Entry: $4.10–$4.25
Targets: $4.70 → $4.90 → $5.10 → $5.35 → $5.65 → $6.00+
$VTSI.US
Current Price: $4.27
Entry Zone: $4.31–$4.36 (after holding above $4.30)
Pullback Entry: $4.15–$4.23
Targets: $4.45 → $4.60 → $4.80 → $5.00 → $5.20 → $5.45+
$POLA.US
Current Price: $0.385
Entry Zone: $0.405–$0.420 (after regaining momentum)
Pullback Entry: $0.365–$0.380
Targets: $0.44 → $0.4705 → $0.50 → $0.55 → $0.60+
$GIPR
Current Price: $0.40
Entry Zone: $0.425–$0.435
Pullback Entry: $0.375–$0.390
Targets: $0.46 → $0.50 → $0.55 → $0.60 → $0.68+
$FCUV.US
Current Price: $5.15
Entry Zone: $5.40–$5.55
Pullback Entry: $4.90–$5.05
Targets: $5.75 → $6.00 → $6.35 → $6.70 → $7.05 → $7.50+
============================= =====
CONTINUATION WATCH:
$NMAX
Breakout Level: $9.90–$10.00
$SBC
Reclaim Level: $7.20
Breakout Level: $7.38–$7.50
$NU
Reclaim Level: $13.25
Confirmation: Hold above $13.30
$HTZ
Breakout Level: $1.76–$1.80
⚠️ Wait for confirmation. Don't chase extended candles. Manage risk.
❤️ Enjoyed the watchlist? Follow, like & share.
DYOR
$AKAN
Current Price: $1.86
Entry Zone: Above $1.94
Pullback Entry: $1.67–$1.73
Targets: $2.00 → $2.15 → $2.30 → $2.50 → $2.75 → $3.00+
$CLRO
Current Price: $4.28
Entry Zone: $4.50–$4.56
Pullback Entry: $4.10–$4.25
Targets: $4.70 → $4.90 → $5.10 → $5.35 → $5.65 → $6.00+
$VTSI.US
Current Price: $4.27
Entry Zone: $4.31–$4.36 (after holding above $4.30)
Pullback Entry: $4.15–$4.23
Targets: $4.45 → $4.60 → $4.80 → $5.00 → $5.20 → $5.45+
$POLA.US
Current Price: $0.385
Entry Zone: $0.405–$0.420 (after regaining momentum)
Pullback Entry: $0.365–$0.380
Targets: $0.44 → $0.4705 → $0.50 → $0.55 → $0.60+
$GIPR
Current Price: $0.40
Entry Zone: $0.425–$0.435
Pullback Entry: $0.375–$0.390
Targets: $0.46 → $0.50 → $0.55 → $0.60 → $0.68+
$FCUV.US
Current Price: $5.15
Entry Zone: $5.40–$5.55
Pullback Entry: $4.90–$5.05
Targets: $5.75 → $6.00 → $6.35 → $6.70 → $7.05 → $7.50+
============================= =====
CONTINUATION WATCH:
$NMAX
Breakout Level: $9.90–$10.00
$SBC
Reclaim Level: $7.20
Breakout Level: $7.38–$7.50
$NU
Reclaim Level: $13.25
Confirmation: Hold above $13.30
$HTZ
Breakout Level: $1.76–$1.80
⚠️ Wait for confirmation. Don't chase extended candles. Manage risk.
❤️ Enjoyed the watchlist? Follow, like & share.
DYOR
POLAUS+4.06%
VTSIUS-1.81%
FCUVUS-5.38%
466
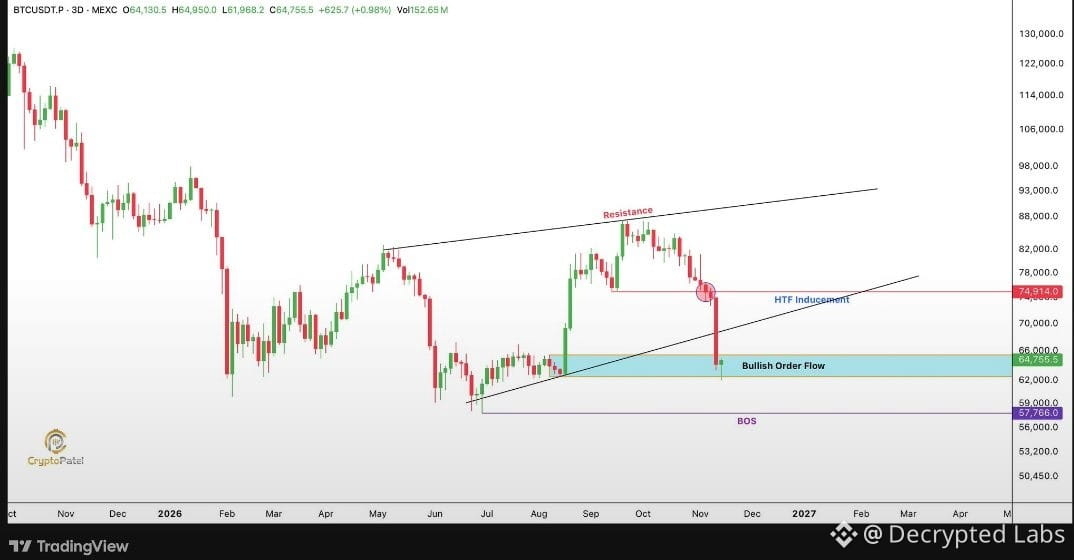
$BTC ONE SUPPORT ZONE COULD DECIDE WHETHER WE SEE $100K OR $40K NEXT.
Bitcoin has entered a key Bullish Order Block + Bullish Order Flow zone.
Here's the simple breakdown:
If $BTC holds above $62,499 on HTF candle closes, we can expect a recovery toward $75K, followed by a potential move toward new highs and eventually $100K.
But if #BTC closes below $62,499 on a HTF, things could turn ugly.
Watch the $57,766 BOS level. A HTF close below this level could open the door toward $50K–$40K.
I gave my exit signal above $85K. Hopefully, you booked profits on the way down and protected your hard-earned capital instead of blindly holding longs.
No need to thank me. Just remember:
Follow the charts, respect the levels, and make your decisions carefully.
Your capital comes first. Always. DYOR.
$BTC ONE SUPPORT ZONE COULD DECIDE WHETHER WE SEE $100K OR $40K NEXT.
Bitcoin has entered a key Bullish Order Block + Bullish Order Flow zone.
Here's the simple breakdown:
If $BTC holds above $62,499 on HTF candle closes, we can expect a recovery toward $75K, followed by a potential move toward new highs and eventually $100K.
But if #BTC closes below $62,499 on a HTF, things could turn ugly.
Watch the $57,766 BOS level. A HTF close below this level could open the door toward $50K–$40K.
I gave my exit signal above $85K. Hopefully, you booked profits on the way down and protected your hard-earned capital instead of blindly holding longs.
No need to thank me. Just remember:
Follow the charts, respect the levels, and make your decisions carefully.
Your capital comes first. Always. DYOR.
Bitcoin has entered a key Bullish Order Block + Bullish Order Flow zone.
Here's the simple breakdown:
If $BTC holds above $62,499 on HTF candle closes, we can expect a recovery toward $75K, followed by a potential move toward new highs and eventually $100K.
But if #BTC closes below $62,499 on a HTF, things could turn ugly.
Watch the $57,766 BOS level. A HTF close below this level could open the door toward $50K–$40K.
I gave my exit signal above $85K. Hopefully, you booked profits on the way down and protected your hard-earned capital instead of blindly holding longs.
No need to thank me. Just remember:
Follow the charts, respect the levels, and make your decisions carefully.
Your capital comes first. Always. DYOR.
209
Log in to explore more content
Join global crypto users on Binance Square
⚡️ Get latest and useful information about crypto.
💬 Trusted by the world’s largest crypto exchange.
👍 Discover real insights from verified creators.
Email / Phone number
Trending Topics
BTCRemainsUnderPressureAfterHawkishFOMCMinutes
33,374 views
496 Discussing
FOMC Minutes | Fed Minutes Show Almost All Officials Expect More Rate Hikes, With Some Open to a Larger December Move
Binance News
·45 Likes
·53.9k views
AnthropicToDebutAfter$83IPOPricing
9,649 views
59 Discussing
NvidiaBoardReportedlySplitOverHuang’sReturn
10,276 views
170 Discussing