
ALPHA_SPOT_X
50 Posts

ALPHA_SPOT_X
Report
Block User
Daniel | Pro Spot Trader
3yrs experience 📚 On the path to mastery📈
Writing my own legend💎
no futures🚫
$1M goal🎯
Follow for smart & focused trading🔔
Open Trade
Occasional Trader
4.5 Years
0 Following
156 Followers
217 Liked
Posts
Portfolio
All
Quotes
PINNED
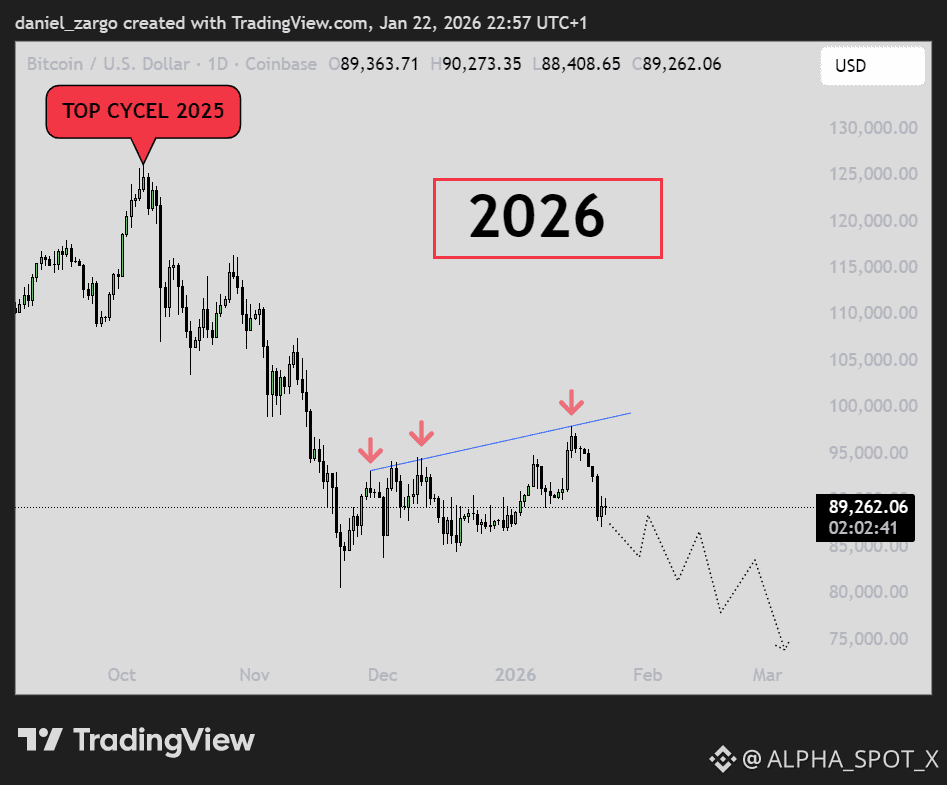
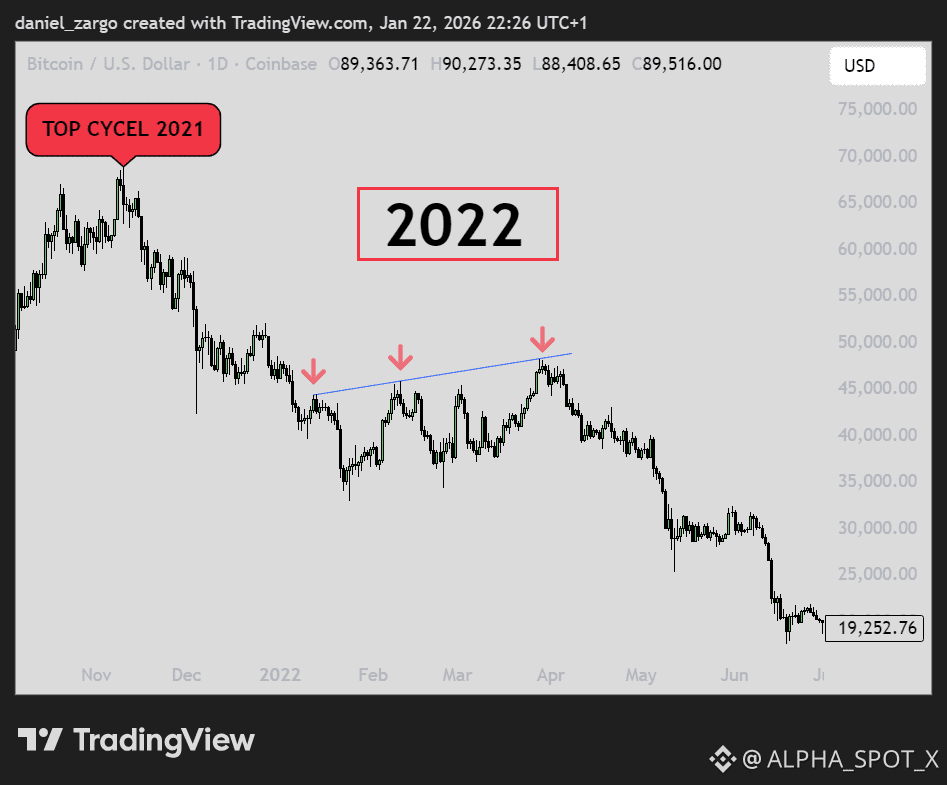
·
--
Bearish
#USDT.D
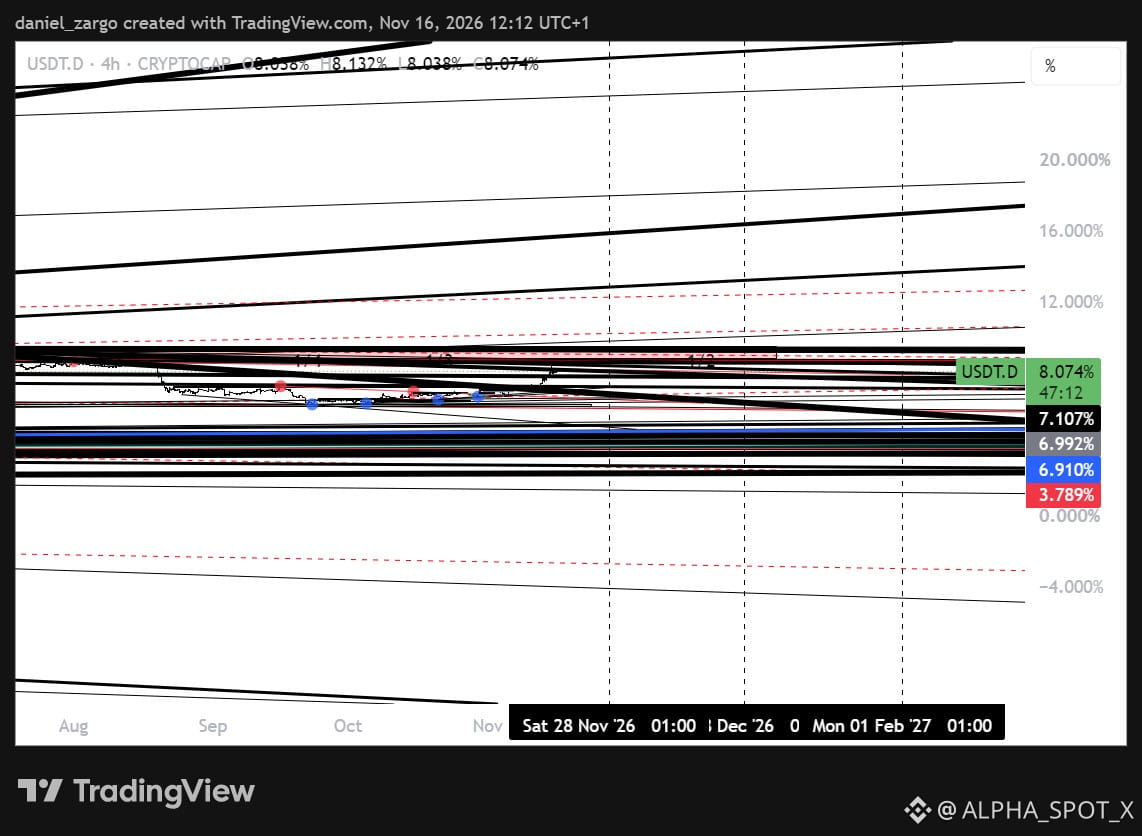
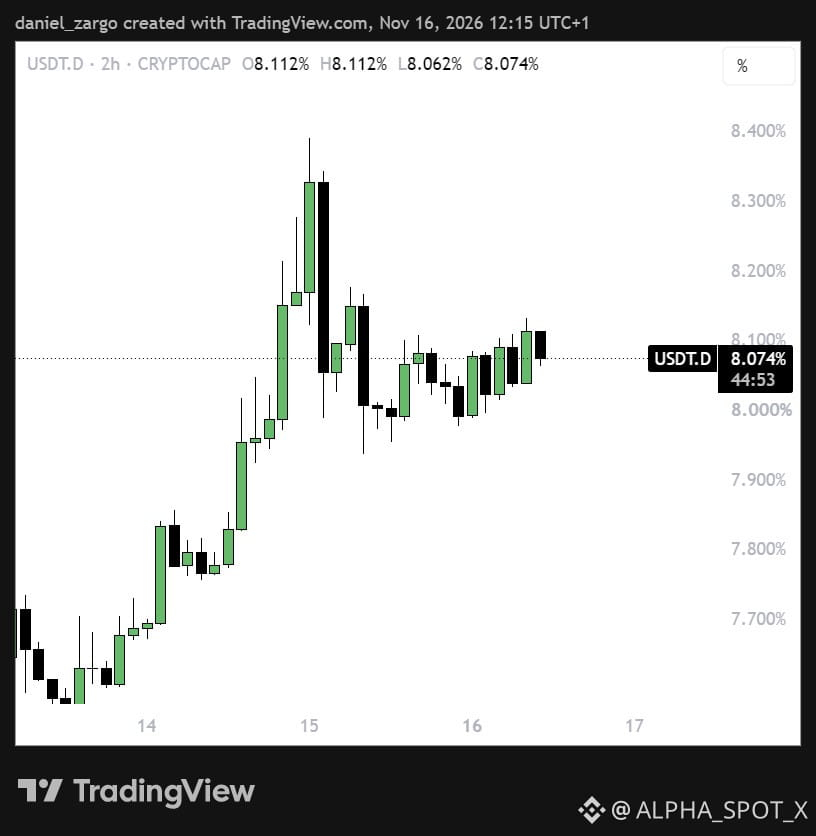
What if I told you that at the 7.810% level you should start worrying about your portfolio Its a critical level$ Good luck!
#milioner_trader
#USDT.D
What if I told you that at the 7.810% level you should start worrying about your portfolio Its a critical level$ Good luck!
#milioner_trader
What if I told you that at the 7.810% level you should start worrying about your portfolio Its a critical level$ Good luck!
#milioner_trader
89
·
--
Bearish
$ZEC
👀
$ZEC
👀
👀
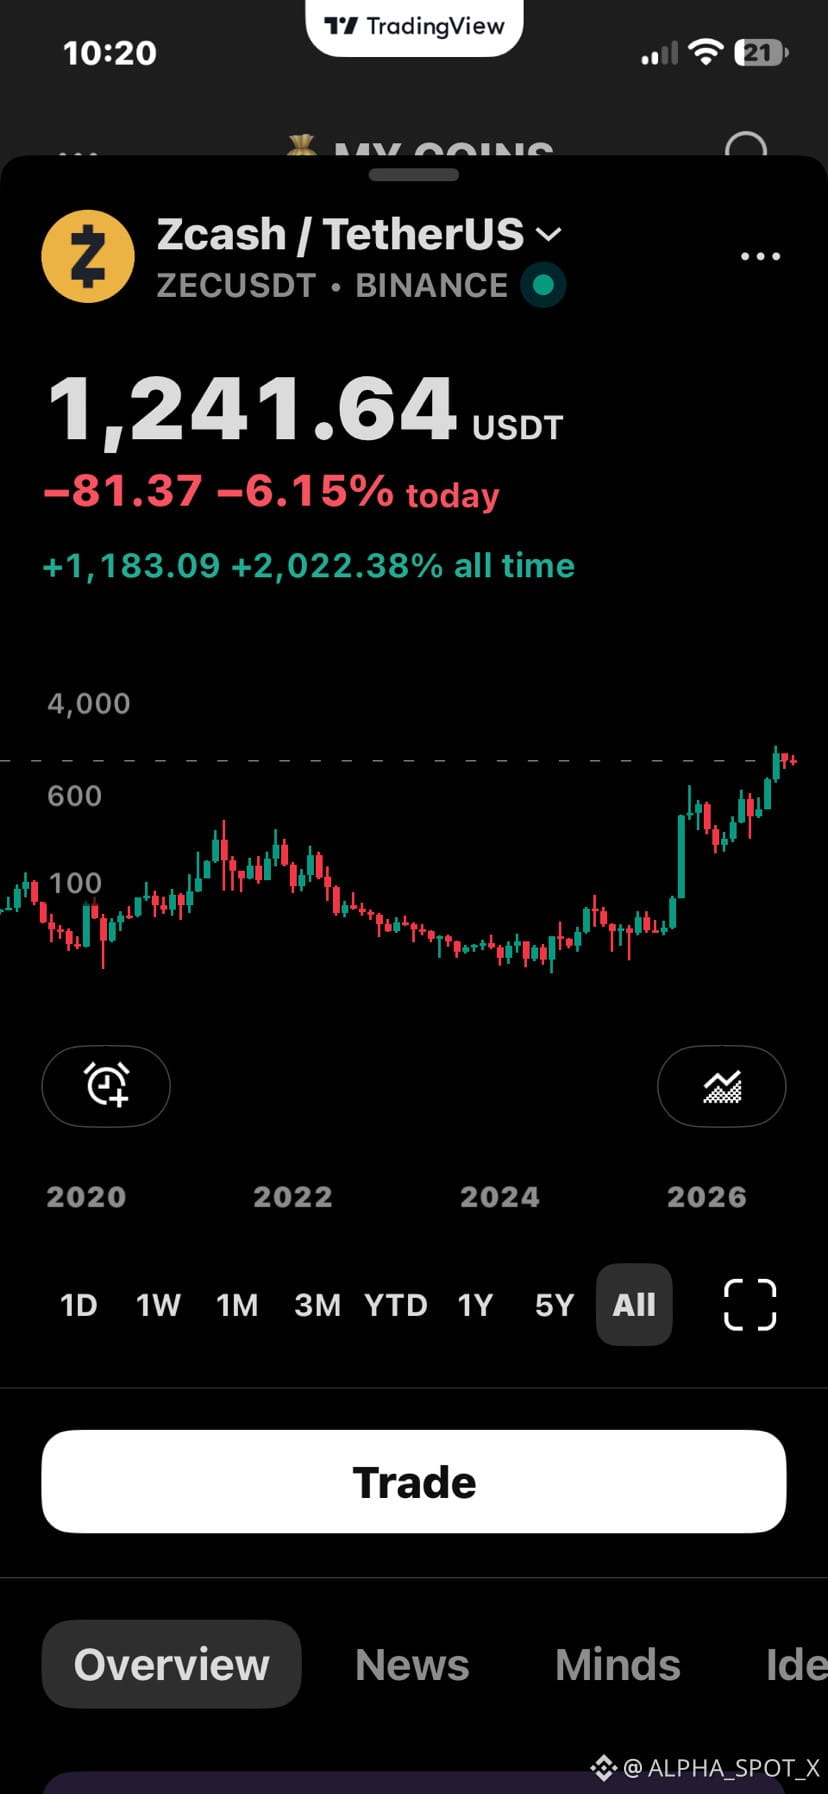
ALPHA_SPOT_X
·
--
Bearish$ZEC
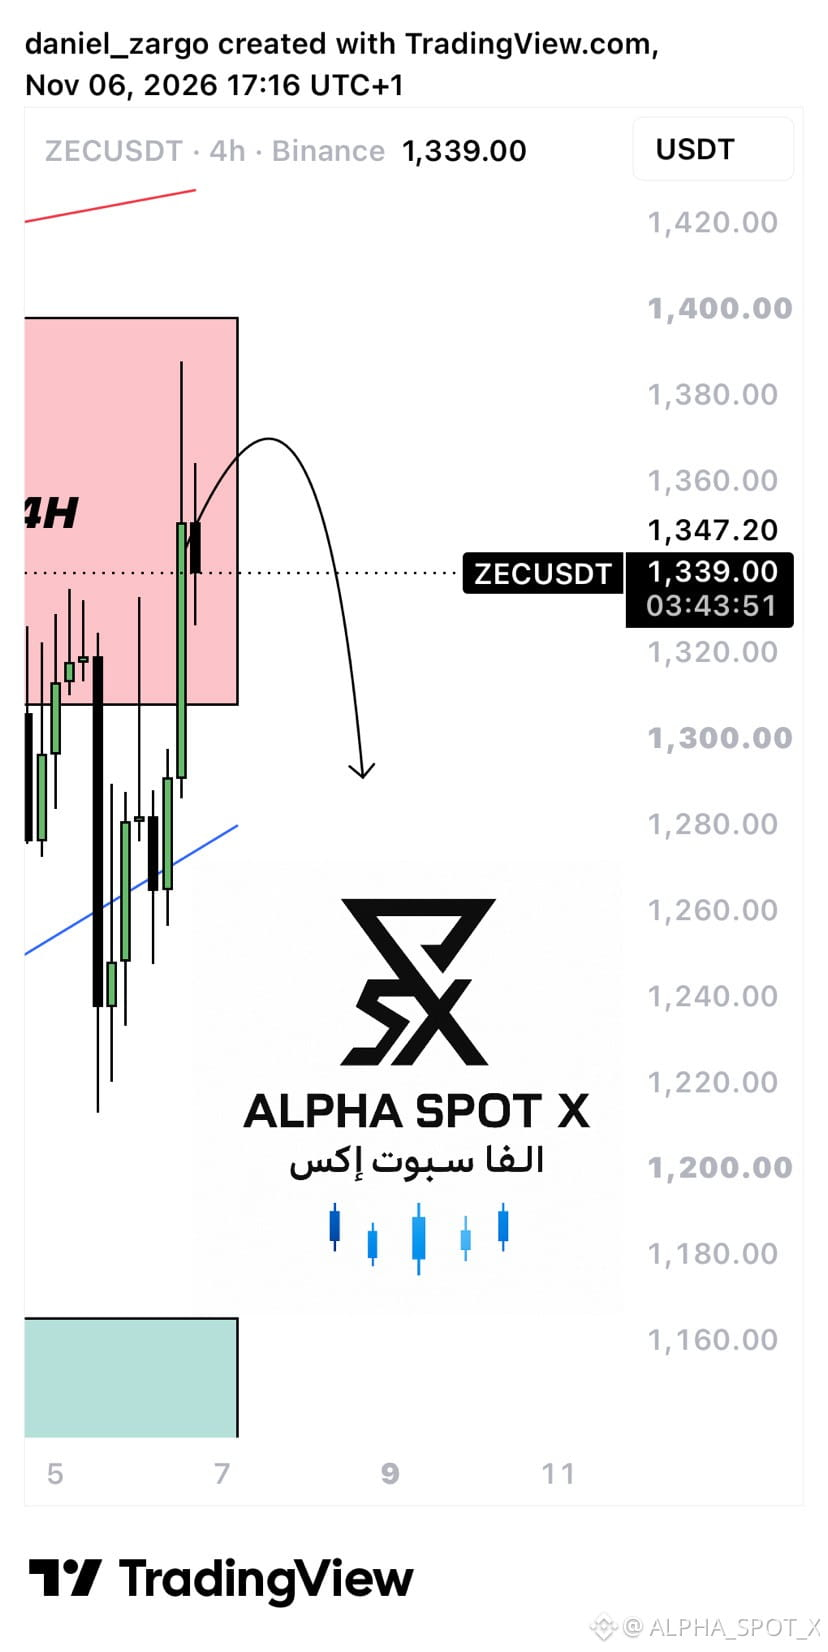
🔴 ZEC/USDT — Bearish Setup |
4H
Important Timeframe to Watch Now.
#zec
🔴 ZEC/USDT — Bearish Setup |
4H
Important Timeframe to Watch Now.
#zec
112
·
--
Bearish
$ZEC
🔴 ZEC/USDT — Bearish Setup |
4H
Important Timeframe to Watch Now.
#zec
$ZEC
🔴 ZEC/USDT — Bearish Setup |
4H
Important Timeframe to Watch Now.
#zec
🔴 ZEC/USDT — Bearish Setup |
4H
Important Timeframe to Watch Now.
#zec
1
2
467
·
--
Bullish
$OP
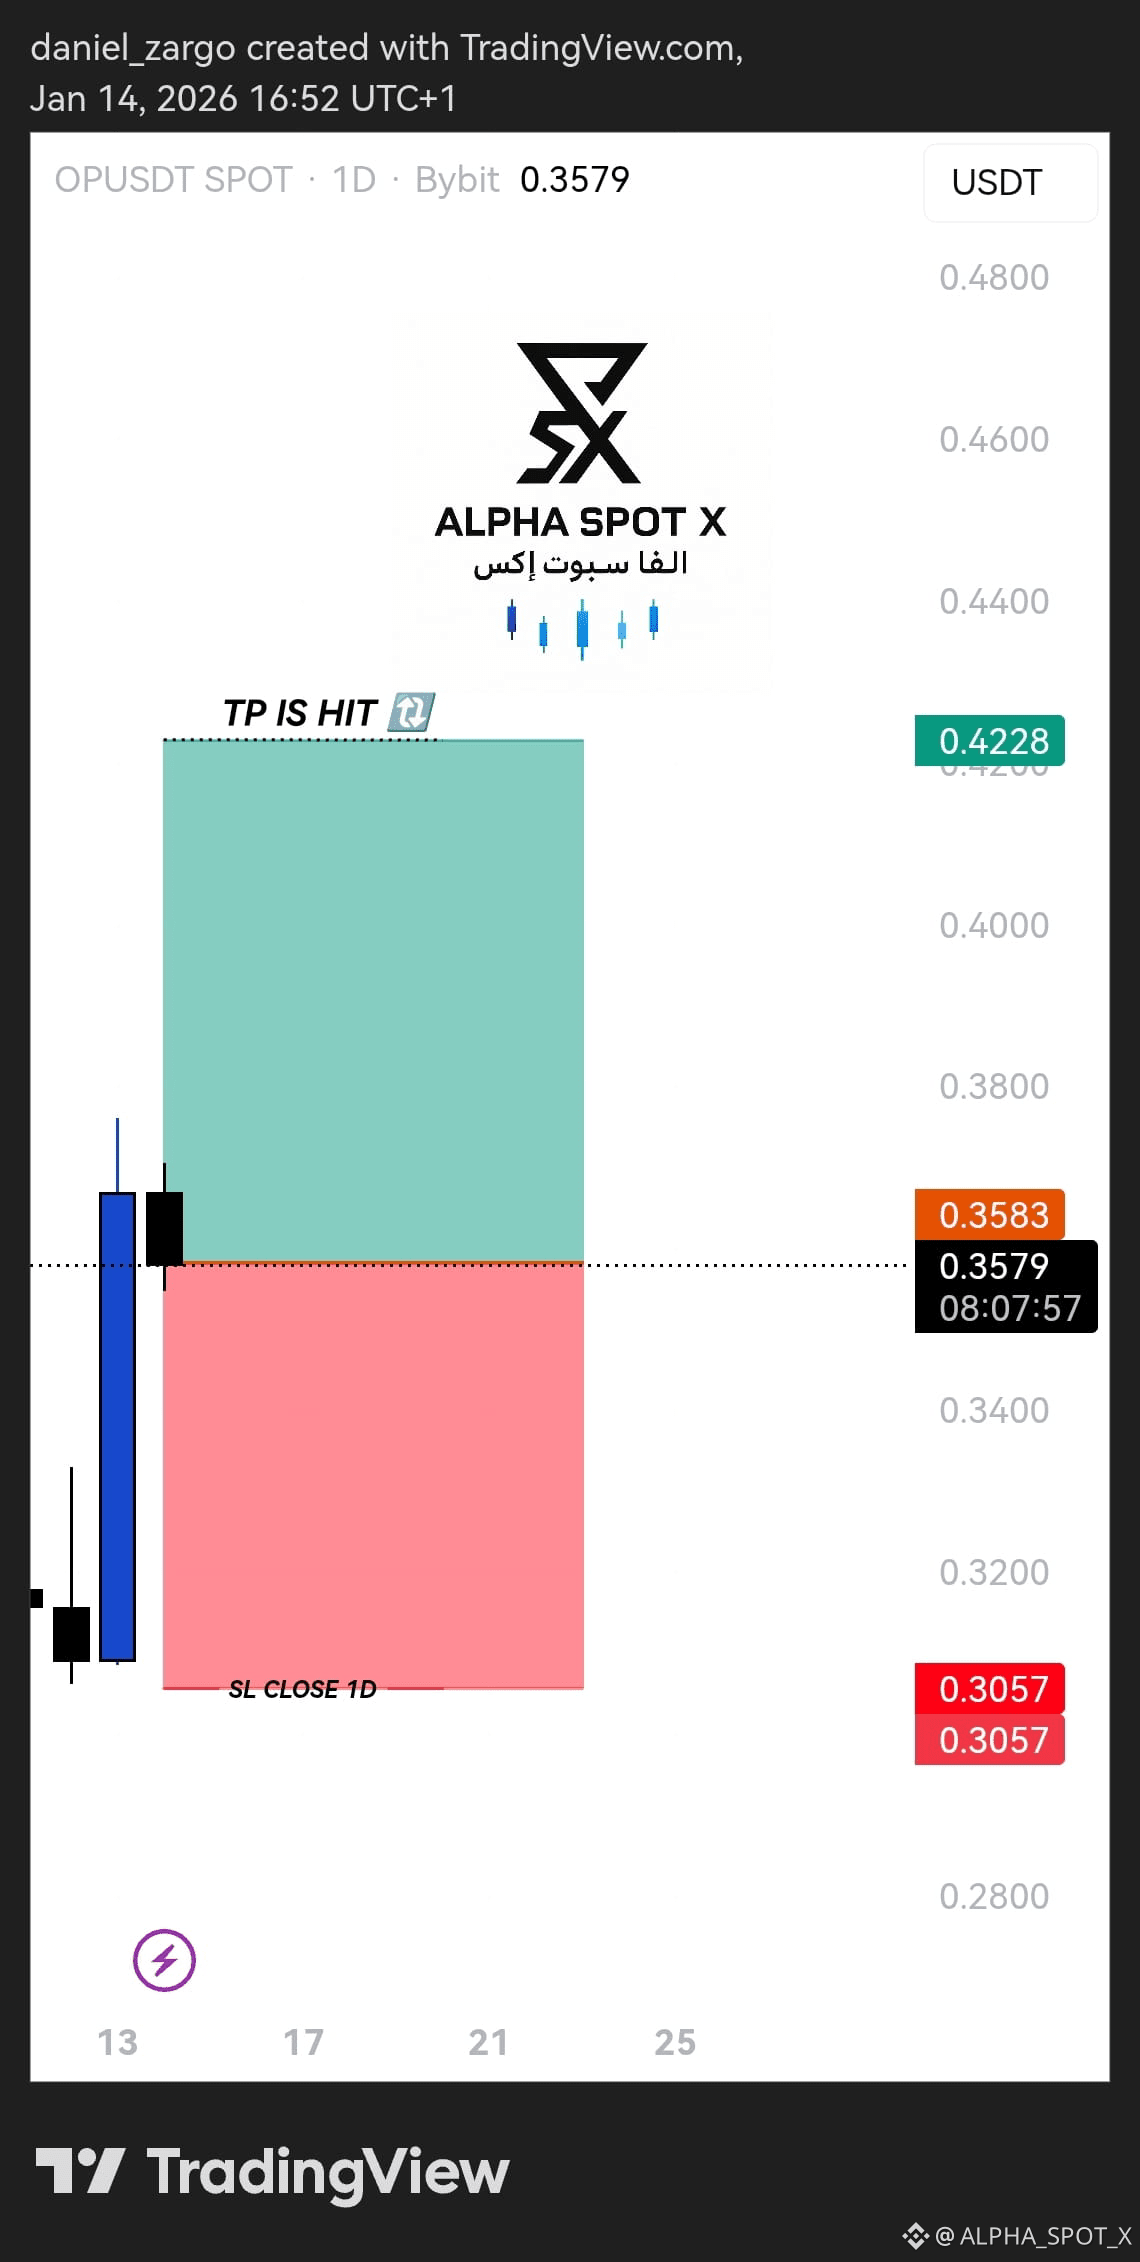
🟢 BUY AT: 0.3583
⚪ TP AT: 0.4228
🔴 SL CLOSE 1D AT: 0.3057
الصفقة فيها مخاطرة ، دخولك وخروجك على 🔵
مسؤوليتك.
#alpha_spot_X
$OP
🟢 BUY AT: 0.3583
⚪ TP AT: 0.4228
🔴 SL CLOSE 1D AT: 0.3057
الصفقة فيها مخاطرة ، دخولك وخروجك على 🔵
مسؤوليتك.
#alpha_spot_X
🟢 BUY AT: 0.3583
⚪ TP AT: 0.4228
🔴 SL CLOSE 1D AT: 0.3057
الصفقة فيها مخاطرة ، دخولك وخروجك على 🔵
مسؤوليتك.
#alpha_spot_X
2
497
·
--
Bearish
ALPHA_SPOT_X
·
--
$ZEC
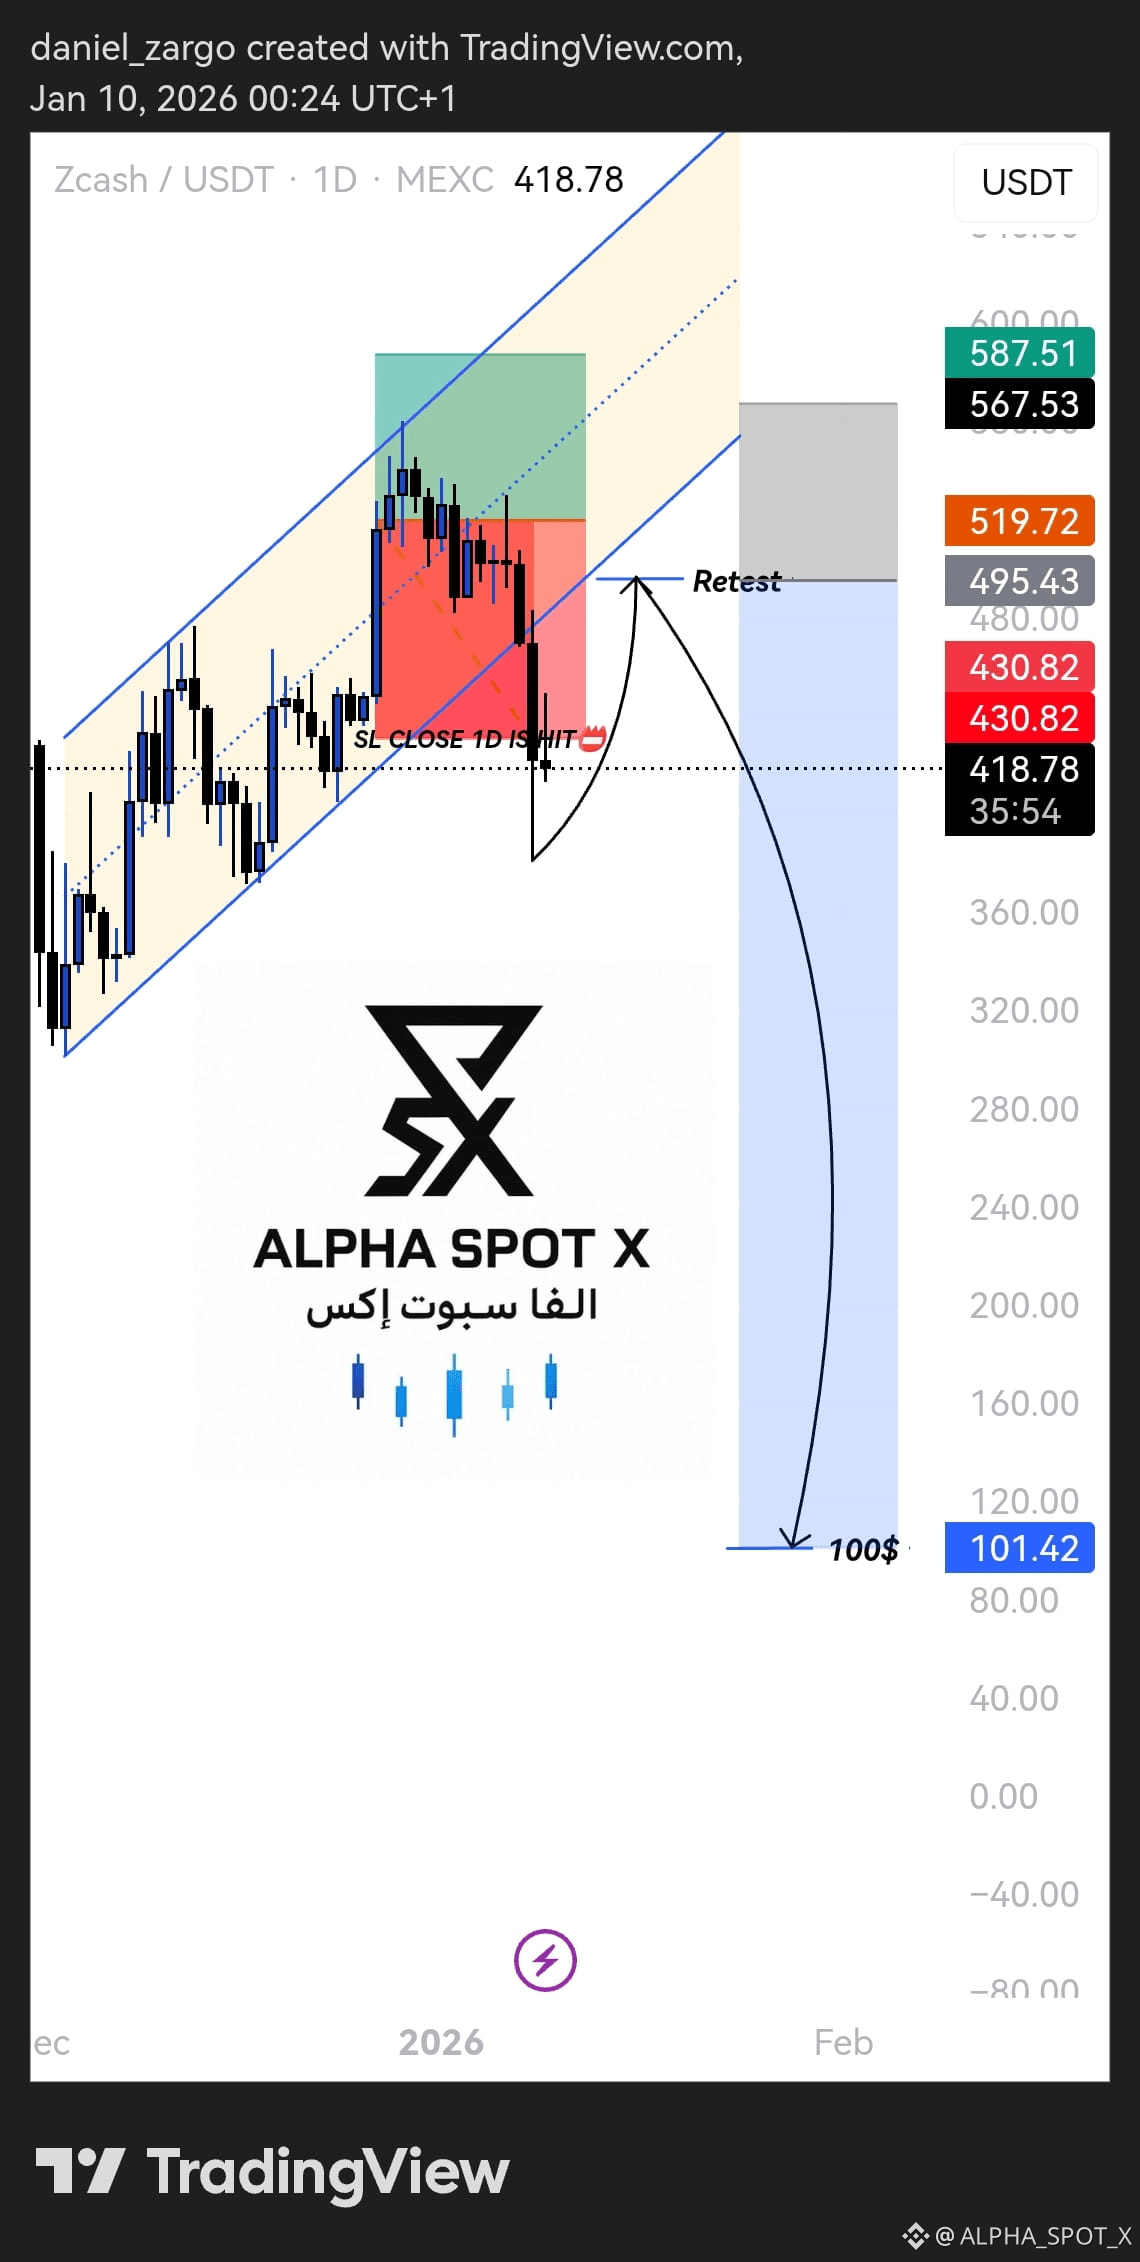
BUY AT: NOW MARKET🟢
TP AT: 587.89 ▫️
SL CLOSE 1D AT: 443.25 🔴
🔴 الصفقة فيها مخاطرة ، دخولك وخروجك على مسؤوليتك.
#alpha_spot_X
BUY AT: NOW MARKET🟢
TP AT: 587.89 ▫️
SL CLOSE 1D AT: 443.25 🔴
🔴 الصفقة فيها مخاطرة ، دخولك وخروجك على مسؤوليتك.
#alpha_spot_X
1
412
·
--
Bullish
$BCH
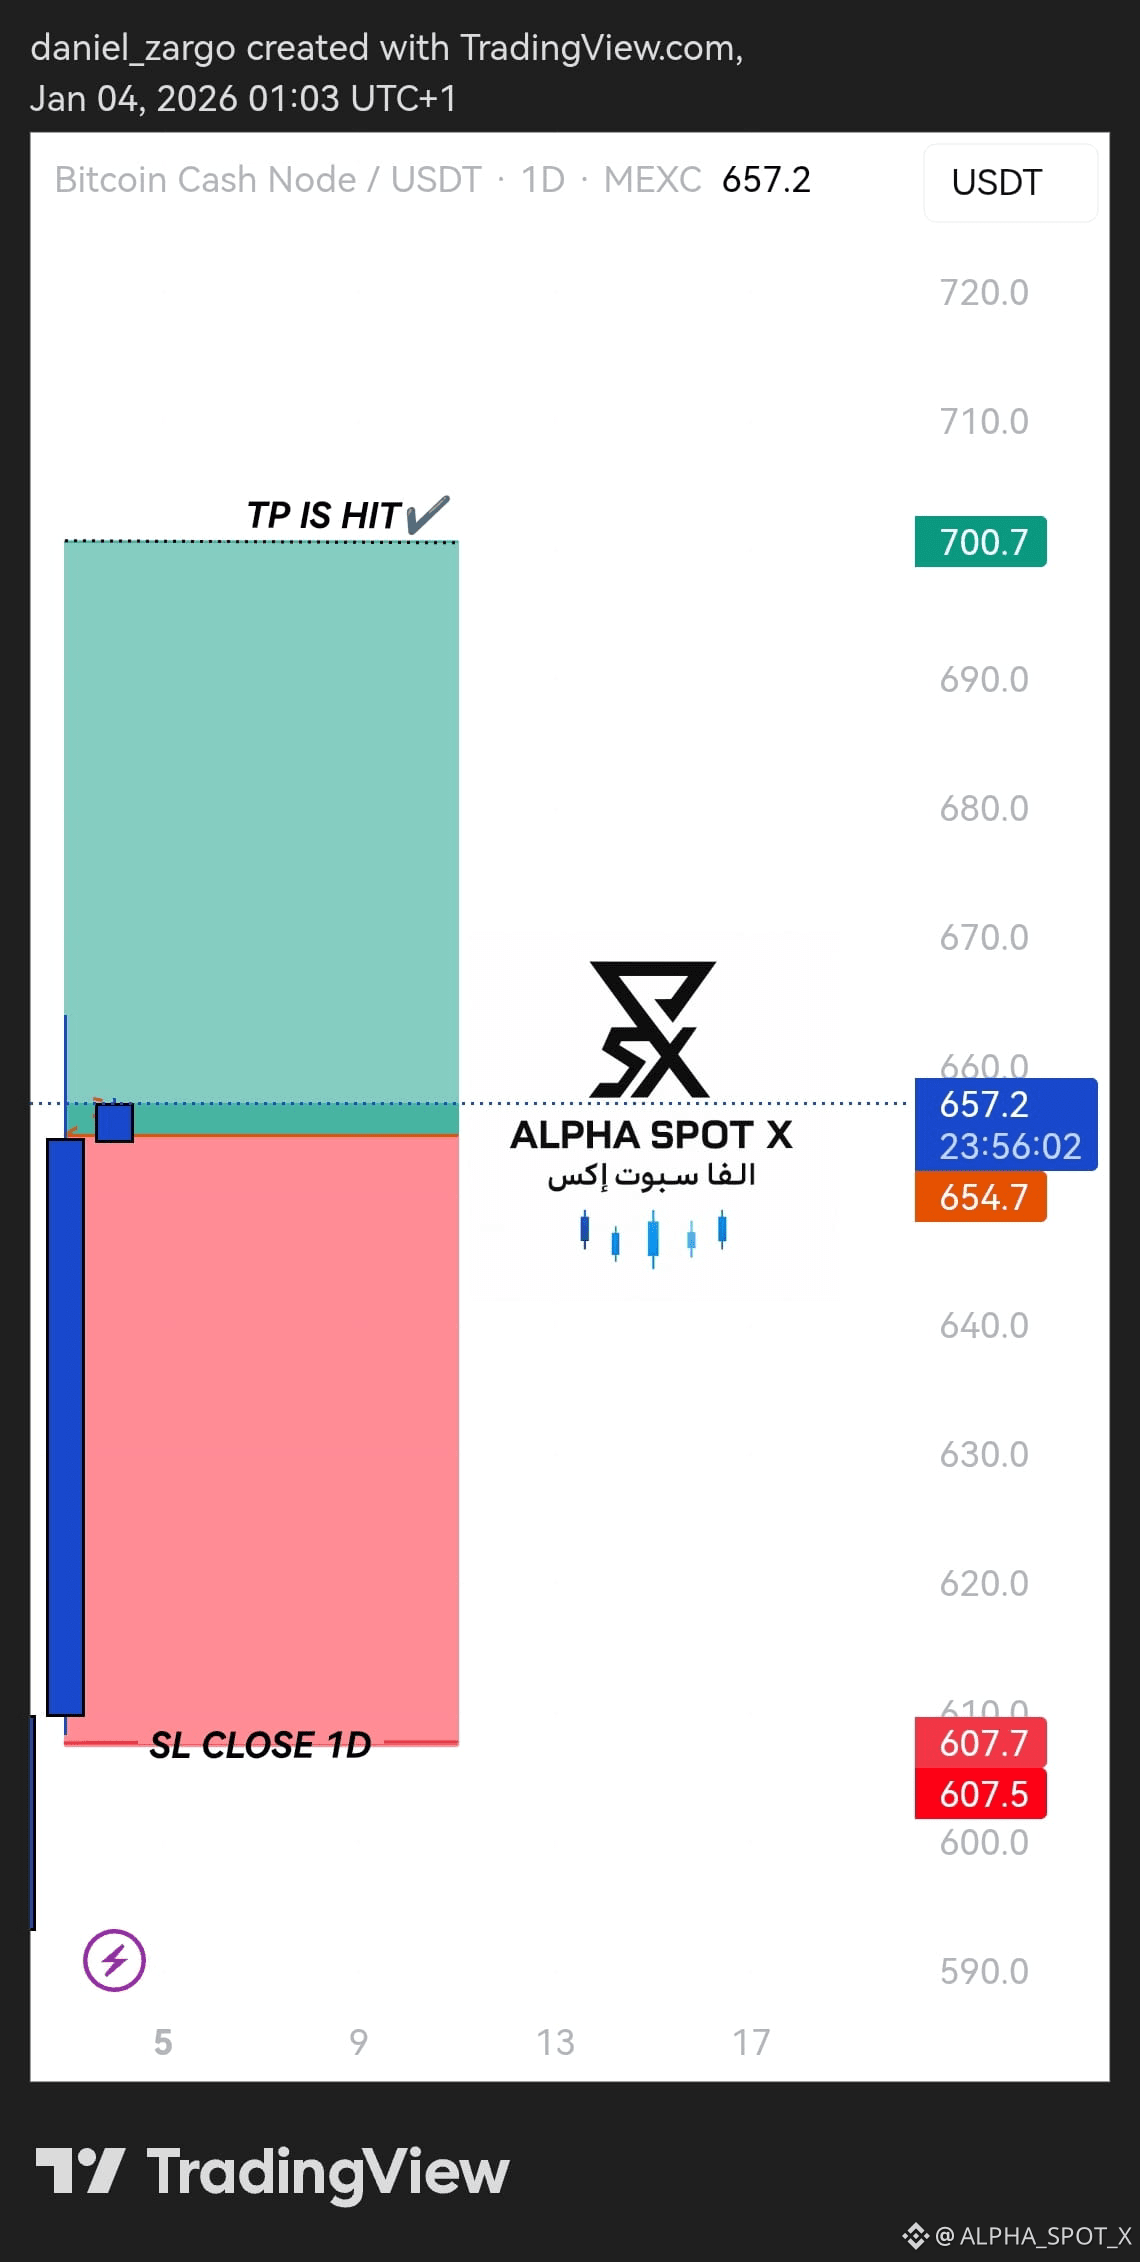
🟢 BUY AT: NOW MARKET
⚪ TP AT: 700.7
🔴 SL CLOSE 1D AT: 607.05
The trade carries risks, your entry and exit are your🔵
responsibility.
#alpha_spot_X
$BCH
🟢 BUY AT: NOW MARKET
⚪ TP AT: 700.7
🔴 SL CLOSE 1D AT: 607.05
The trade carries risks, your entry and exit are your🔵
responsibility.
#alpha_spot_X
🟢 BUY AT: NOW MARKET
⚪ TP AT: 700.7
🔴 SL CLOSE 1D AT: 607.05
The trade carries risks, your entry and exit are your🔵
responsibility.
#alpha_spot_X
165
·
--
Bullish
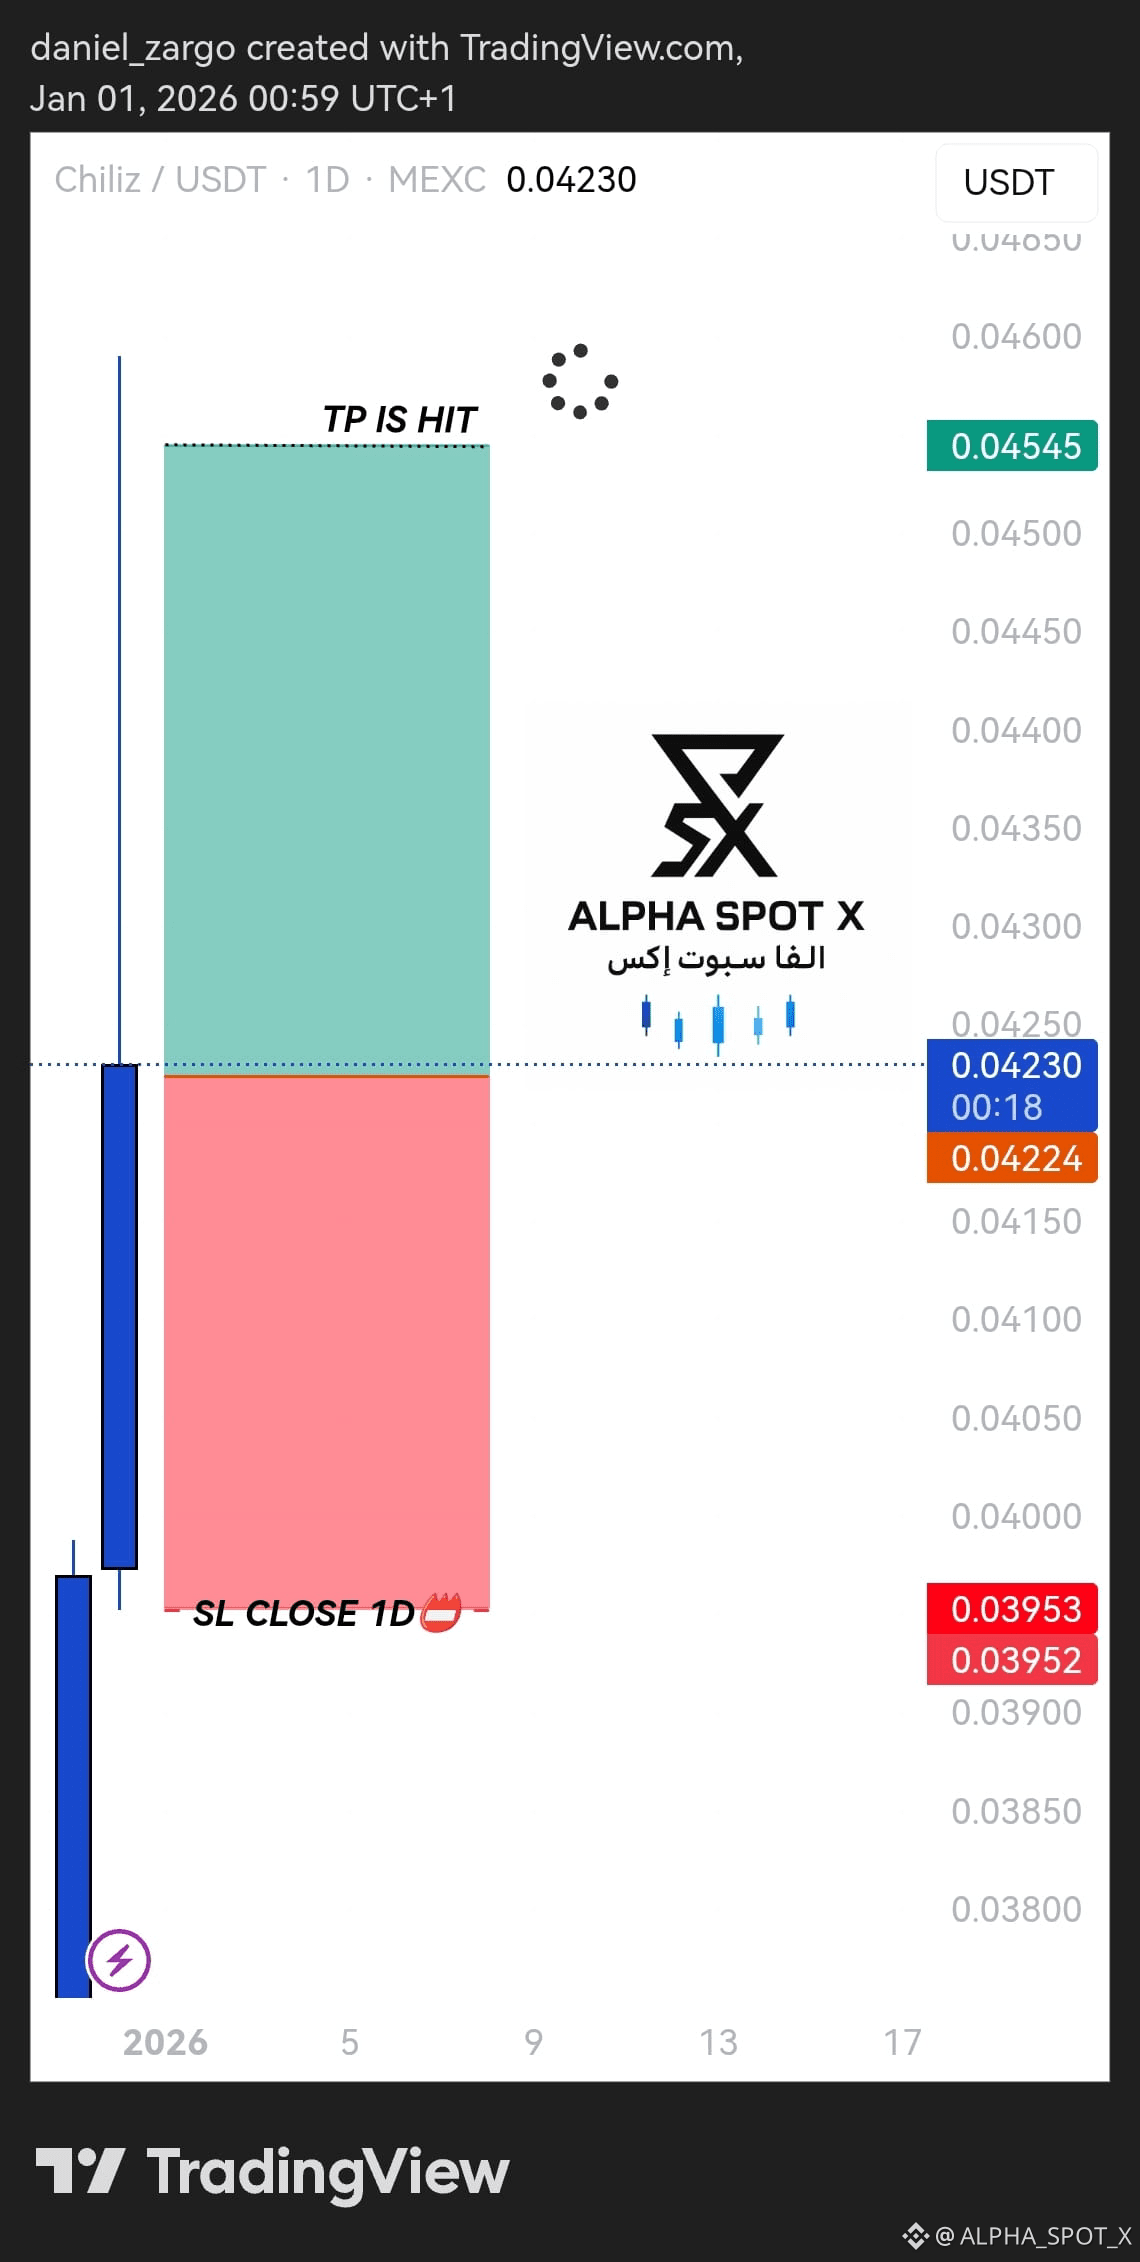
$CHZ
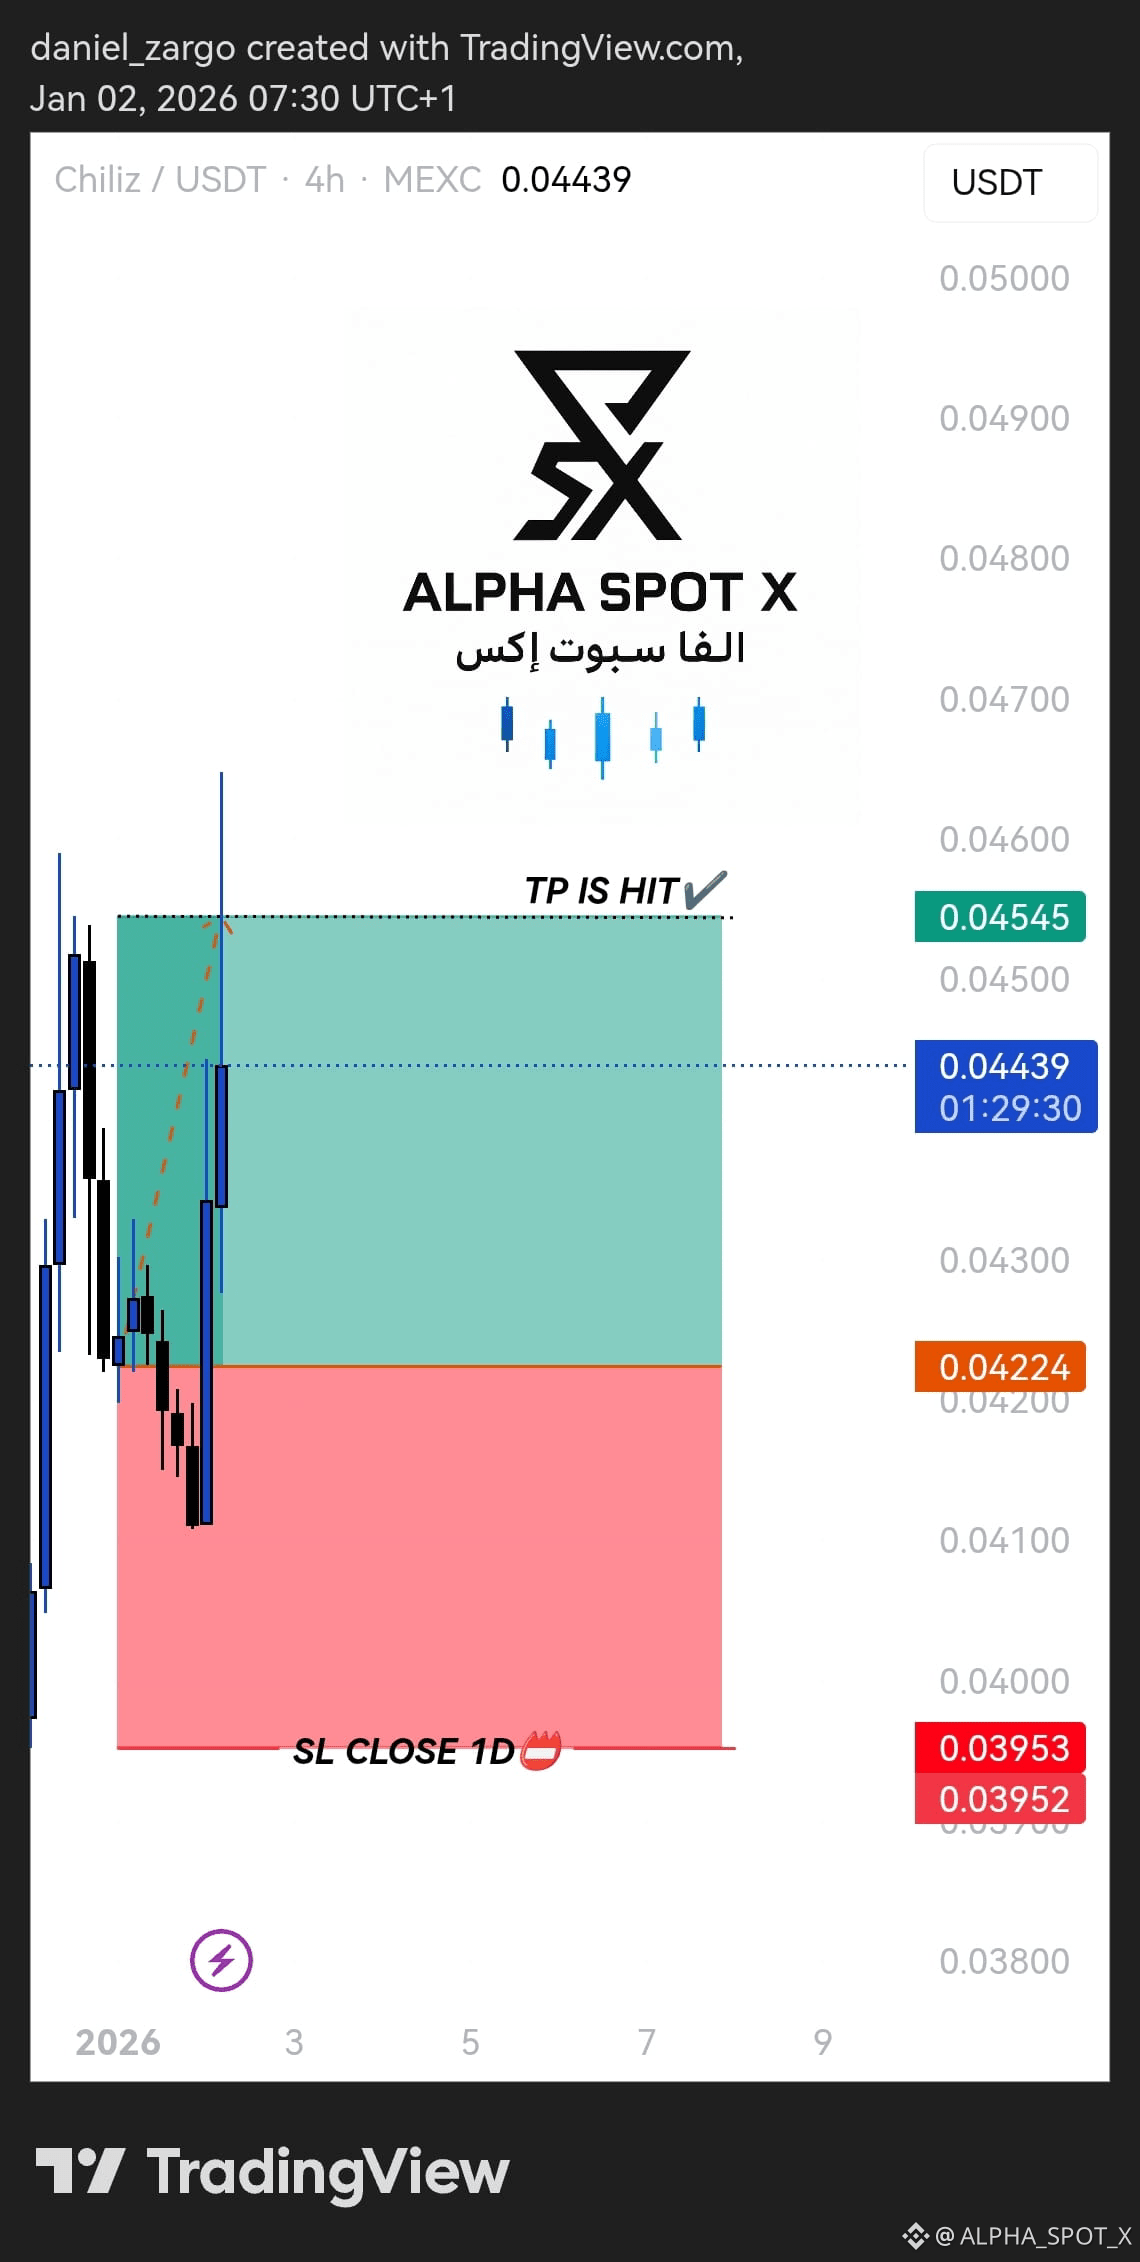
BUY AT: NOW MARKET🟢
TP AT: 0.04545 ◽
SL CLOSE 1D AT: 0.03952 🔴
🔴 الصفقة فيها مخاطرة ، دخولك وخروجك على مسؤوليتك.
#alpha_spot_X
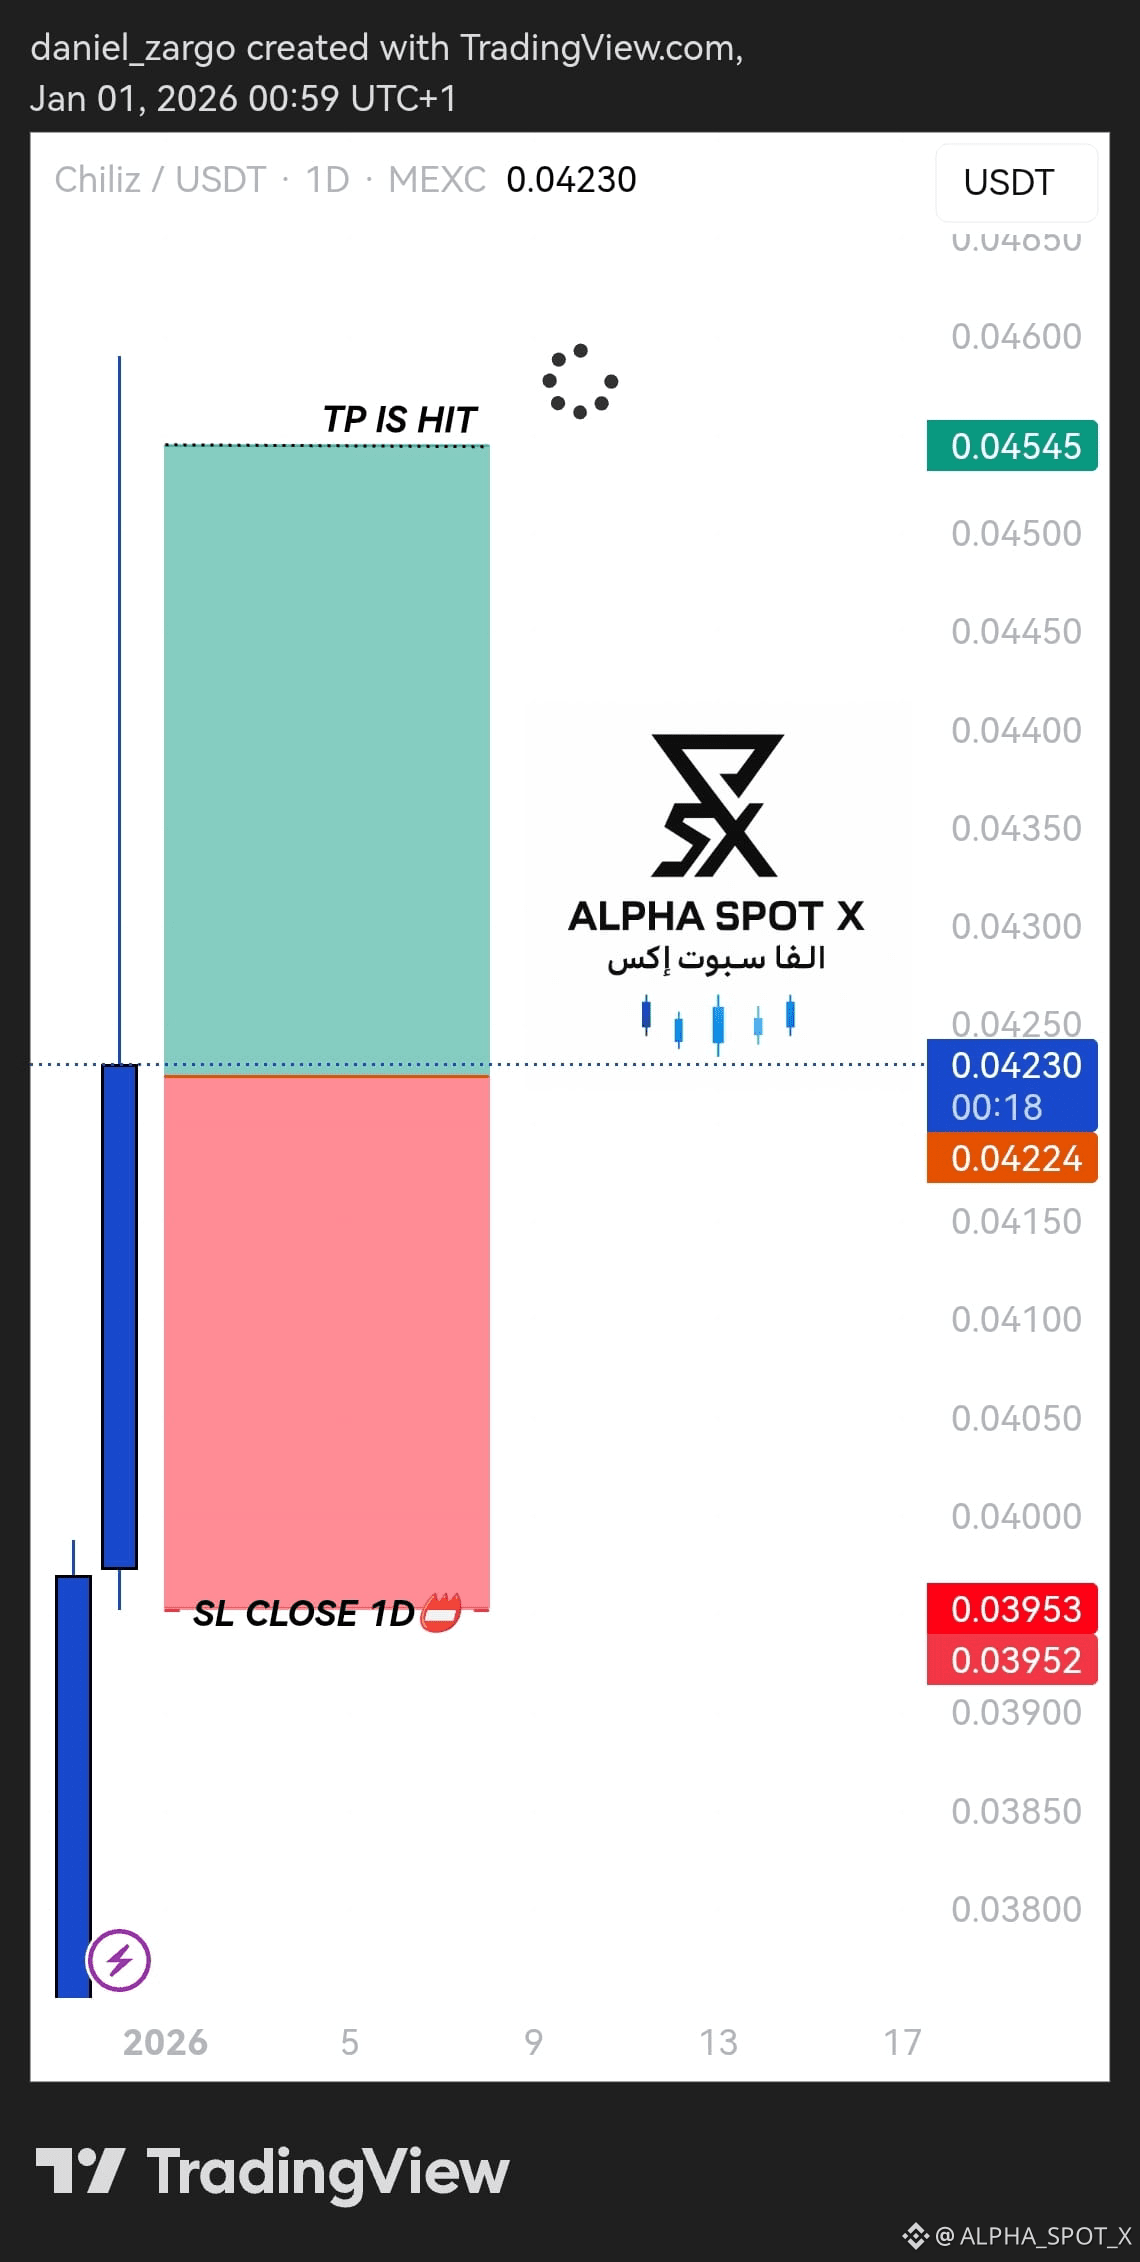
$CHZ
BUY AT: NOW MARKET🟢
TP AT: 0.04545 ◽
SL CLOSE 1D AT: 0.03952 🔴
🔴 الصفقة فيها مخاطرة ، دخولك وخروجك على مسؤوليتك.
#alpha_spot_X
BUY AT: NOW MARKET🟢
TP AT: 0.04545 ◽
SL CLOSE 1D AT: 0.03952 🔴
🔴 الصفقة فيها مخاطرة ، دخولك وخروجك على مسؤوليتك.
#alpha_spot_X
1
258
·
--
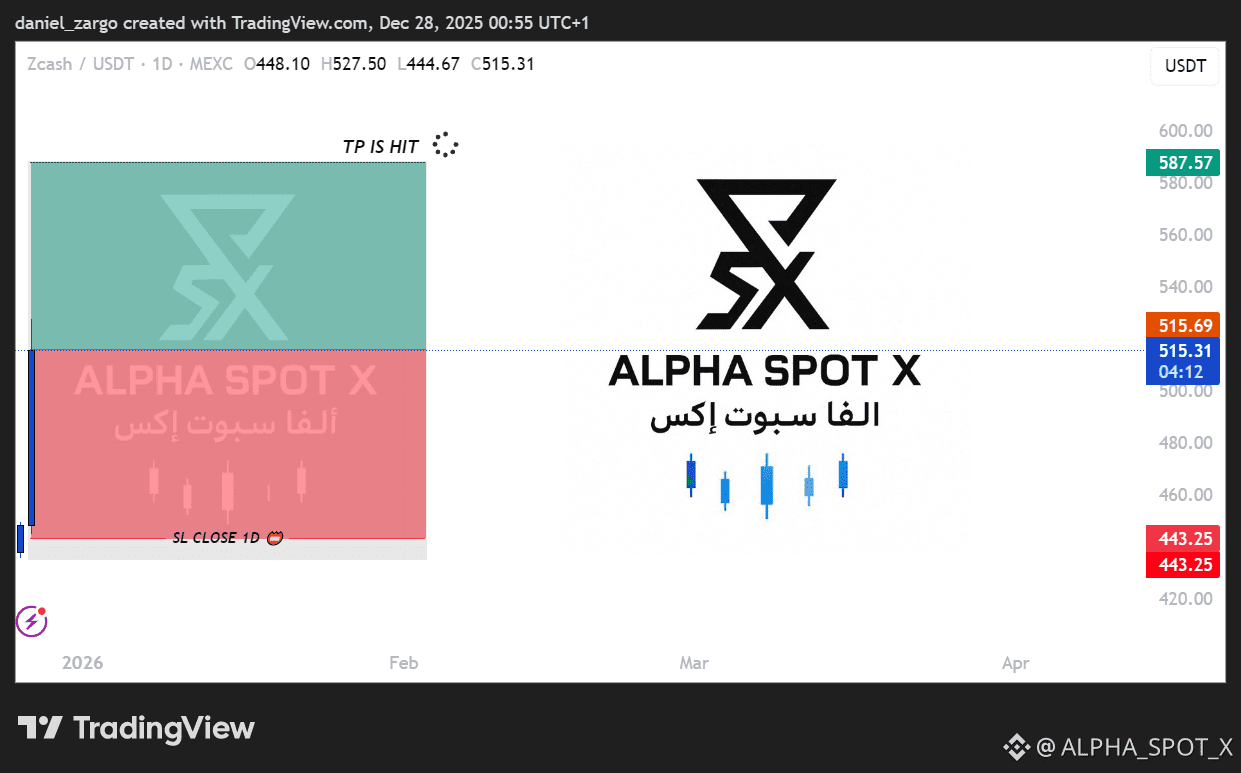
$ZEC
BUY AT: NOW MARKET🟢
TP AT: 587.89 ▫️
SL CLOSE 1D AT: 443.25 🔴
🔴 الصفقة فيها مخاطرة ، دخولك وخروجك على مسؤوليتك.
#alpha_spot_X
$ZEC
BUY AT: NOW MARKET🟢
TP AT: 587.89 ▫️
SL CLOSE 1D AT: 443.25 🔴
🔴 الصفقة فيها مخاطرة ، دخولك وخروجك على مسؤوليتك.
#alpha_spot_X
BUY AT: NOW MARKET🟢
TP AT: 587.89 ▫️
SL CLOSE 1D AT: 443.25 🔴
🔴 الصفقة فيها مخاطرة ، دخولك وخروجك على مسؤوليتك.
#alpha_spot_X
1
491
·
--
$BTC
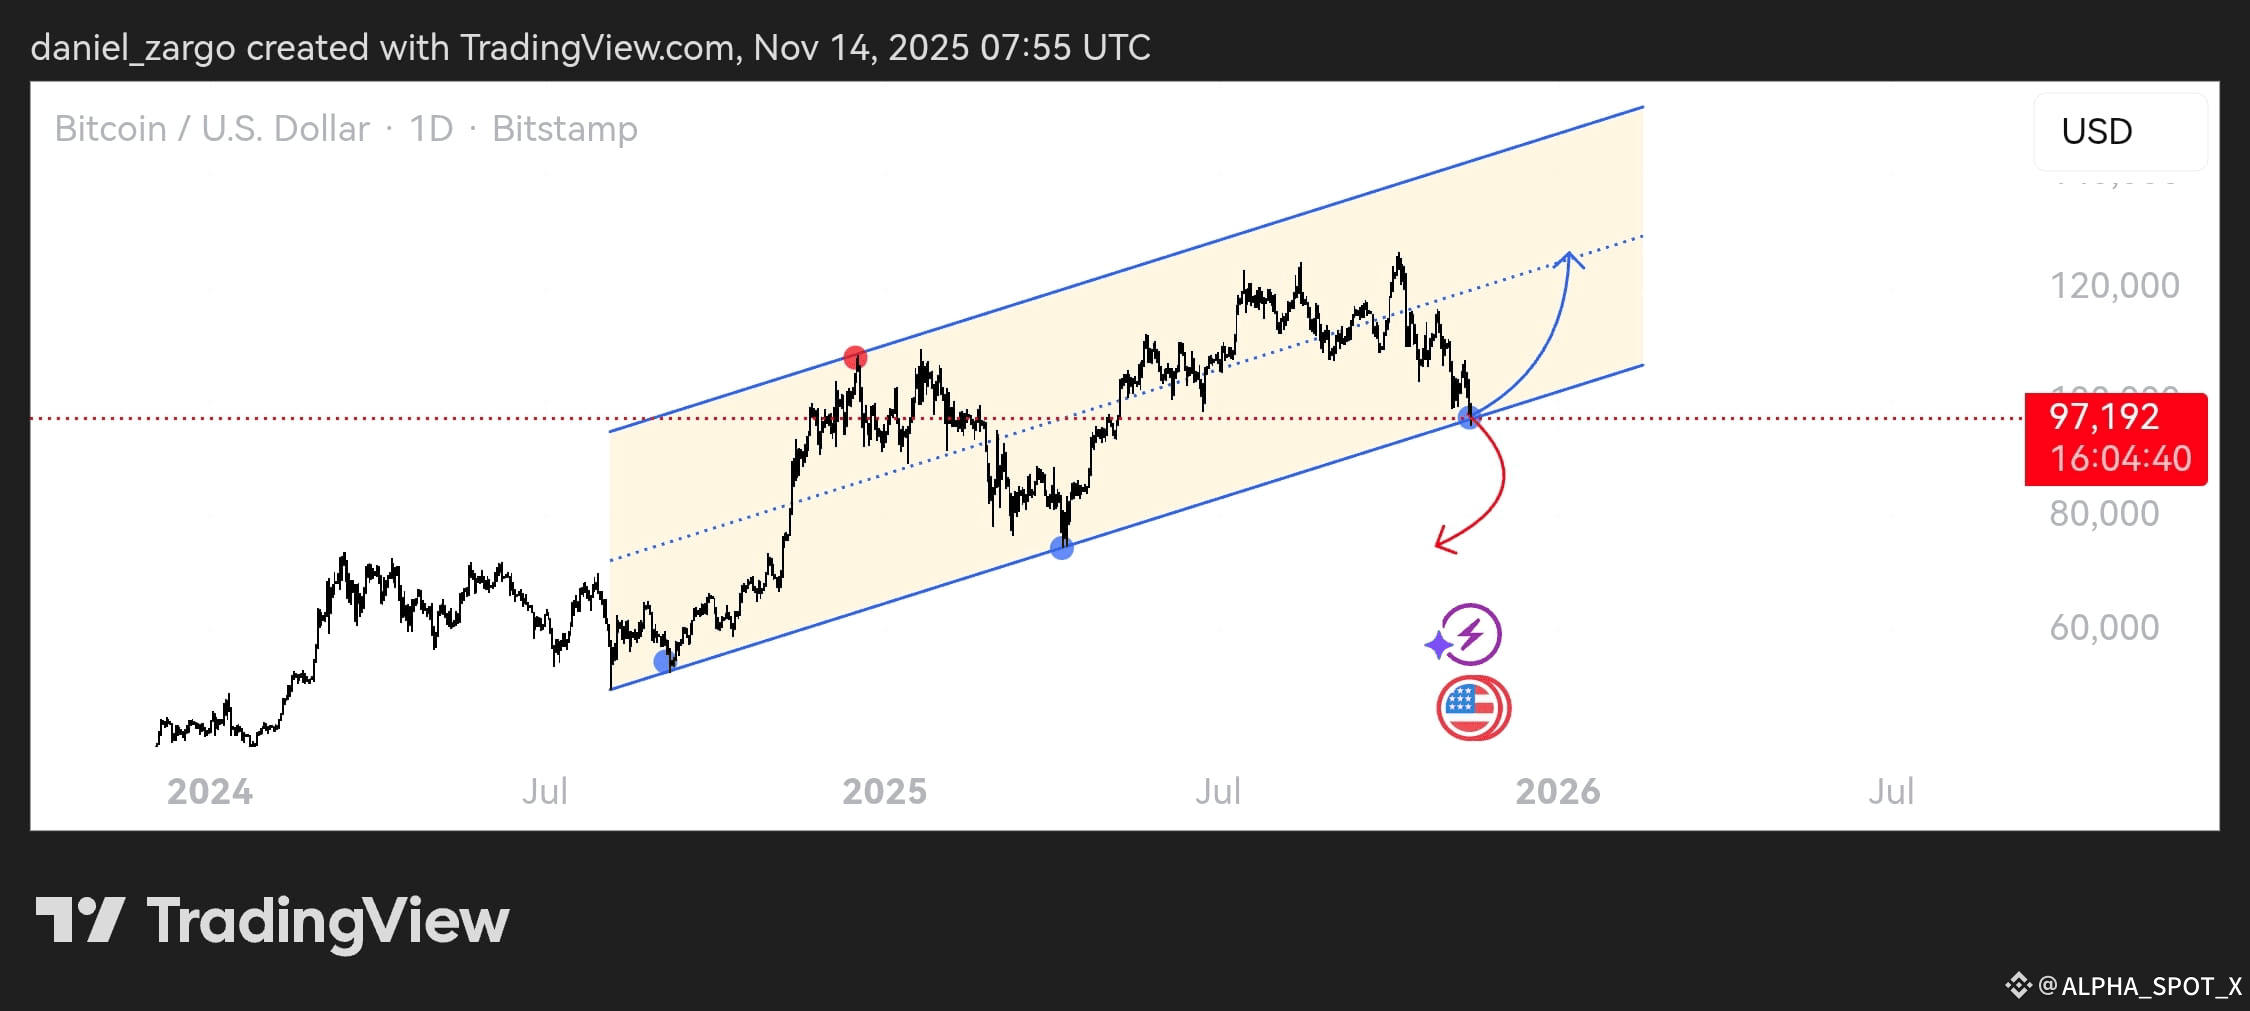
#BTC/USDT.
Any break of the ascending channel and closing below it this week = the beginning of a visit to lower prices, which will be a greater opportunity for better entry
$BTC
#BTC/USDT.
Any break of the ascending channel and closing below it this week = the beginning of a visit to lower prices, which will be a greater opportunity for better entry
#BTC/USDT.
Any break of the ascending channel and closing below it this week = the beginning of a visit to lower prices, which will be a greater opportunity for better entry
2
118
·
--
Bullish
$LINK
#LINK🔥🔥🔥 🚀
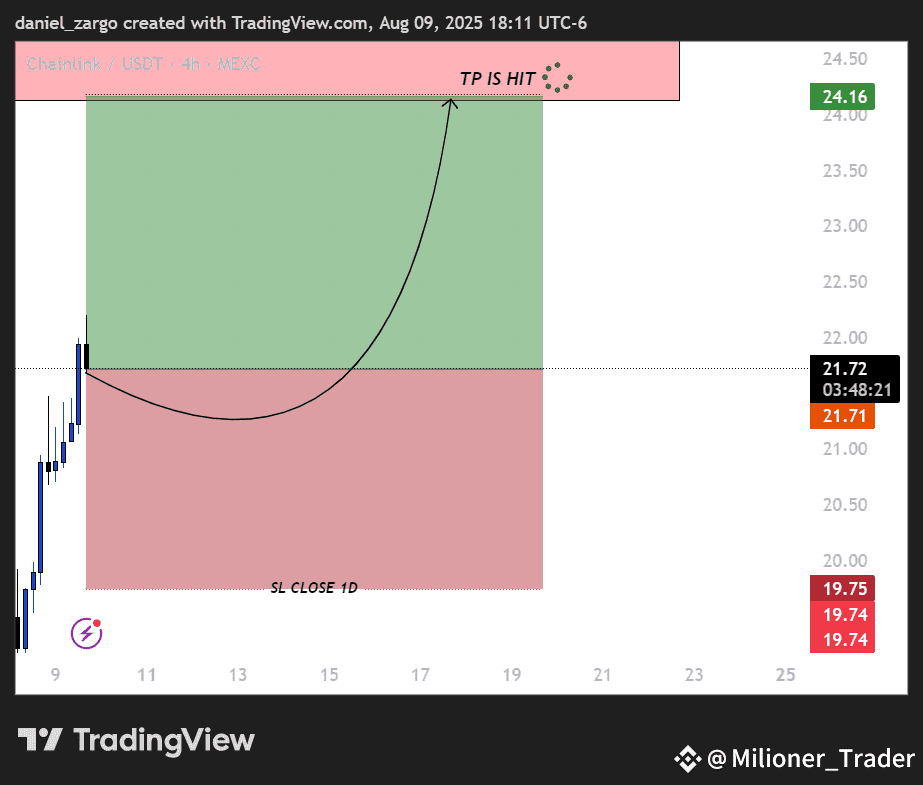
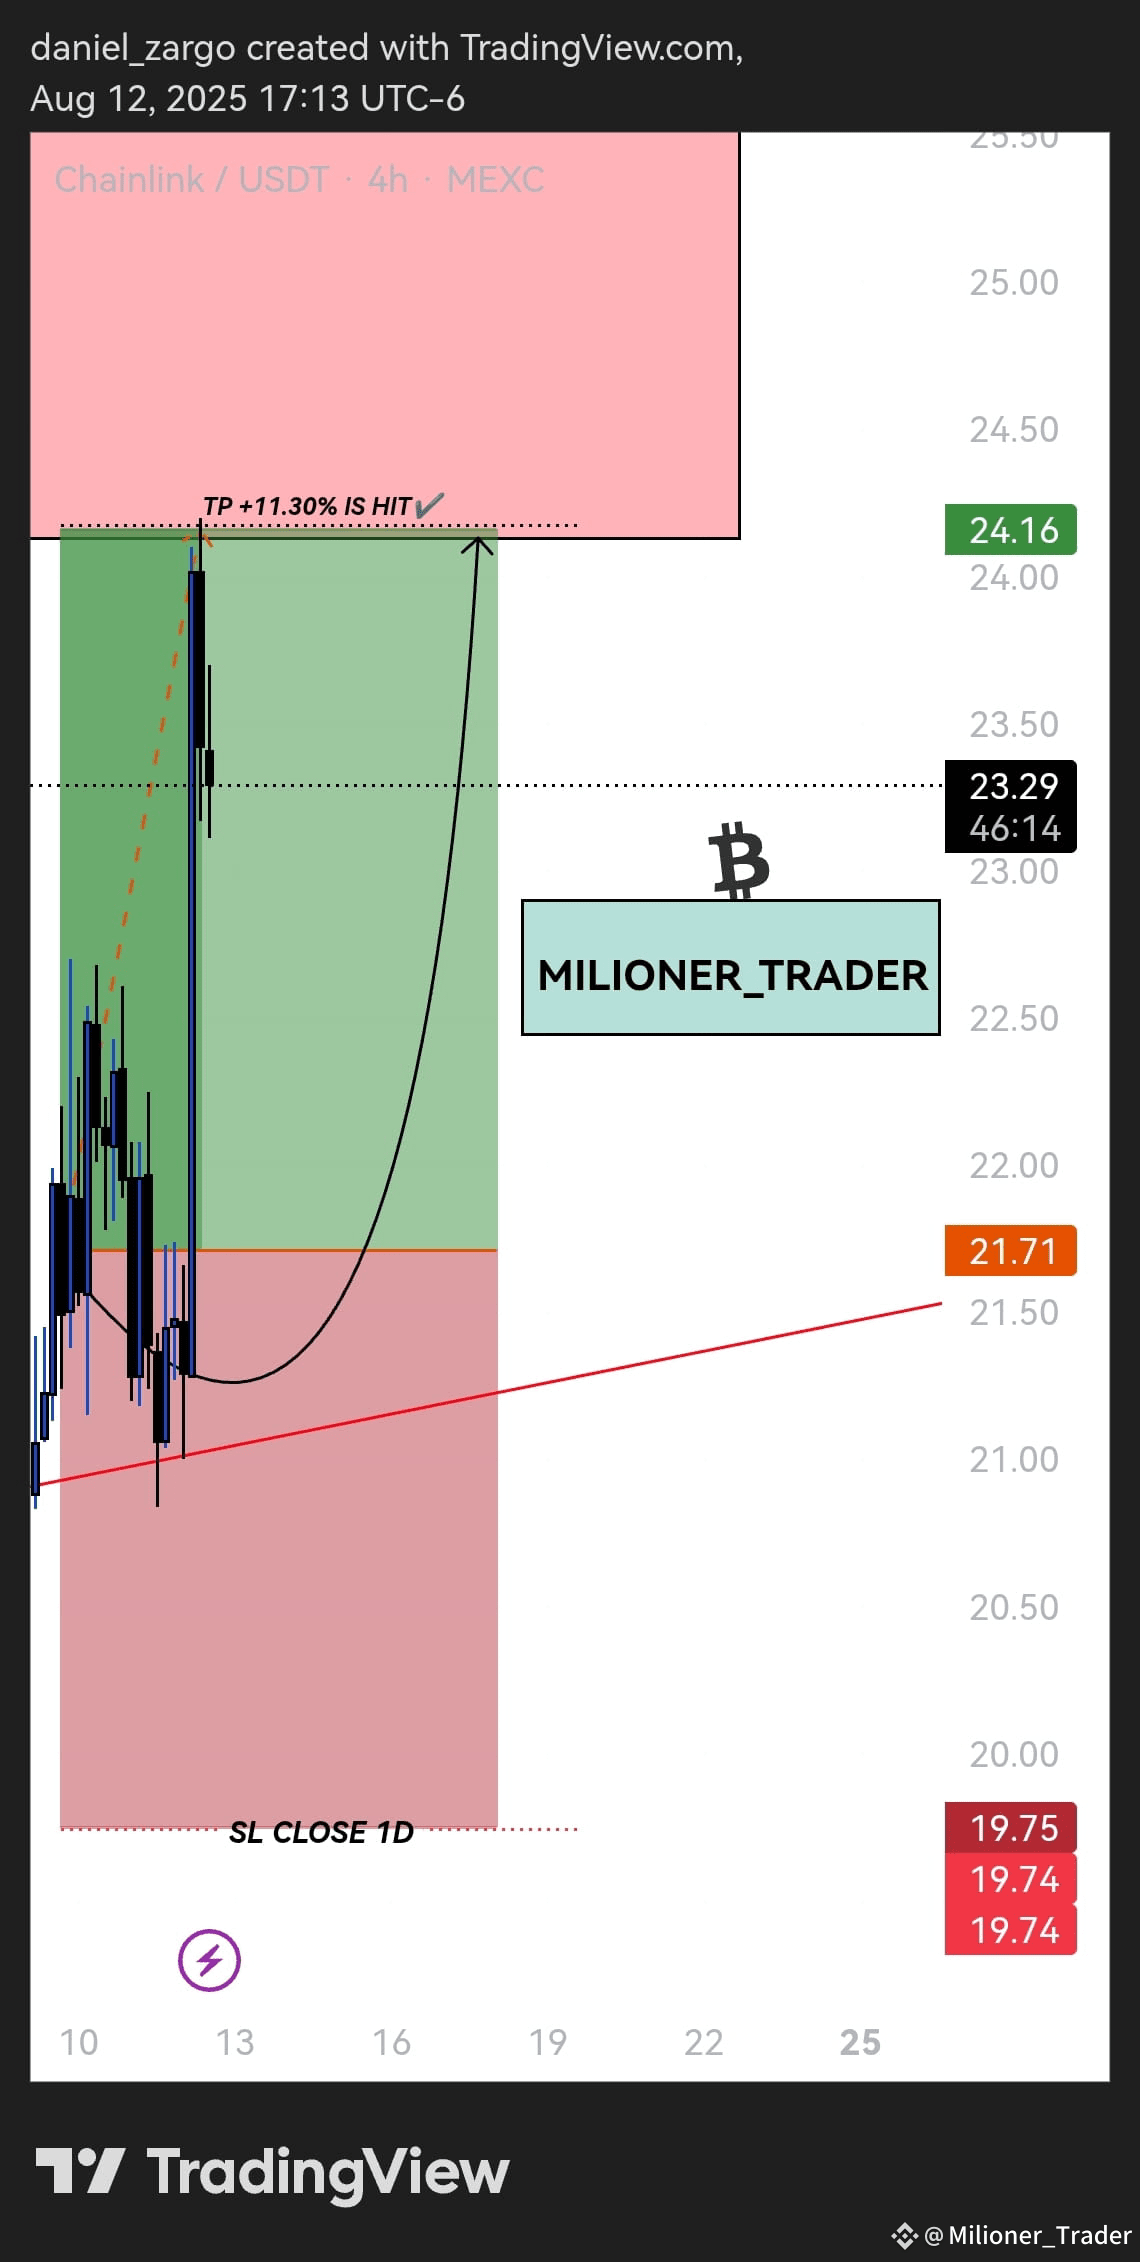
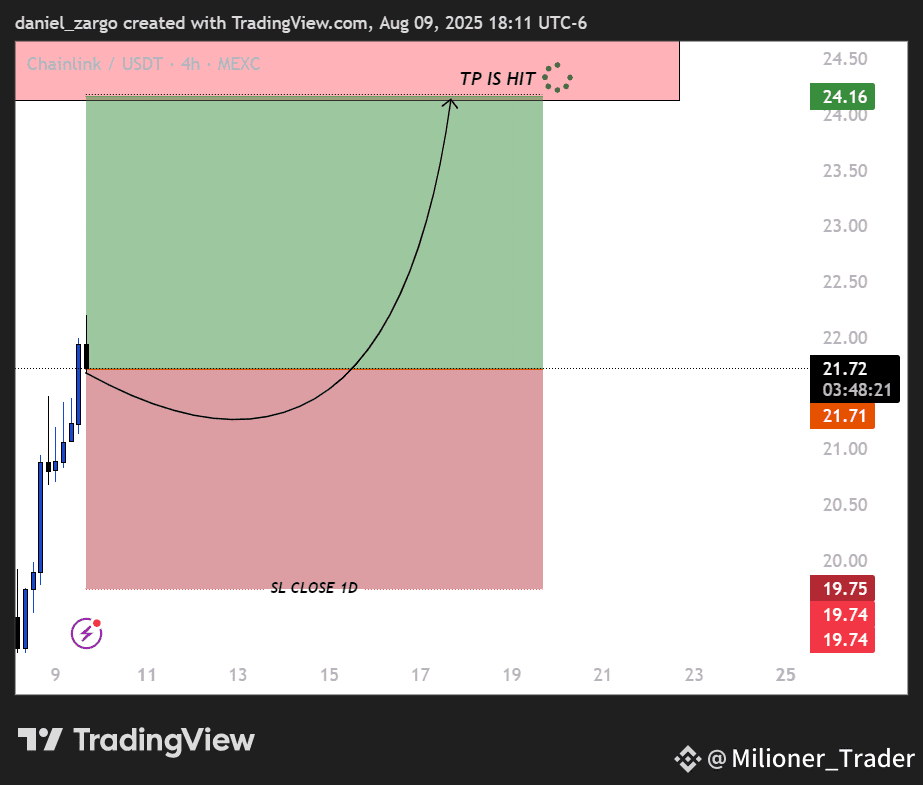
🟢BUY 01 AT: MARKET
🟢BUY 02 AT:21.71
▫️ TP AT: 24.160
🔴 The trade carries risk; your entry and exit are your responsibility.
#milioner_trader
$LINK
#LINK🔥🔥🔥 🚀
🟢BUY 01 AT: MARKET
🟢BUY 02 AT:21.71
▫️ TP AT: 24.160
🔴 The trade carries risk; your entry and exit are your responsibility.
#milioner_trader
#LINK🔥🔥🔥 🚀
🟢BUY 01 AT: MARKET
🟢BUY 02 AT:21.71
▫️ TP AT: 24.160
🔴 The trade carries risk; your entry and exit are your responsibility.
#milioner_trader
3
7
5.6k
·
--
Bullish
$LINK
#LINKUSDT 🚀
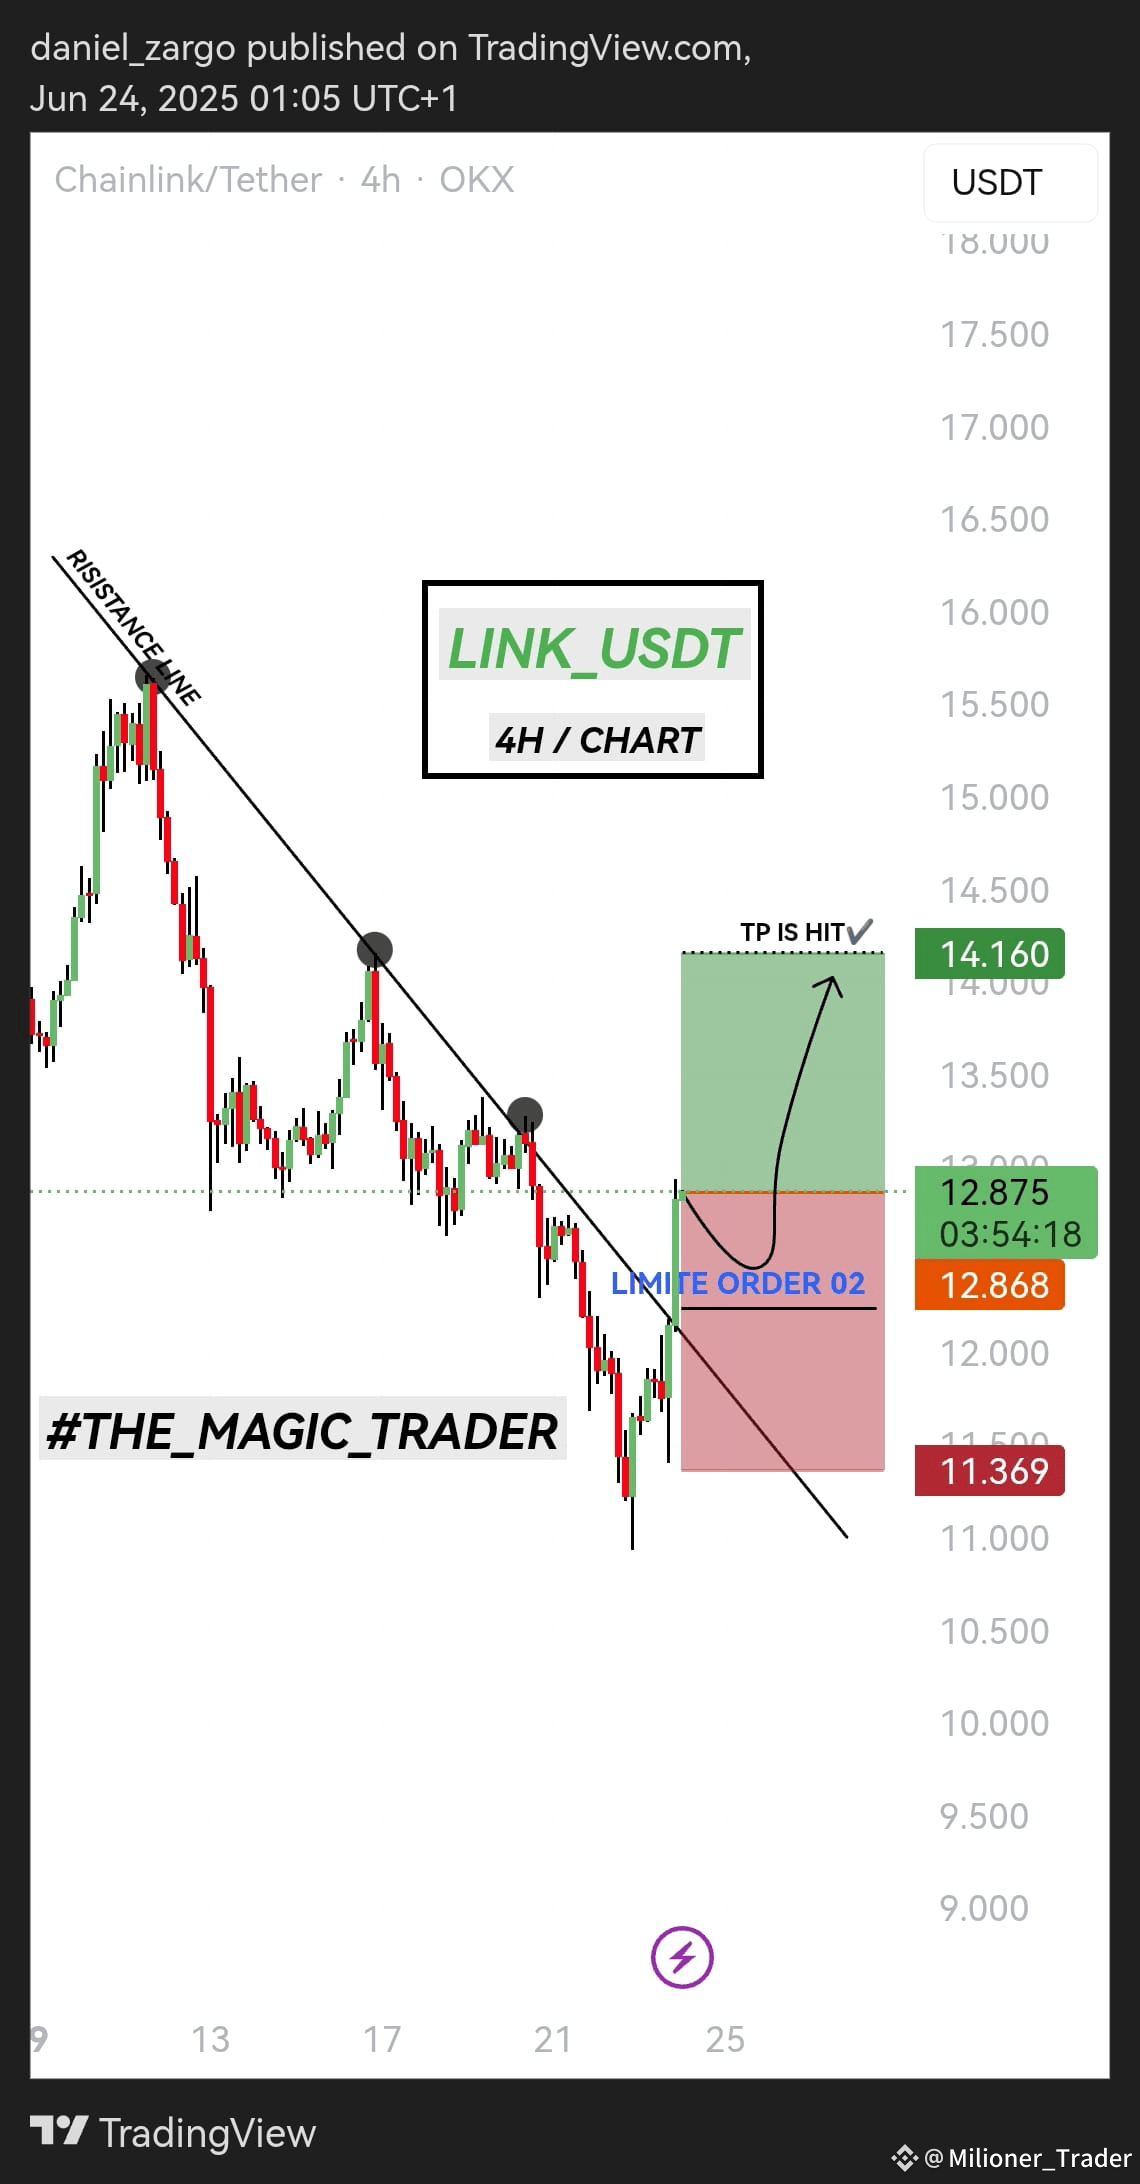
🟢BUY 01 AT: MARKET
🟢BUY 02 AT: 12.24
▫️ TP AT: 14.160
🔴 الصفقة فيها مخاطرة ، دخولك وخروجك على مسؤوليتك.
#milioner_trader
$LINK
#LINKUSDT 🚀
🟢BUY 01 AT: MARKET
🟢BUY 02 AT: 12.24
▫️ TP AT: 14.160
🔴 الصفقة فيها مخاطرة ، دخولك وخروجك على مسؤوليتك.
#milioner_trader
#LINKUSDT 🚀
🟢BUY 01 AT: MARKET
🟢BUY 02 AT: 12.24
▫️ TP AT: 14.160
🔴 الصفقة فيها مخاطرة ، دخولك وخروجك على مسؤوليتك.
#milioner_trader
1
233
·
--
Bullish
$ETH
📉 Are you reliving history?
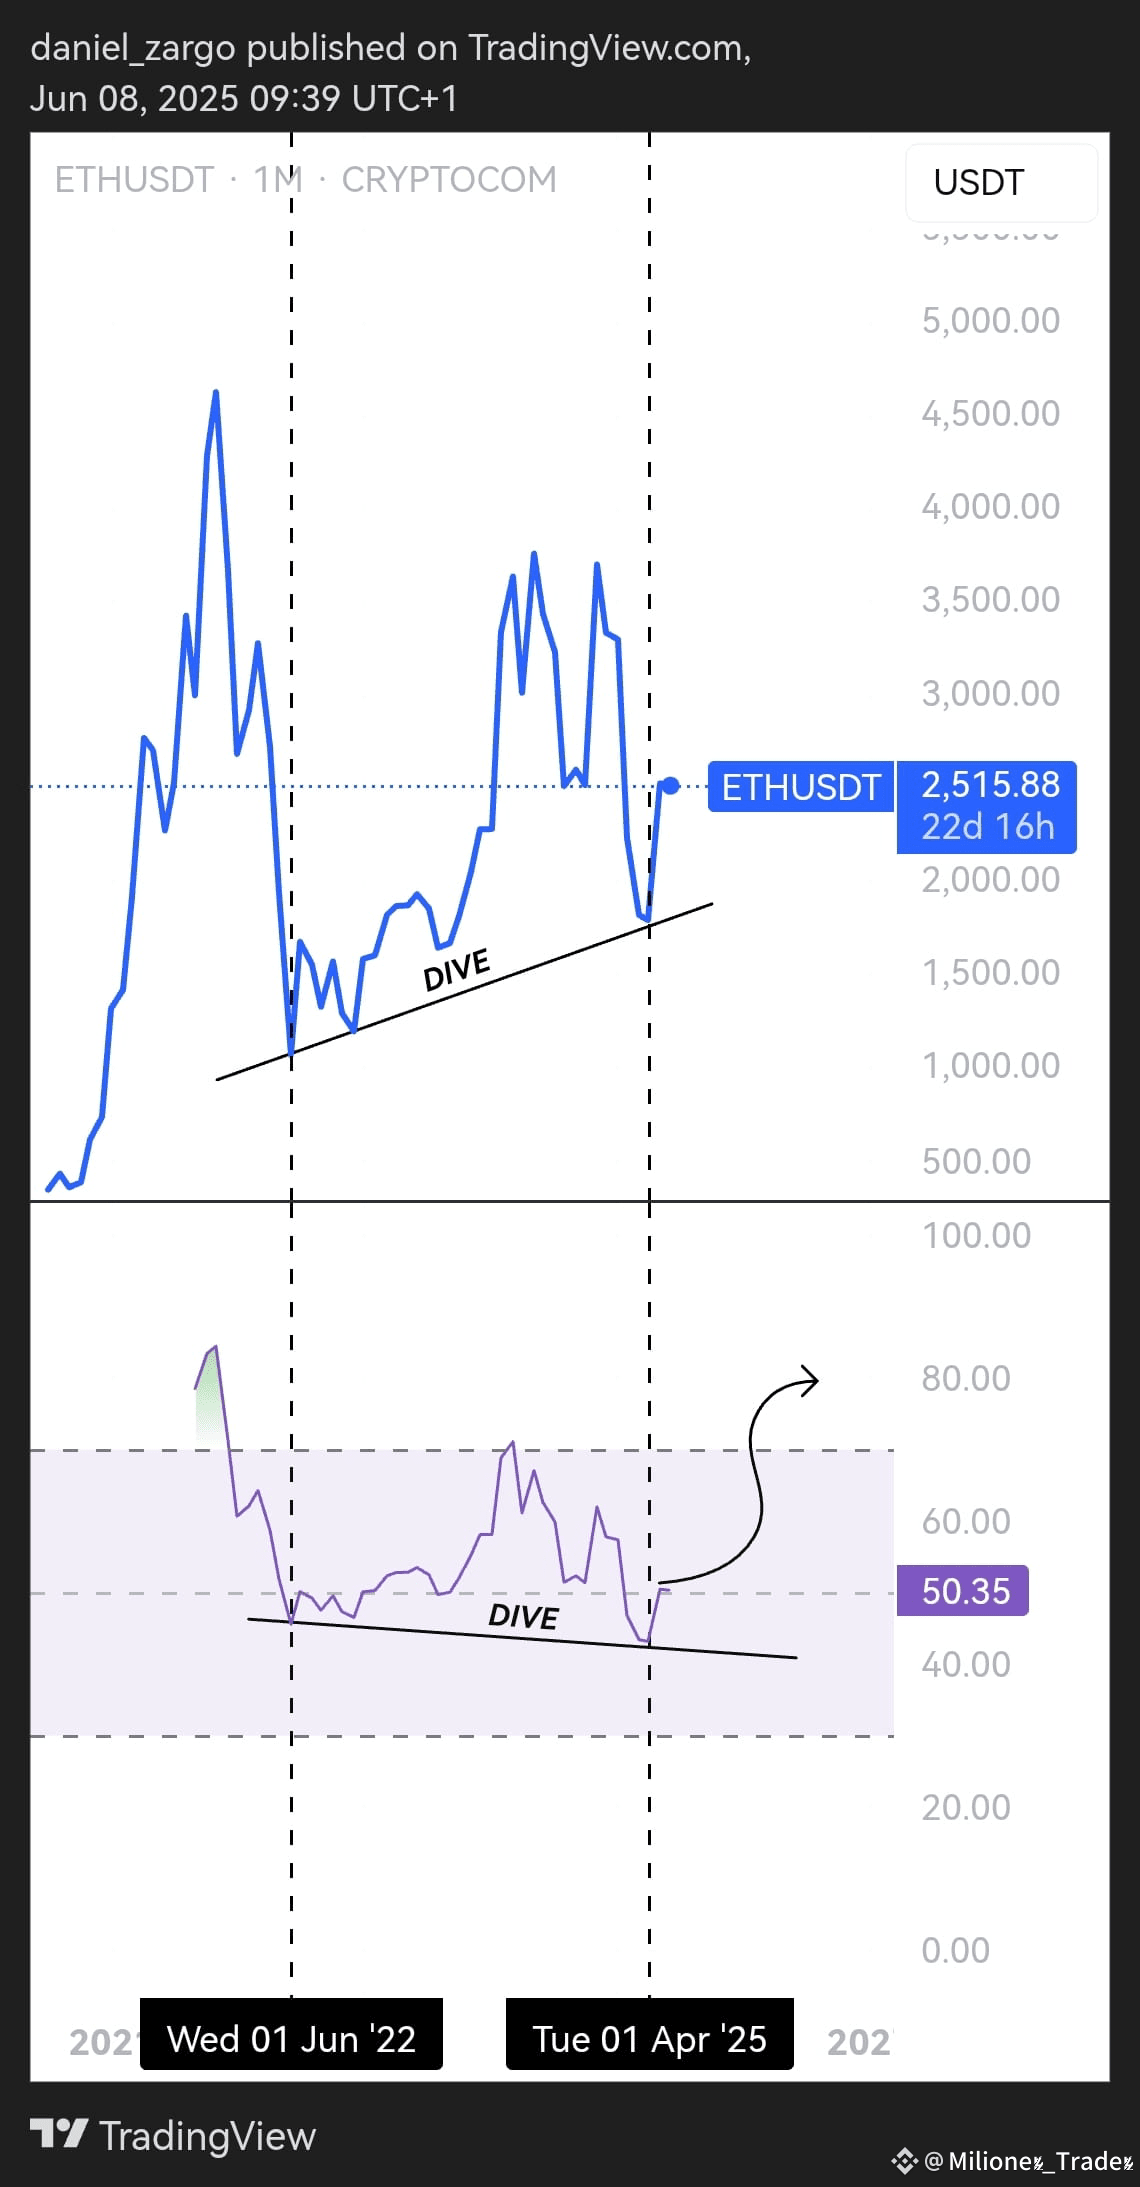
We notice on the ETH/USDT chart (monthly) the formation of what resembles a "positive divergence" between price movement and the Relative Strength Index (RSI) from mid-2022 to April 2025.
🔹 At the top: price is recording higher lows
🔹 At the bottom: RSI is recording lower lows
🔁 This is known as hidden positive divergence, and it often indicates the potential for a resumption of the upward trend.
💡 The price is currently trading at $2,515, and with the RSI moving above the 50 level, we may be on the brink of a strong movement ahead.
📆 Will the summer be hot for Ethereum?
Share your predictions in the comments 👇
#Crypto
#CryptoTrading
#ETHBTC
$ETH
📉 Are you reliving history?
We notice on the ETH/USDT chart (monthly) the formation of what resembles a "positive divergence" between price movement and the Relative Strength Index (RSI) from mid-2022 to April 2025.
🔹 At the top: price is recording higher lows
🔹 At the bottom: RSI is recording lower lows
🔁 This is known as hidden positive divergence, and it often indicates the potential for a resumption of the upward trend.
💡 The price is currently trading at $2,515, and with the RSI moving above the 50 level, we may be on the brink of a strong movement ahead.
📆 Will the summer be hot for Ethereum?
Share your predictions in the comments 👇
#Crypto
#CryptoTrading
#ETHBTC
📉 Are you reliving history?
We notice on the ETH/USDT chart (monthly) the formation of what resembles a "positive divergence" between price movement and the Relative Strength Index (RSI) from mid-2022 to April 2025.
🔹 At the top: price is recording higher lows
🔹 At the bottom: RSI is recording lower lows
🔁 This is known as hidden positive divergence, and it often indicates the potential for a resumption of the upward trend.
💡 The price is currently trading at $2,515, and with the RSI moving above the 50 level, we may be on the brink of a strong movement ahead.
📆 Will the summer be hot for Ethereum?
Share your predictions in the comments 👇
#Crypto
#CryptoTrading
#ETHBTC
3
599
·
--
Bullish
$VIRTUAL
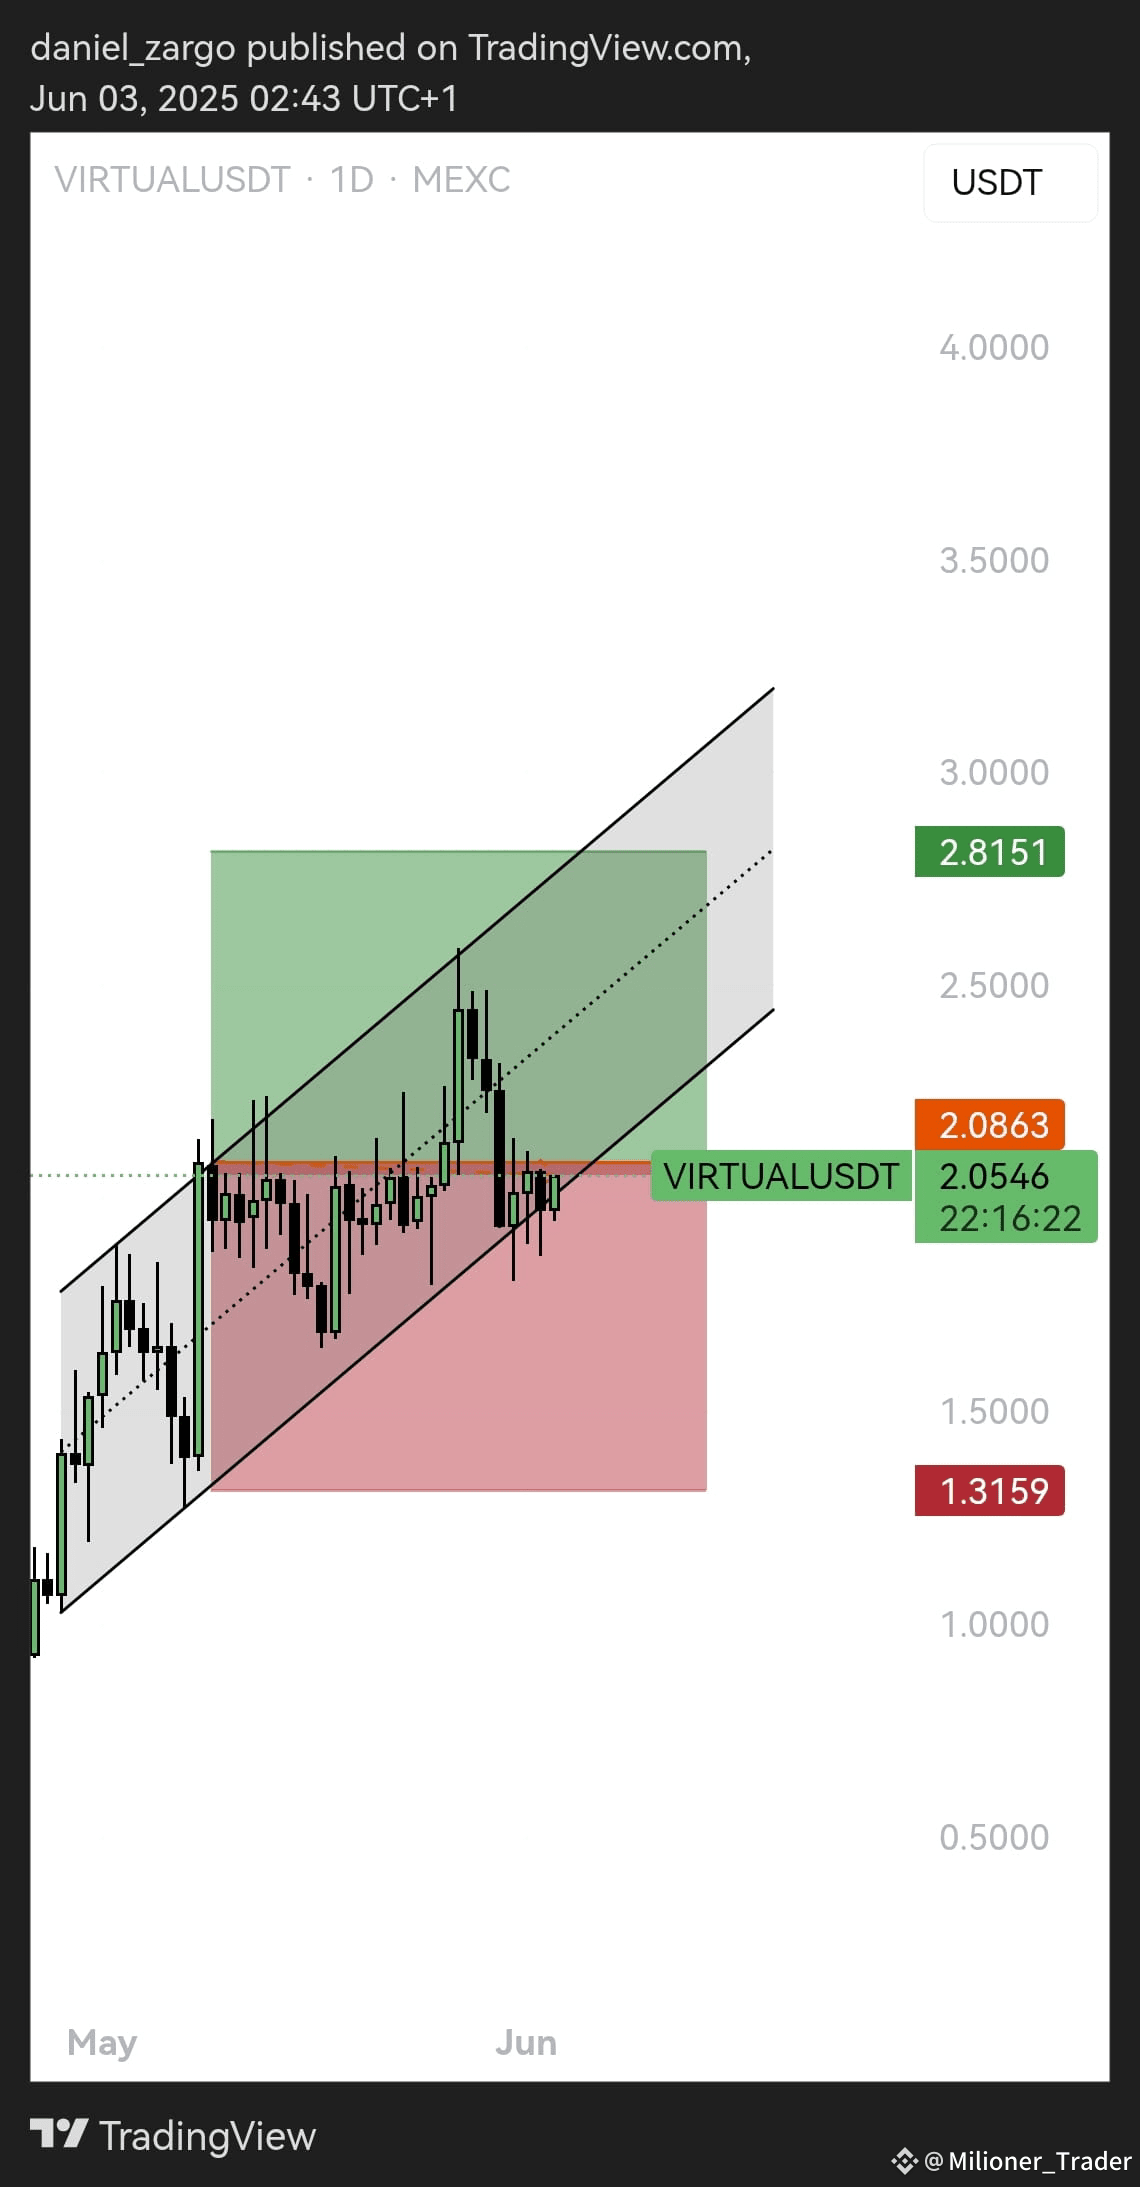
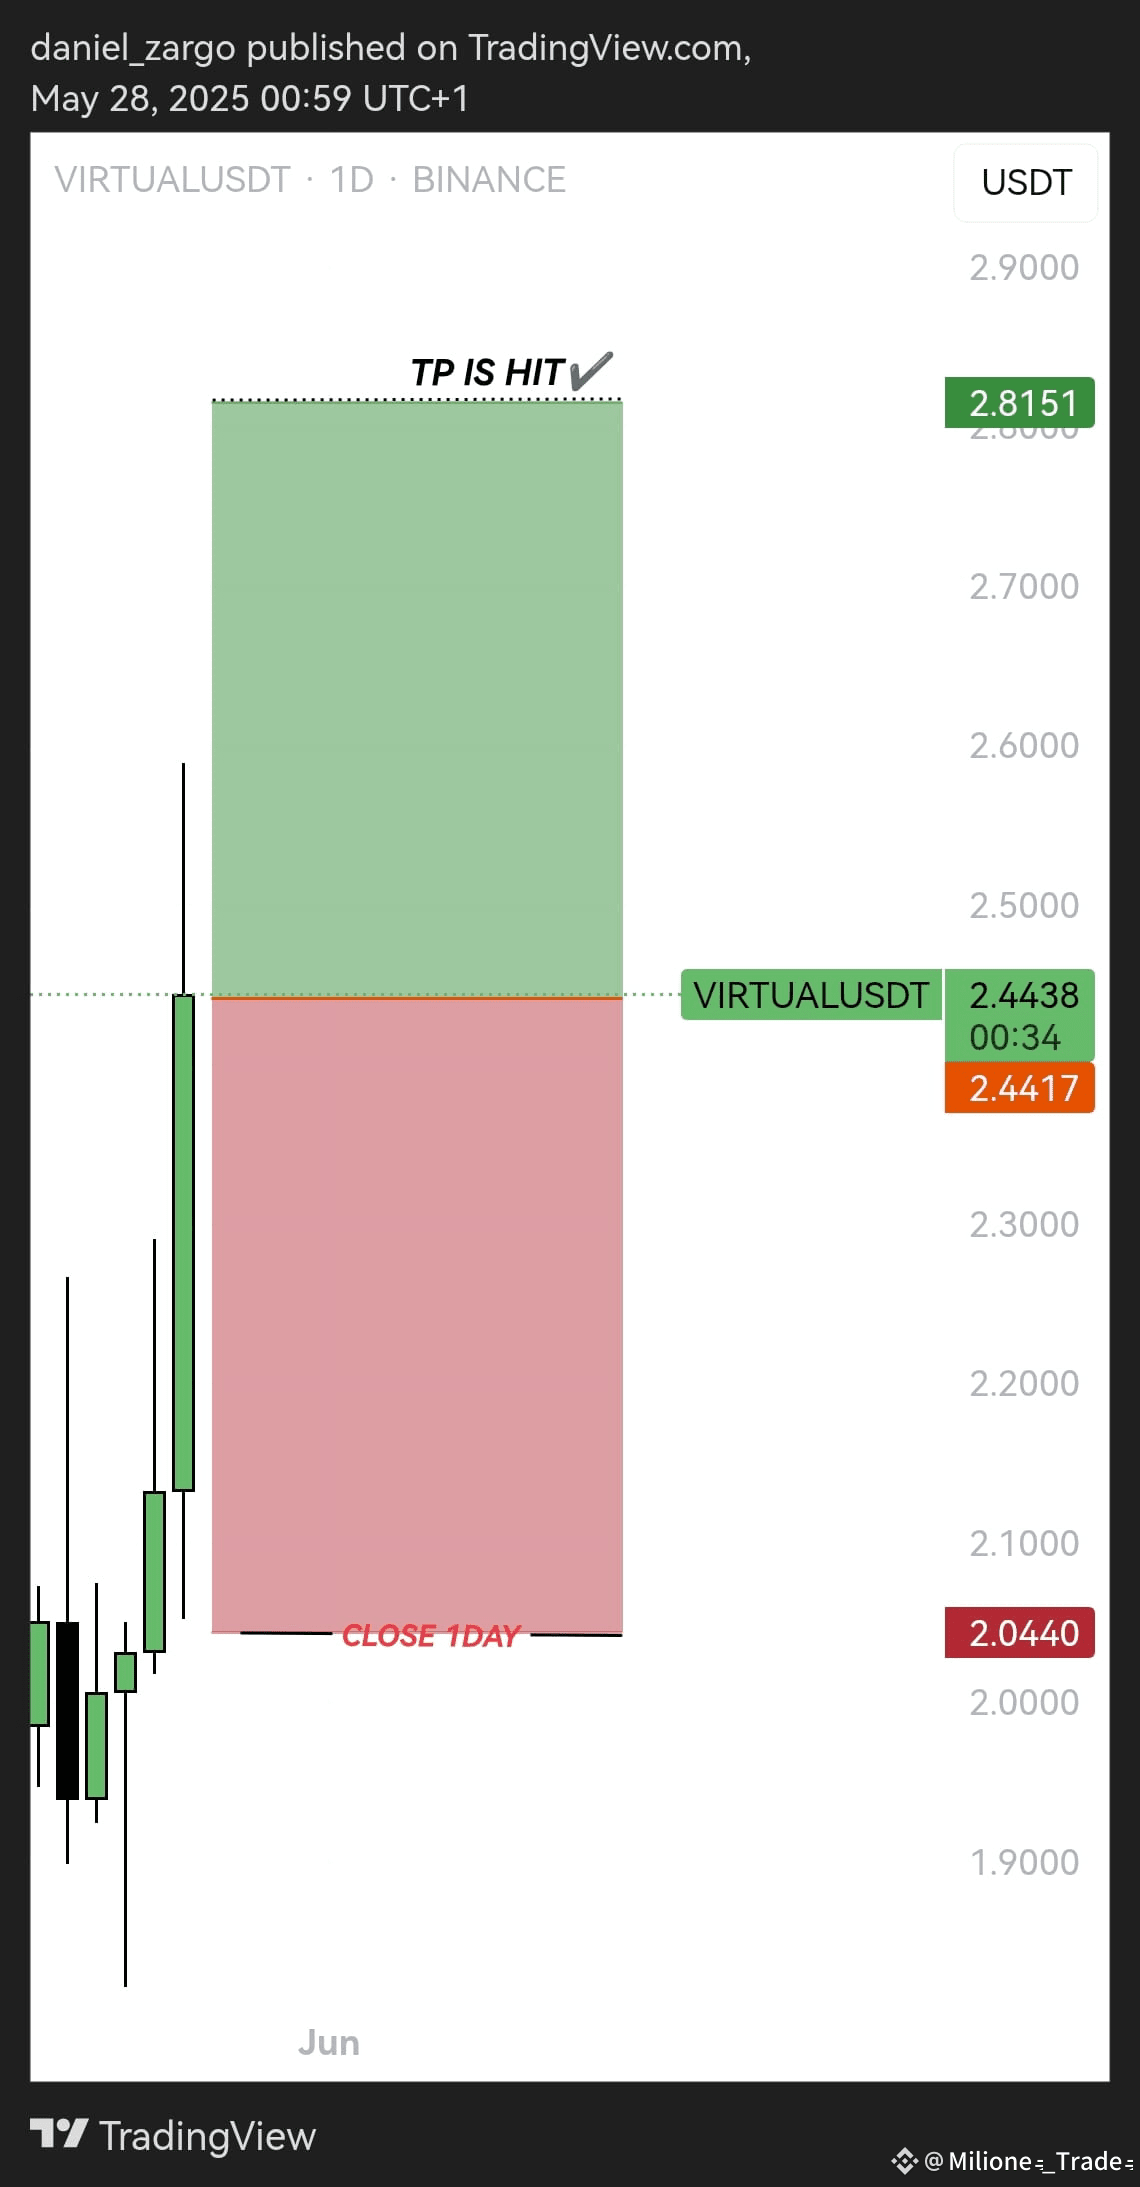
🚀VIRTUALUSDT
🟢BUY AT: NOW
▫️TP AT : 2.8151
📛SL CLOSE 1D AT: 2.044
$VIRTUAL
🚀VIRTUALUSDT
🟢BUY AT: NOW
▫️TP AT : 2.8151
📛SL CLOSE 1D AT: 2.044
🚀VIRTUALUSDT
🟢BUY AT: NOW
▫️TP AT : 2.8151
📛SL CLOSE 1D AT: 2.044
1
829
Log in to explore more content
Join global crypto users on Binance Square
⚡️ Get latest and useful information about crypto.
💬 Trusted by the world’s largest crypto exchange.
👍 Discover real insights from verified creators.
Email / Phone number
Trending Topics
NvidiaBeatsEstimatesWith$130BQ4Outlook
557 views
19 Discussing
Nvidia Beats With $115.8 Billion in Revenue, Guides to $130 Billion and Adds $150 Billion Buyback
Binance News
·19 Likes
·22k views
AnthropicIPOPriceCouldExceed$80
827 views
30 Discussing
CanNvidia’sDataCenterGrowthContinue?
1,466 views
60 Discussing