
cyberman
729 Posts

cyberman
Report
Block User
High-Frequency Trader
5.7 Years
17 Following
66 Followers
101 Liked
Posts
All
Quotes
Videos
·
--
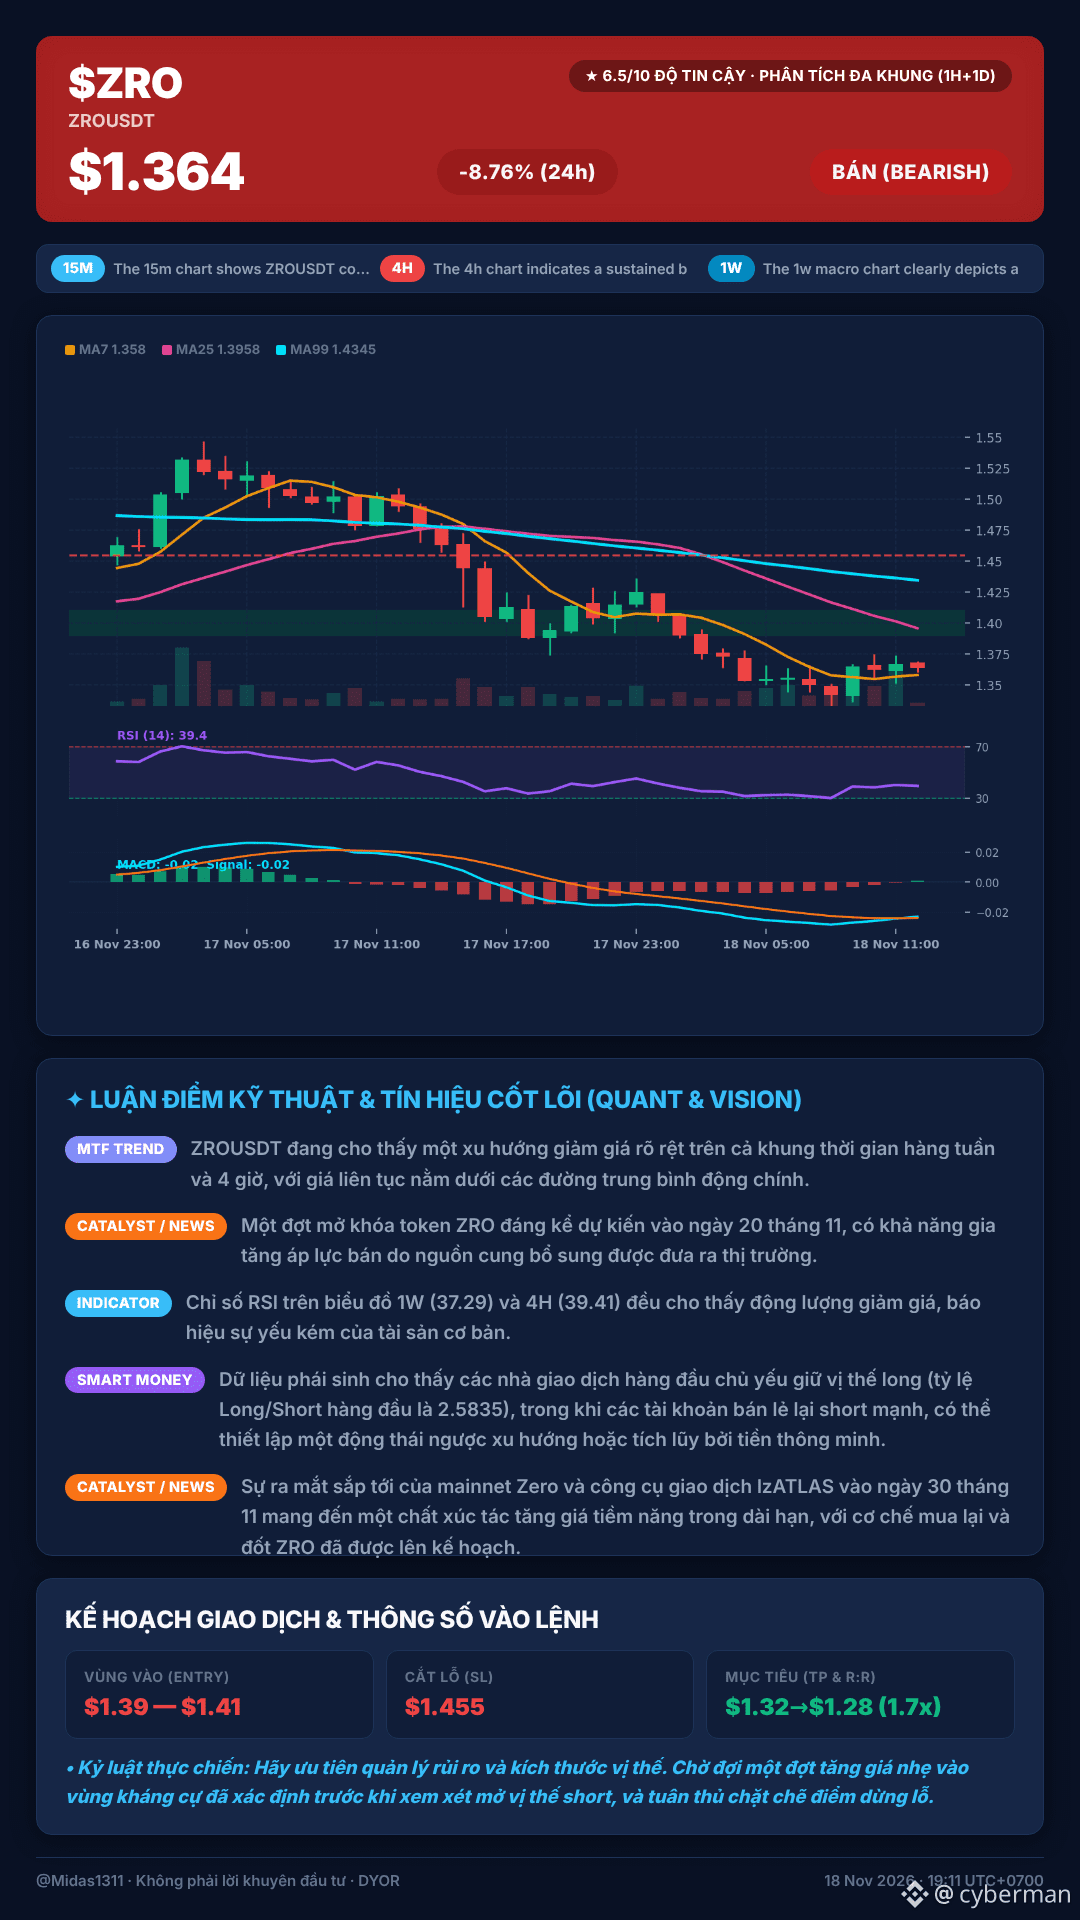
$ZRO is plunging so hard it made me look twice 😏. Down 8.76% in 24h with $5.9 million USDT in volume—the bears are sweeping up stop-losses. 👀
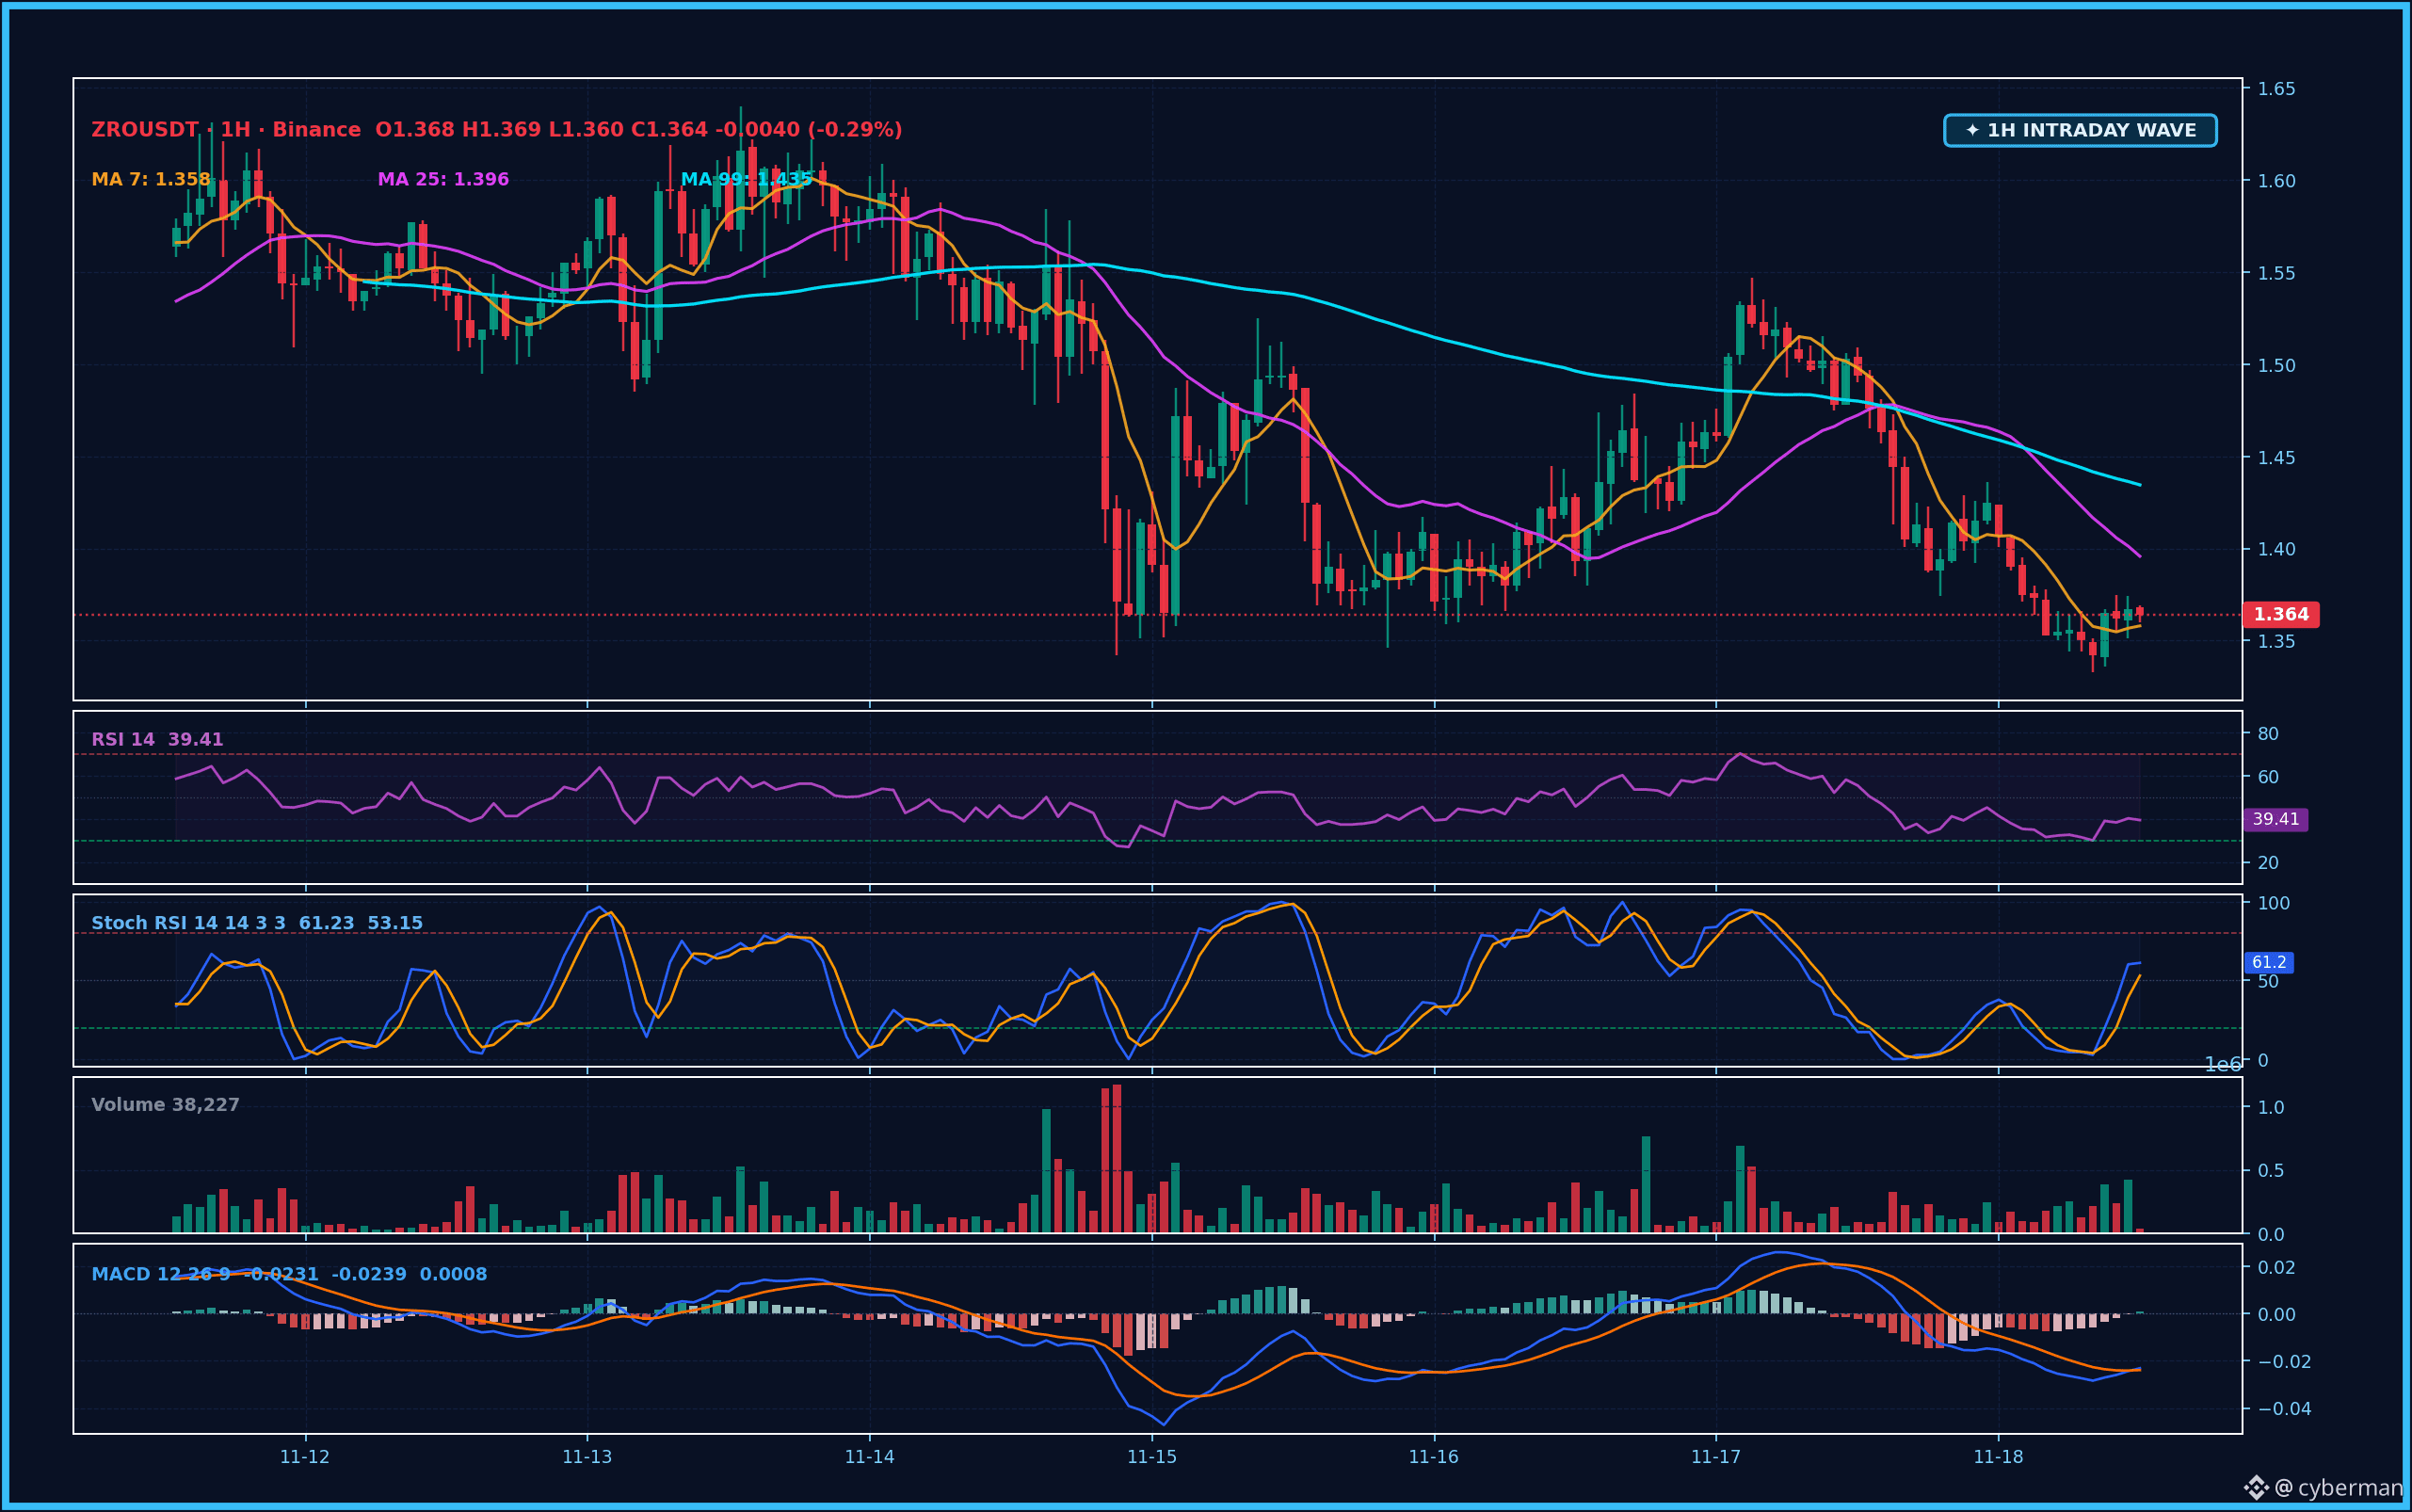
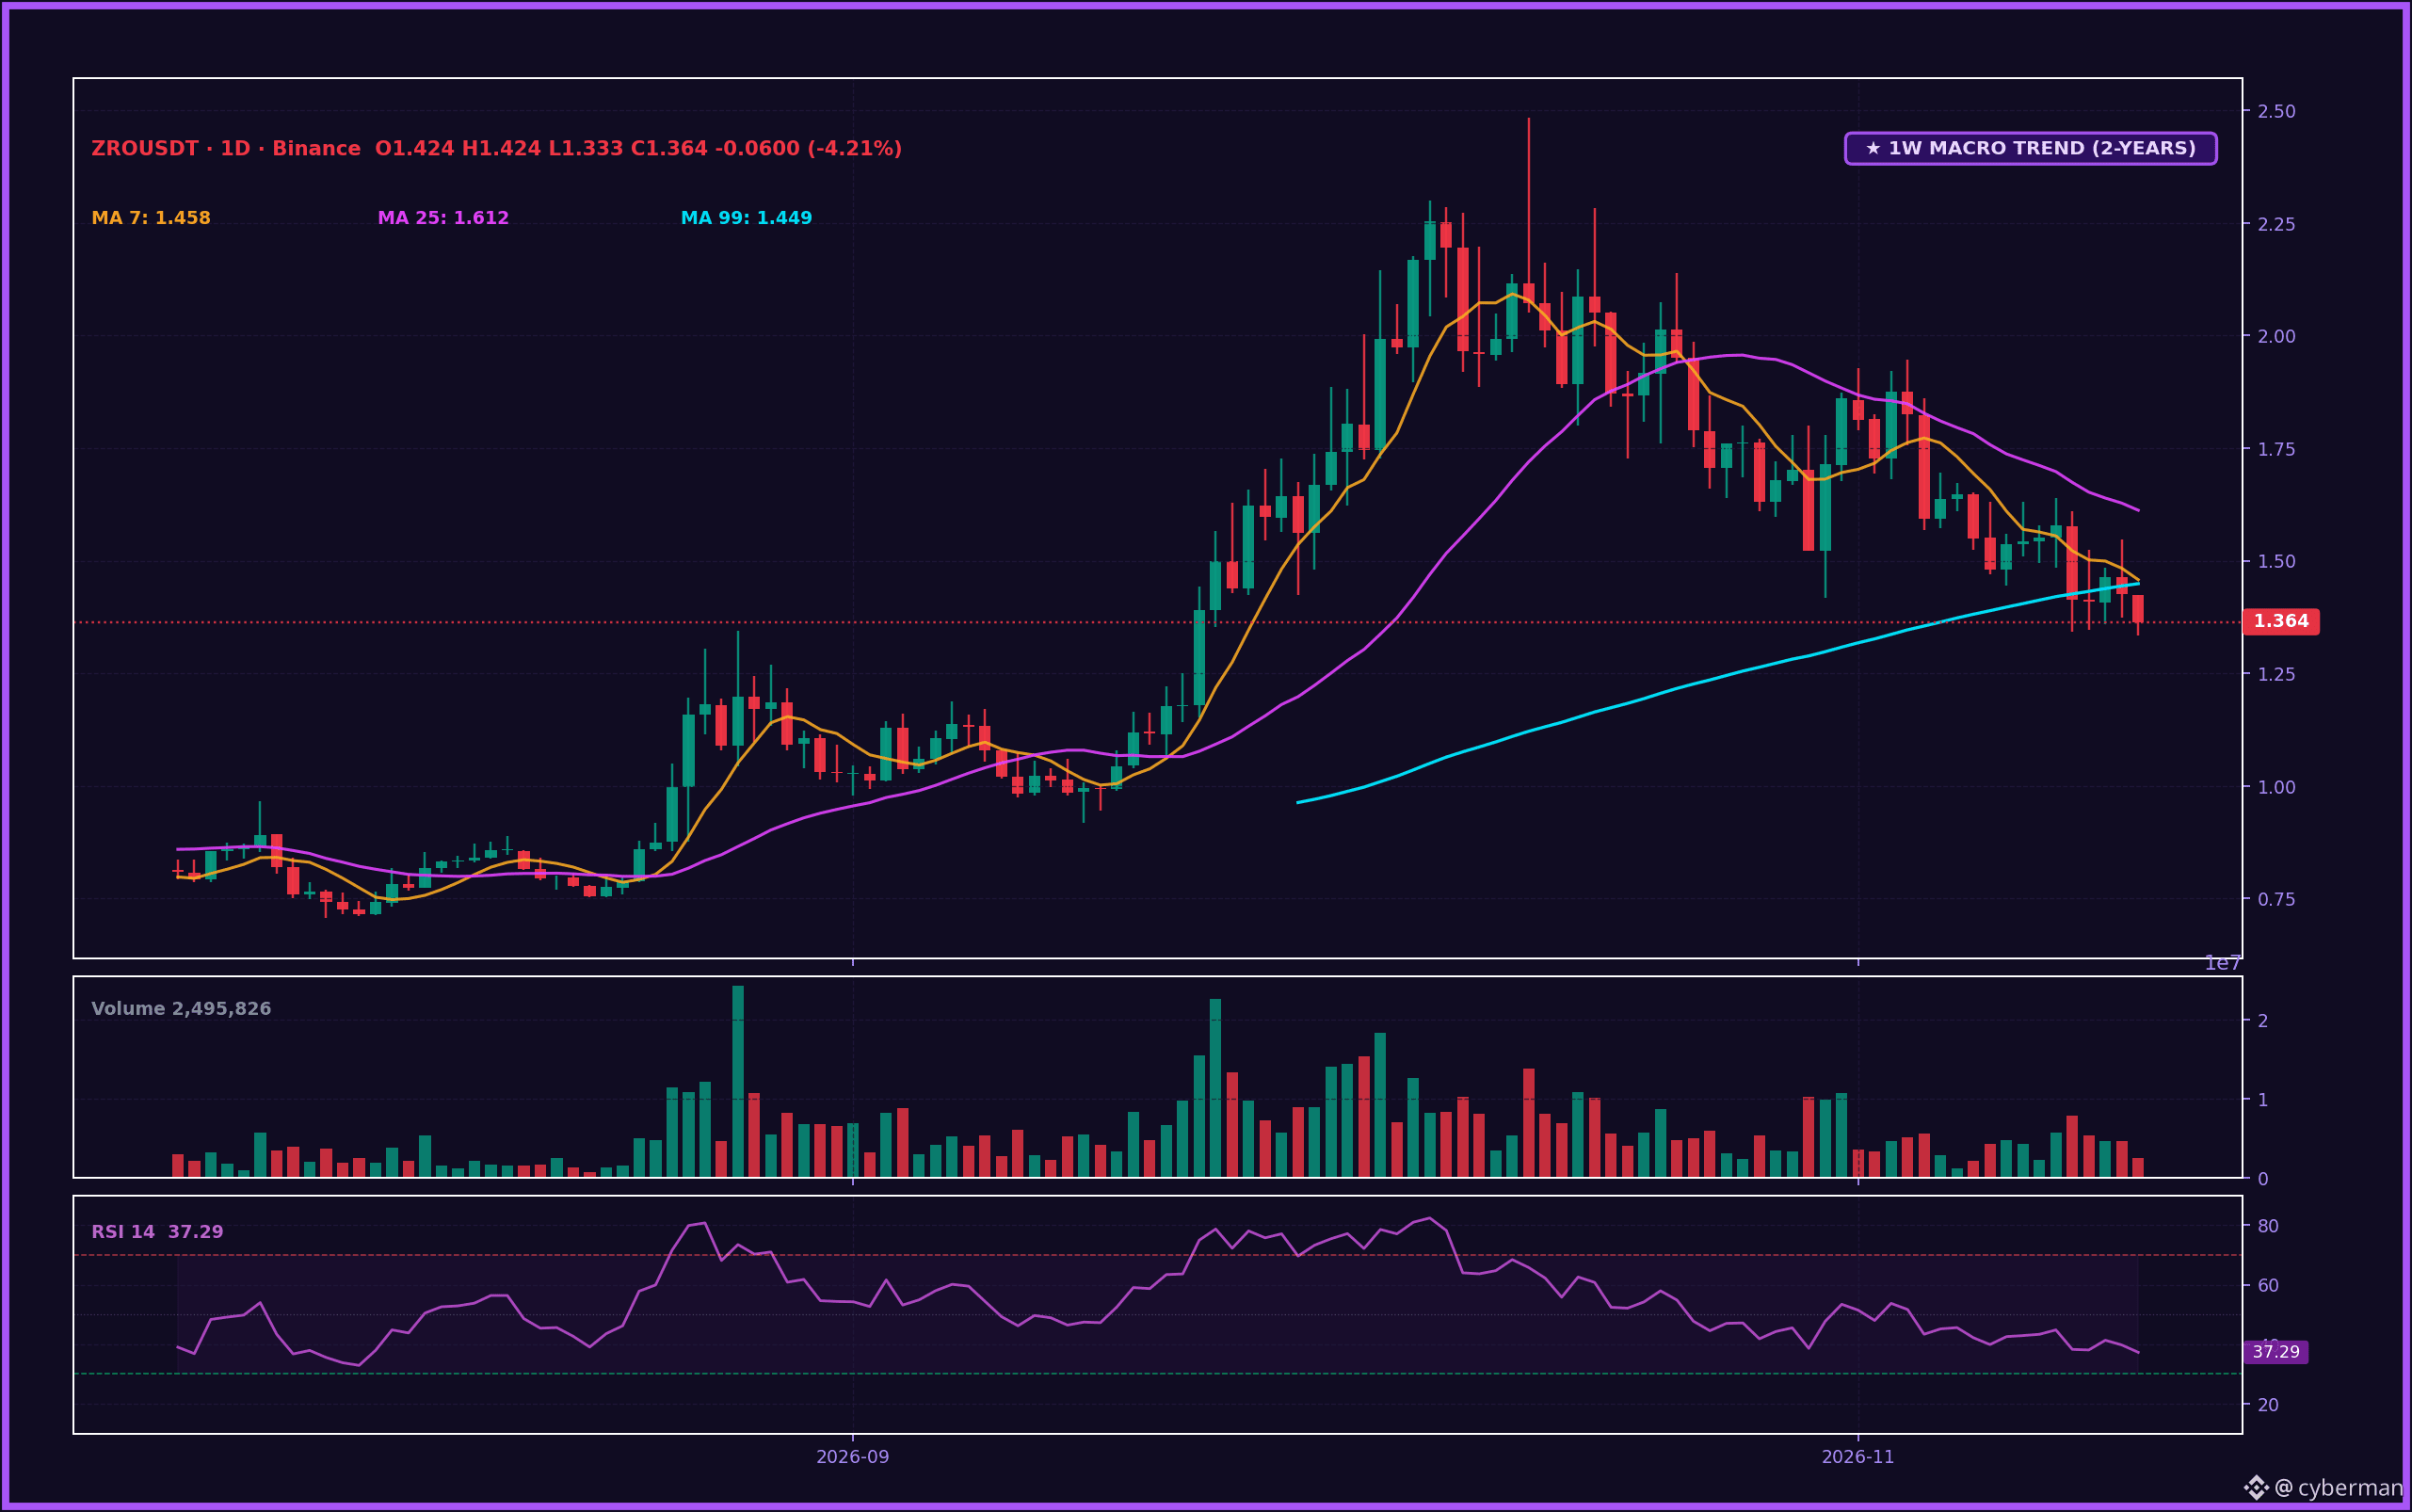
On both the 1W and 1H charts, $ZRO is clearly in a downtrend, with price below the key MAs. The 1H RSI at 39.4 and 1D RSI at 37.3 reinforce the bearish momentum. Near-term supply pressure from the 23.28 million ZRO unlock on 11/20 is significant. Although the Zero mainnet and lzATLAS launch on 11/30, along with the ZRO buyback/burn mechanism, are long-term catalysts, the short term still looks challenging. Derivatives data: slightly positive funding, 34.4% of accounts are long, and OI is down 7.0%. Smart money is holding longs, while retail is heavily short. 🤔
I’m leaning slightly toward SHORT $ZRO. Watch for a sell zone at 1.39–1.41. Targets: 1.32, then 1.28. The setup is invalidated if $ZRO breaks above 1.455. Volume needs to confirm. 🎯
What level do you think is decisive for $ZRO ? Comment and let’s discuss. 👇🧊
#Write2Earn #CryptoTrading #MarketUpdate
(Not financial advice—do your own research)
---
$ZRO is plunging so hard it made me look twice 😏. Down 8.76% in 24h with $5.9 million USDT in volume—the bears are sweeping up stop-losses. 👀
On both the 1W and 1H charts, $ZRO is clearly in a downtrend, with price below the key MAs. The 1H RSI at 39.4 and 1D RSI at 37.3 reinforce the bearish momentum. Near-term supply pressure from the 23.28 million ZRO unlock on 11/20 is significant. Although the Zero mainnet and lzATLAS launch on 11/30, along with the ZRO buyback/burn mechanism, are long-term catalysts, the short term still looks challenging. Derivatives data: slightly positive funding, 34.4% of accounts are long, and OI is down 7.0%. Smart money is holding longs, while retail is heavily short. 🤔
I’m leaning slightly toward SHORT $ZRO . Watch for a sell zone at 1.39–1.41. Targets: 1.32, then 1.28. The setup is invalidated if $ZRO breaks above 1.455. Volume needs to confirm. 🎯
What level do you think is decisive for $ZRO ? Comment and let’s discuss. 👇🧊
#Write2Earn #CryptoTrading #MarketUpdate
(Not financial advice—do your own research)
---
On both the 1W and 1H charts, $ZRO is clearly in a downtrend, with price below the key MAs. The 1H RSI at 39.4 and 1D RSI at 37.3 reinforce the bearish momentum. Near-term supply pressure from the 23.28 million ZRO unlock on 11/20 is significant. Although the Zero mainnet and lzATLAS launch on 11/30, along with the ZRO buyback/burn mechanism, are long-term catalysts, the short term still looks challenging. Derivatives data: slightly positive funding, 34.4% of accounts are long, and OI is down 7.0%. Smart money is holding longs, while retail is heavily short. 🤔
I’m leaning slightly toward SHORT $ZRO . Watch for a sell zone at 1.39–1.41. Targets: 1.32, then 1.28. The setup is invalidated if $ZRO breaks above 1.455. Volume needs to confirm. 🎯
What level do you think is decisive for $ZRO ? Comment and let’s discuss. 👇🧊
#Write2Earn #CryptoTrading #MarketUpdate
(Not financial advice—do your own research)
---
24
·
--
See translation
BTC đang lình xình thế này, nhiều người lại đi soi chart. Nhưng tôi thì lại nhìn vào sổ lệnh, và thấy một sự thật phũ phàng: volume 24h cao chưa chắc đã là thanh khoản thật. 😐
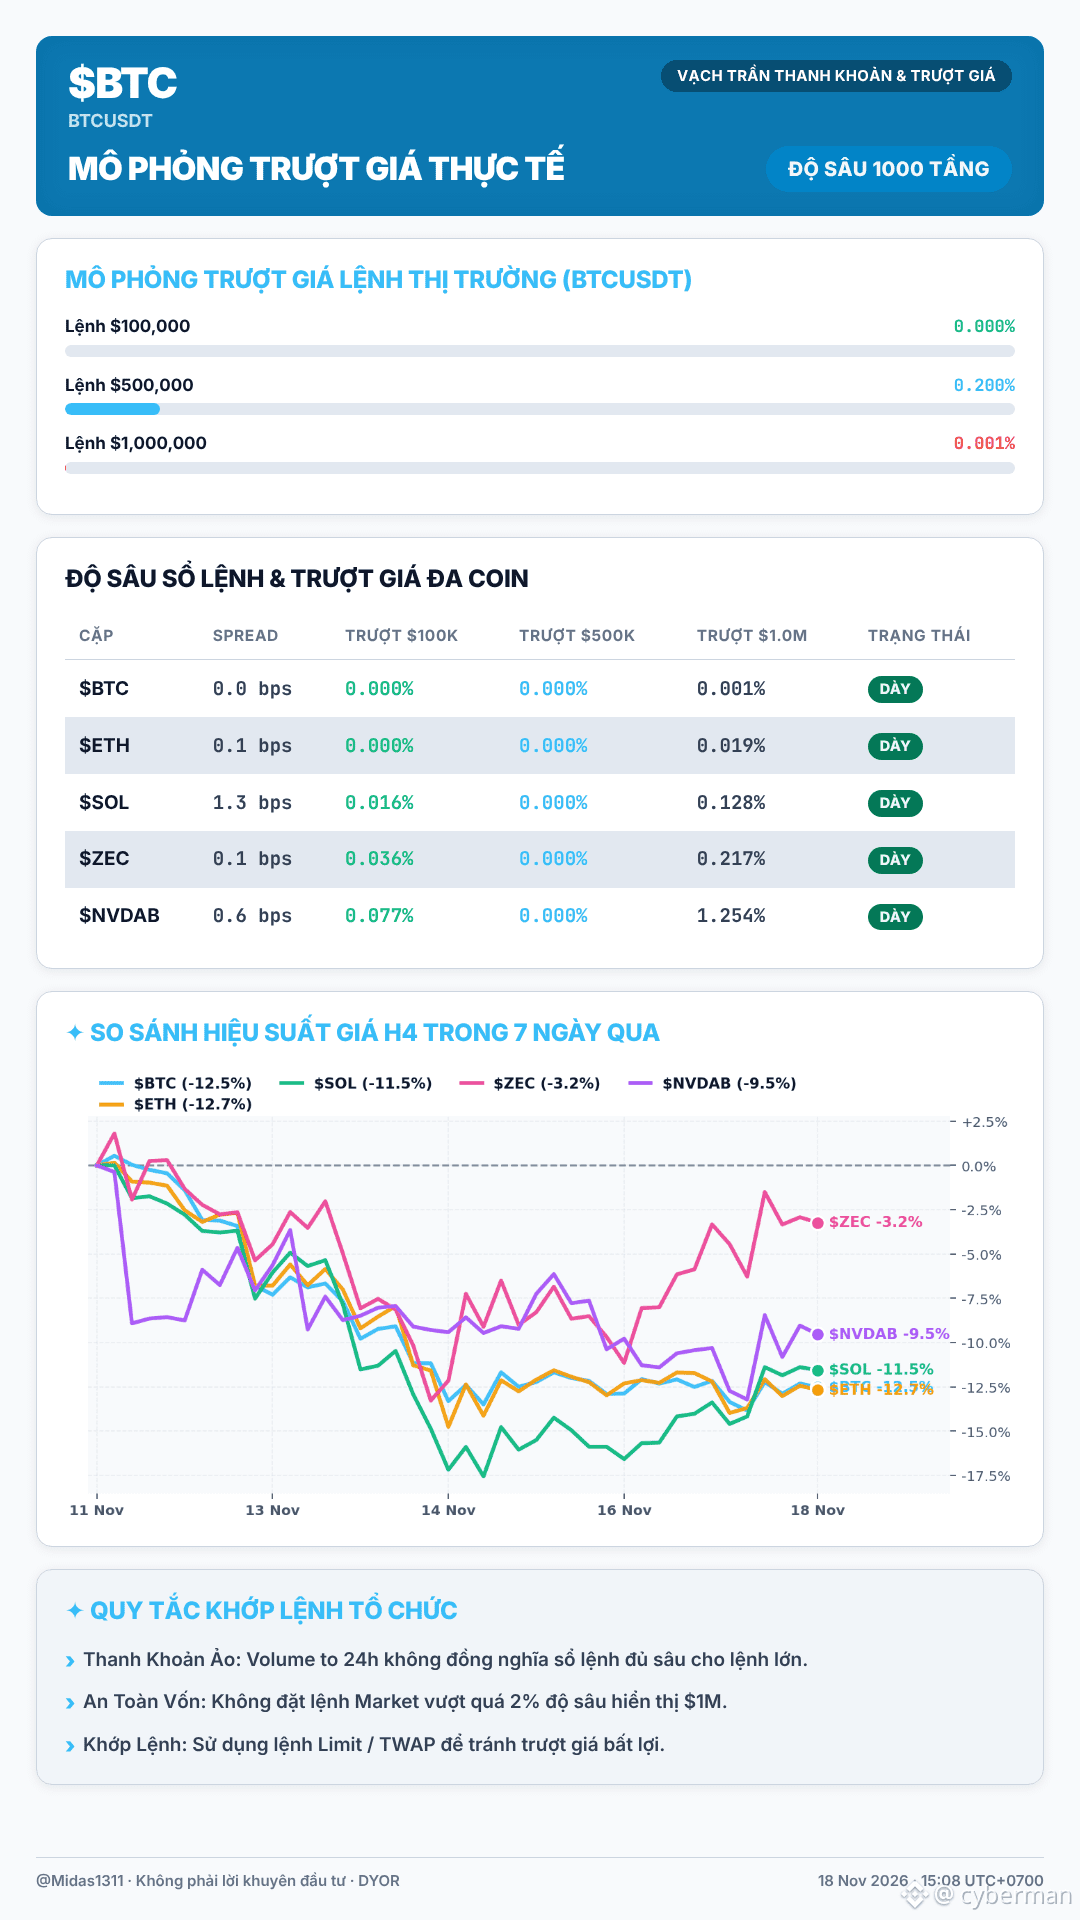
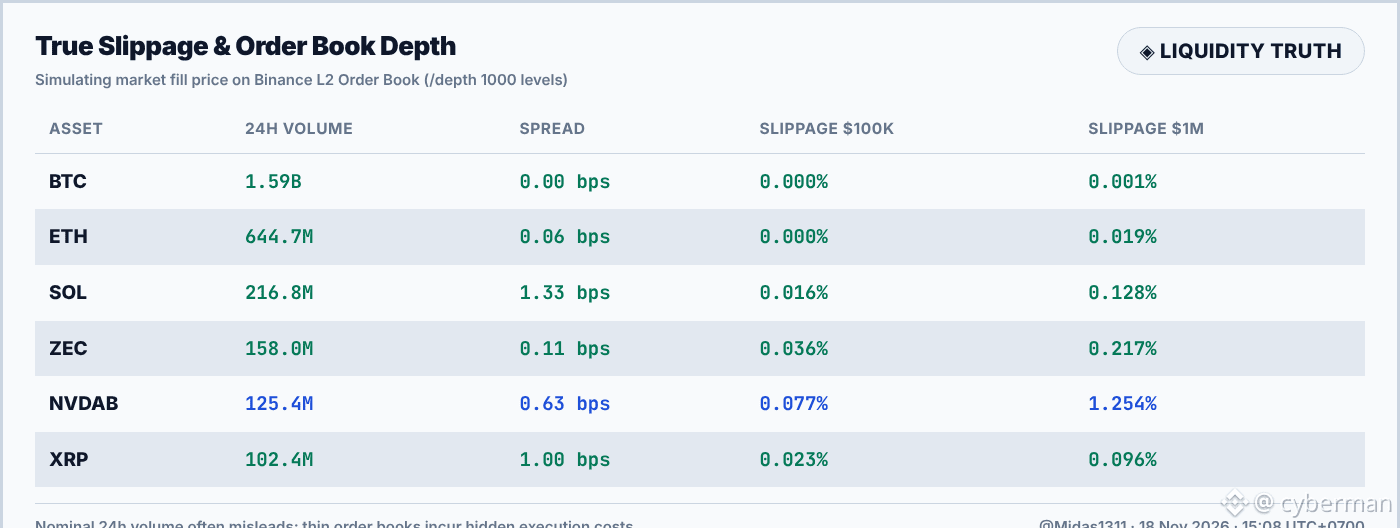
Thử xem mấy con số này. $BTC với volume hơn $1.59 tỷ, lệnh $1M chỉ trượt 0.001%. ETH cũng mượt mà, volume $644.7 triệu, lệnh $1M trượt 0.019%. Đấy là thanh khoản chuẩn mực. 🤓
Giờ nhìn sang SOL, volume hơn $216 triệu, khá đấy, nhưng lệnh $1M đã trượt 0.128%. ZEC còn "thốn" hơn, volume $158 triệu mà lệnh $1M đã bay 0.217%. NVDAB thì đúng kiểu "cá mập" chơi, volume chỉ $125 triệu mà lệnh $1M trượt tới 1.254%. Nghĩa là vào 1 triệu USD thì đã mất đứt $12,540 tiền trượt giá. Khá gắt. 👀
Rõ ràng, volume 24h chỉ là câu chuyện đã qua. Cái quan trọng là độ dày sổ lệnh hiện tại. Nhiều anh em cứ nhìn con số volume to đùng mà đu đỉnh, nhặt spot lệnh market là dễ bị phí ẩn từ spread và slippage giết chết tài khoản nhanh hơn cả việc gãy cấu trúc.
BTC đang lình xình thế này, nhiều người lại đi soi chart. Nhưng tôi thì lại nhìn vào sổ lệnh, và thấy một sự thật phũ phàng: volume 24h cao chưa chắc đã là thanh khoản thật. 😐
Thử xem mấy con số này. $BTC với volume hơn $1.59 tỷ, lệnh $1M chỉ trượt 0.001%. ETH cũng mượt mà, volume $644.7 triệu, lệnh $1M trượt 0.019%. Đấy là thanh khoản chuẩn mực. 🤓
Giờ nhìn sang SOL, volume hơn $216 triệu, khá đấy, nhưng lệnh $1M đã trượt 0.128%. ZEC còn "thốn" hơn, volume $158 triệu mà lệnh $1M đã bay 0.217%. NVDAB thì đúng kiểu "cá mập" chơi, volume chỉ $125 triệu mà lệnh $1M trượt tới 1.254%. Nghĩa là vào 1 triệu USD thì đã mất đứt $12,540 tiền trượt giá. Khá gắt. 👀
Rõ ràng, volume 24h chỉ là câu chuyện đã qua. Cái quan trọng là độ dày sổ lệnh hiện tại. Nhiều anh em cứ nhìn con số volume to đùng mà đu đỉnh, nhặt spot lệnh market là dễ bị phí ẩn từ spread và slippage giết chết tài khoản nhanh hơn cả việc gãy cấu trúc.
Thử xem mấy con số này. $BTC với volume hơn $1.59 tỷ, lệnh $1M chỉ trượt 0.001%. ETH cũng mượt mà, volume $644.7 triệu, lệnh $1M trượt 0.019%. Đấy là thanh khoản chuẩn mực. 🤓
Giờ nhìn sang SOL, volume hơn $216 triệu, khá đấy, nhưng lệnh $1M đã trượt 0.128%. ZEC còn "thốn" hơn, volume $158 triệu mà lệnh $1M đã bay 0.217%. NVDAB thì đúng kiểu "cá mập" chơi, volume chỉ $125 triệu mà lệnh $1M trượt tới 1.254%. Nghĩa là vào 1 triệu USD thì đã mất đứt $12,540 tiền trượt giá. Khá gắt. 👀
Rõ ràng, volume 24h chỉ là câu chuyện đã qua. Cái quan trọng là độ dày sổ lệnh hiện tại. Nhiều anh em cứ nhìn con số volume to đùng mà đu đỉnh, nhặt spot lệnh market là dễ bị phí ẩn từ spread và slippage giết chết tài khoản nhanh hơn cả việc gãy cấu trúc.
283
·
--
See translation
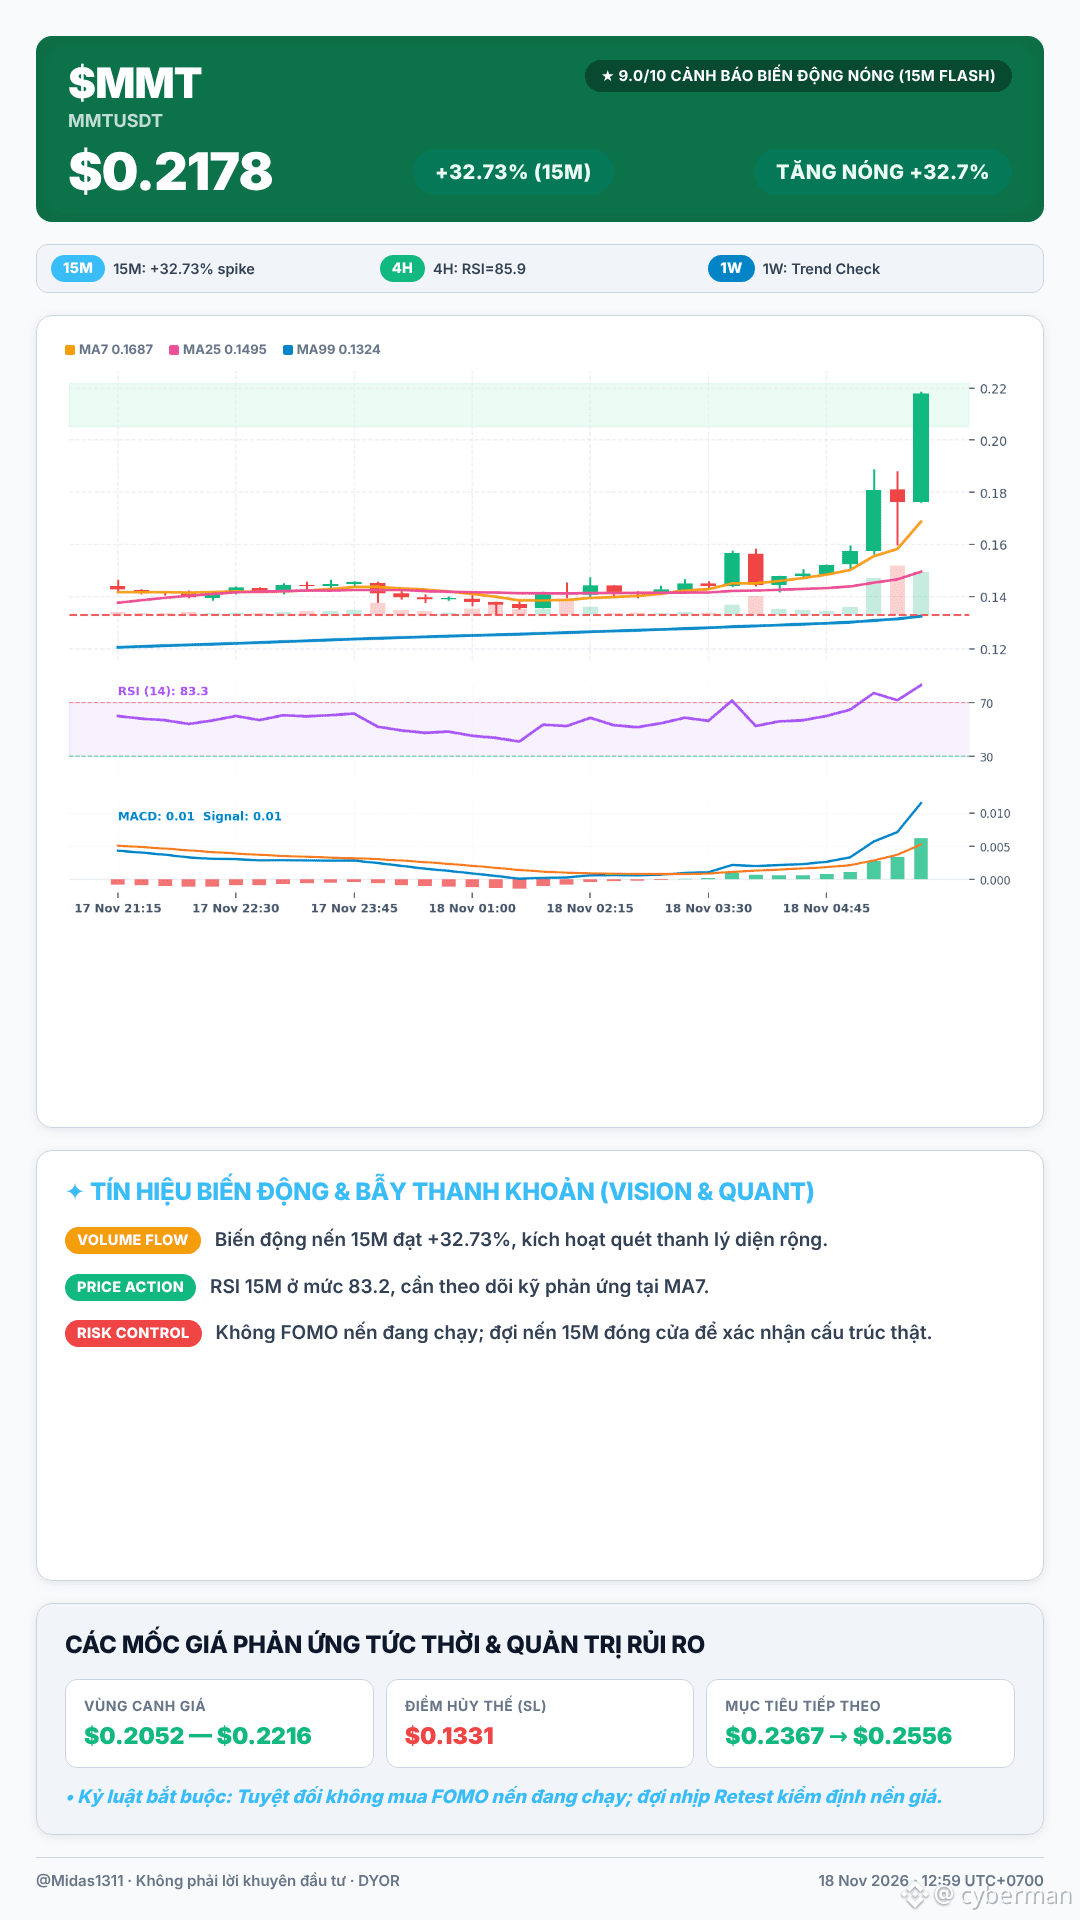
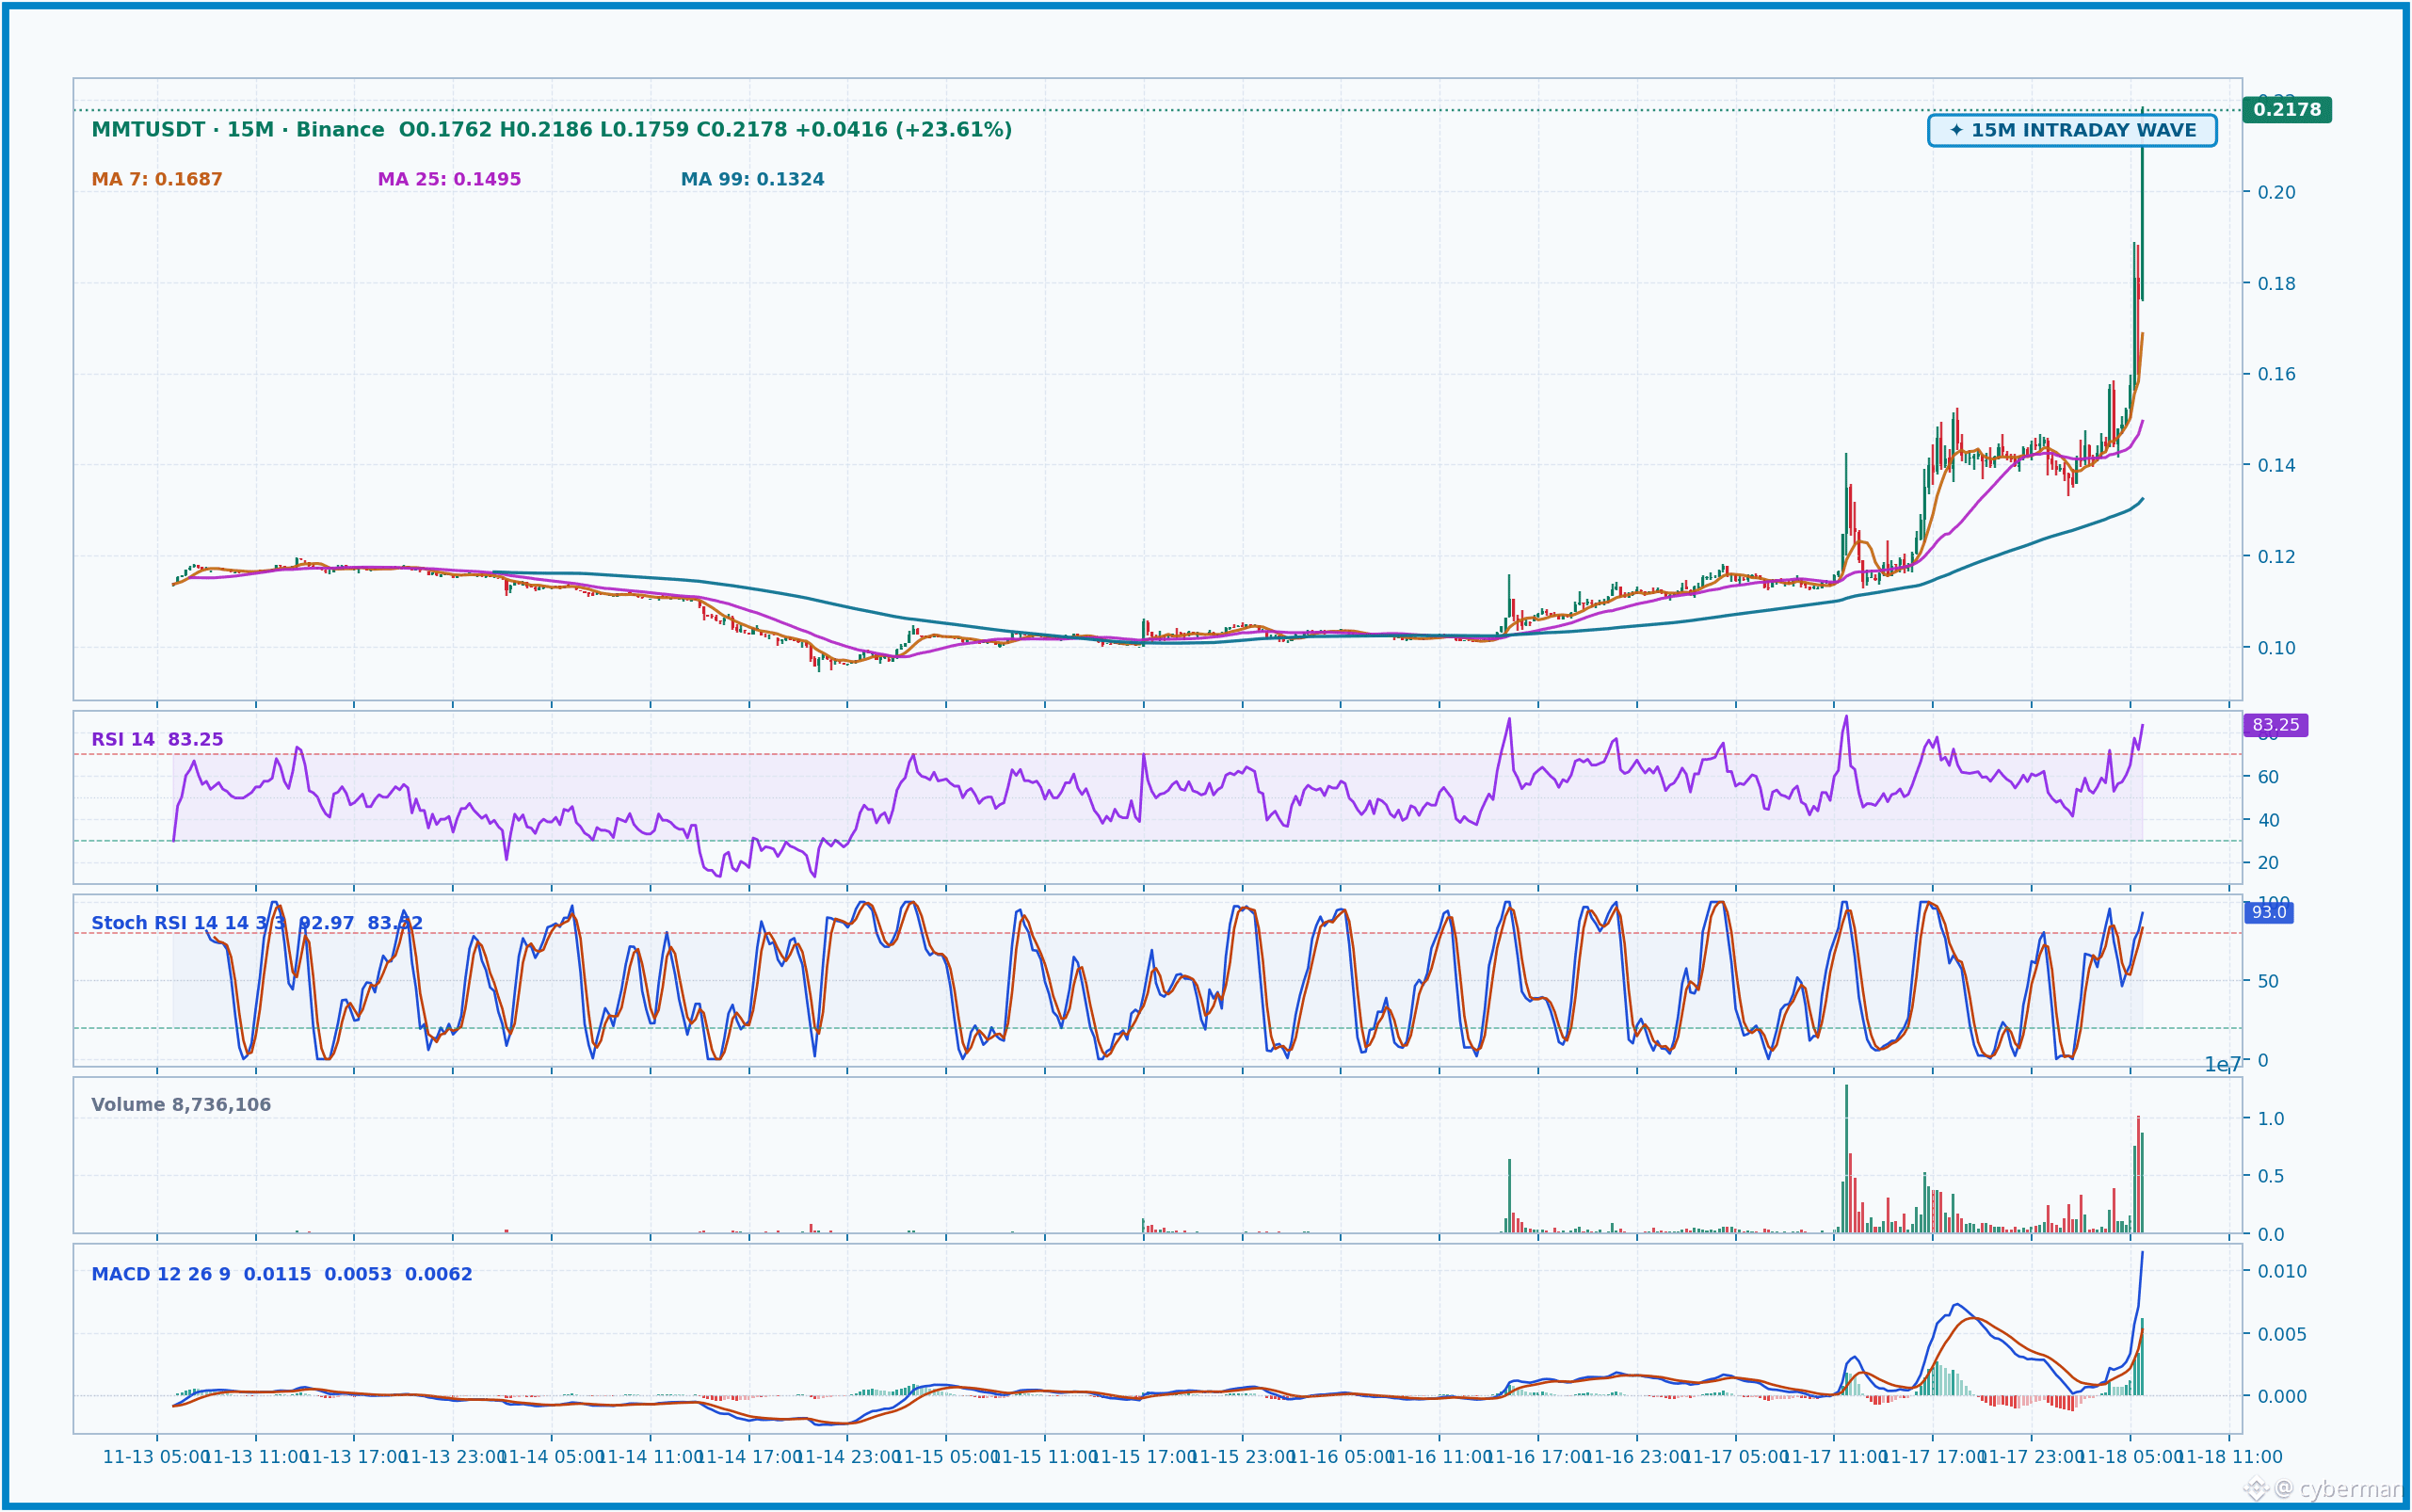
🚨 CẢNH BÁO GIẬT NẾN $MMT! Giá vừa dựng cột thẳng đứng lên $0.2178, tăng nóng 32.73% chỉ trong 15 phút.
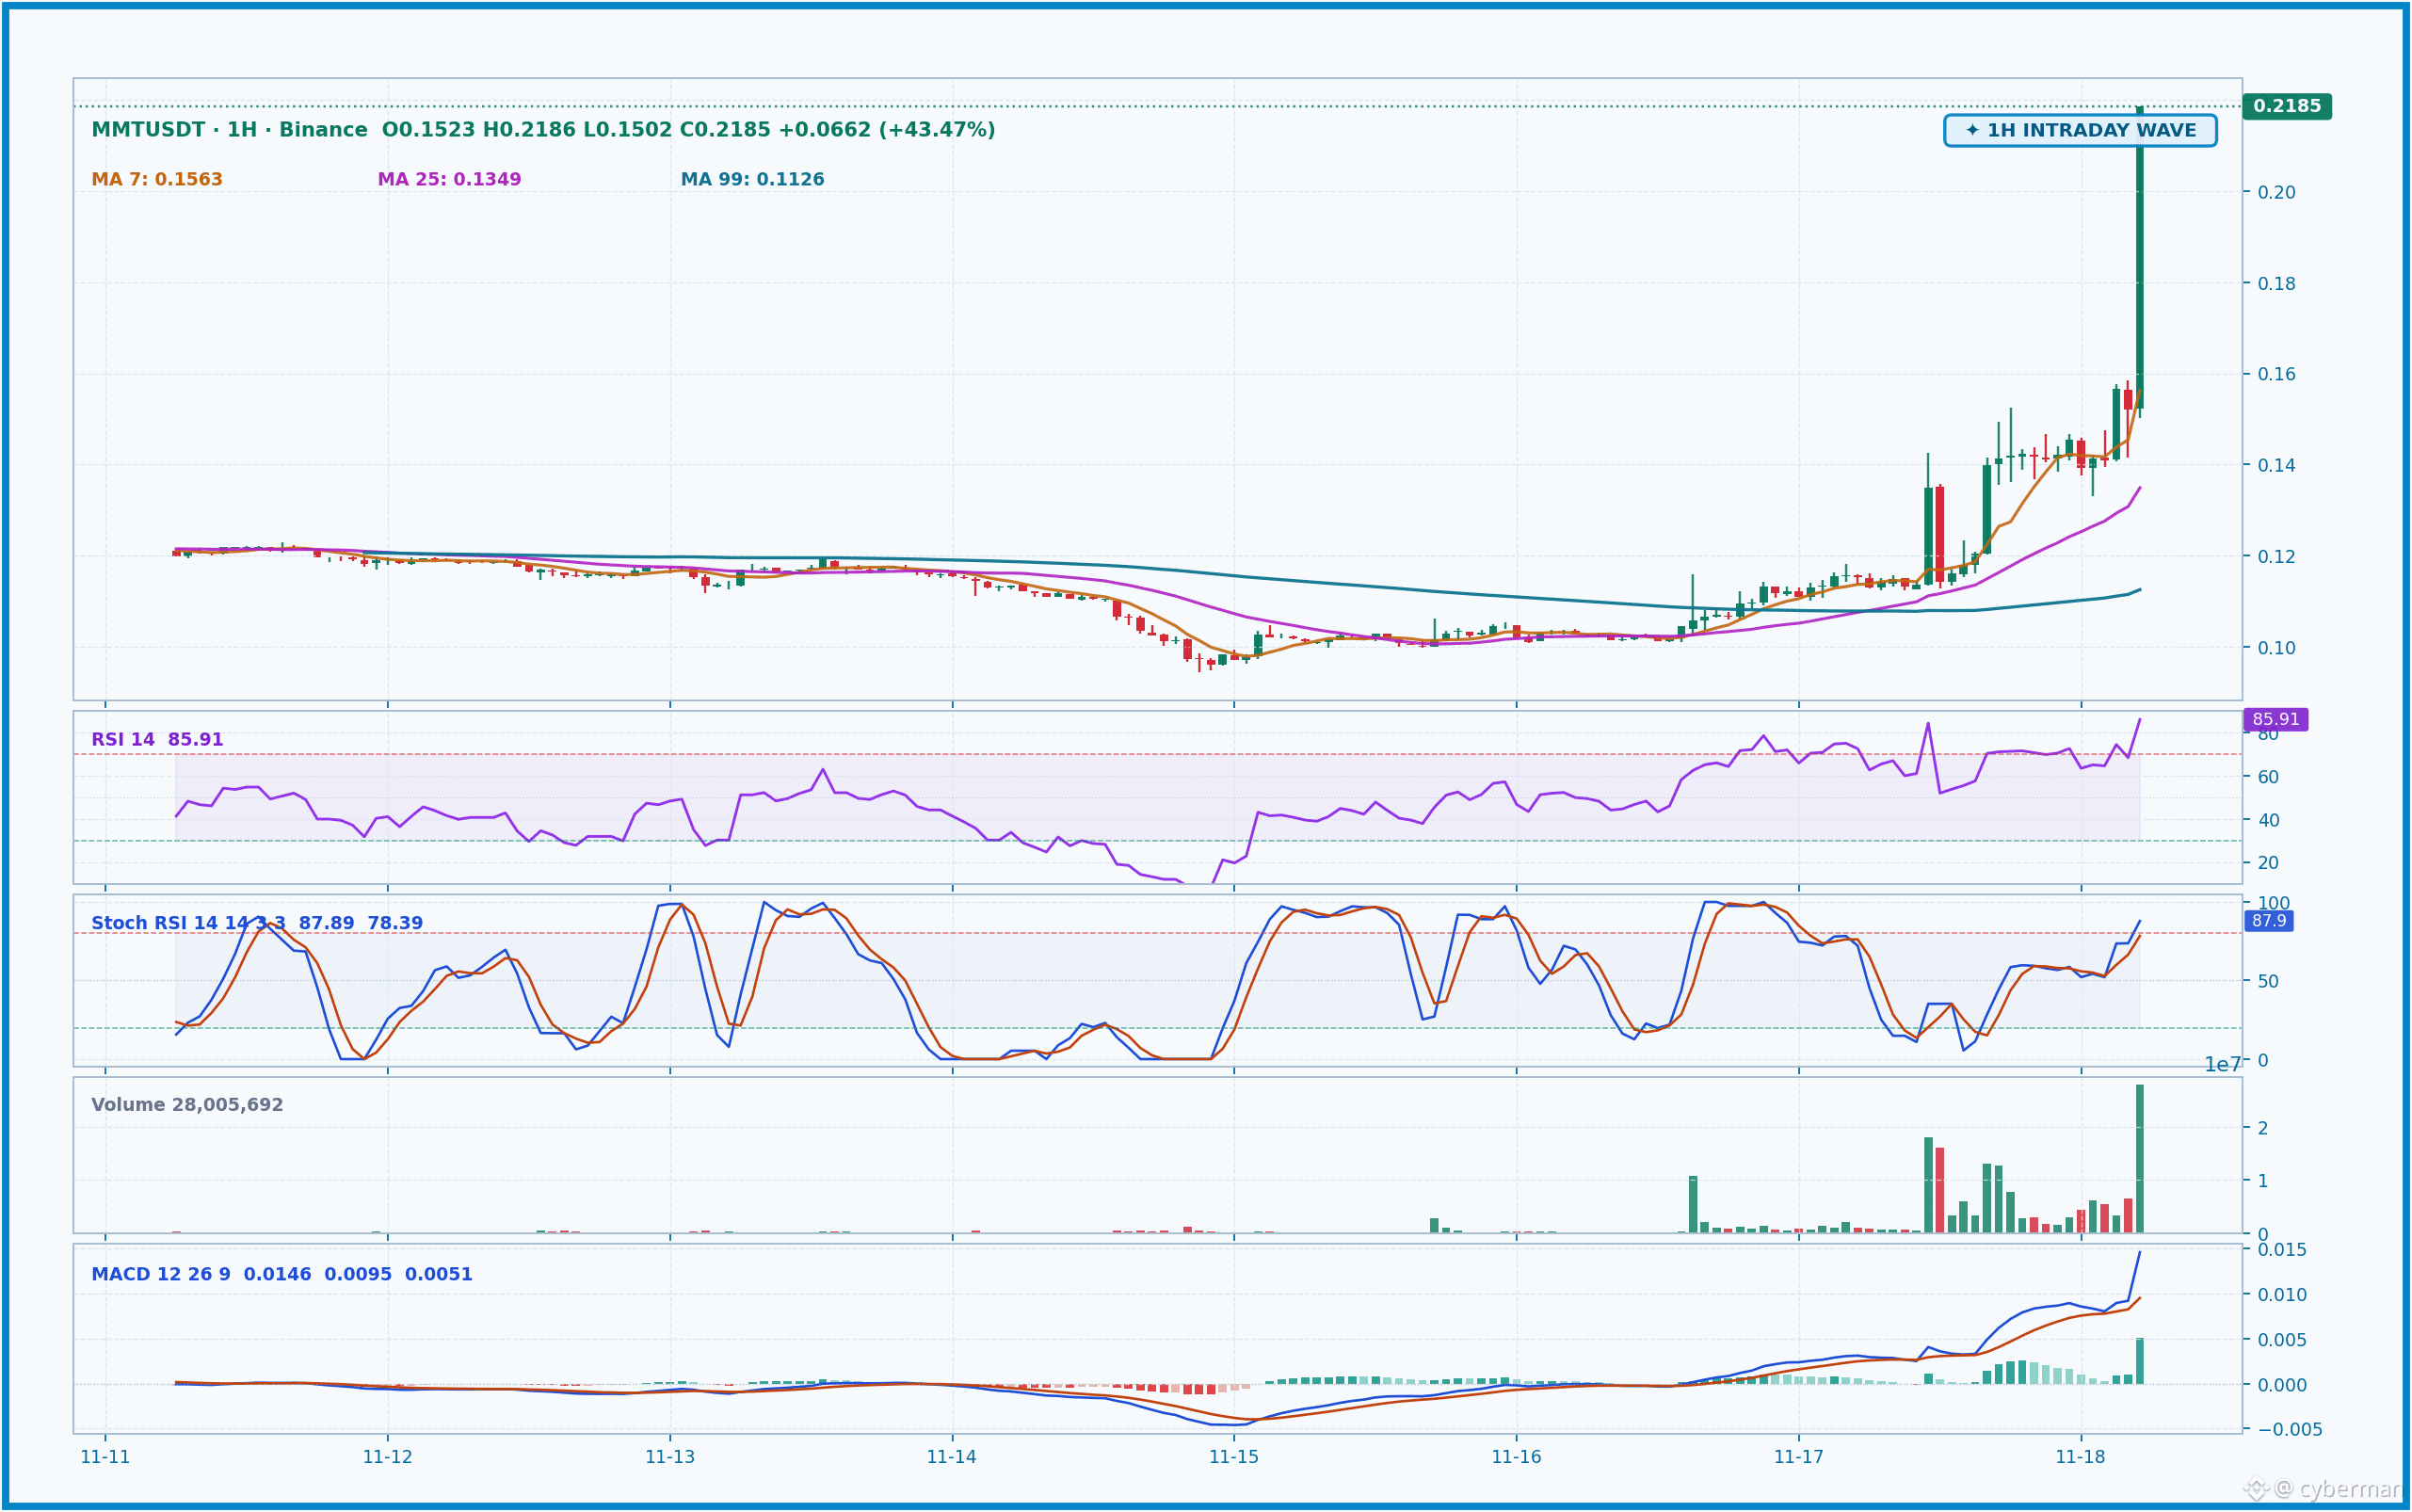
Nhìn Volume nến 15m vọt gấp 4.3 lần trung bình kèm OI tăng sốc 173.2%, rõ ràng đây là một cú Short Squeeze điển hình. Phe Short bị quét thanh lý hàng loạt đẩy giá bay cao, cộng hưởng với tâm lý FOMO đẩy RSI 15m lên tận 83.2 - vùng quá mua cực độ.
Cực kỳ rủi ro nếu nhảy vào lúc này. MA7 đang ở tận $0.1687, khoảng cách với giá hiện tại quá xa, dễ ăn cú điều chỉnh sâu. Tuyệt đối không FOMO đu đỉnh khi chưa có nến đóng vững trên $0.2186. Theo dõi sát vùng kháng cự $0.2186; nếu điều chỉnh, hỗ trợ ngắn hạn sẽ nằm quanh $0.1331.
Anh em đang hold hay chờ điều chỉnh để vào hàng?
$MMT #EmergencyAlert #CryptoAlert
Disclaimer: Not financial advice.
---
🌐 EN: $MMT is pumping violently with a 173.2% OI surge, signaling a major short squeeze. RSI is overbought (83.2), so avoid FOMOing the top. Watch resistance at $0.2186 and support at $0.1331.
🚨 CẢNH BÁO GIẬT NẾN $MMT ! Giá vừa dựng cột thẳng đứng lên $0.2178, tăng nóng 32.73% chỉ trong 15 phút.
Nhìn Volume nến 15m vọt gấp 4.3 lần trung bình kèm OI tăng sốc 173.2%, rõ ràng đây là một cú Short Squeeze điển hình. Phe Short bị quét thanh lý hàng loạt đẩy giá bay cao, cộng hưởng với tâm lý FOMO đẩy RSI 15m lên tận 83.2 - vùng quá mua cực độ.
Cực kỳ rủi ro nếu nhảy vào lúc này. MA7 đang ở tận $0.1687, khoảng cách với giá hiện tại quá xa, dễ ăn cú điều chỉnh sâu. Tuyệt đối không FOMO đu đỉnh khi chưa có nến đóng vững trên $0.2186. Theo dõi sát vùng kháng cự $0.2186; nếu điều chỉnh, hỗ trợ ngắn hạn sẽ nằm quanh $0.1331.
Anh em đang hold hay chờ điều chỉnh để vào hàng?
$MMT #EmergencyAlert #CryptoAlert
Disclaimer: Not financial advice.
---
🌐 EN: $MMT is pumping violently with a 173.2% OI surge, signaling a major short squeeze. RSI is overbought (83.2), so avoid FOMOing the top. Watch resistance at $0.2186 and support at $0.1331.
Nhìn Volume nến 15m vọt gấp 4.3 lần trung bình kèm OI tăng sốc 173.2%, rõ ràng đây là một cú Short Squeeze điển hình. Phe Short bị quét thanh lý hàng loạt đẩy giá bay cao, cộng hưởng với tâm lý FOMO đẩy RSI 15m lên tận 83.2 - vùng quá mua cực độ.
Cực kỳ rủi ro nếu nhảy vào lúc này. MA7 đang ở tận $0.1687, khoảng cách với giá hiện tại quá xa, dễ ăn cú điều chỉnh sâu. Tuyệt đối không FOMO đu đỉnh khi chưa có nến đóng vững trên $0.2186. Theo dõi sát vùng kháng cự $0.2186; nếu điều chỉnh, hỗ trợ ngắn hạn sẽ nằm quanh $0.1331.
Anh em đang hold hay chờ điều chỉnh để vào hàng?
$MMT #EmergencyAlert #CryptoAlert
Disclaimer: Not financial advice.
---
🌐 EN: $MMT is pumping violently with a 173.2% OI surge, signaling a major short squeeze. RSI is overbought (83.2), so avoid FOMOing the top. Watch resistance at $0.2186 and support at $0.1331.
347
·
--
See translation
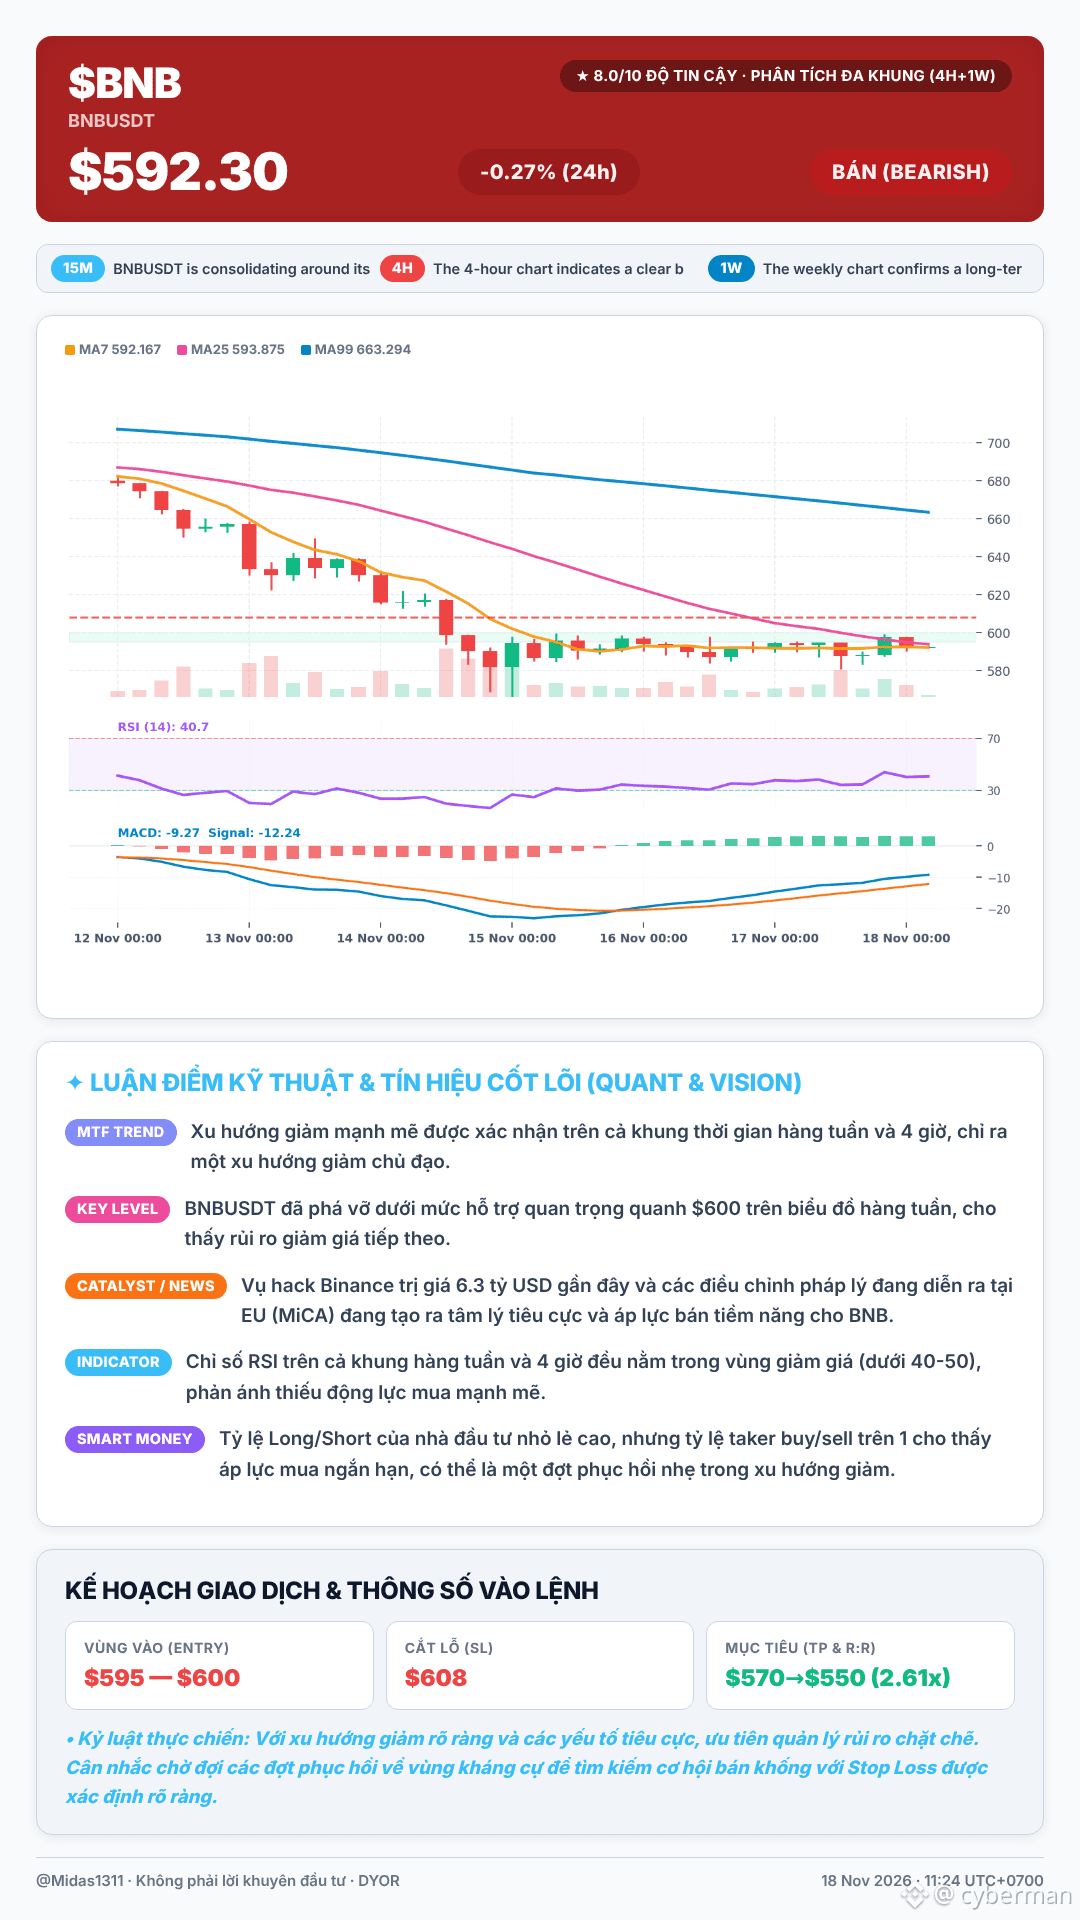
Thấy $BNB lình xình mấy hôm nay mà tui thấy nhột nhột ghê. Cả nhà còn nhớ vụ hack Binance 6.3 tỷ USD cuối tháng 10 vừa rồi không? Đó là một cú giáng trời khiến tâm lý thị trường méo mó, BNB từng có lúc rơi dưới $600 và đang vật vờ ở vùng này. Thêm vào đó, câu chuyện MiCA ở châu Âu vẫn còn lằng nhằng, Binance rút đơn xin cấp phép ở Hy Lạp hồi tháng 6 và vẫn đang loay hoay tìm đường ở thị trường khó tính này, ảnh hưởng không nhỏ đến niềm tin.
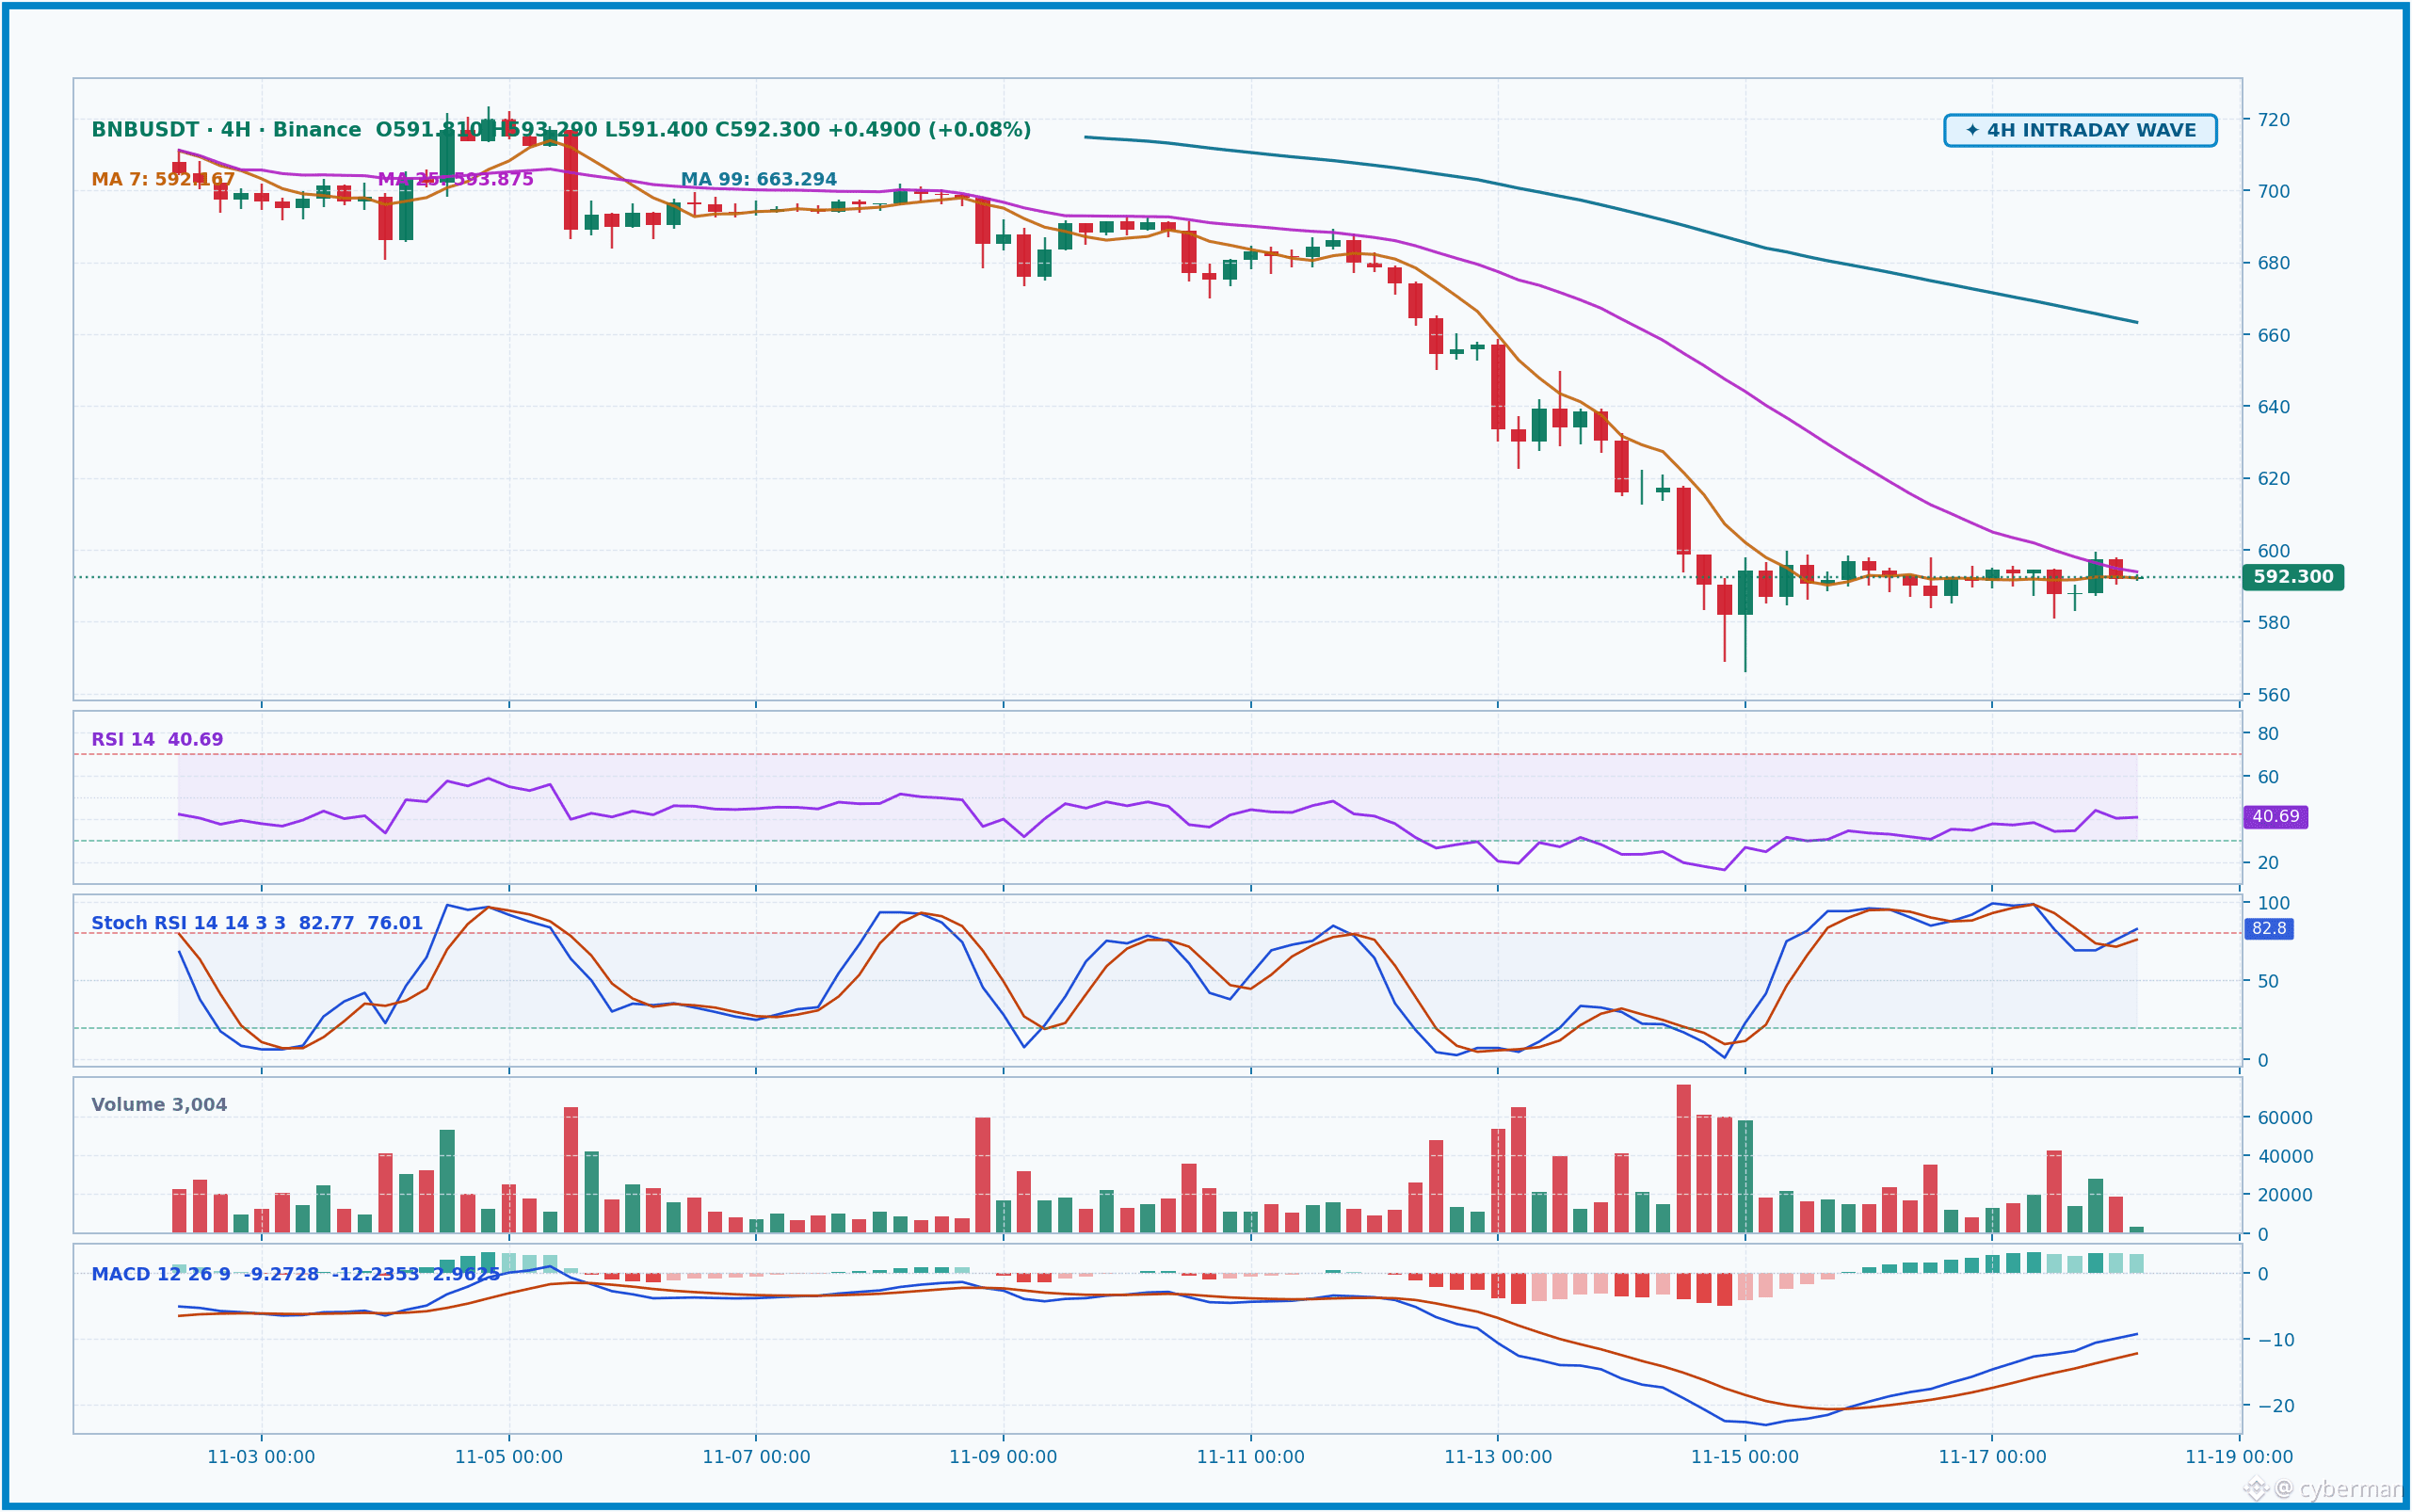
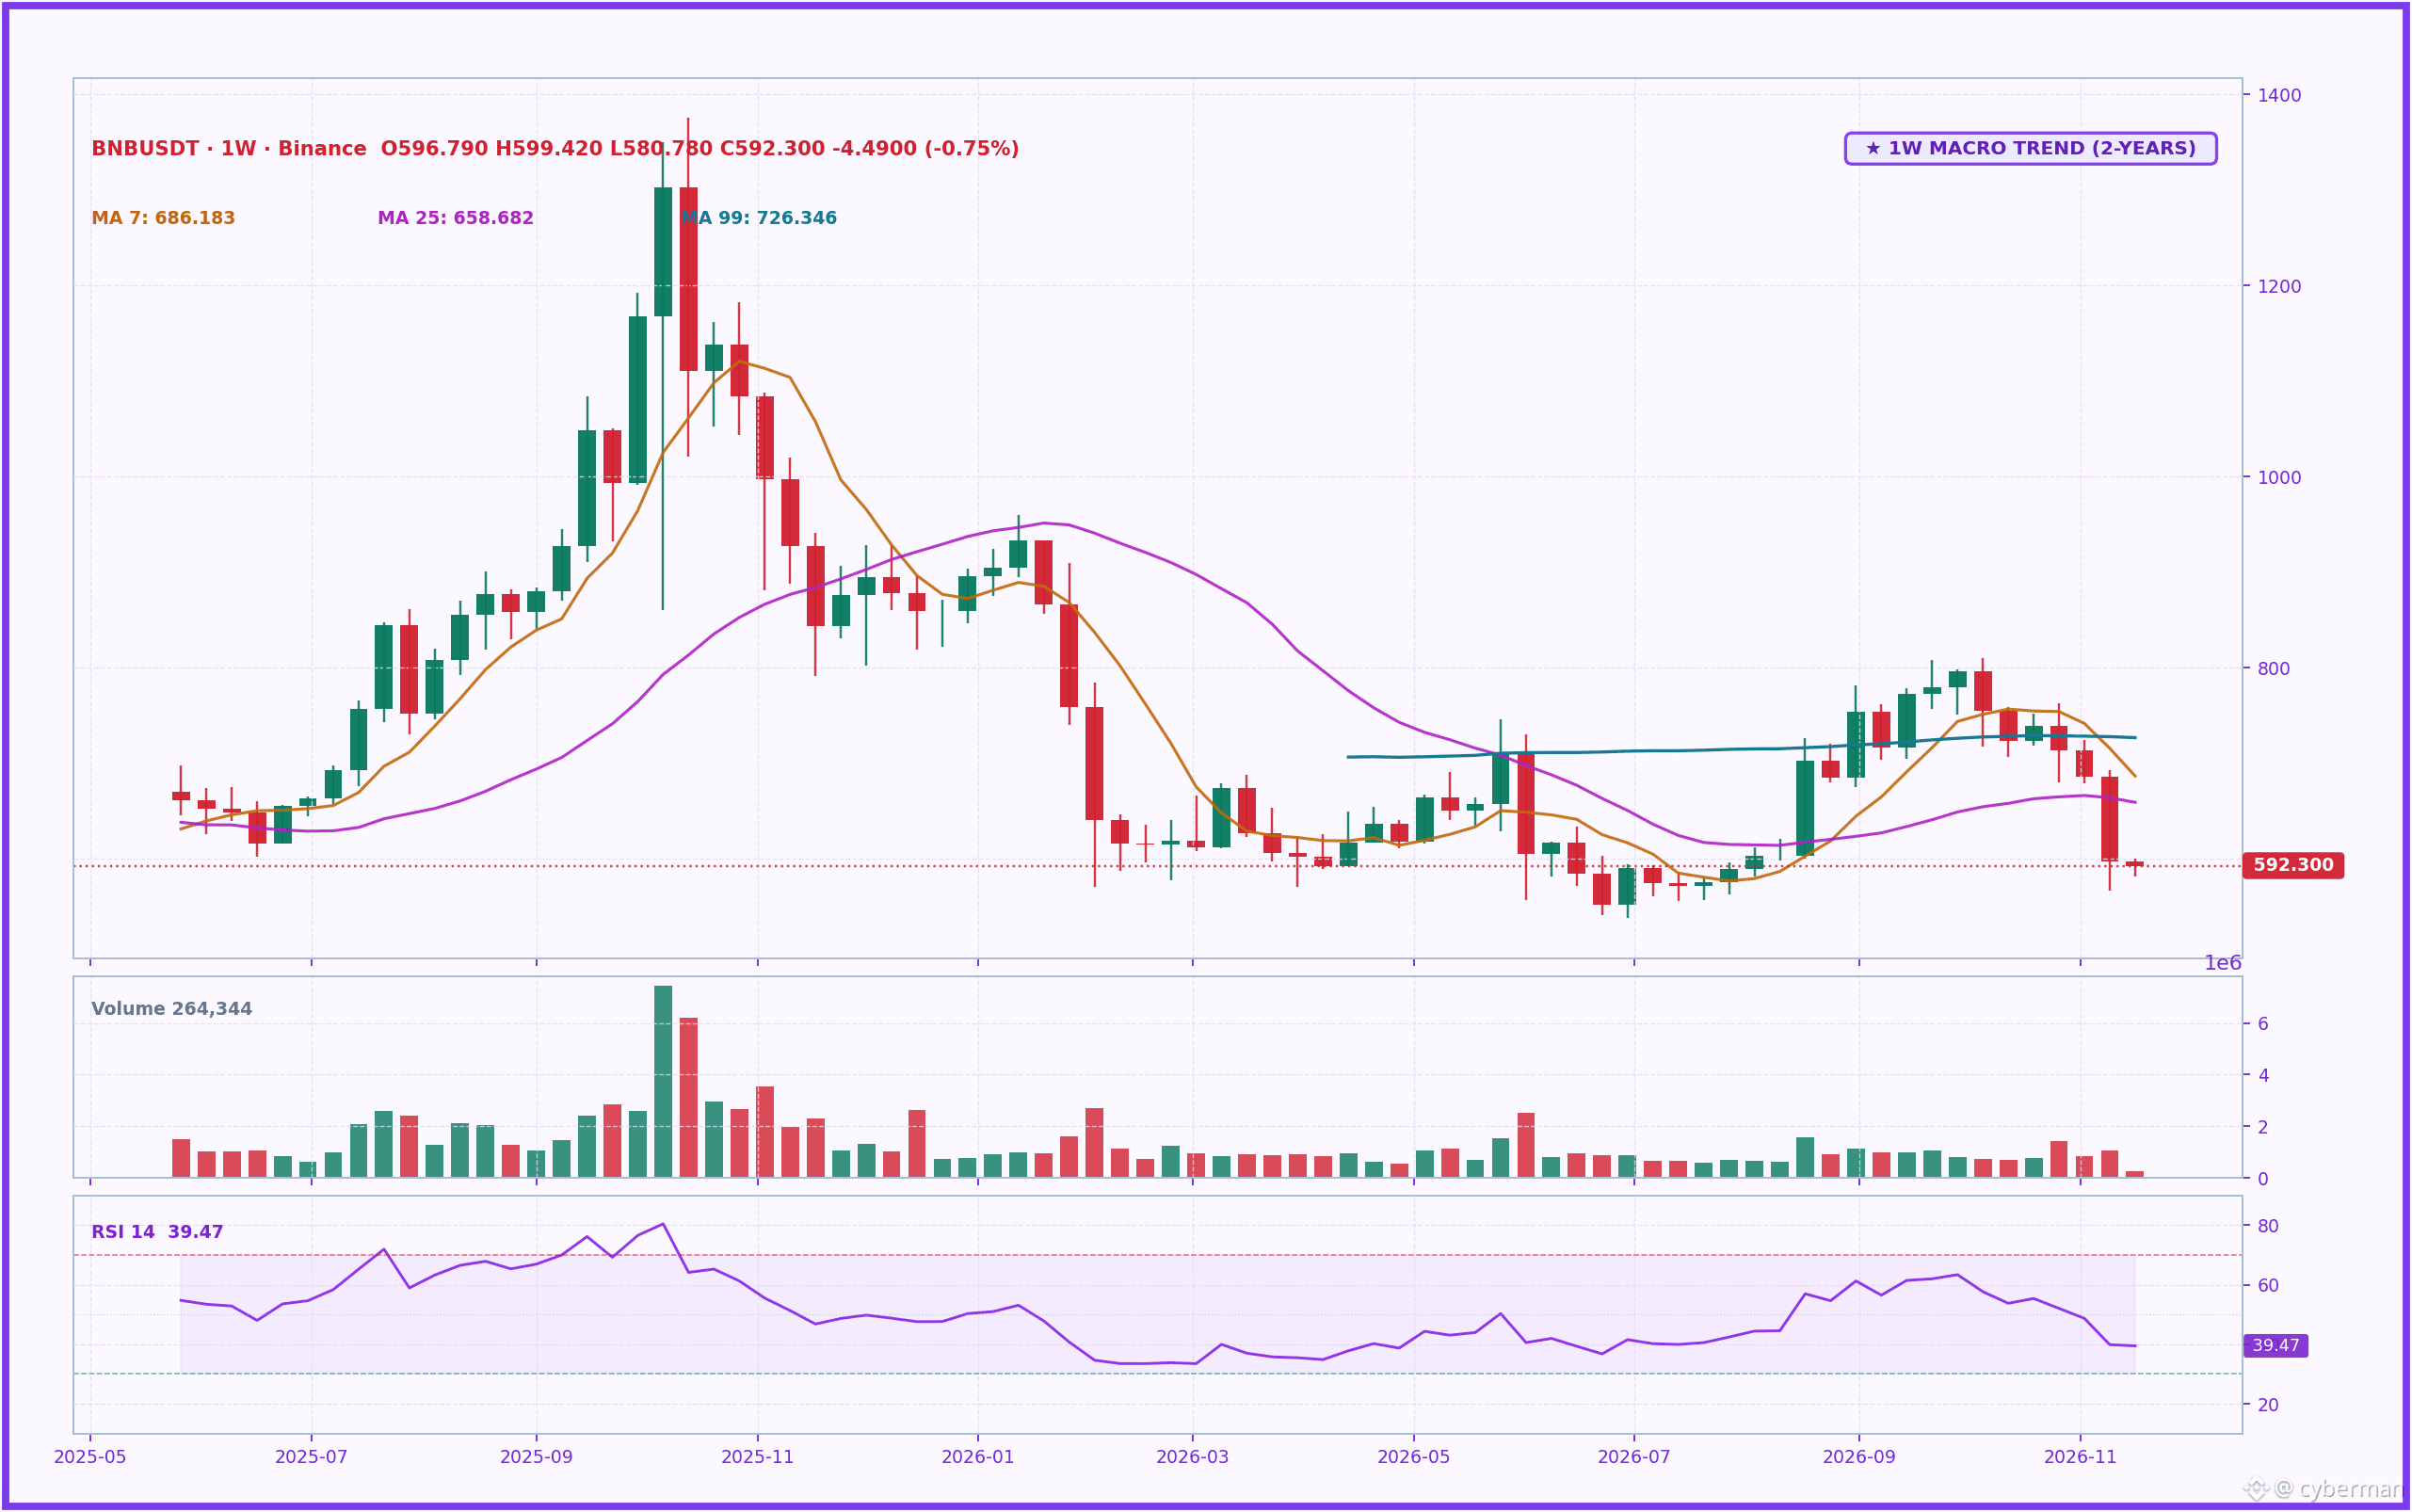
Nhìn vào chart, khung 1W (macro) thì khỏi nói, một xu hướng giảm rõ ràng, và BNBUSDT đã gãy cái hỗ trợ cứng quanh $600 từ lâu rồi. RSI tuần cũng chỉ có 39.5, yếu xìu. Sang khung 4H, giá đang lình xình quanh $592.30, MA7 ($592.167) và MA25 ($593.875) đang bám sát nhau, RSI 40.7 cũng đang ở vùng giảm giá. Đặc biệt, dải Bollinger Bands đang nén cực chặt (chỉ 2.12%), báo hiệu một cú phá rất nhanh và mạnh sắp tới, không lằng nhằng đâu.
Thấy $BNB lình xình mấy hôm nay mà tui thấy nhột nhột ghê. Cả nhà còn nhớ vụ hack Binance 6.3 tỷ USD cuối tháng 10 vừa rồi không? Đó là một cú giáng trời khiến tâm lý thị trường méo mó, BNB từng có lúc rơi dưới $600 và đang vật vờ ở vùng này. Thêm vào đó, câu chuyện MiCA ở châu Âu vẫn còn lằng nhằng, Binance rút đơn xin cấp phép ở Hy Lạp hồi tháng 6 và vẫn đang loay hoay tìm đường ở thị trường khó tính này, ảnh hưởng không nhỏ đến niềm tin.
Nhìn vào chart, khung 1W (macro) thì khỏi nói, một xu hướng giảm rõ ràng, và BNBUSDT đã gãy cái hỗ trợ cứng quanh $600 từ lâu rồi. RSI tuần cũng chỉ có 39.5, yếu xìu. Sang khung 4H, giá đang lình xình quanh $592.30, MA7 ($592.167) và MA25 ($593.875) đang bám sát nhau, RSI 40.7 cũng đang ở vùng giảm giá. Đặc biệt, dải Bollinger Bands đang nén cực chặt (chỉ 2.12%), báo hiệu một cú phá rất nhanh và mạnh sắp tới, không lằng nhằng đâu.
Nhìn vào chart, khung 1W (macro) thì khỏi nói, một xu hướng giảm rõ ràng, và BNBUSDT đã gãy cái hỗ trợ cứng quanh $600 từ lâu rồi. RSI tuần cũng chỉ có 39.5, yếu xìu. Sang khung 4H, giá đang lình xình quanh $592.30, MA7 ($592.167) và MA25 ($593.875) đang bám sát nhau, RSI 40.7 cũng đang ở vùng giảm giá. Đặc biệt, dải Bollinger Bands đang nén cực chặt (chỉ 2.12%), báo hiệu một cú phá rất nhanh và mạnh sắp tới, không lằng nhằng đâu.
401
·
--
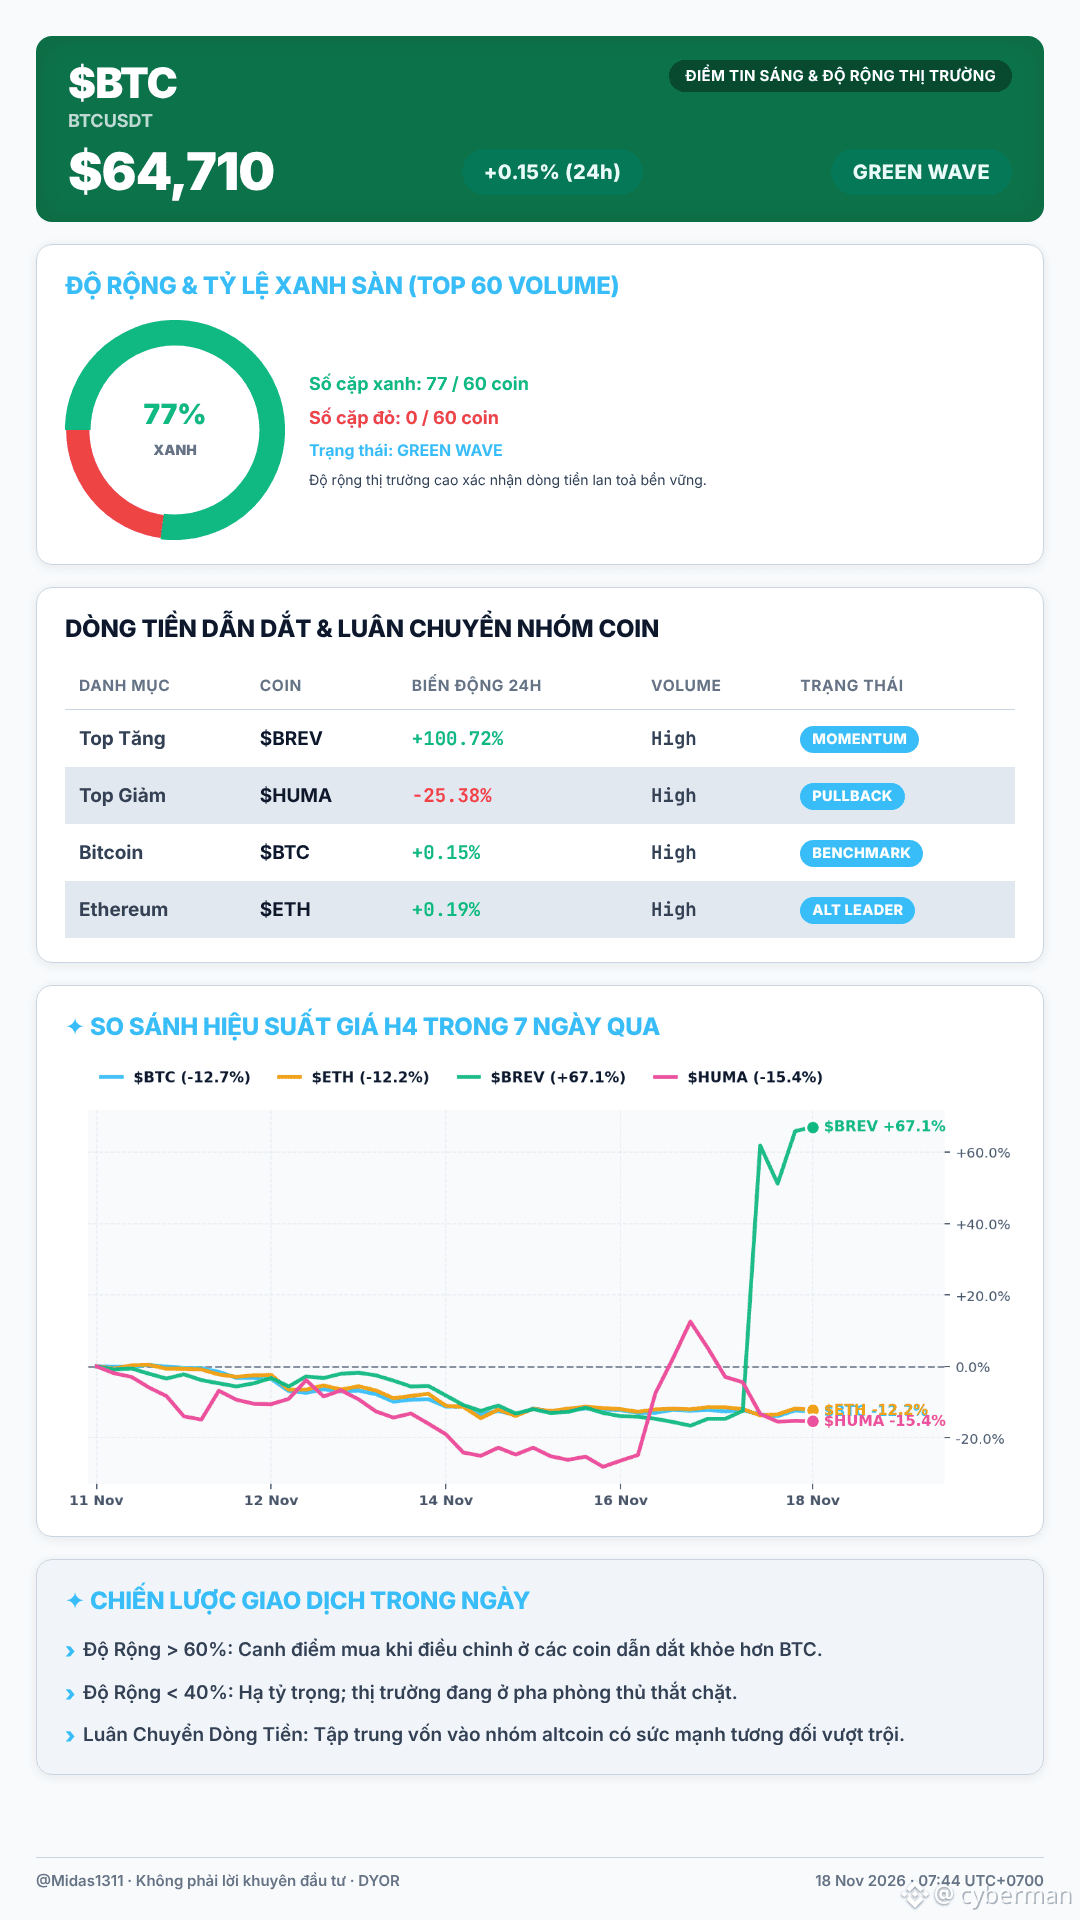
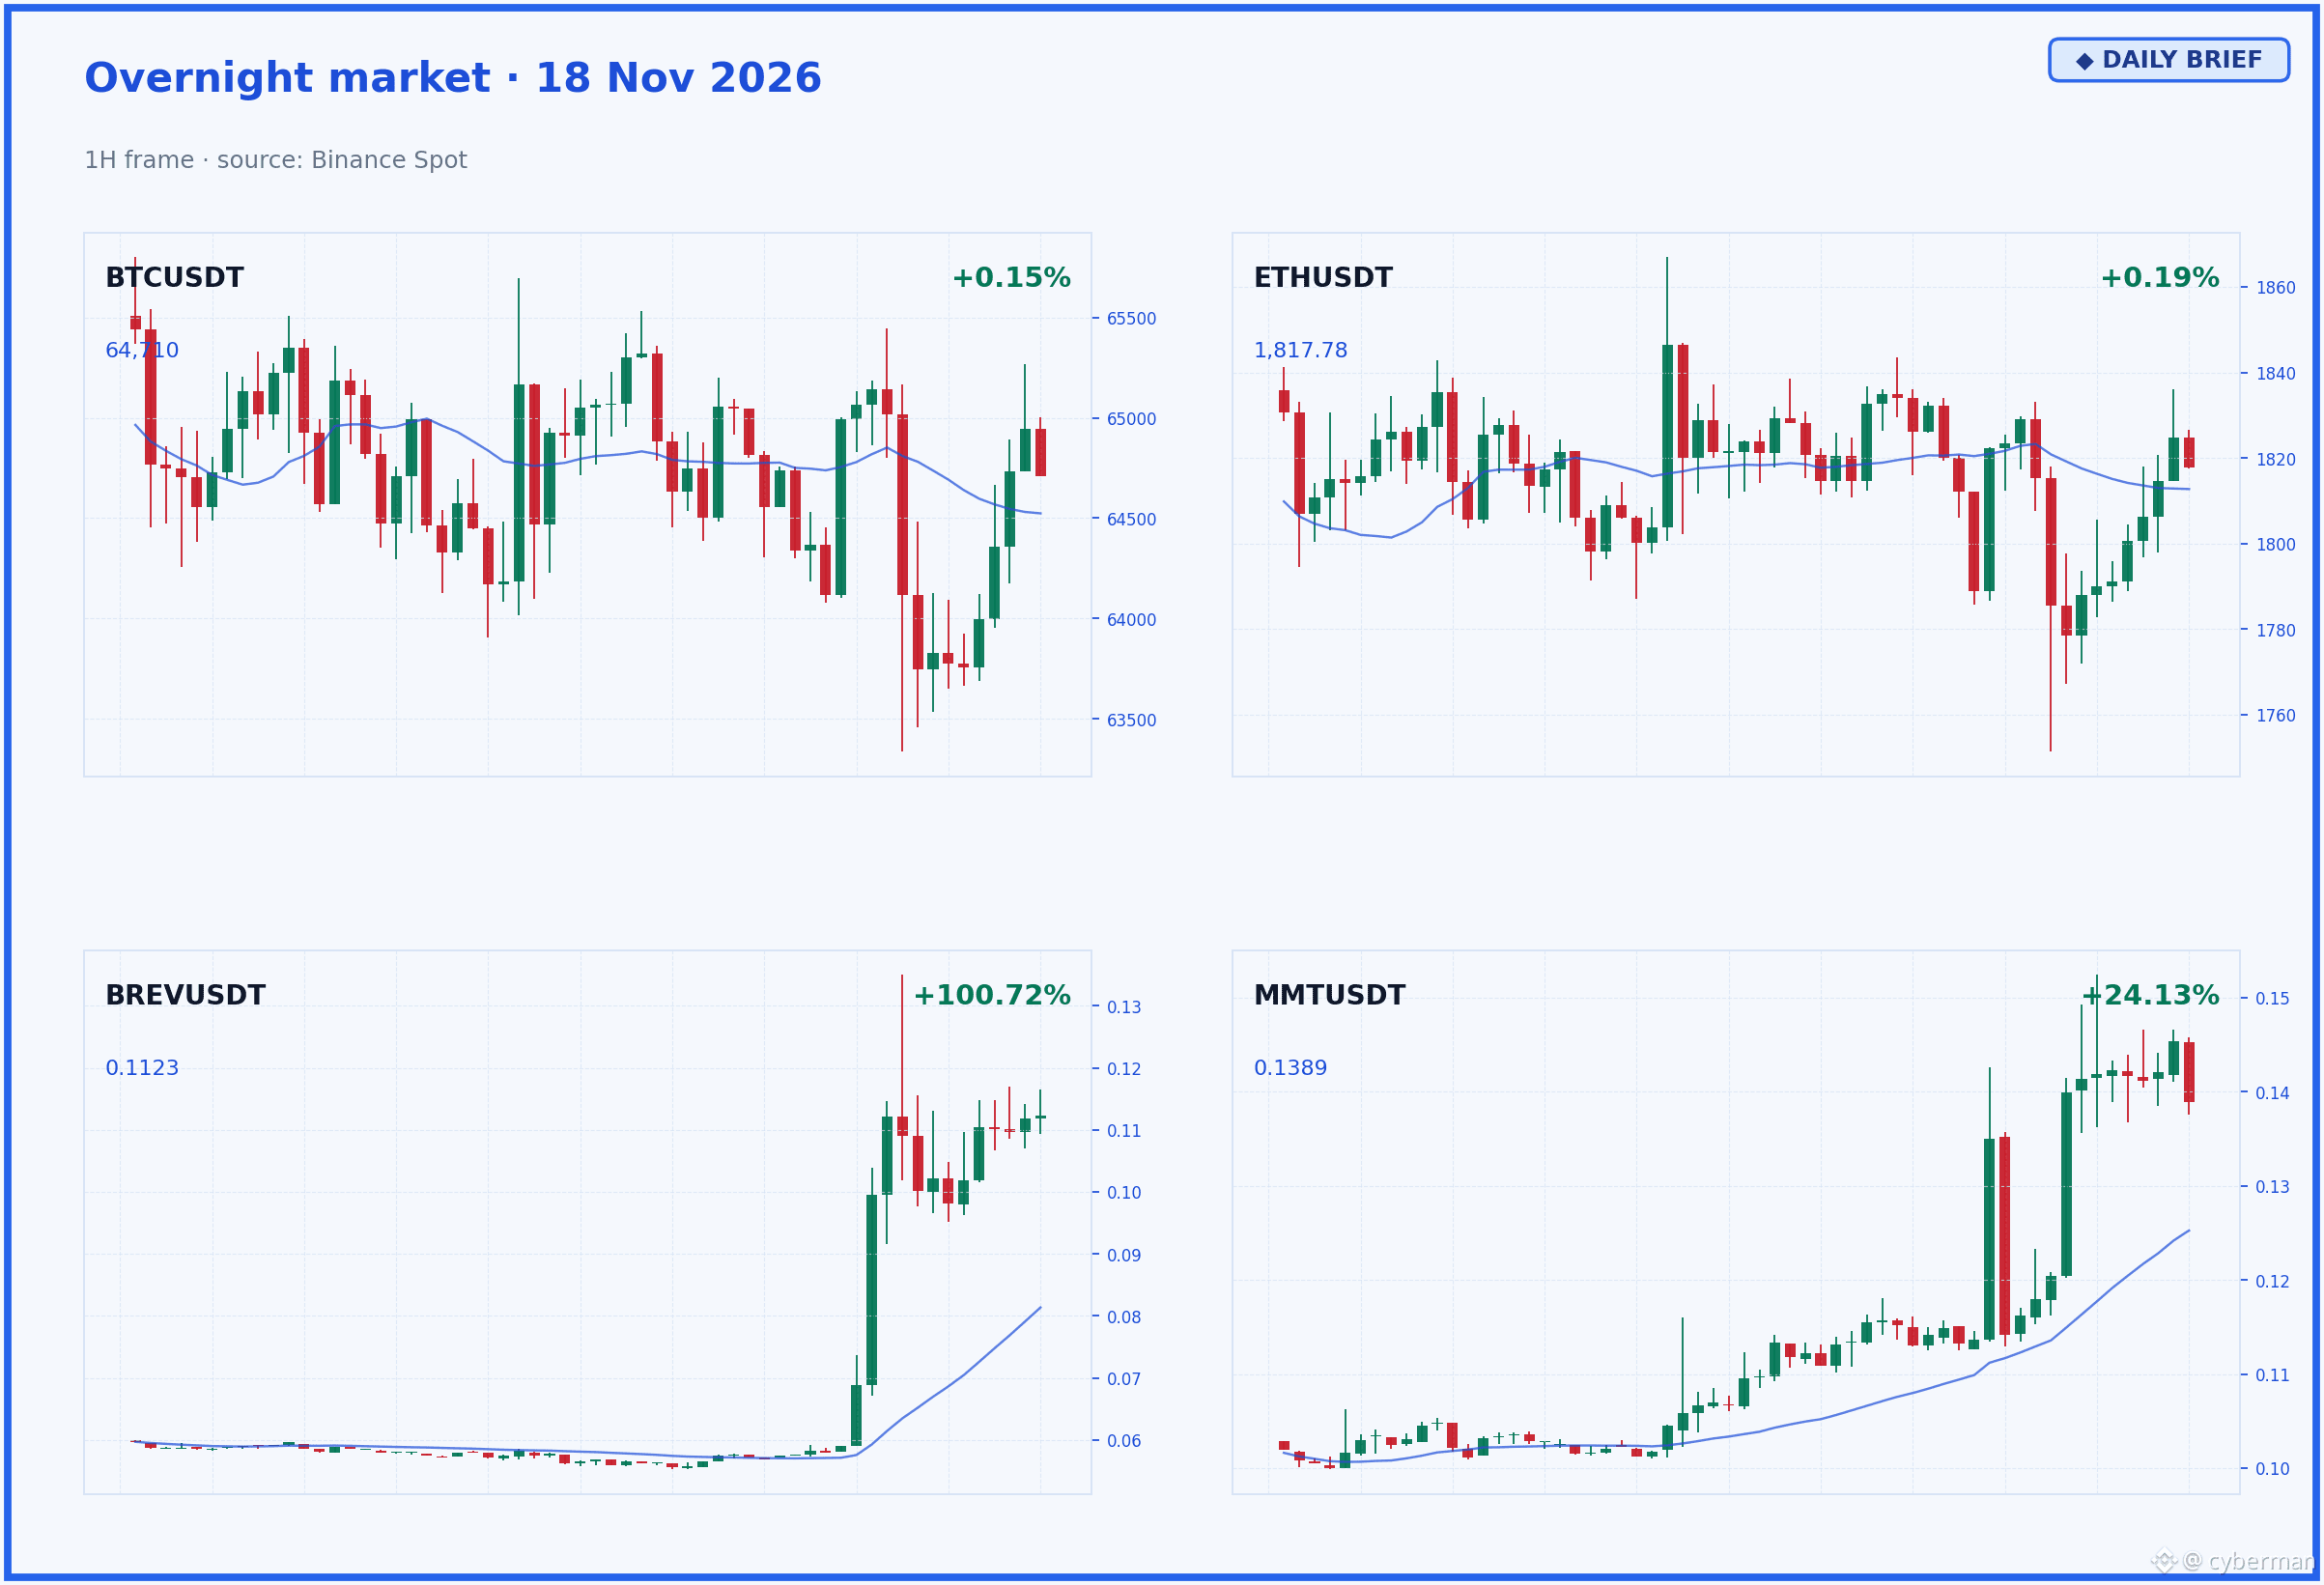
BTC is still hovering around $64,710.00 (+0.15%), while ETH at $1,817.78 (+0.19%) points to a slowdown after a volatile week. Market breadth is generally healthy, with 77% of coins in the green and the top 100's total 24-hour volume reaching $4,178,067,473. However, beneath the calm surface, large capital flows are clearly shifting.
After seven consecutive days of declines, BTC recorded a modest $7.9 million inflow into Spot ETFs on 16/11, ending its prolonged outflow streak. But BlackRock's IBIT brought in $76.5 million, which wasn't enough to offset outflows from other funds, so it's far too early to call this "dip buying." Total flows into Bitcoin ETFs remain negative at $1.98 billion in 2026. ETH has fared even worse: Ether Spot ETFs saw net outflows of $764.1 million in the first two weeks of November, despite Goldman Sachs investing $1.22 billion in ETH ETFs in Q3. This suggests that smart money may have taken profits last quarter and is now waiting for a new opportunity.
$BREV volume exploded by +100.72% overnight, clearly a classic pump-and-dump play or a sign of extremely strong insider news.
BTC is still hovering around $64,710.00 (+0.15%), while ETH at $1,817.78 (+0.19%) points to a slowdown after a volatile week. Market breadth is generally healthy, with 77% of coins in the green and the top 100's total 24-hour volume reaching $4,178,067,473. However, beneath the calm surface, large capital flows are clearly shifting.
After seven consecutive days of declines, BTC recorded a modest $7.9 million inflow into Spot ETFs on 16/11, ending its prolonged outflow streak. But BlackRock's IBIT brought in $76.5 million, which wasn't enough to offset outflows from other funds, so it's far too early to call this "dip buying." Total flows into Bitcoin ETFs remain negative at $1.98 billion in 2026. ETH has fared even worse: Ether Spot ETFs saw net outflows of $764.1 million in the first two weeks of November, despite Goldman Sachs investing $1.22 billion in ETH ETFs in Q3. This suggests that smart money may have taken profits last quarter and is now waiting for a new opportunity.
$BREV volume exploded by +100.72% overnight, clearly a classic pump-and-dump play or a sign of extremely strong insider news.
After seven consecutive days of declines, BTC recorded a modest $7.9 million inflow into Spot ETFs on 16/11, ending its prolonged outflow streak. But BlackRock's IBIT brought in $76.5 million, which wasn't enough to offset outflows from other funds, so it's far too early to call this "dip buying." Total flows into Bitcoin ETFs remain negative at $1.98 billion in 2026. ETH has fared even worse: Ether Spot ETFs saw net outflows of $764.1 million in the first two weeks of November, despite Goldman Sachs investing $1.22 billion in ETH ETFs in Q3. This suggests that smart money may have taken profits last quarter and is now waiting for a new opportunity.
$BREV volume exploded by +100.72% overnight, clearly a classic pump-and-dump play or a sign of extremely strong insider news.
489
·
--
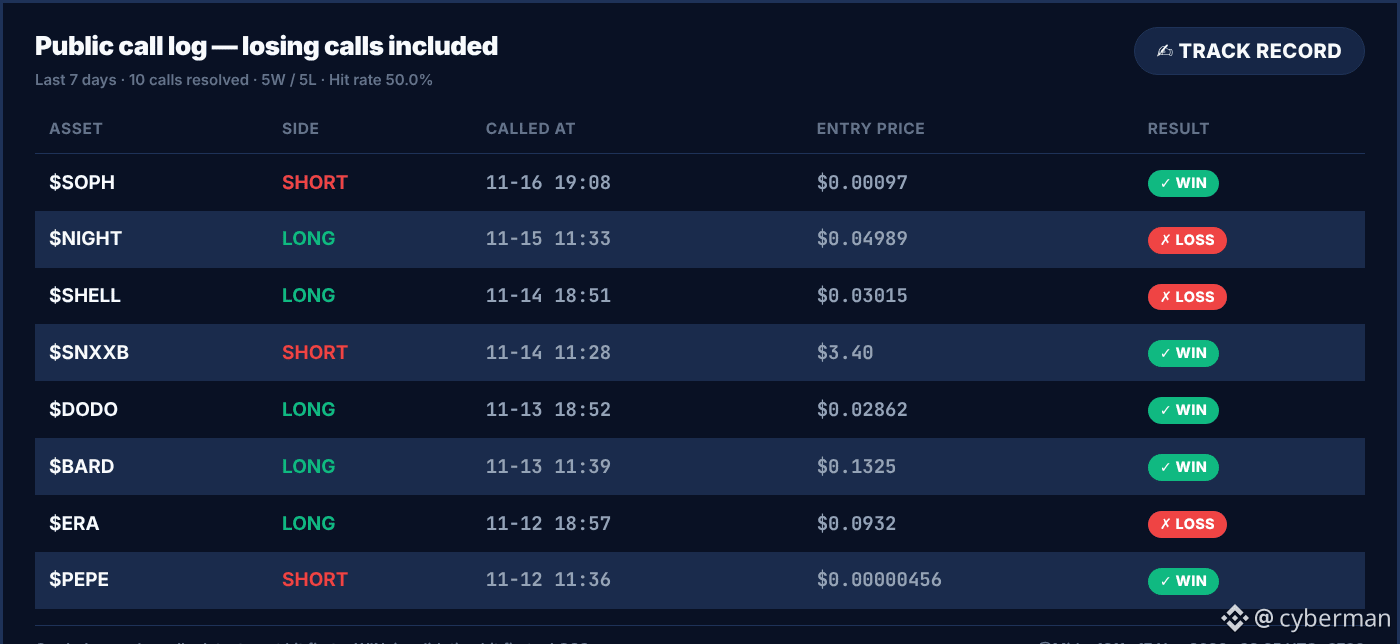
Even though I look $BTC kind of gloomy, my trading log from last week wasn’t much better, folks. 10 trades closed in total: 5 wins, 5 losses. Win rate: 50.0% 😅. I should be upfront about the losses. Night LONG @ $0.04989, invalidation at $0.045800, got wrecked because I rushed to catch the bounce instead of patiently waiting for real buying pressure. Shell LONG @ $0.03015 also went south because I misjudged the support level. I thought it would hold, but the whales dumped hard, and the $0.026500 invalidation level broke way too quickly 💀. ERA LONG @ $0.0932: I ignored signs of fading buying pressure and got too optimistic about an early price push. It ended up losing the $0.082400 level. The big lesson: don’t “parachute in” when the market is moving sideways—wait for clearer signals before going Long.
The winning trades were simpler: Short Soph $0.00097, Short Snxxb $3.40, Long Dodo $0.02862, Long Bard $0.1325, and Short Pepe $0.00000456 all hit their targets cleanly.
My market reads weren’t great this week, so I’ll focus on dissecting the losing trades to find the root mistakes.
Even though I look $BTC kind of gloomy, my trading log from last week wasn’t much better, folks. 10 trades closed in total: 5 wins, 5 losses. Win rate: 50.0% 😅. I should be upfront about the losses. Night LONG @ $0.04989, invalidation at $0.045800, got wrecked because I rushed to catch the bounce instead of patiently waiting for real buying pressure. Shell LONG @ $0.03015 also went south because I misjudged the support level. I thought it would hold, but the whales dumped hard, and the $0.026500 invalidation level broke way too quickly 💀. ERA LONG @ $0.0932: I ignored signs of fading buying pressure and got too optimistic about an early price push. It ended up losing the $0.082400 level. The big lesson: don’t “parachute in” when the market is moving sideways—wait for clearer signals before going Long.
The winning trades were simpler: Short Soph $0.00097, Short Snxxb $3.40, Long Dodo $0.02862, Long Bard $0.1325, and Short Pepe $0.00000456 all hit their targets cleanly.
My market reads weren’t great this week, so I’ll focus on dissecting the losing trades to find the root mistakes.
The winning trades were simpler: Short Soph $0.00097, Short Snxxb $3.40, Long Dodo $0.02862, Long Bard $0.1325, and Short Pepe $0.00000456 all hit their targets cleanly.
My market reads weren’t great this week, so I’ll focus on dissecting the losing trades to find the root mistakes.
810
·
--
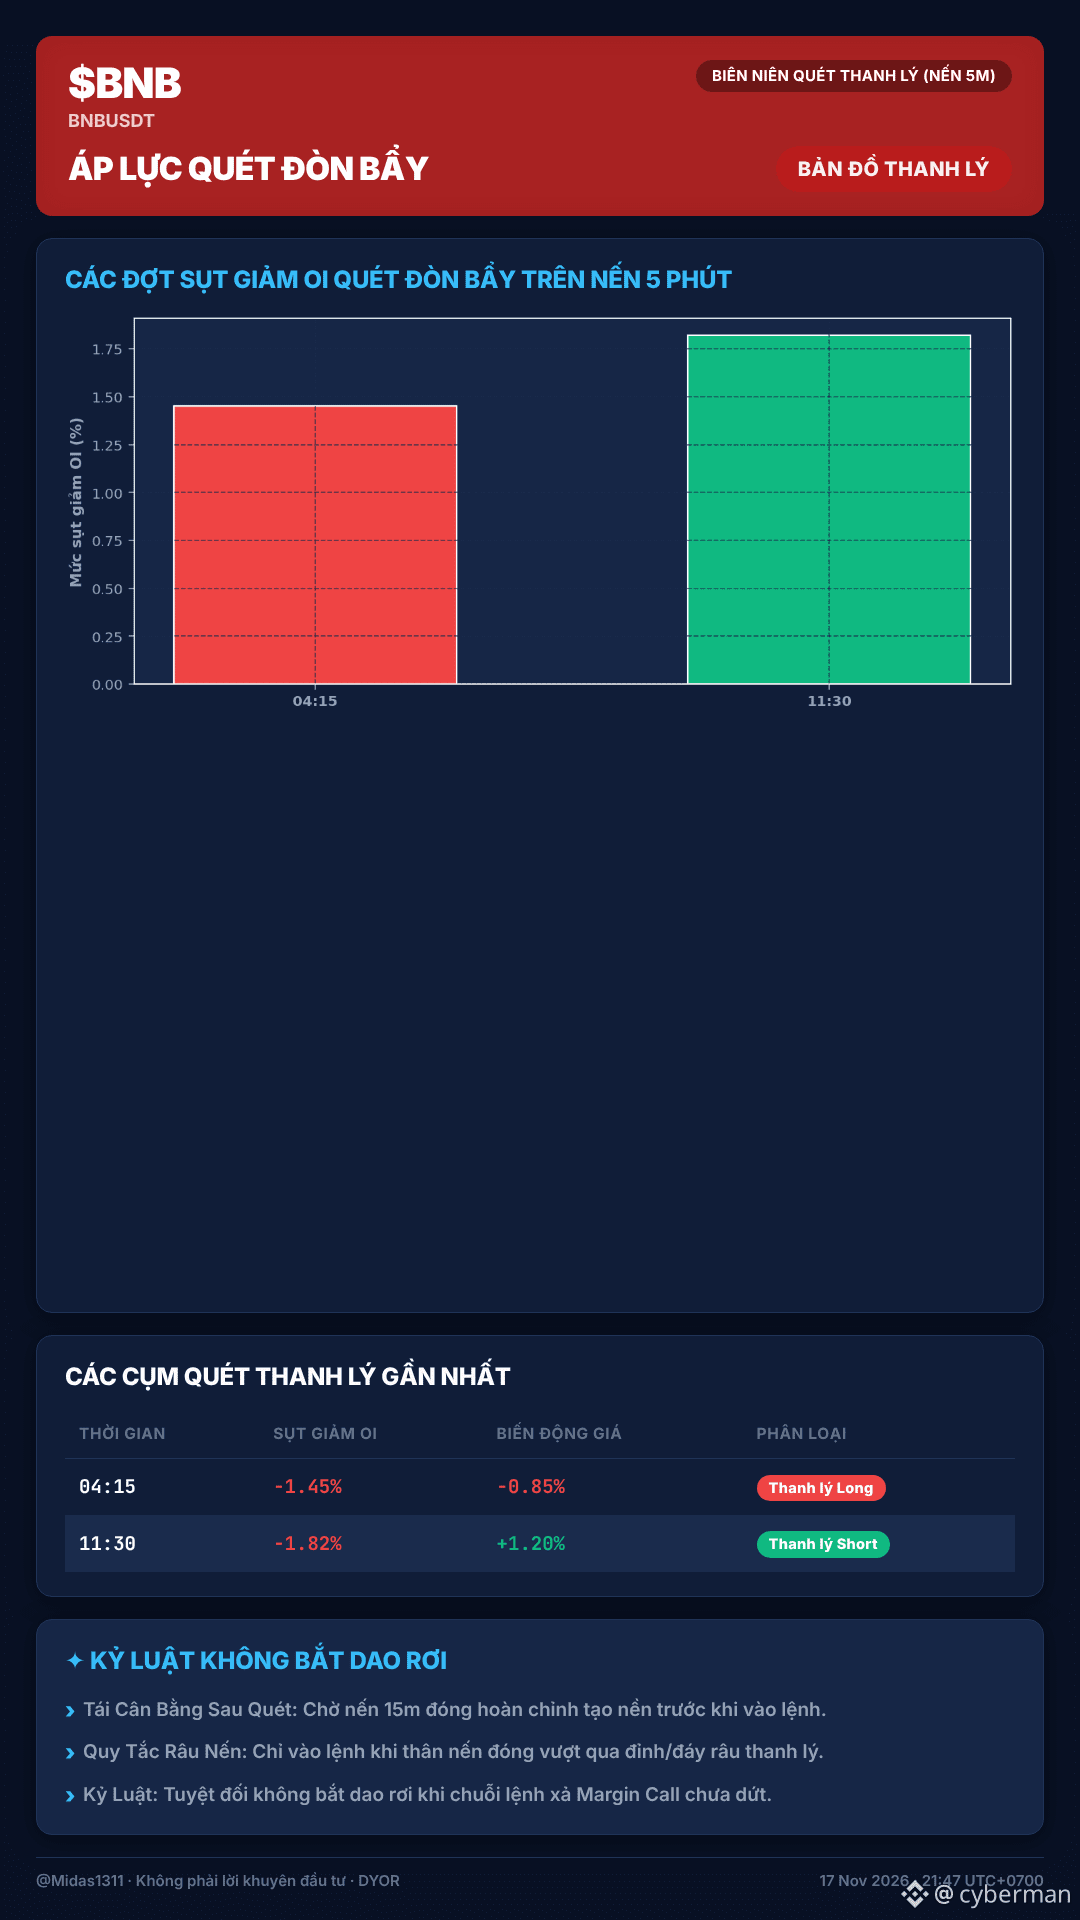
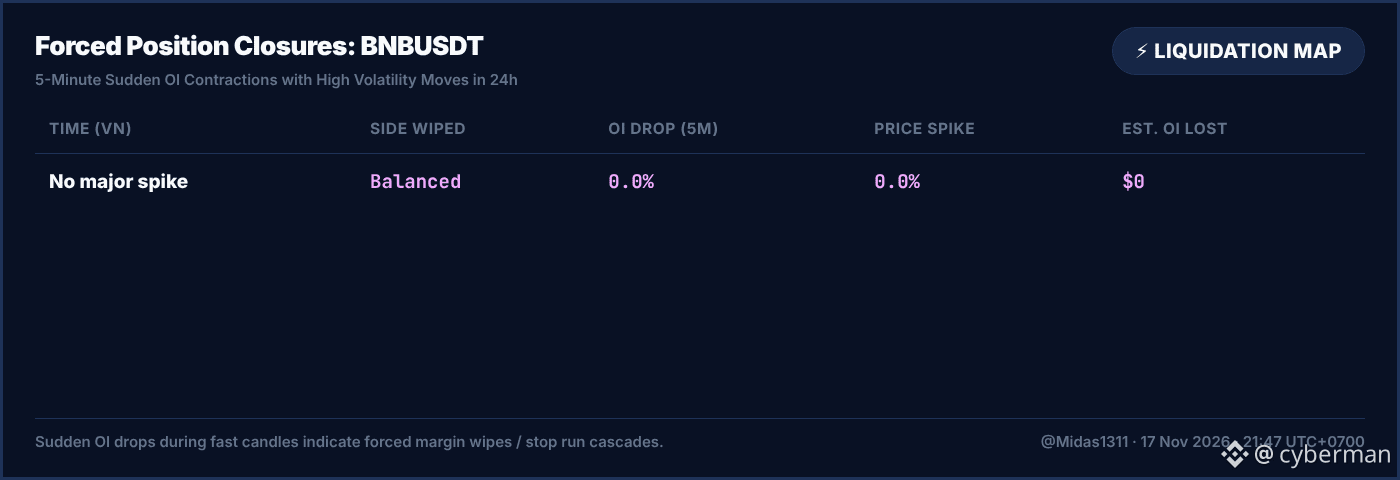
Chart $BNB looked peaceful at first glance today, but liquidation data revealed two notable position-sweeping moves. 🤓 At 04:15, the Long side felt the pressure as OI fell 1.45% and price dropped 0.85%. By 11:30, a stronger short squeeze took place: OI evaporated by 1.82% while price $BNB rose 1.20%, clearly forcing the Short side to close positions. 🧮 These two sweeps, especially the one at 11:30, cleared out a significant amount of sell-side liquidity and eliminated weak positions. There were no other unusually large sweeps over the following 24 hours. If you’re entering a trade $BNB around this point, be extremely careful with leverage. Liquidity has been cleared, but the big move may not be over yet. Whether you’re catching a falling knife or riding your profits, keep your stop-loss tight to avoid blowing up your account. 📐 Which side do you think is in control of the market $BNB right now? 👀
#Write2Earn #BinanceSquare #CryptoTrading
(Not investment advice—do your own research)
---
Chart $BNB looked peaceful at first glance today, but liquidation data revealed two notable position-sweeping moves. 🤓 At 04:15, the Long side felt the pressure as OI fell 1.45% and price dropped 0.85%. By 11:30, a stronger short squeeze took place: OI evaporated by 1.82% while price $BNB rose 1.20%, clearly forcing the Short side to close positions. 🧮 These two sweeps, especially the one at 11:30, cleared out a significant amount of sell-side liquidity and eliminated weak positions. There were no other unusually large sweeps over the following 24 hours. If you’re entering a trade $BNB around this point, be extremely careful with leverage. Liquidity has been cleared, but the big move may not be over yet. Whether you’re catching a falling knife or riding your profits, keep your stop-loss tight to avoid blowing up your account. 📐 Which side do you think is in control of the market $BNB right now? 👀
#Write2Earn #BinanceSquare #CryptoTrading
(Not investment advice—do your own research)
---
#Write2Earn #BinanceSquare #CryptoTrading
(Not investment advice—do your own research)
---
1
190
·
--
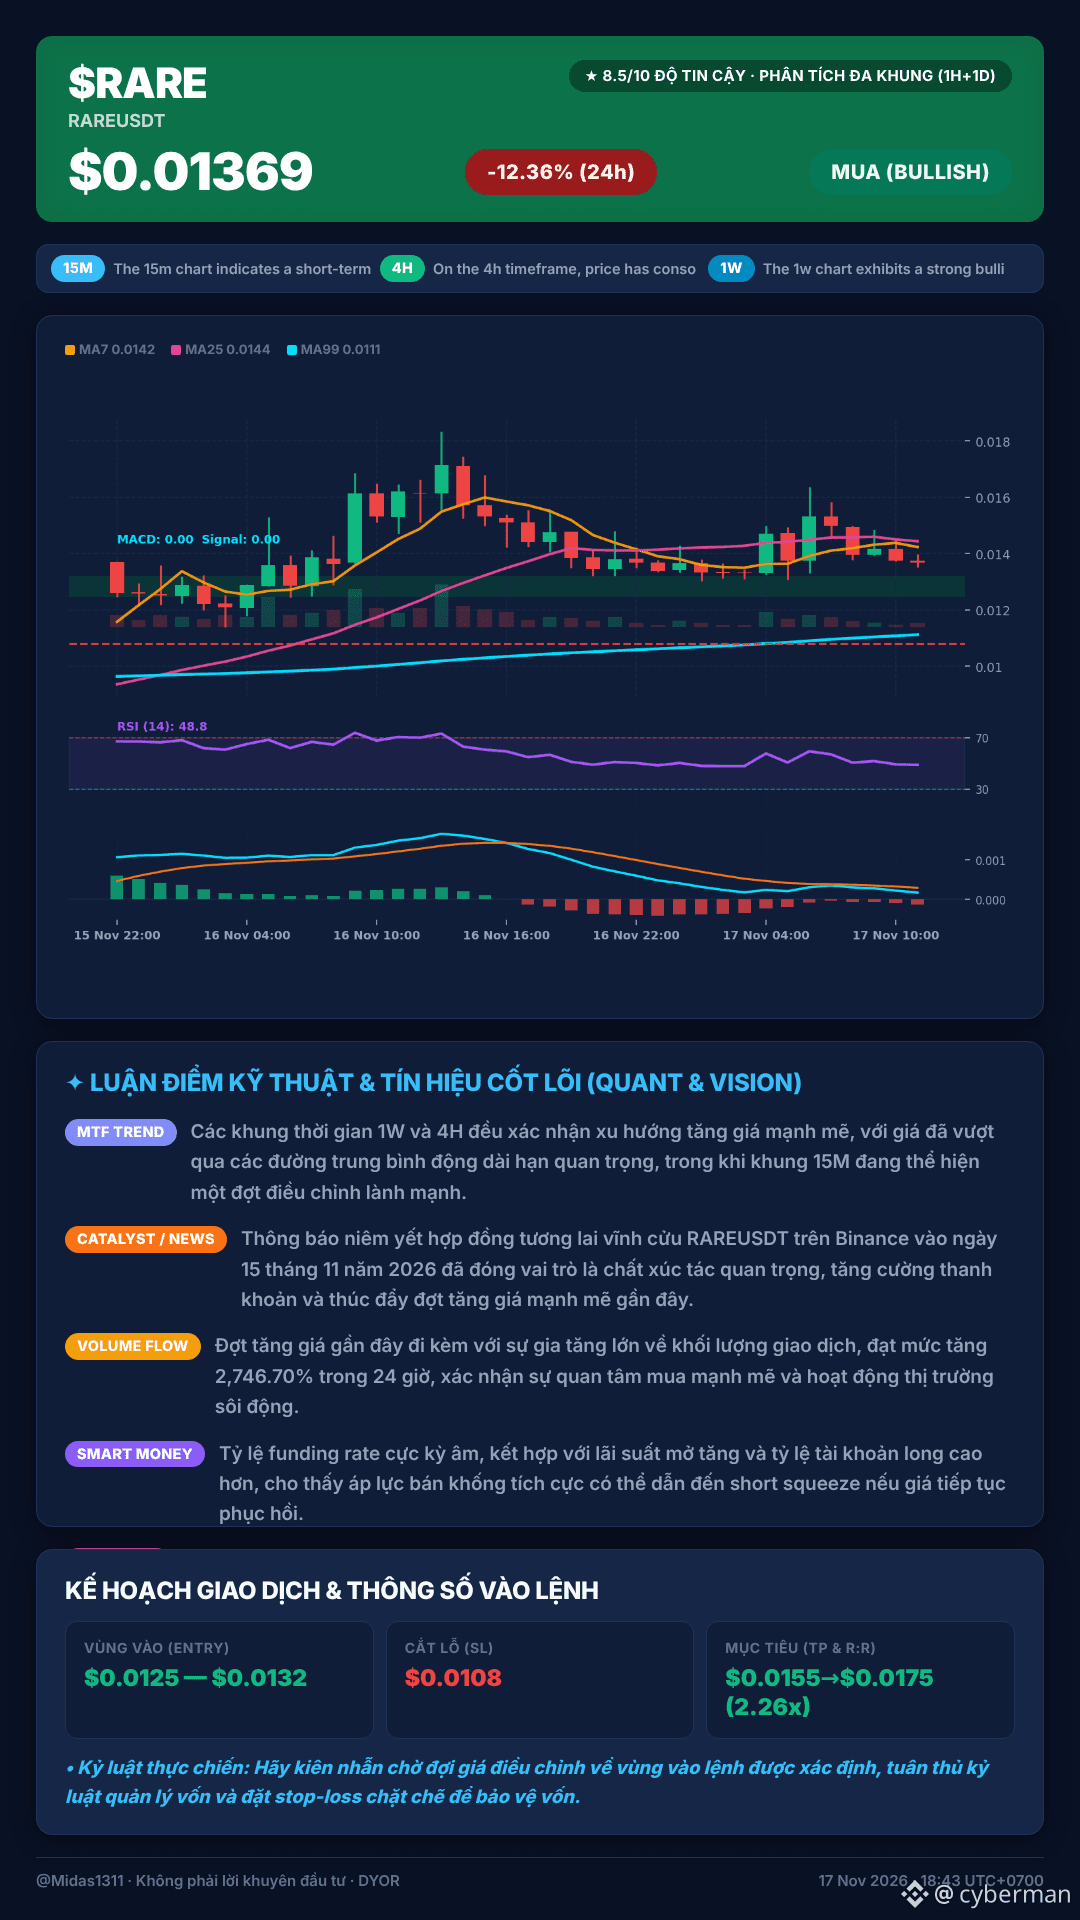
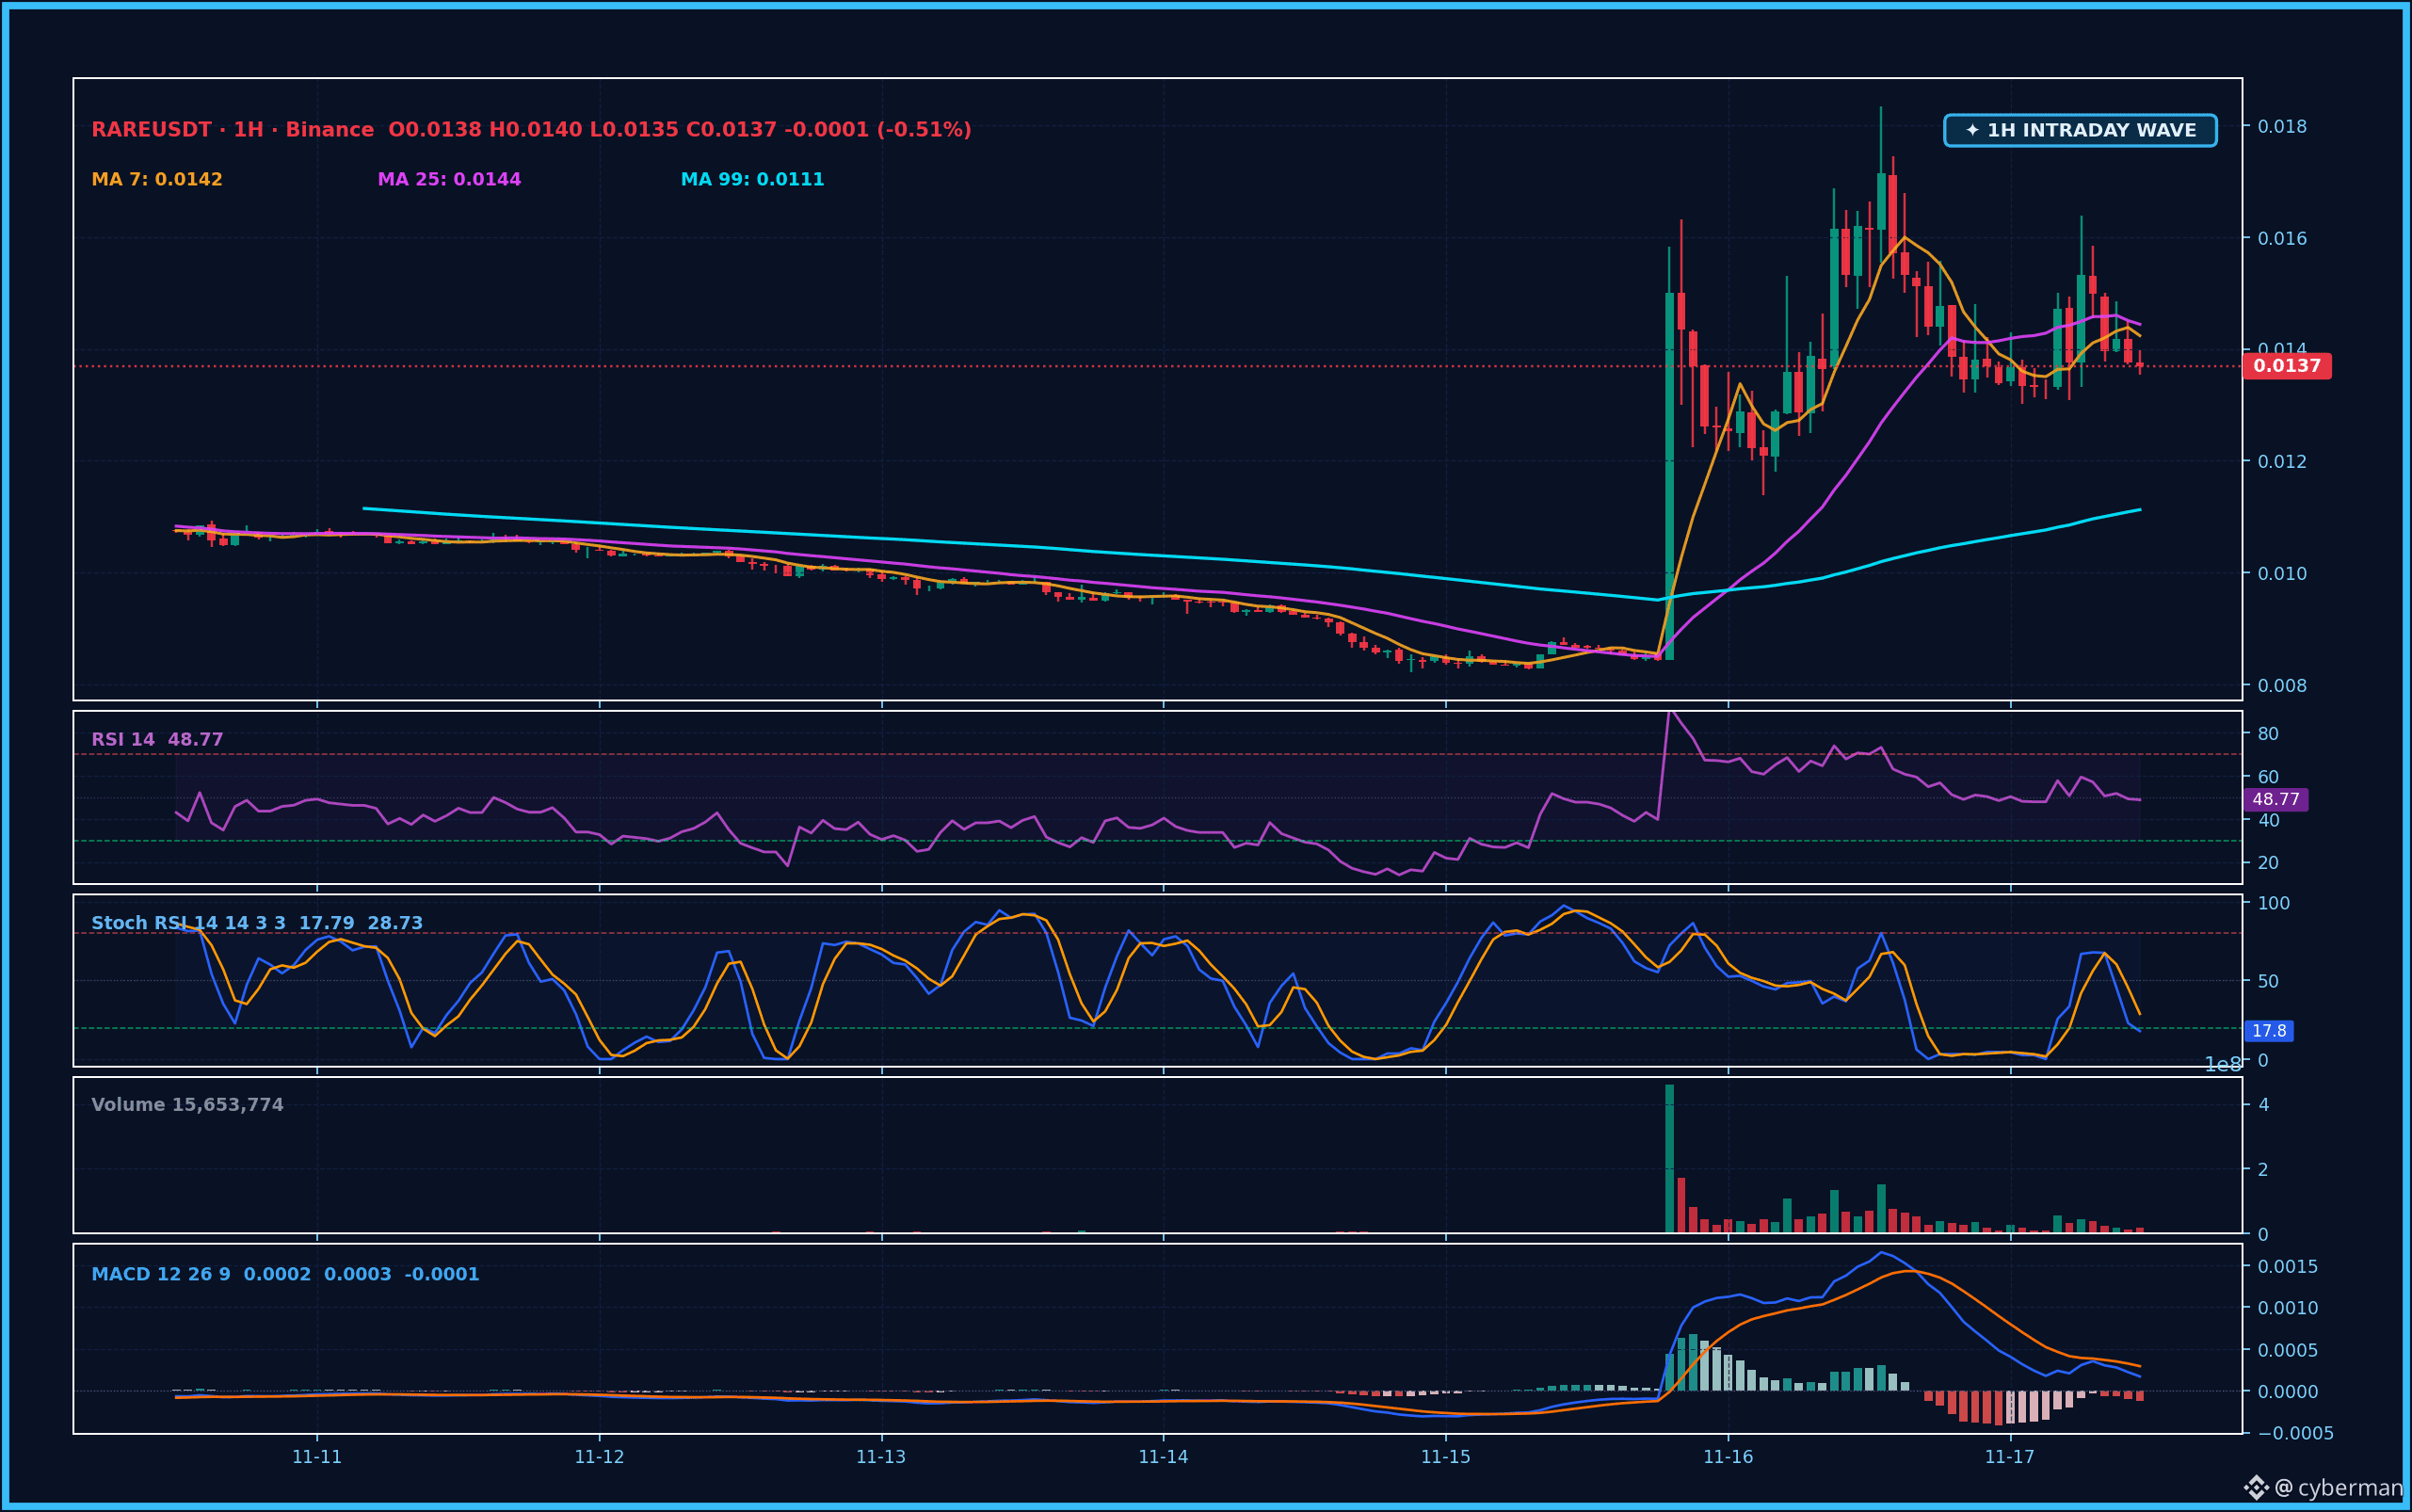
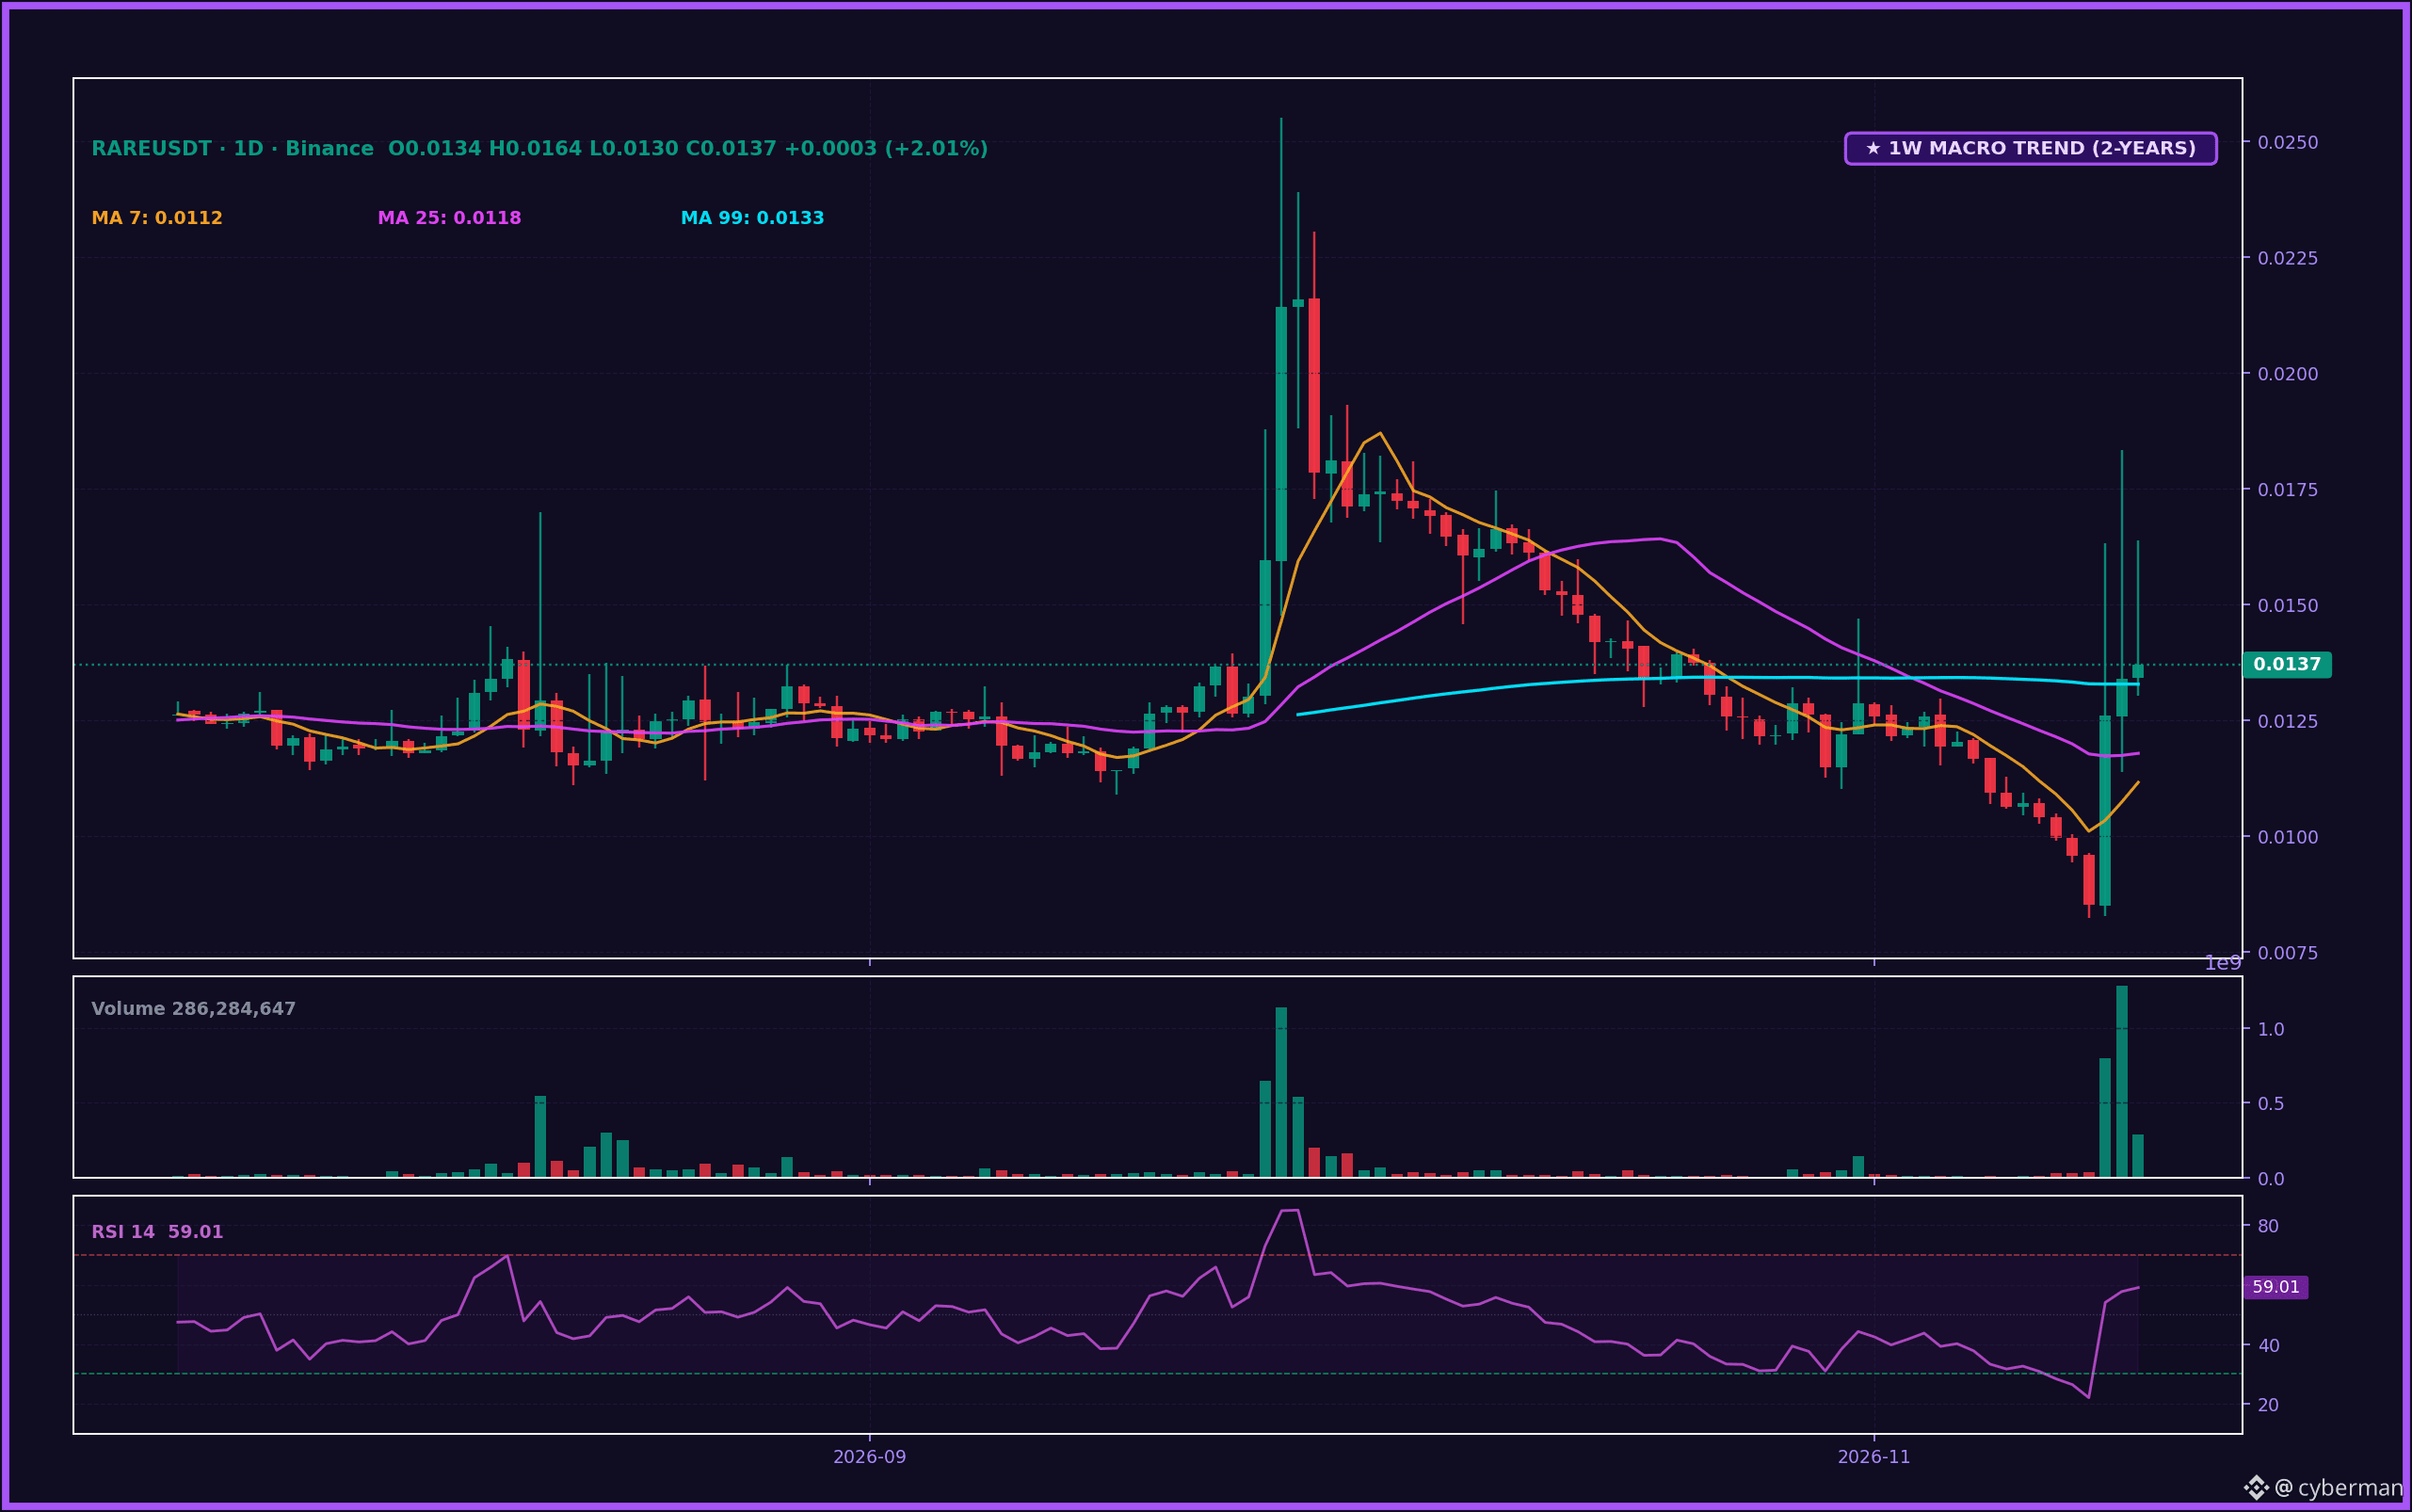
Good heavens, I opened my eyes to see $RARE deep in the red—being a trader really must mean I was born to embrace risk 😭. The 1H candle is making gentle little moves, but looking at the 1D chart, it really was a "river of blood" before that unexpected reversal.
Looking back, after a freefall, $RARE came back to life from a low of $0.008267 on November 15—the very day Binance listed the RAREUSDT perpetual futures contract, folks. That was the real catalyst, sending trading volume soaring 2,746.70% in 24 hours. Open Interest also jumped 382.14%, while the funding rate was a grim -1.0600%/8h, showing that short sellers were paying through the nose. That helped the price bounce sharply. Although the 1H RSI is hovering at 48.8 and MA7 ($0.0142) and MA25 ($0.0144) are still overhead, on the 1W chart the price is now sitting comfortably above MA99 ($0.0133), forming a new solid support level. The 1W and 4H charts both confirm a fairly strong uptrend, while the current pullback on the 15M chart is just a healthy correction.
Good heavens, I opened my eyes to see $RARE deep in the red—being a trader really must mean I was born to embrace risk 😭. The 1H candle is making gentle little moves, but looking at the 1D chart, it really was a "river of blood" before that unexpected reversal.
Looking back, after a freefall, $RARE came back to life from a low of $0.008267 on November 15—the very day Binance listed the RAREUSDT perpetual futures contract, folks. That was the real catalyst, sending trading volume soaring 2,746.70% in 24 hours. Open Interest also jumped 382.14%, while the funding rate was a grim -1.0600%/8h, showing that short sellers were paying through the nose. That helped the price bounce sharply. Although the 1H RSI is hovering at 48.8 and MA7 ($0.0142) and MA25 ($0.0144) are still overhead, on the 1W chart the price is now sitting comfortably above MA99 ($0.0133), forming a new solid support level. The 1W and 4H charts both confirm a fairly strong uptrend, while the current pullback on the 15M chart is just a healthy correction.
Looking back, after a freefall, $RARE came back to life from a low of $0.008267 on November 15—the very day Binance listed the RAREUSDT perpetual futures contract, folks. That was the real catalyst, sending trading volume soaring 2,746.70% in 24 hours. Open Interest also jumped 382.14%, while the funding rate was a grim -1.0600%/8h, showing that short sellers were paying through the nose. That helped the price bounce sharply. Although the 1H RSI is hovering at 48.8 and MA7 ($0.0142) and MA25 ($0.0144) are still overhead, on the 1W chart the price is now sitting comfortably above MA99 ($0.0133), forming a new solid support level. The 1W and 4H charts both confirm a fairly strong uptrend, while the current pullback on the 15M chart is just a healthy correction.
195
·
--
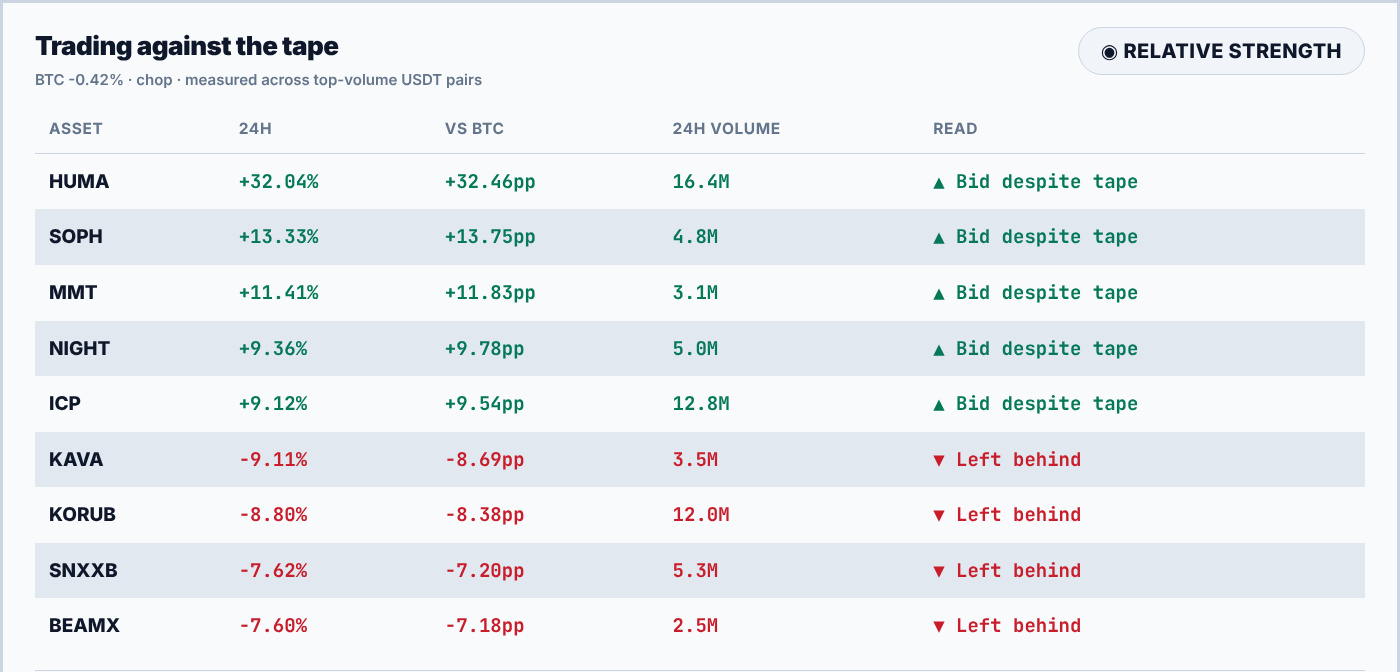
BTC is compressing in a painfully boring sideways range, and just looking at the chart is exhausting. But amid all this "chop," not every coin is asleep. 🤔
Don’t just look at the green and red percentages and jump in out of FOMO—look at relative strength. When the whole market is red but one coin is still holding strong in the green, that’s when real money is quietly accumulating, not just getting lucky. Look at $HUMA —it’s up over 32%, outperforming BTC by a full 32 percentage points. SOPH and MMT are also bidding despite the tape, big time. On the other hand, coins like KAVA and KORUB are being left behind, weaker than BTC. Honestly, that’s rough to see. 🤷
Bottom line: I’m only keeping an eye on the names going against the trend, like HUMA and ICP. These are coiled springs—when the market rebounds, they’ll be the first to pop. As for the coins struggling to recover and weaker than BTC, just steer clear; don’t try to catch falling knives when they’re losing momentum. 😏
Which coins are you holding that are bidding the strongest? Drop their names below and let’s see who’s in the same boat. 🍻
#Write2Earn #PriceAction #CryptoAnalysis
(DYOR & NFA)
---
BTC is compressing in a painfully boring sideways range, and just looking at the chart is exhausting. But amid all this "chop," not every coin is asleep. 🤔
Don’t just look at the green and red percentages and jump in out of FOMO—look at relative strength. When the whole market is red but one coin is still holding strong in the green, that’s when real money is quietly accumulating, not just getting lucky. Look at $HUMA —it’s up over 32%, outperforming BTC by a full 32 percentage points. SOPH and MMT are also bidding despite the tape, big time. On the other hand, coins like KAVA and KORUB are being left behind, weaker than BTC. Honestly, that’s rough to see. 🤷
Bottom line: I’m only keeping an eye on the names going against the trend, like HUMA and ICP. These are coiled springs—when the market rebounds, they’ll be the first to pop. As for the coins struggling to recover and weaker than BTC, just steer clear; don’t try to catch falling knives when they’re losing momentum. 😏
Which coins are you holding that are bidding the strongest? Drop their names below and let’s see who’s in the same boat. 🍻
#Write2Earn #PriceAction #CryptoAnalysis
(DYOR & NFA)
---
Don’t just look at the green and red percentages and jump in out of FOMO—look at relative strength. When the whole market is red but one coin is still holding strong in the green, that’s when real money is quietly accumulating, not just getting lucky. Look at $HUMA —it’s up over 32%, outperforming BTC by a full 32 percentage points. SOPH and MMT are also bidding despite the tape, big time. On the other hand, coins like KAVA and KORUB are being left behind, weaker than BTC. Honestly, that’s rough to see. 🤷
Bottom line: I’m only keeping an eye on the names going against the trend, like HUMA and ICP. These are coiled springs—when the market rebounds, they’ll be the first to pop. As for the coins struggling to recover and weaker than BTC, just steer clear; don’t try to catch falling knives when they’re losing momentum. 😏
Which coins are you holding that are bidding the strongest? Drop their names below and let’s see who’s in the same boat. 🍻
#Write2Earn #PriceAction #CryptoAnalysis
(DYOR & NFA)
---
1
804
·
--
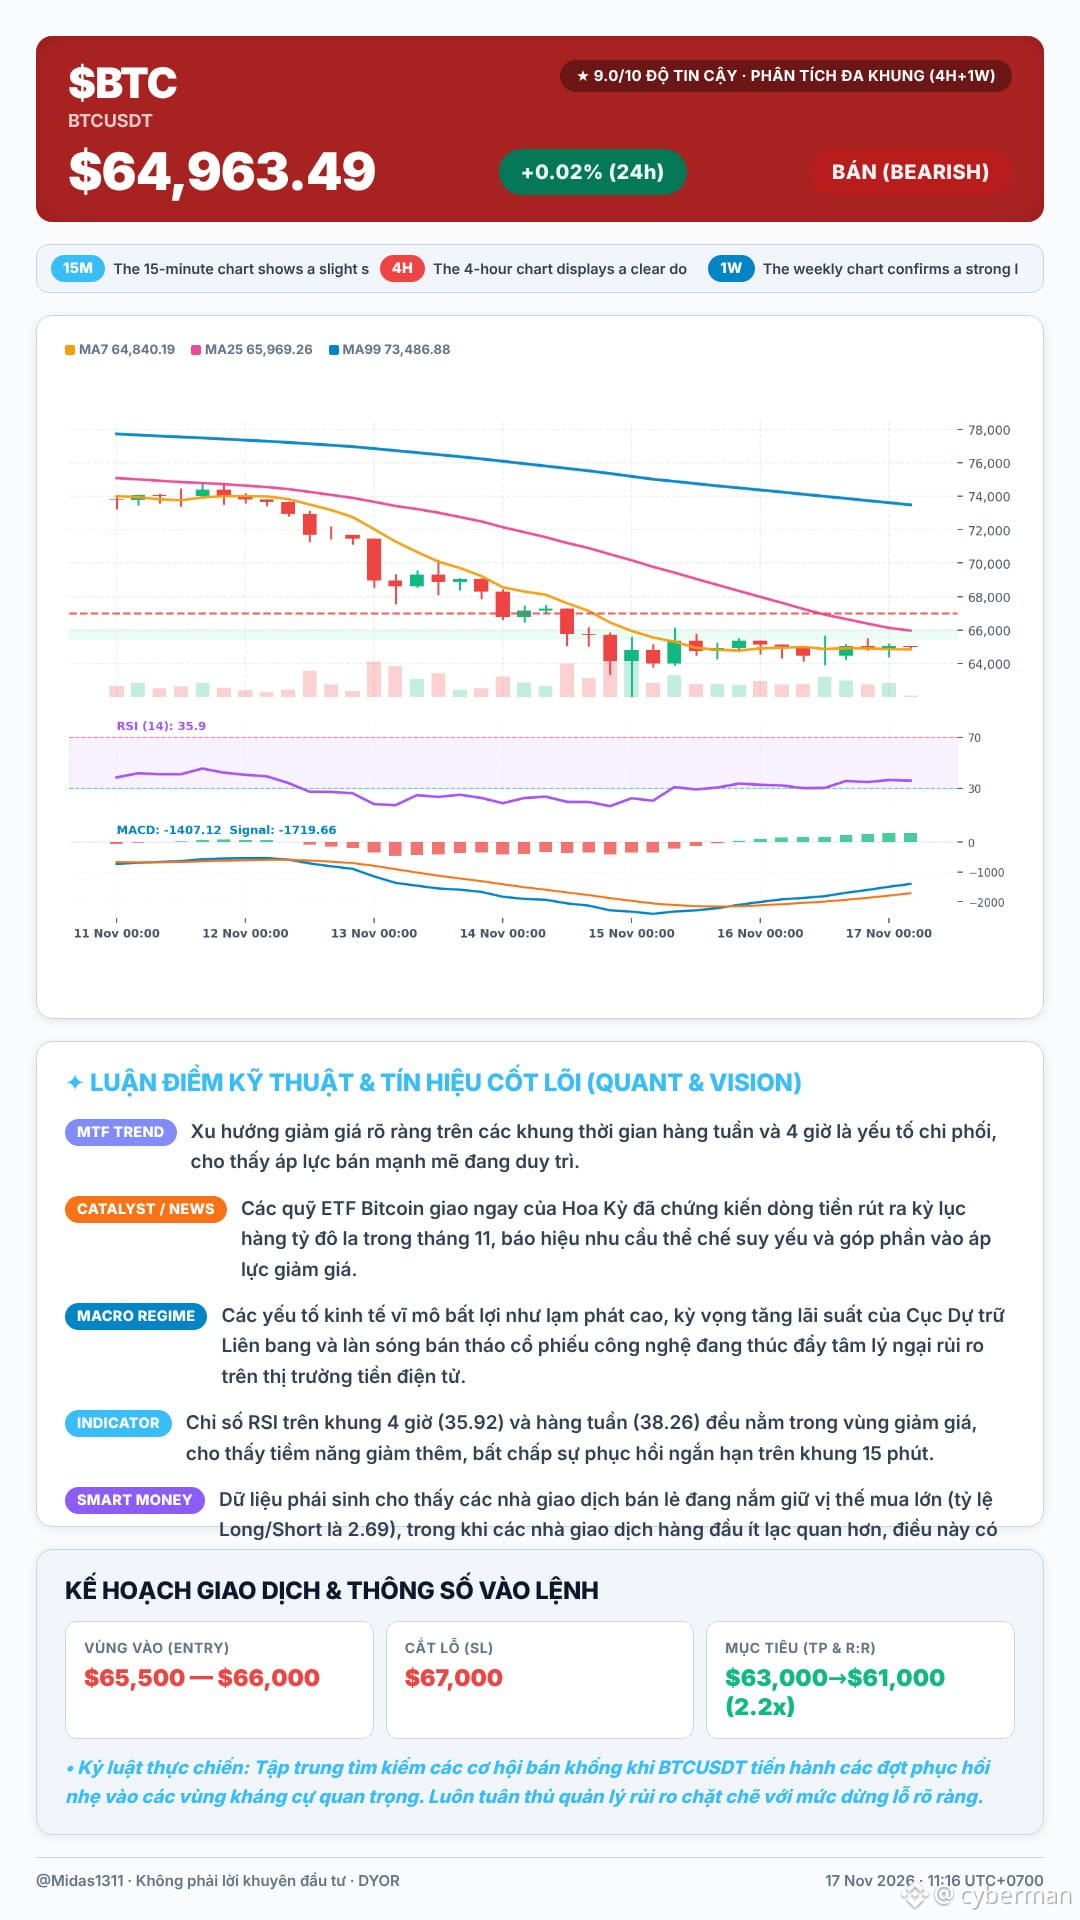
Watching $BTC wobble around over the past few days has me feeling pretty uneasy, guys. The market seems dull, but this is exactly when a Short like me starts paying closer attention.
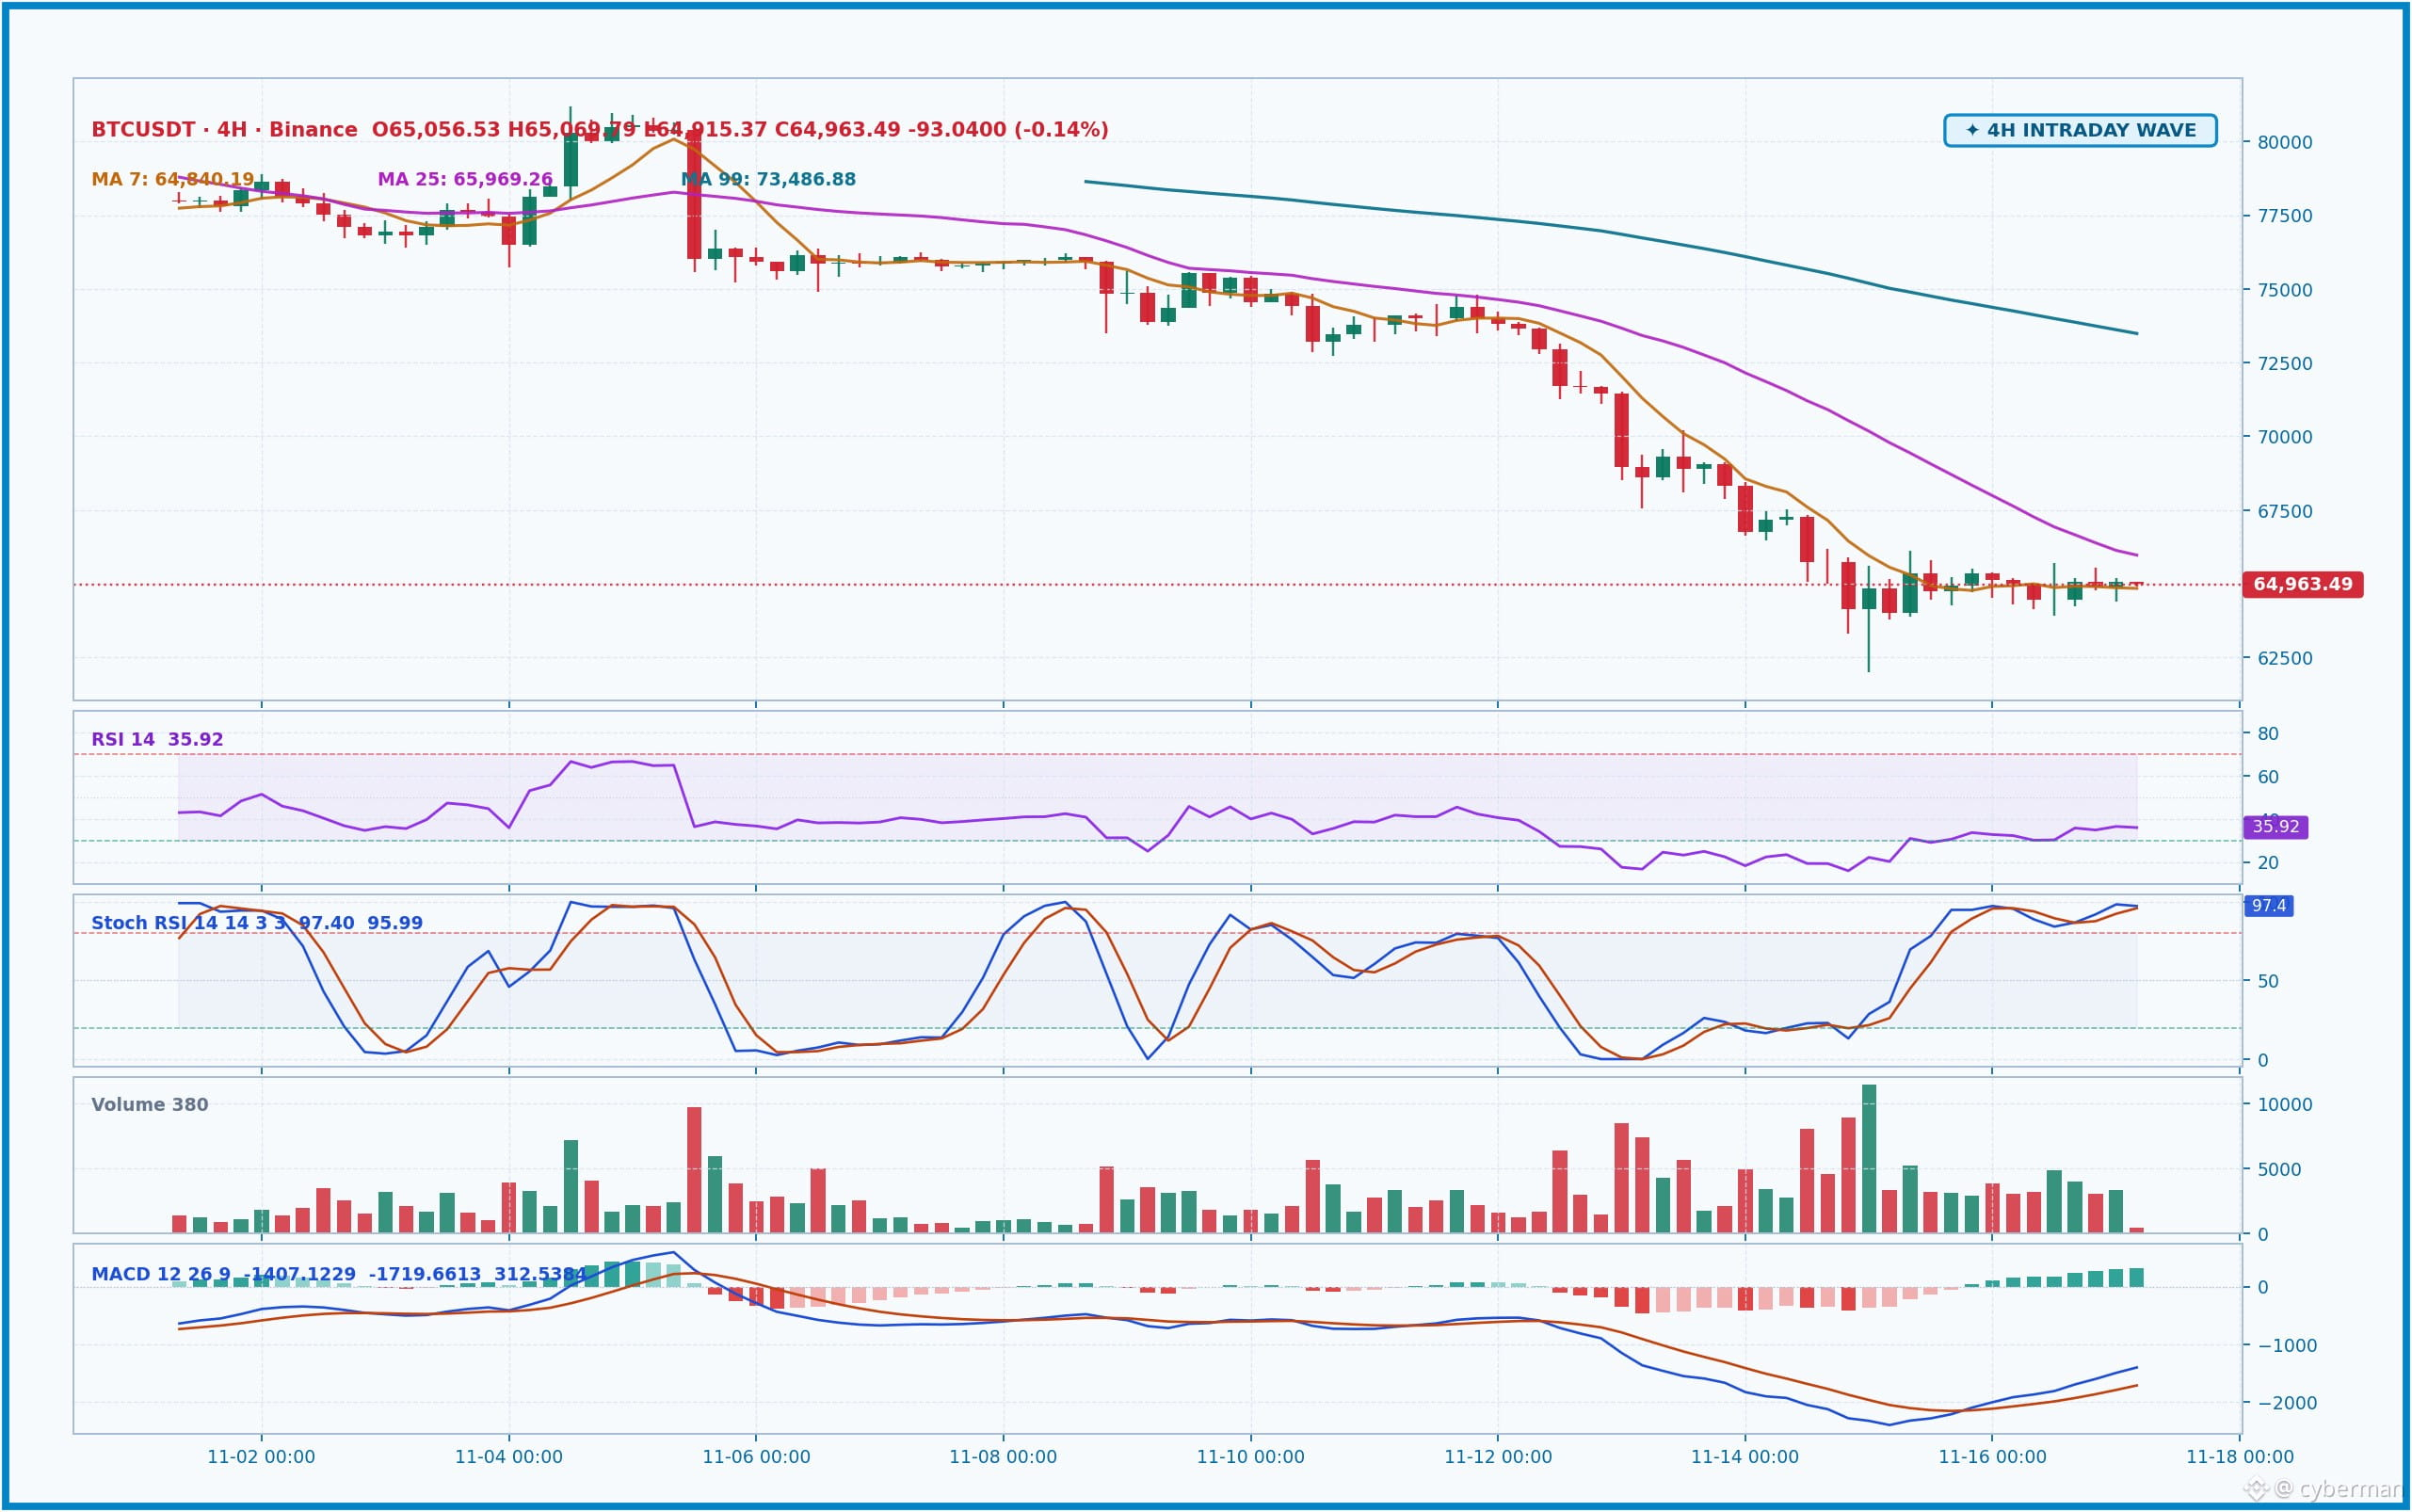
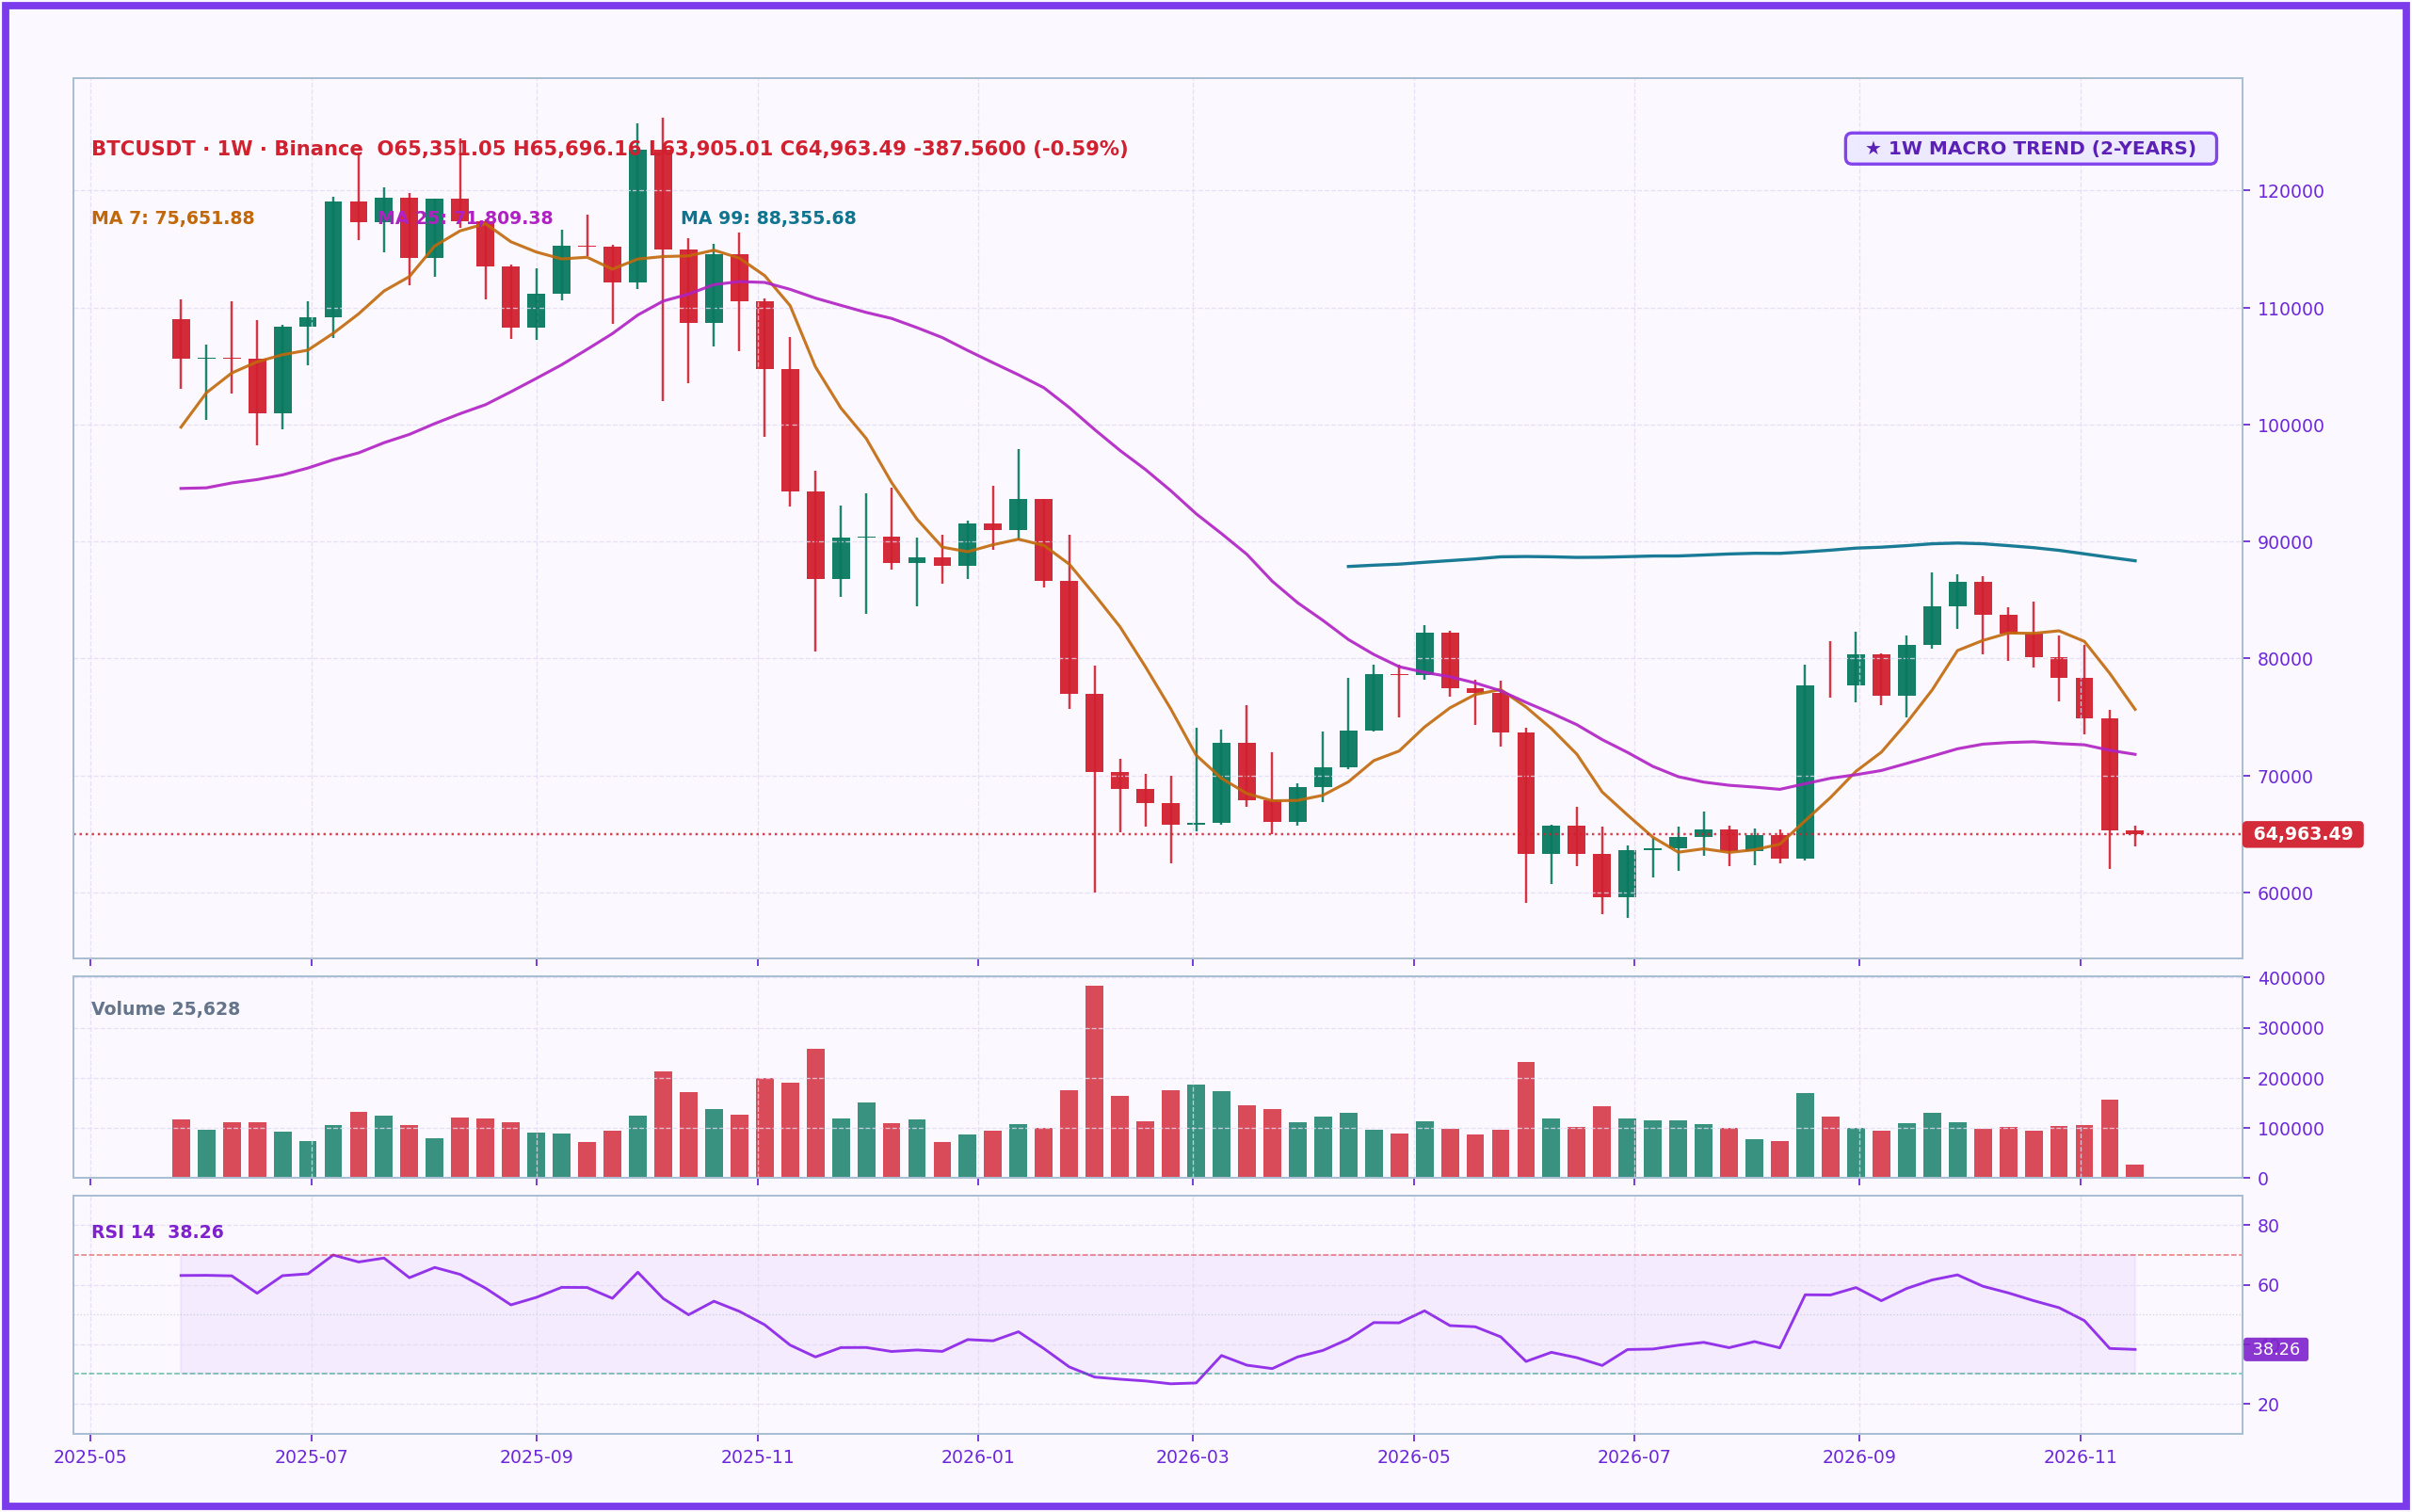
Right now, $BTC is hovering around $64,963.49, below both the MA7 ($64,840.19) and MA25 ($65,969.26) on the 4H chart, while the MA99 is way up at $73,486.88. Clearly, both the 4H and 1W charts are showing a prevailing downtrend. On top of that, the news over the past few days hasn’t been very encouraging either: U.S. spot Bitcoin ETFs saw record outflows of $2.1 billion–$2.35 billion in November alone, with seven consecutive days of net outflows. This shows that major institutions are selling, and they’re serious. The macro situation isn’t any better: U.S. inflation in October came in slightly above expectations (0.4% CPI), and the Fed is highly likely to raise interest rates again in December, making the market much more risk-averse.
The RSI on both the 4H (35.9) and 1W (38.3) charts is hovering in bearish territory, showing that selling pressure is still there.
Watching $BTC wobble around over the past few days has me feeling pretty uneasy, guys. The market seems dull, but this is exactly when a Short like me starts paying closer attention.
Right now, $BTC is hovering around $64,963.49, below both the MA7 ($64,840.19) and MA25 ($65,969.26) on the 4H chart, while the MA99 is way up at $73,486.88. Clearly, both the 4H and 1W charts are showing a prevailing downtrend. On top of that, the news over the past few days hasn’t been very encouraging either: U.S. spot Bitcoin ETFs saw record outflows of $2.1 billion–$2.35 billion in November alone, with seven consecutive days of net outflows. This shows that major institutions are selling, and they’re serious. The macro situation isn’t any better: U.S. inflation in October came in slightly above expectations (0.4% CPI), and the Fed is highly likely to raise interest rates again in December, making the market much more risk-averse.
The RSI on both the 4H (35.9) and 1W (38.3) charts is hovering in bearish territory, showing that selling pressure is still there.
Right now, $BTC is hovering around $64,963.49, below both the MA7 ($64,840.19) and MA25 ($65,969.26) on the 4H chart, while the MA99 is way up at $73,486.88. Clearly, both the 4H and 1W charts are showing a prevailing downtrend. On top of that, the news over the past few days hasn’t been very encouraging either: U.S. spot Bitcoin ETFs saw record outflows of $2.1 billion–$2.35 billion in November alone, with seven consecutive days of net outflows. This shows that major institutions are selling, and they’re serious. The macro situation isn’t any better: U.S. inflation in October came in slightly above expectations (0.4% CPI), and the Fed is highly likely to raise interest rates again in December, making the market much more risk-averse.
The RSI on both the 4H (35.9) and 1W (38.3) charts is hovering in bearish territory, showing that selling pressure is still there.
230
·
--
This morning, BTC is moving sideways within a narrow range after the late-weekend plunge left traders with plenty to think about.
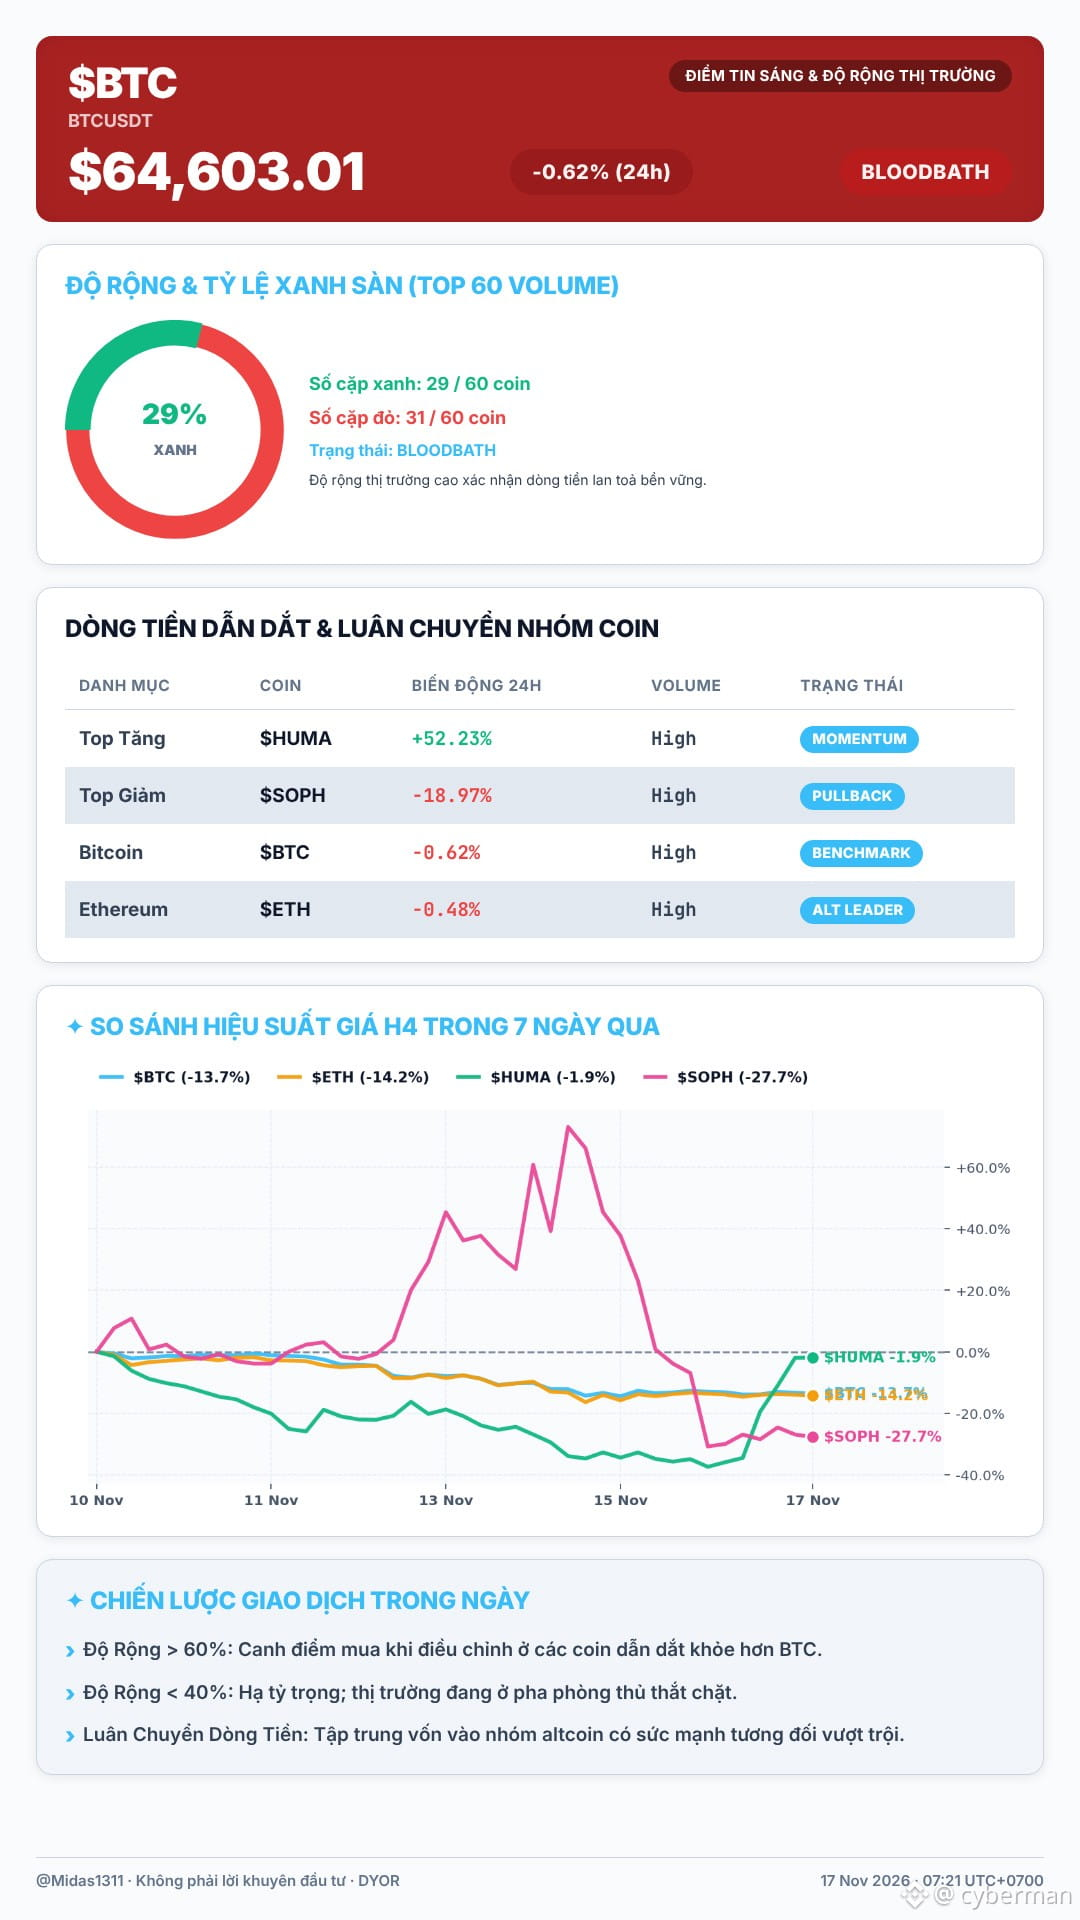
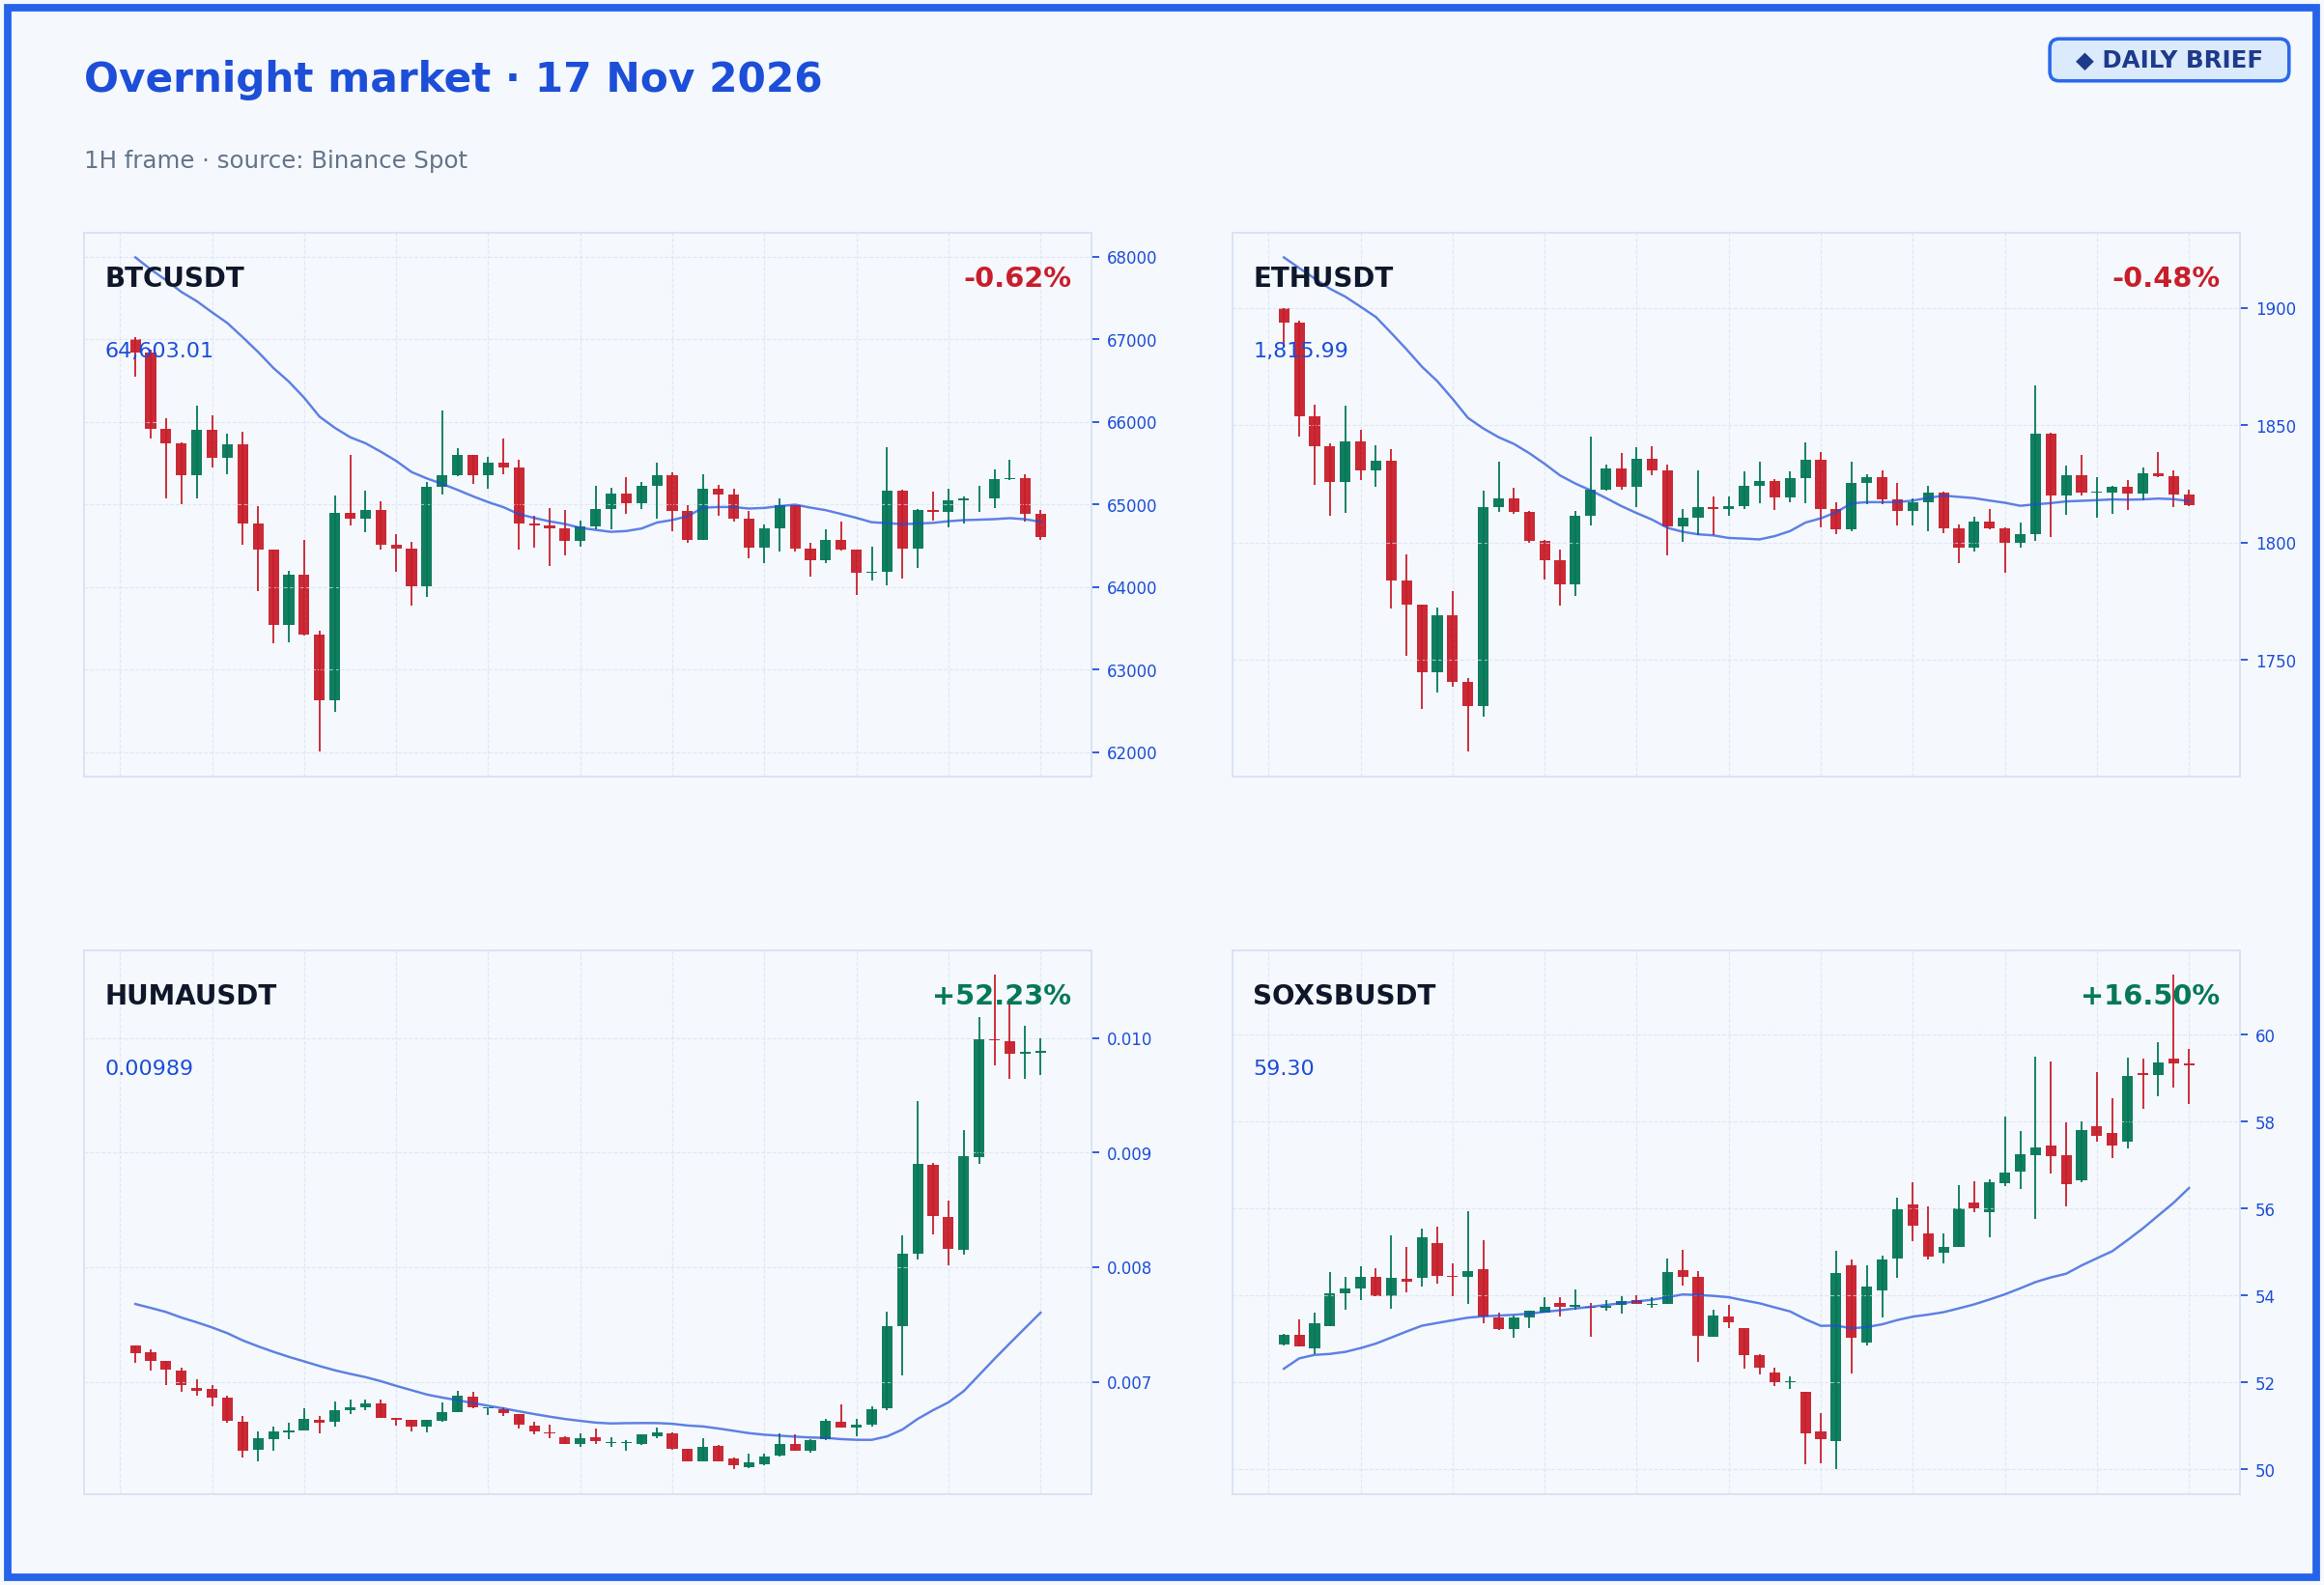
The crypto market opened in the red on Nov. 17, with only 29% of the top 100 coins holding onto gains. BTC is holding at $64,603 (-0.62%), while ETH is hovering around $1,815 (-0.48%). Bitcoin ETF funds continue to see heavy net outflows, totaling more than $2.1 billion in November. IBIT has recorded 11 consecutive days of outflows, showing that institutional selling pressure remains high. The market just went through more than $2 billion in long-position liquidations over the weekend as BTC touched $62,000, clearing out positions and leaving the market a little cleaner. The 24-hour trading volume for the top 100 coins came in at just $3.57 billion—a figure worth watching closely.
Meanwhile, $HUMA surged an impressive 52.23%, showing that money is still chasing hot coins with momentum. On the other hand, SOPH dropped 18.97%, clearly among the coins under pressure and facing heavy selling. U.S. retail sales data is due today, and with continued ETF outflows and low trading volumes, extra caution is warranted. 😐
Will buying pressure return, or will the bears keep pushing prices down?
This morning, BTC is moving sideways within a narrow range after the late-weekend plunge left traders with plenty to think about.
The crypto market opened in the red on Nov. 17, with only 29% of the top 100 coins holding onto gains. BTC is holding at $64,603 (-0.62%), while ETH is hovering around $1,815 (-0.48%). Bitcoin ETF funds continue to see heavy net outflows, totaling more than $2.1 billion in November. IBIT has recorded 11 consecutive days of outflows, showing that institutional selling pressure remains high. The market just went through more than $2 billion in long-position liquidations over the weekend as BTC touched $62,000, clearing out positions and leaving the market a little cleaner. The 24-hour trading volume for the top 100 coins came in at just $3.57 billion—a figure worth watching closely.
Meanwhile, $HUMA surged an impressive 52.23%, showing that money is still chasing hot coins with momentum. On the other hand, SOPH dropped 18.97%, clearly among the coins under pressure and facing heavy selling. U.S. retail sales data is due today, and with continued ETF outflows and low trading volumes, extra caution is warranted. 😐
Will buying pressure return, or will the bears keep pushing prices down?
The crypto market opened in the red on Nov. 17, with only 29% of the top 100 coins holding onto gains. BTC is holding at $64,603 (-0.62%), while ETH is hovering around $1,815 (-0.48%). Bitcoin ETF funds continue to see heavy net outflows, totaling more than $2.1 billion in November. IBIT has recorded 11 consecutive days of outflows, showing that institutional selling pressure remains high. The market just went through more than $2 billion in long-position liquidations over the weekend as BTC touched $62,000, clearing out positions and leaving the market a little cleaner. The 24-hour trading volume for the top 100 coins came in at just $3.57 billion—a figure worth watching closely.
Meanwhile, $HUMA surged an impressive 52.23%, showing that money is still chasing hot coins with momentum. On the other hand, SOPH dropped 18.97%, clearly among the coins under pressure and facing heavy selling. U.S. retail sales data is due today, and with continued ETF outflows and low trading volumes, extra caution is warranted. 😐
Will buying pressure return, or will the bears keep pushing prices down?
382
·
--
Opening: New traders often make this mistake: when the market seems calm and prices are moving sideways, they ignore it. But actually, it could be the "calm before the storm" 💡.
Concept explained: Think of it like compressing a spring. The tighter you compress it, the more forcefully it bounces back when released—whether up or down, you just have to wait. In trading, when the MA lines converge and prices move within a narrow range, it’s a sign that the market is "compressing" energy, waiting to "explode" 🧑🏫.
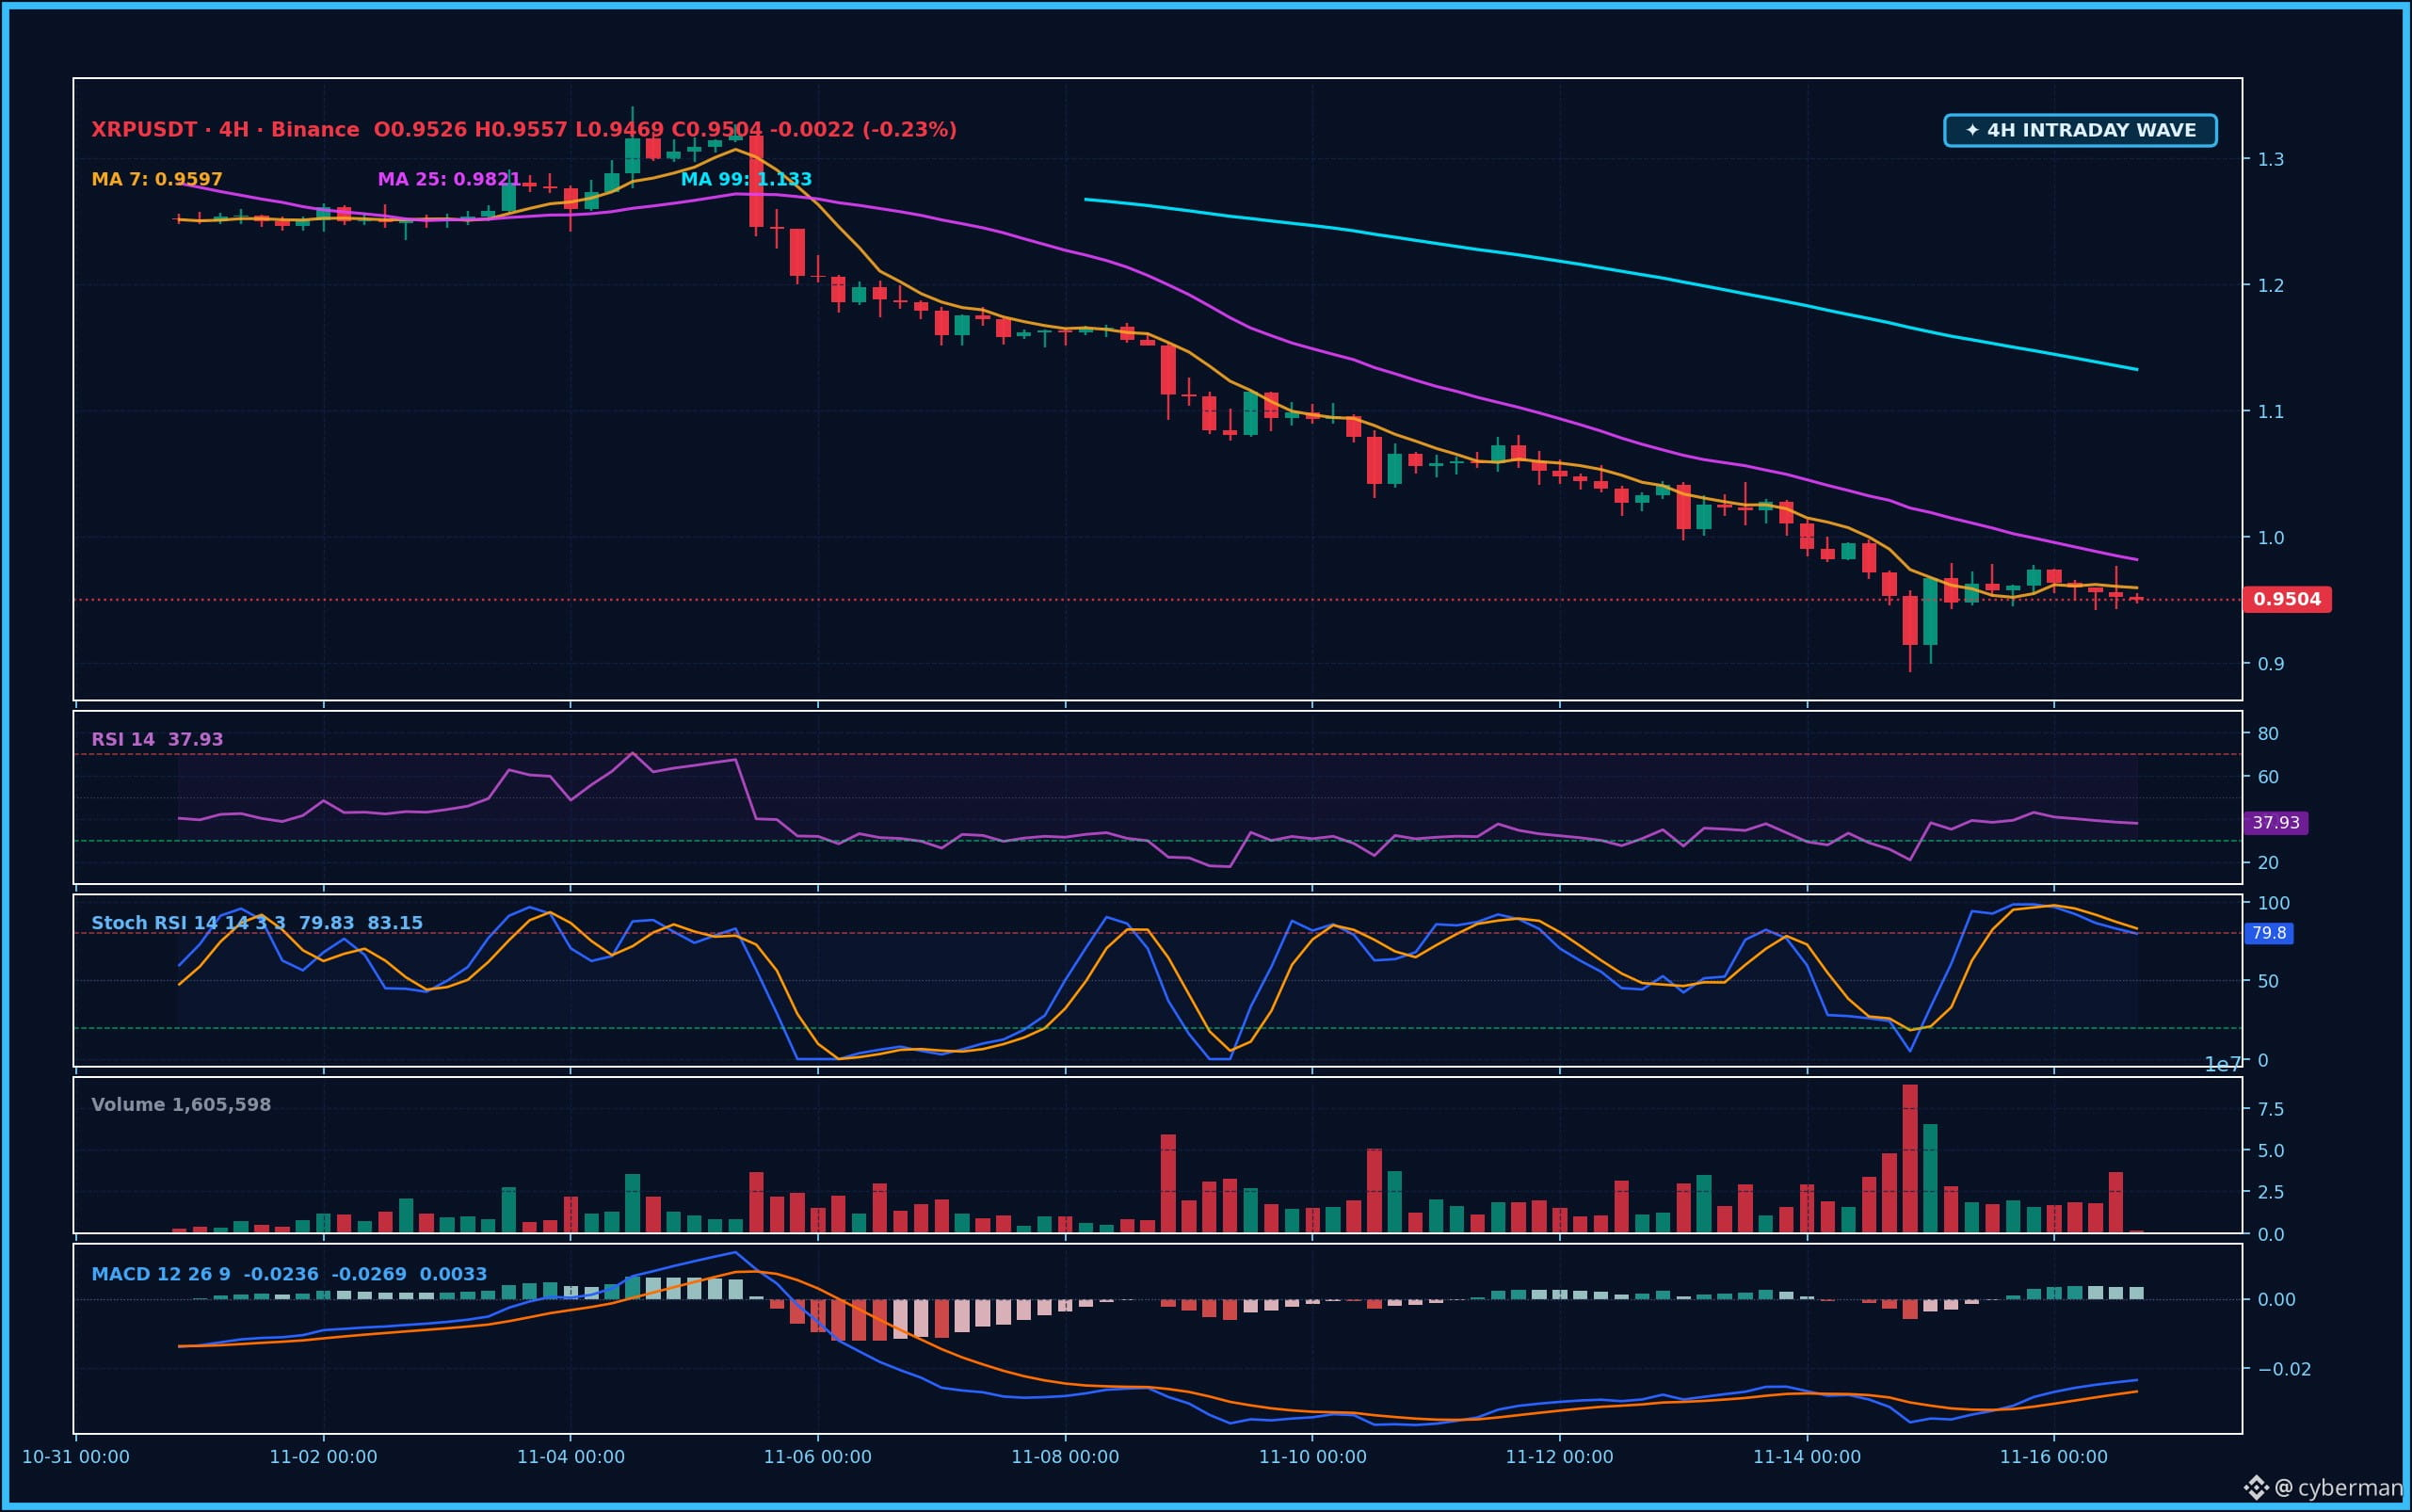
Let’s look at the $XRP chart: This $XRP 4H chart makes it clear. The price is around $0.9504, below MA7 ($0.9597), MA25 ($0.9821), and MA99 ($1.1328). The MAs are "bunching up" 👀. RSI is weak at 37.9, with sellers in control. This tight compression zone signals that a big move may be coming soon.
Put it into practice: Instead of guessing, set alerts at support ($0.893) and resistance ($1.0437). When the price decisively breaks through one of these levels, enter a trade 🤝. Don’t try to "stop the train" too early, or you could "blow your account".
Wrapping up: If you’ve ever made a killing on a breakout from a compression zone like this, share your experience so everyone can learn! ✍️
#Write2Earn #BinanceFutures #BinanceSquare
Opening: New traders often make this mistake: when the market seems calm and prices are moving sideways, they ignore it. But actually, it could be the "calm before the storm" 💡.
Concept explained: Think of it like compressing a spring. The tighter you compress it, the more forcefully it bounces back when released—whether up or down, you just have to wait. In trading, when the MA lines converge and prices move within a narrow range, it’s a sign that the market is "compressing" energy, waiting to "explode" 🧑🏫.
Let’s look at the $XRP chart: This $XRP 4H chart makes it clear. The price is around $0.9504, below MA7 ($0.9597), MA25 ($0.9821), and MA99 ($1.1328). The MAs are "bunching up" 👀. RSI is weak at 37.9, with sellers in control. This tight compression zone signals that a big move may be coming soon.
Put it into practice: Instead of guessing, set alerts at support ($0.893) and resistance ($1.0437). When the price decisively breaks through one of these levels, enter a trade 🤝. Don’t try to "stop the train" too early, or you could "blow your account".
Wrapping up: If you’ve ever made a killing on a breakout from a compression zone like this, share your experience so everyone can learn! ✍️
#Write2Earn #BinanceFutures #BinanceSquare
Concept explained: Think of it like compressing a spring. The tighter you compress it, the more forcefully it bounces back when released—whether up or down, you just have to wait. In trading, when the MA lines converge and prices move within a narrow range, it’s a sign that the market is "compressing" energy, waiting to "explode" 🧑🏫.
Let’s look at the $XRP chart: This $XRP 4H chart makes it clear. The price is around $0.9504, below MA7 ($0.9597), MA25 ($0.9821), and MA99 ($1.1328). The MAs are "bunching up" 👀. RSI is weak at 37.9, with sellers in control. This tight compression zone signals that a big move may be coming soon.
Put it into practice: Instead of guessing, set alerts at support ($0.893) and resistance ($1.0437). When the price decisively breaks through one of these levels, enter a trade 🤝. Don’t try to "stop the train" too early, or you could "blow your account".
Wrapping up: If you’ve ever made a killing on a breakout from a compression zone like this, share your experience so everyone can learn! ✍️
#Write2Earn #BinanceFutures #BinanceSquare
134
·
--
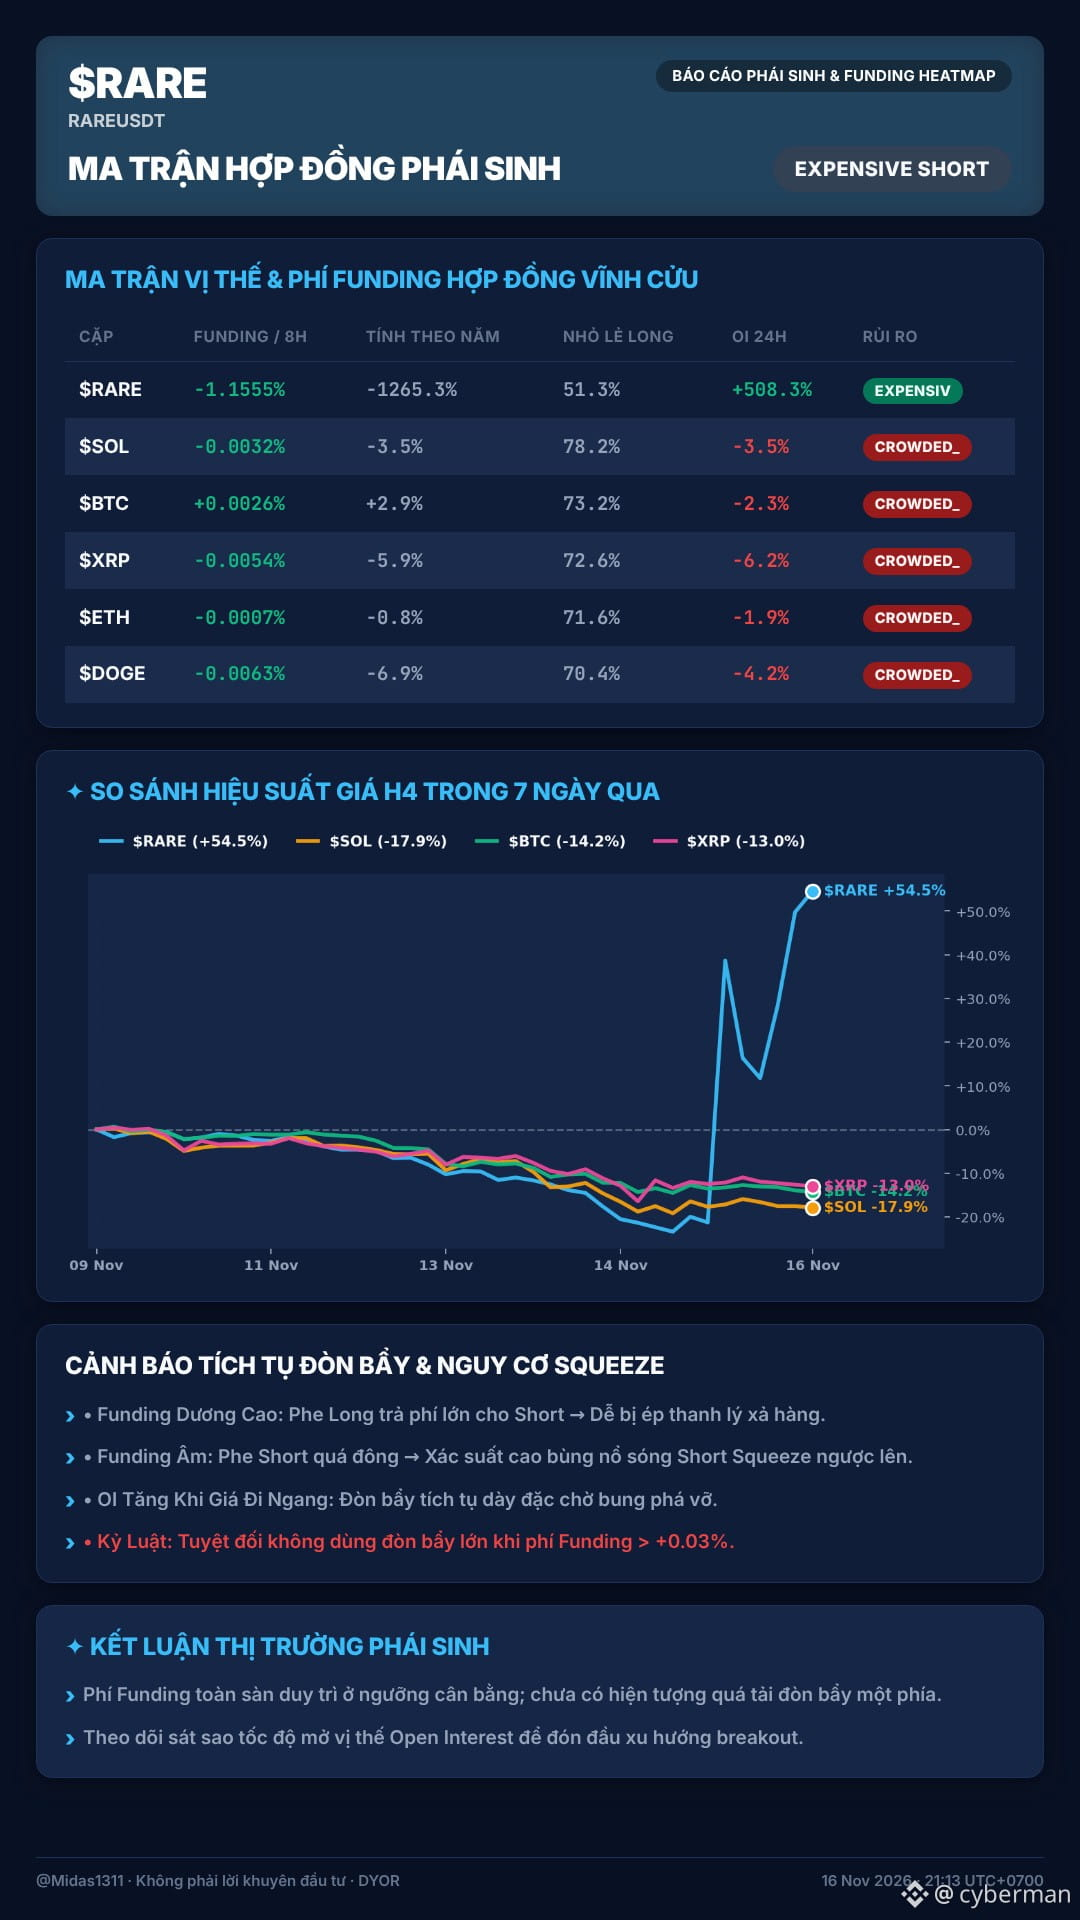
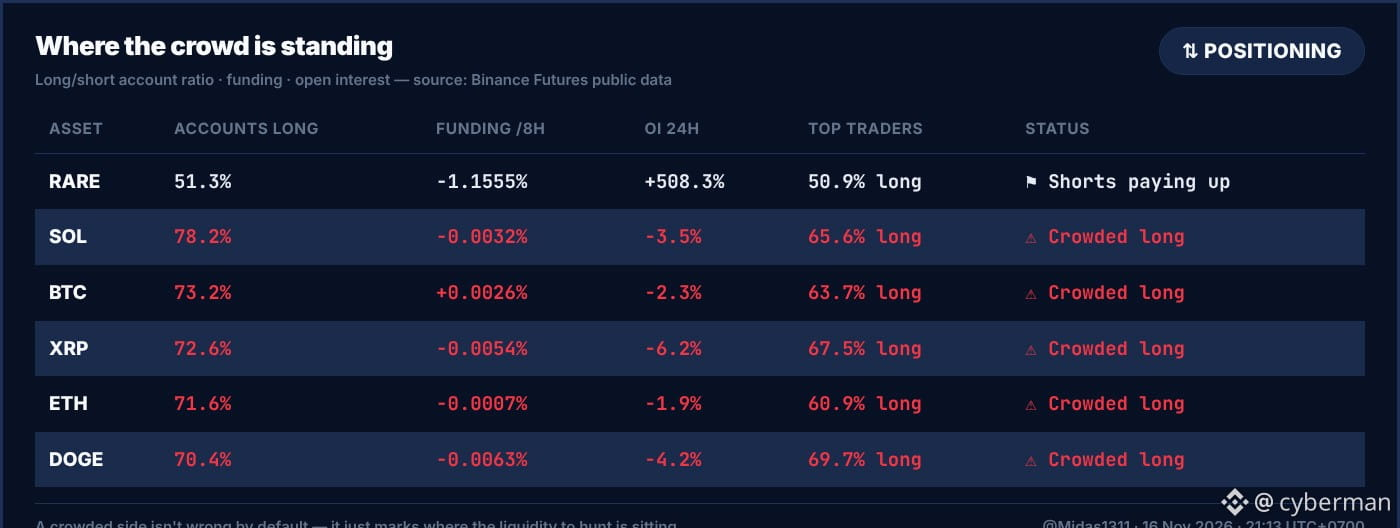
$RARE Open Interest surged 508.3% in just 24 hours, accompanied by deeply negative funding of -1.1555%/8h. These numbers tell you just how hard the Short side is "holding on" 📈. When funding is this deeply negative, it means Shorts have to pay a huge amount to maintain their positions, which can easily trigger a sudden "short squeeze" when the price surges. The percentage of Long accounts and Top Traders on $RARE is currently hovering around 50%—not an "overcrowded" zone—suggesting this is more like a one-sided battle where the Short side is getting squeezed for liquidity.
Meanwhile, SOL, BTC, XRP, ETH, and DOGE tell a completely different story. They all have Long account ratios ranging from 70.4% to 78.2%, and Top Traders are also heavily Long, at 60.9% to 69.7%. This is a classic case of "the crowd piling onto one side," also known as a "crowded long" 👀. With these figures, there’s definitely plenty of stop-loss liquidity below, ready for the market to "sweep" at any moment. Funding for these coins is slightly negative or slightly positive, but nowhere near as significant as $RARE.
$RARE Open Interest surged 508.3% in just 24 hours, accompanied by deeply negative funding of -1.1555%/8h. These numbers tell you just how hard the Short side is "holding on" 📈. When funding is this deeply negative, it means Shorts have to pay a huge amount to maintain their positions, which can easily trigger a sudden "short squeeze" when the price surges. The percentage of Long accounts and Top Traders on $RARE is currently hovering around 50%—not an "overcrowded" zone—suggesting this is more like a one-sided battle where the Short side is getting squeezed for liquidity.
Meanwhile, SOL, BTC, XRP, ETH, and DOGE tell a completely different story. They all have Long account ratios ranging from 70.4% to 78.2%, and Top Traders are also heavily Long, at 60.9% to 69.7%. This is a classic case of "the crowd piling onto one side," also known as a "crowded long" 👀. With these figures, there’s definitely plenty of stop-loss liquidity below, ready for the market to "sweep" at any moment. Funding for these coins is slightly negative or slightly positive, but nowhere near as significant as $RARE .
Meanwhile, SOL, BTC, XRP, ETH, and DOGE tell a completely different story. They all have Long account ratios ranging from 70.4% to 78.2%, and Top Traders are also heavily Long, at 60.9% to 69.7%. This is a classic case of "the crowd piling onto one side," also known as a "crowded long" 👀. With these figures, there’s definitely plenty of stop-loss liquidity below, ready for the market to "sweep" at any moment. Funding for these coins is slightly negative or slightly positive, but nowhere near as significant as $RARE .
596
·
--
Verified
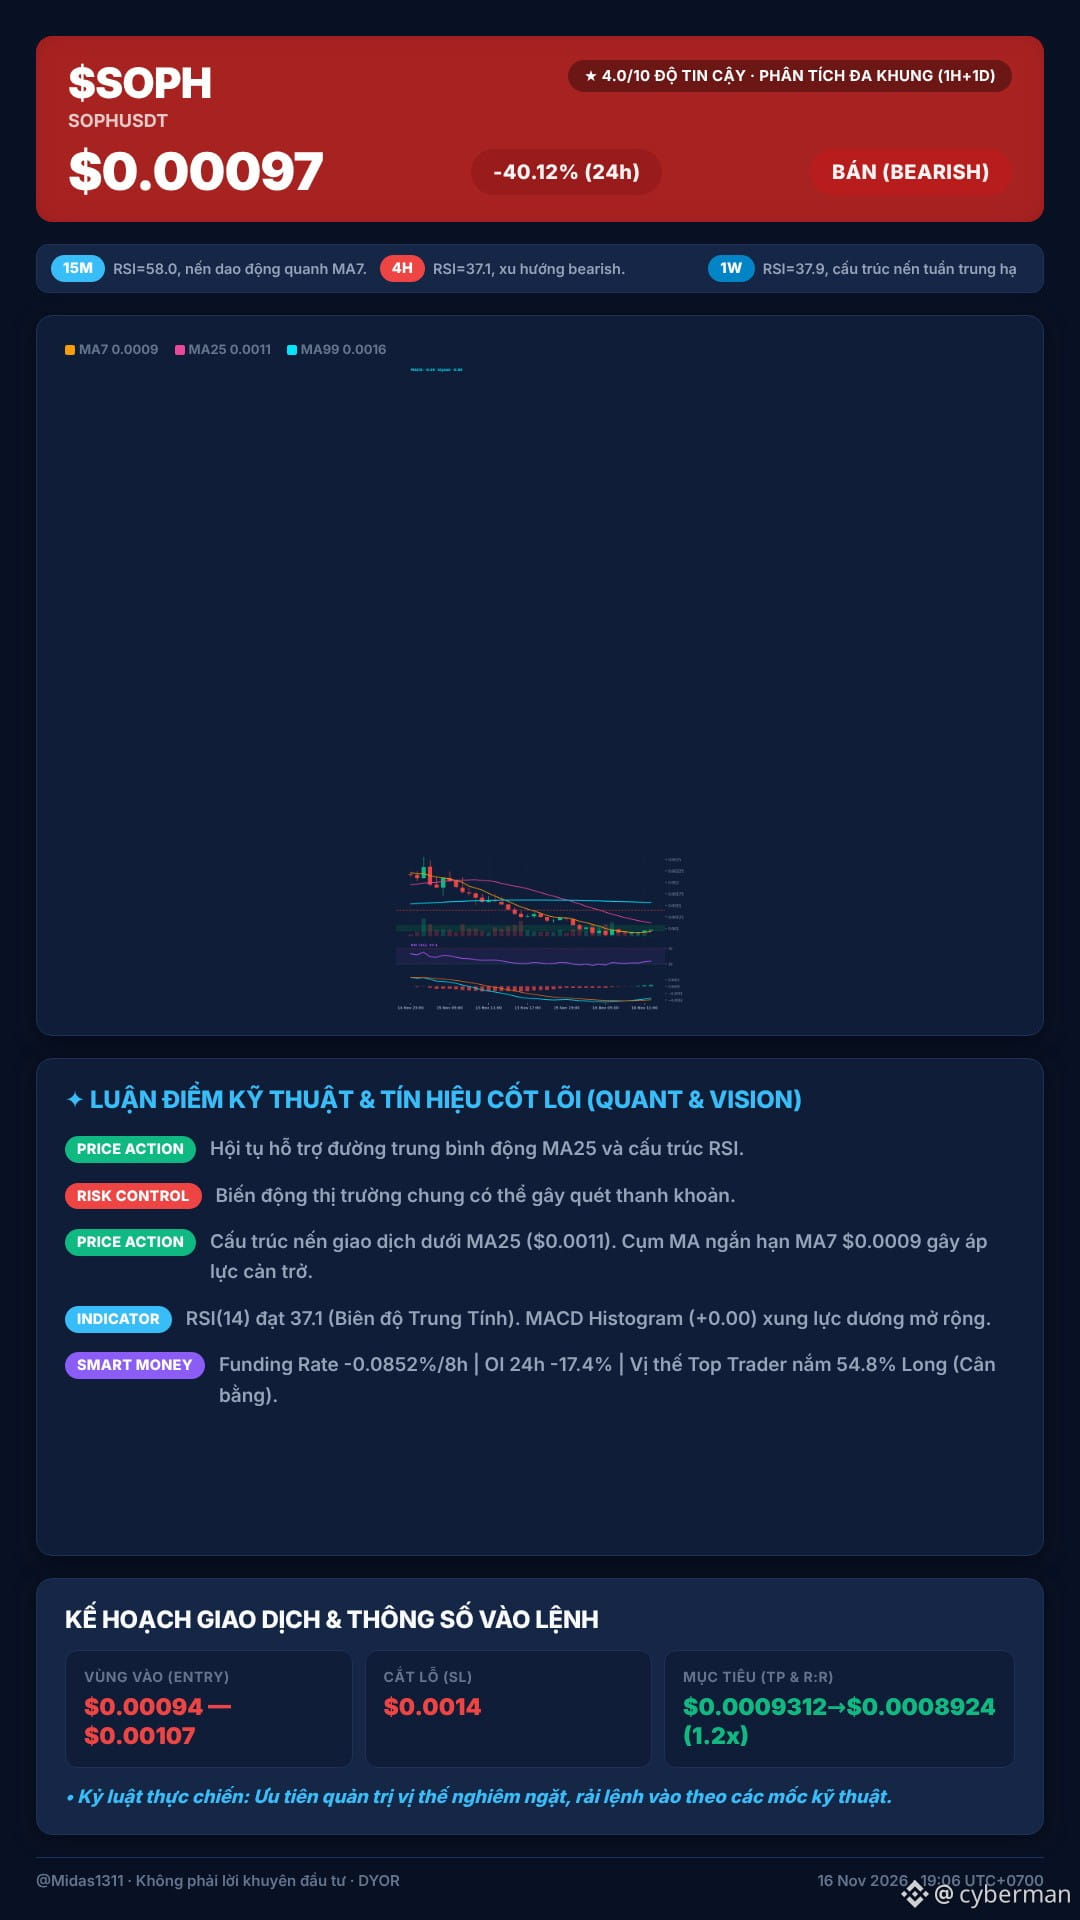
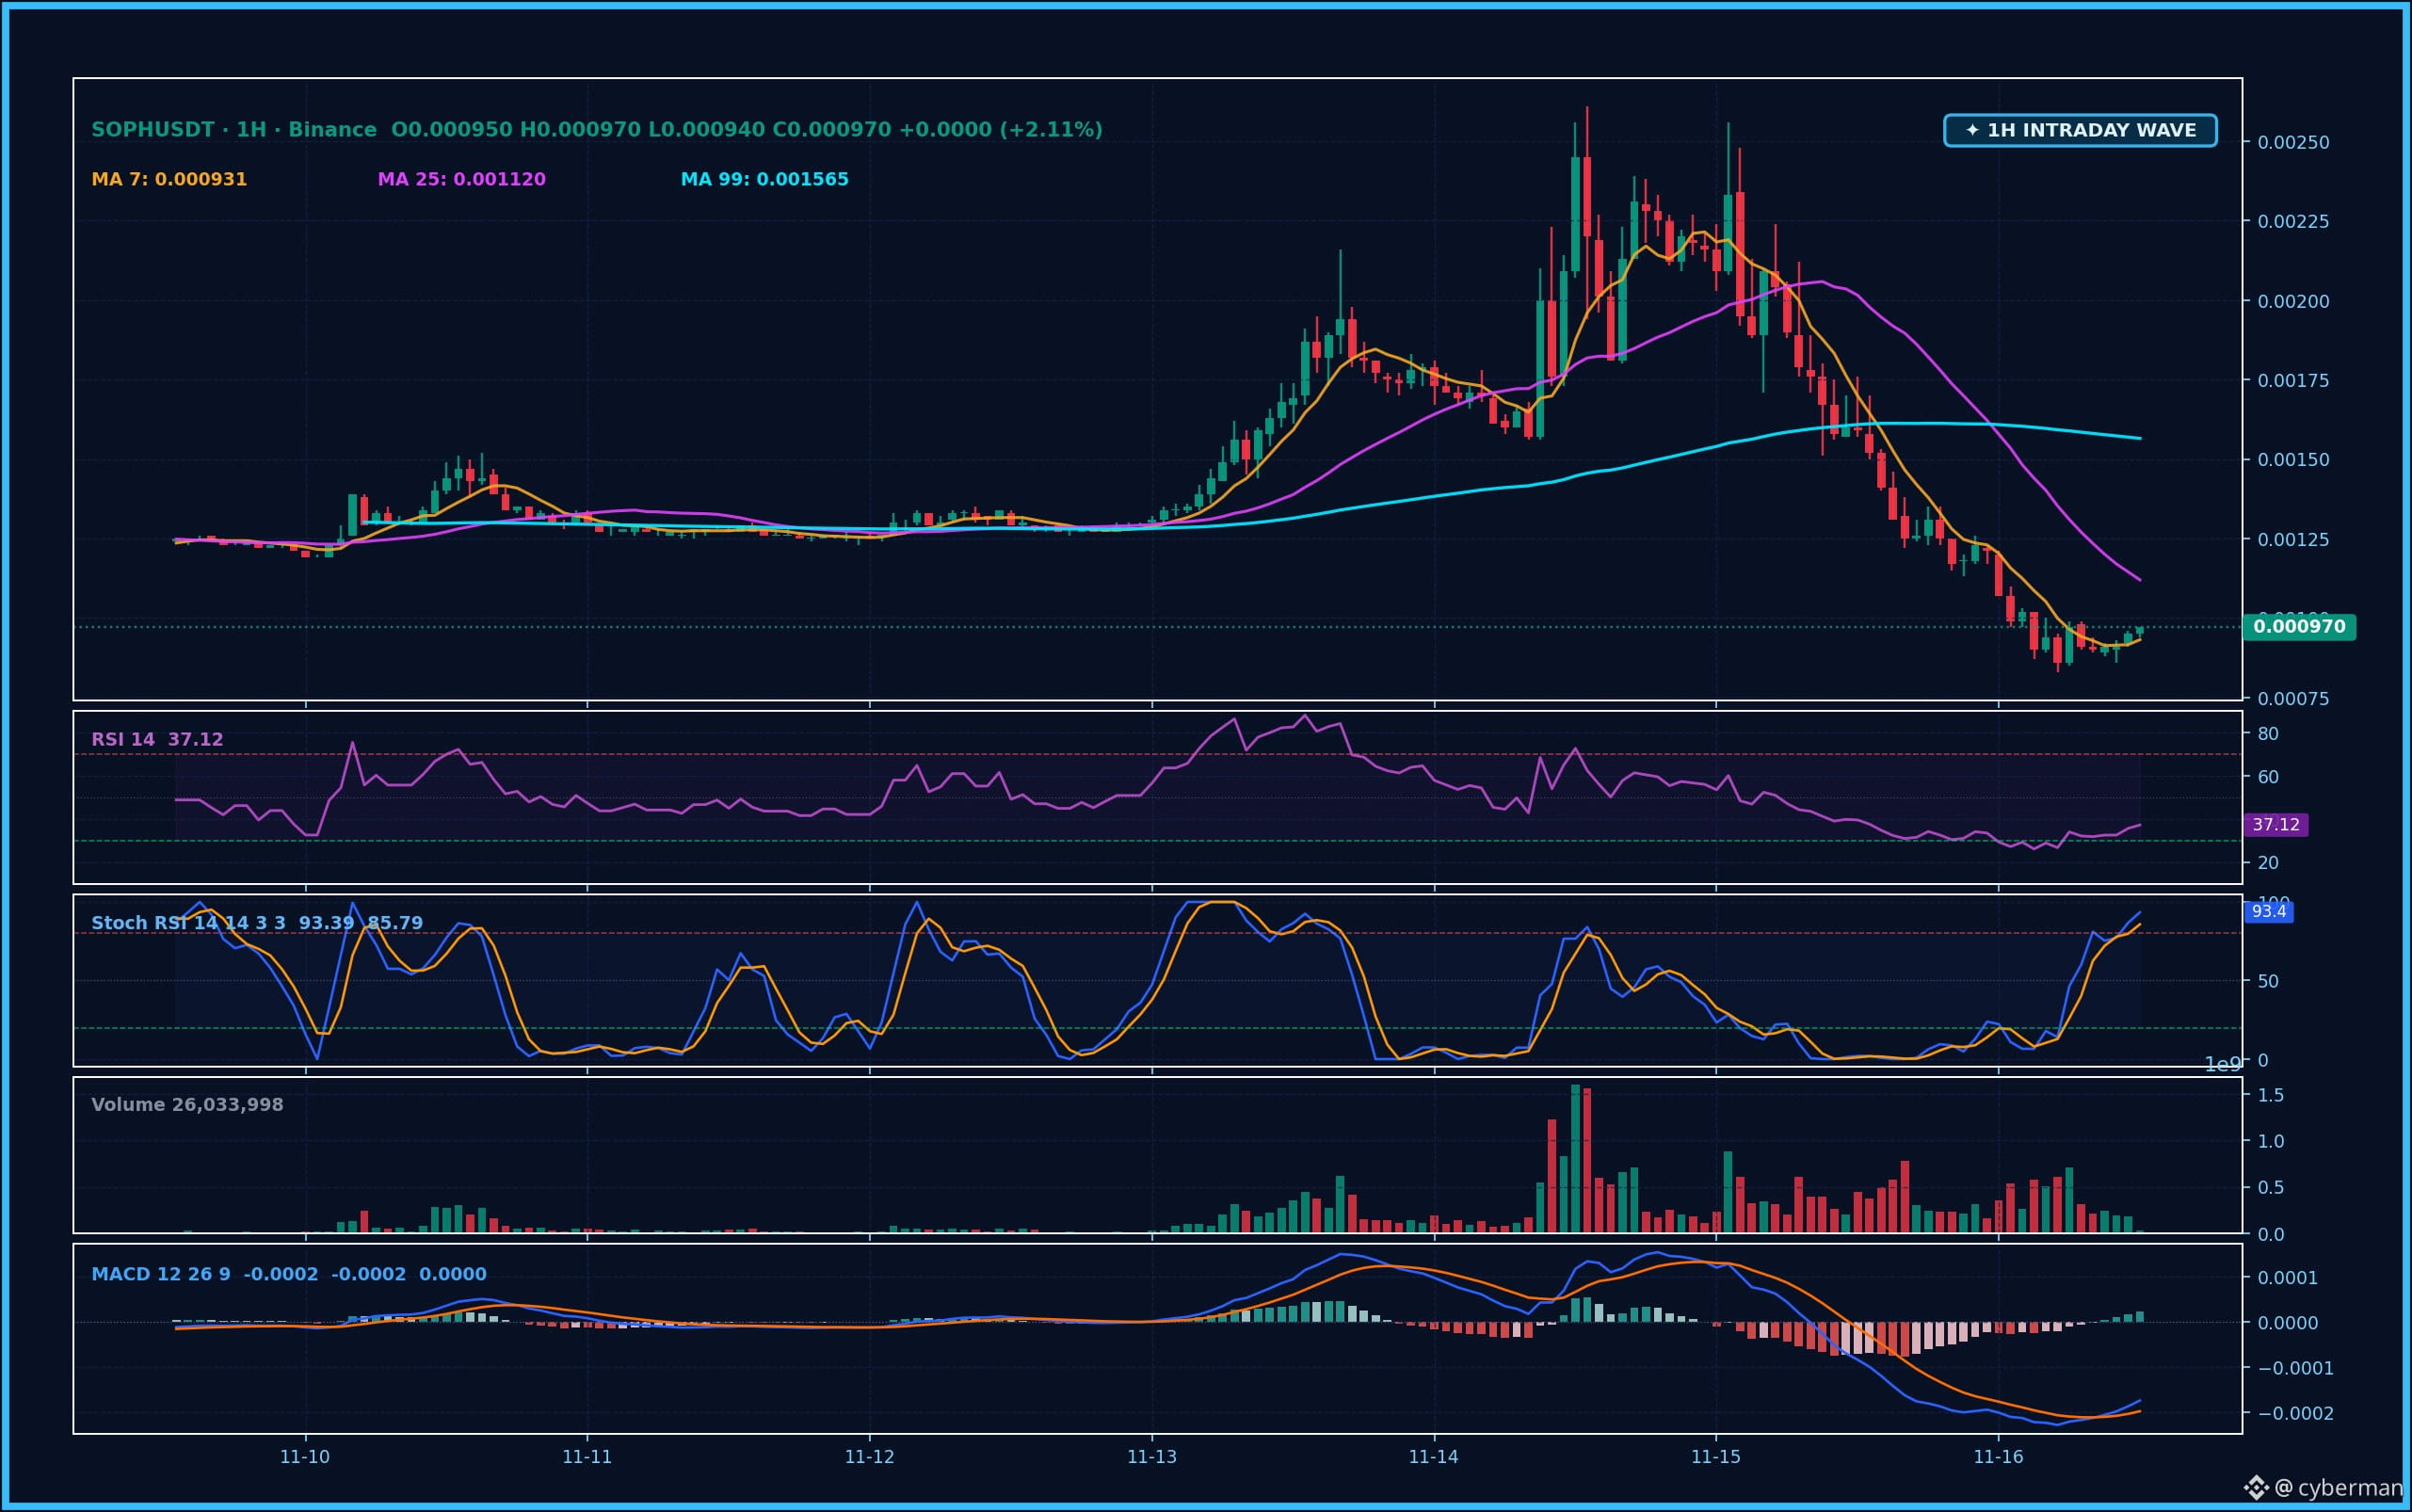
Damn, $SOPH it dropped so hard I had to look twice—I thought I’d just escaped some buy-the-top nightmare 😭. Just look at that 1H candle: blood in the streets. The whole crypto market is in turmoil over the news that Sophon will shut down its mainnet on 30/11, and everyone needs to withdraw their assets before 25/11. Who’d dare try to catch this falling knife now? 💀.
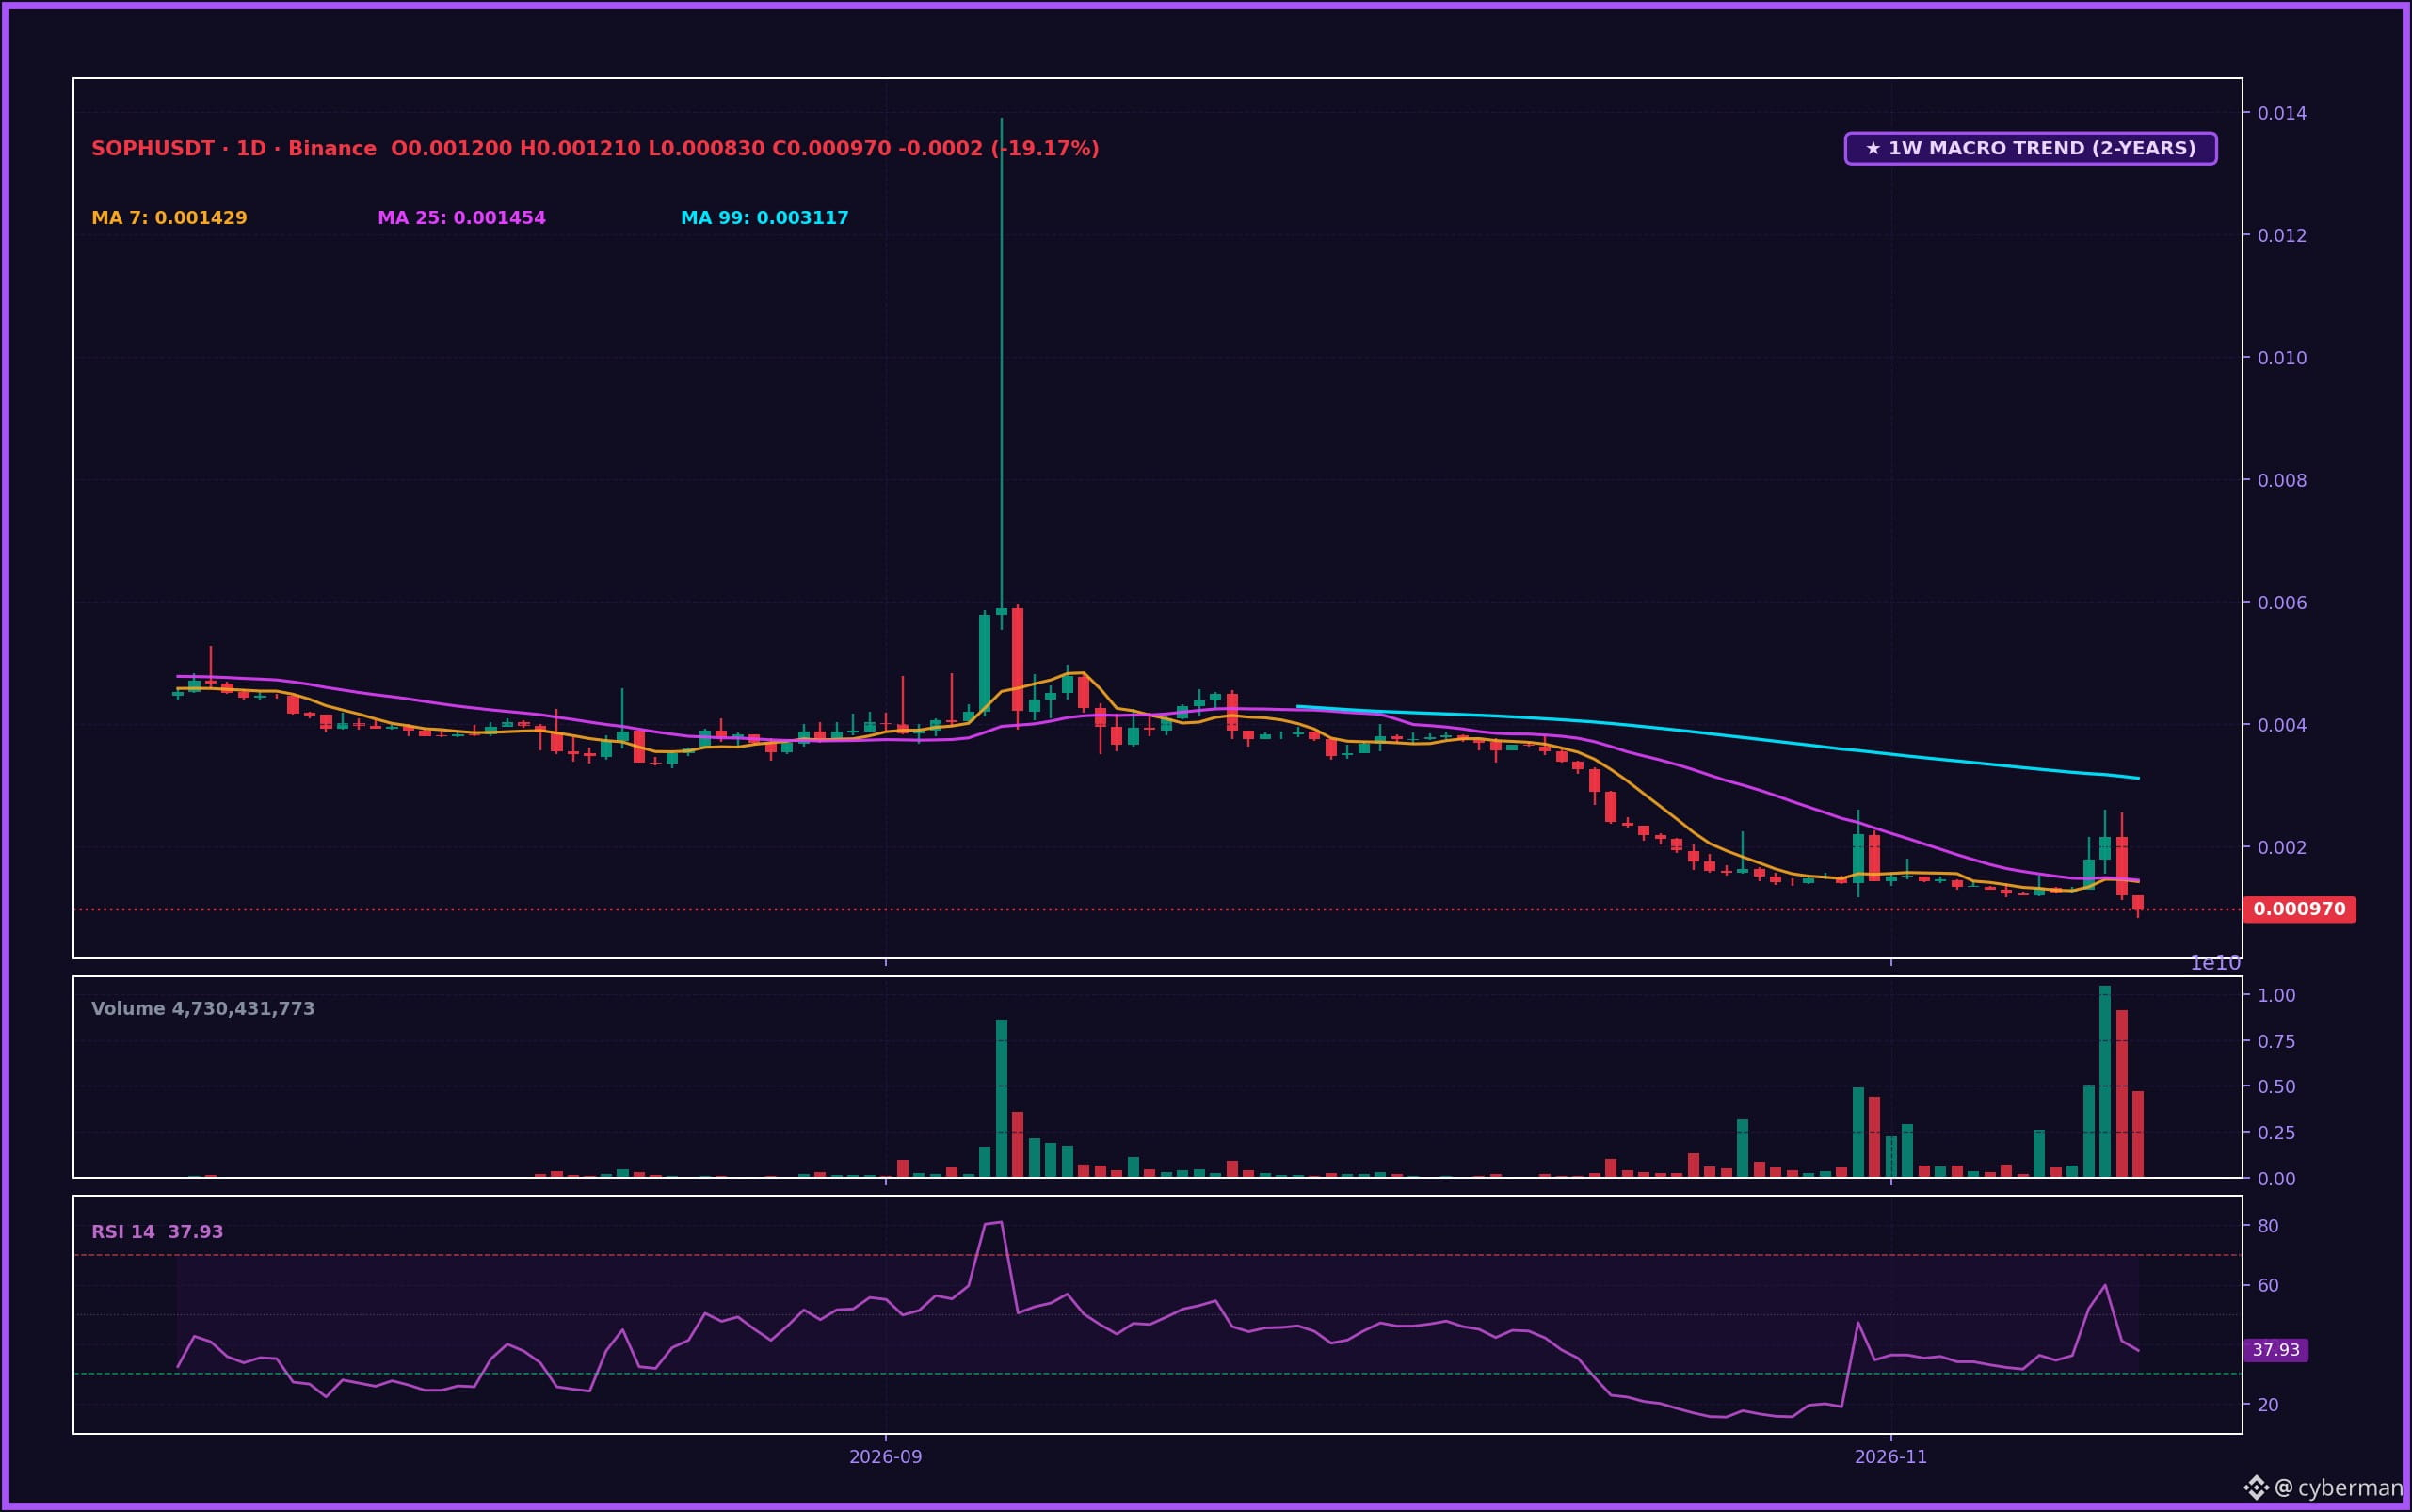
The 1D chart looks even more tragic: RSI(14) is languishing at 37.9, while the 1H is at 37.1. They’re hovering around neutral territory, but selling pressure is still pouring in like a waterfall. At $0.00097, the price is struggling below the short-term MA cluster—MA7 ($0.0009) and MA25 ($0.0011)—as if two swords were at its throat. MA99 at $0.0016 is miles away; it’s now a liquidity buffer, not support. The 24-hour selling pressure of -40.12% and massive volume of $10,390,091 USDT make sense, given the announcement that Sophon will shut down its Layer 2 chain and shift its focus to developing applications on Base. Some exchanges, like CoinDCX, have even restricted SOPH derivatives trading to “reduce-only” mode.
Damn, $SOPH it dropped so hard I had to look twice—I thought I’d just escaped some buy-the-top nightmare 😭. Just look at that 1H candle: blood in the streets. The whole crypto market is in turmoil over the news that Sophon will shut down its mainnet on 30/11, and everyone needs to withdraw their assets before 25/11. Who’d dare try to catch this falling knife now? 💀.
The 1D chart looks even more tragic: RSI(14) is languishing at 37.9, while the 1H is at 37.1. They’re hovering around neutral territory, but selling pressure is still pouring in like a waterfall. At $0.00097, the price is struggling below the short-term MA cluster—MA7 ($0.0009) and MA25 ($0.0011)—as if two swords were at its throat. MA99 at $0.0016 is miles away; it’s now a liquidity buffer, not support. The 24-hour selling pressure of -40.12% and massive volume of $10,390,091 USDT make sense, given the announcement that Sophon will shut down its Layer 2 chain and shift its focus to developing applications on Base. Some exchanges, like CoinDCX, have even restricted SOPH derivatives trading to “reduce-only” mode.
The 1D chart looks even more tragic: RSI(14) is languishing at 37.9, while the 1H is at 37.1. They’re hovering around neutral territory, but selling pressure is still pouring in like a waterfall. At $0.00097, the price is struggling below the short-term MA cluster—MA7 ($0.0009) and MA25 ($0.0011)—as if two swords were at its throat. MA99 at $0.0016 is miles away; it’s now a liquidity buffer, not support. The 24-hour selling pressure of -40.12% and massive volume of $10,390,091 USDT make sense, given the announcement that Sophon will shut down its Layer 2 chain and shift its focus to developing applications on Base. Some exchanges, like CoinDCX, have even restricted SOPH derivatives trading to “reduce-only” mode.
798
·
--
Who says the market is boring? 🤔 BTC has quietly crawled up +1.08% in 24 hours. With prices hovering in this range, the order books are showing a surprisingly contrasting picture. The whole exchange looks sluggish, yet some coins are blazing green, while others are deep red, falling far more than the overall market.
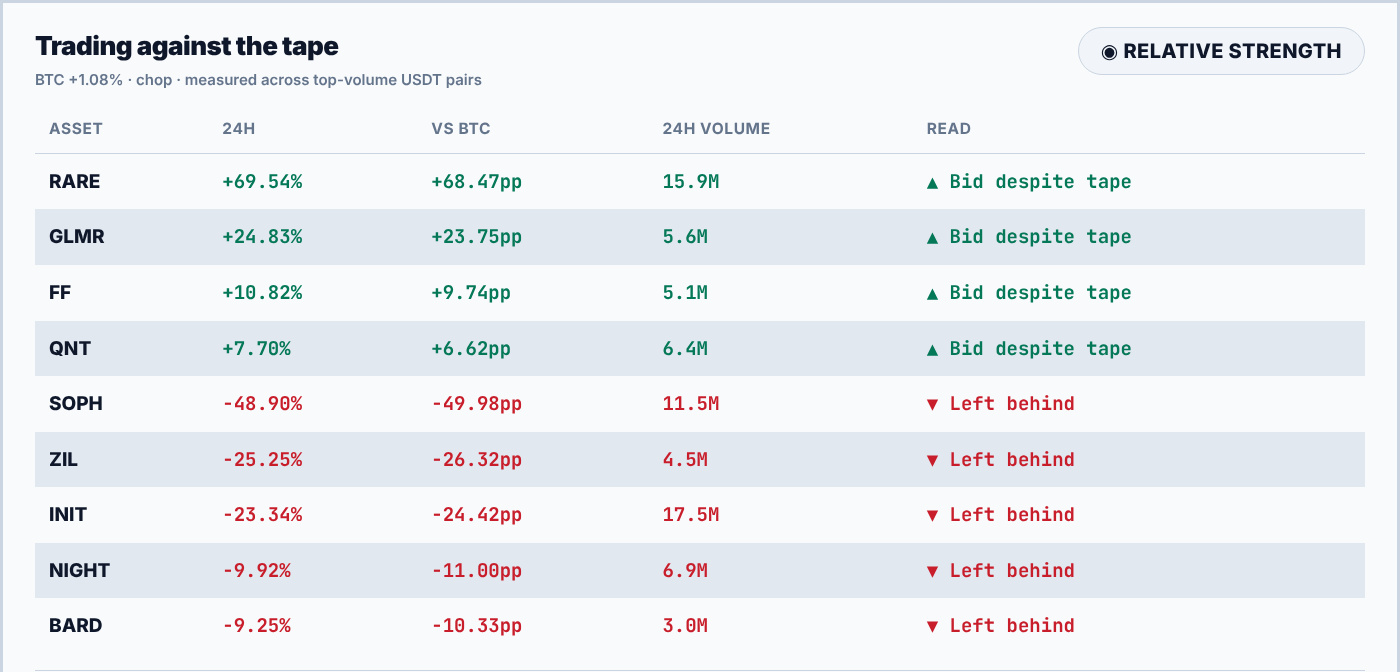
This isn’t just luck, folks. When the market is moving sideways or edging up slightly, a coin making a strong breakout—like $RARE with +69.54% (outperforming BTC by 68.47 percentage points), or GLMR rising +24.83% (23.75 percentage points more than BTC)—shows that whale money is flowing in. That’s “relative strength,” which matters far more than the absolute growth percentage. It gives us a clue about where the big players are setting their sights. Conversely, names like SOPH plunging nearly 49% or ZIL losing 25.25% while the market is still slightly green are clearly struggling, with nothing much to say for them. 😏
My view is clear: when the market is moving sideways like this, any coin that’s still glowing green has its own inflow of money—it’s not just riding the wave.
Who says the market is boring? 🤔 BTC has quietly crawled up +1.08% in 24 hours. With prices hovering in this range, the order books are showing a surprisingly contrasting picture. The whole exchange looks sluggish, yet some coins are blazing green, while others are deep red, falling far more than the overall market.
This isn’t just luck, folks. When the market is moving sideways or edging up slightly, a coin making a strong breakout—like $RARE with +69.54% (outperforming BTC by 68.47 percentage points), or GLMR rising +24.83% (23.75 percentage points more than BTC)—shows that whale money is flowing in. That’s “relative strength,” which matters far more than the absolute growth percentage. It gives us a clue about where the big players are setting their sights. Conversely, names like SOPH plunging nearly 49% or ZIL losing 25.25% while the market is still slightly green are clearly struggling, with nothing much to say for them. 😏
My view is clear: when the market is moving sideways like this, any coin that’s still glowing green has its own inflow of money—it’s not just riding the wave.
This isn’t just luck, folks. When the market is moving sideways or edging up slightly, a coin making a strong breakout—like $RARE with +69.54% (outperforming BTC by 68.47 percentage points), or GLMR rising +24.83% (23.75 percentage points more than BTC)—shows that whale money is flowing in. That’s “relative strength,” which matters far more than the absolute growth percentage. It gives us a clue about where the big players are setting their sights. Conversely, names like SOPH plunging nearly 49% or ZIL losing 25.25% while the market is still slightly green are clearly struggling, with nothing much to say for them. 😏
My view is clear: when the market is moving sideways like this, any coin that’s still glowing green has its own inflow of money—it’s not just riding the wave.
229
·
--
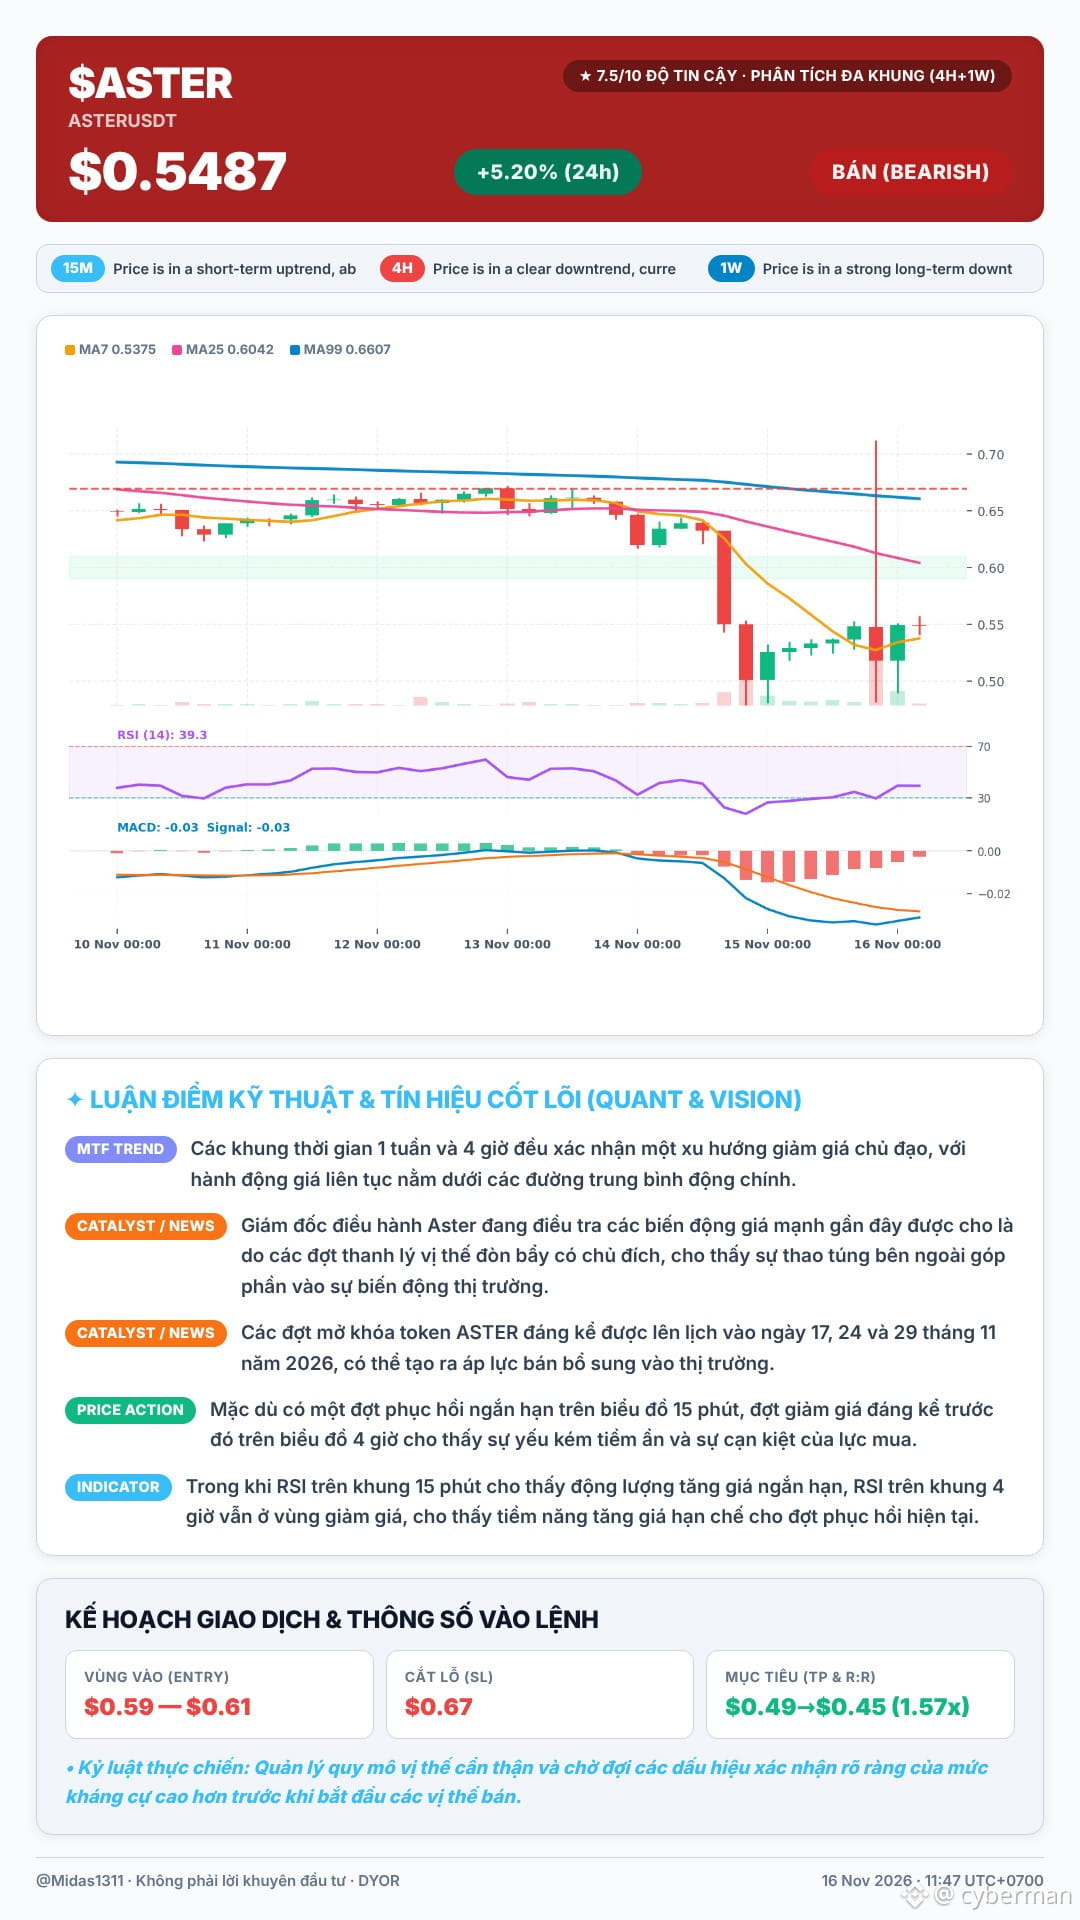
$ASTER There was a pretty sharp candle spike just now. The long traders seem quite pleased, but if you look closely, things may not be as rosy as they seem. 😏
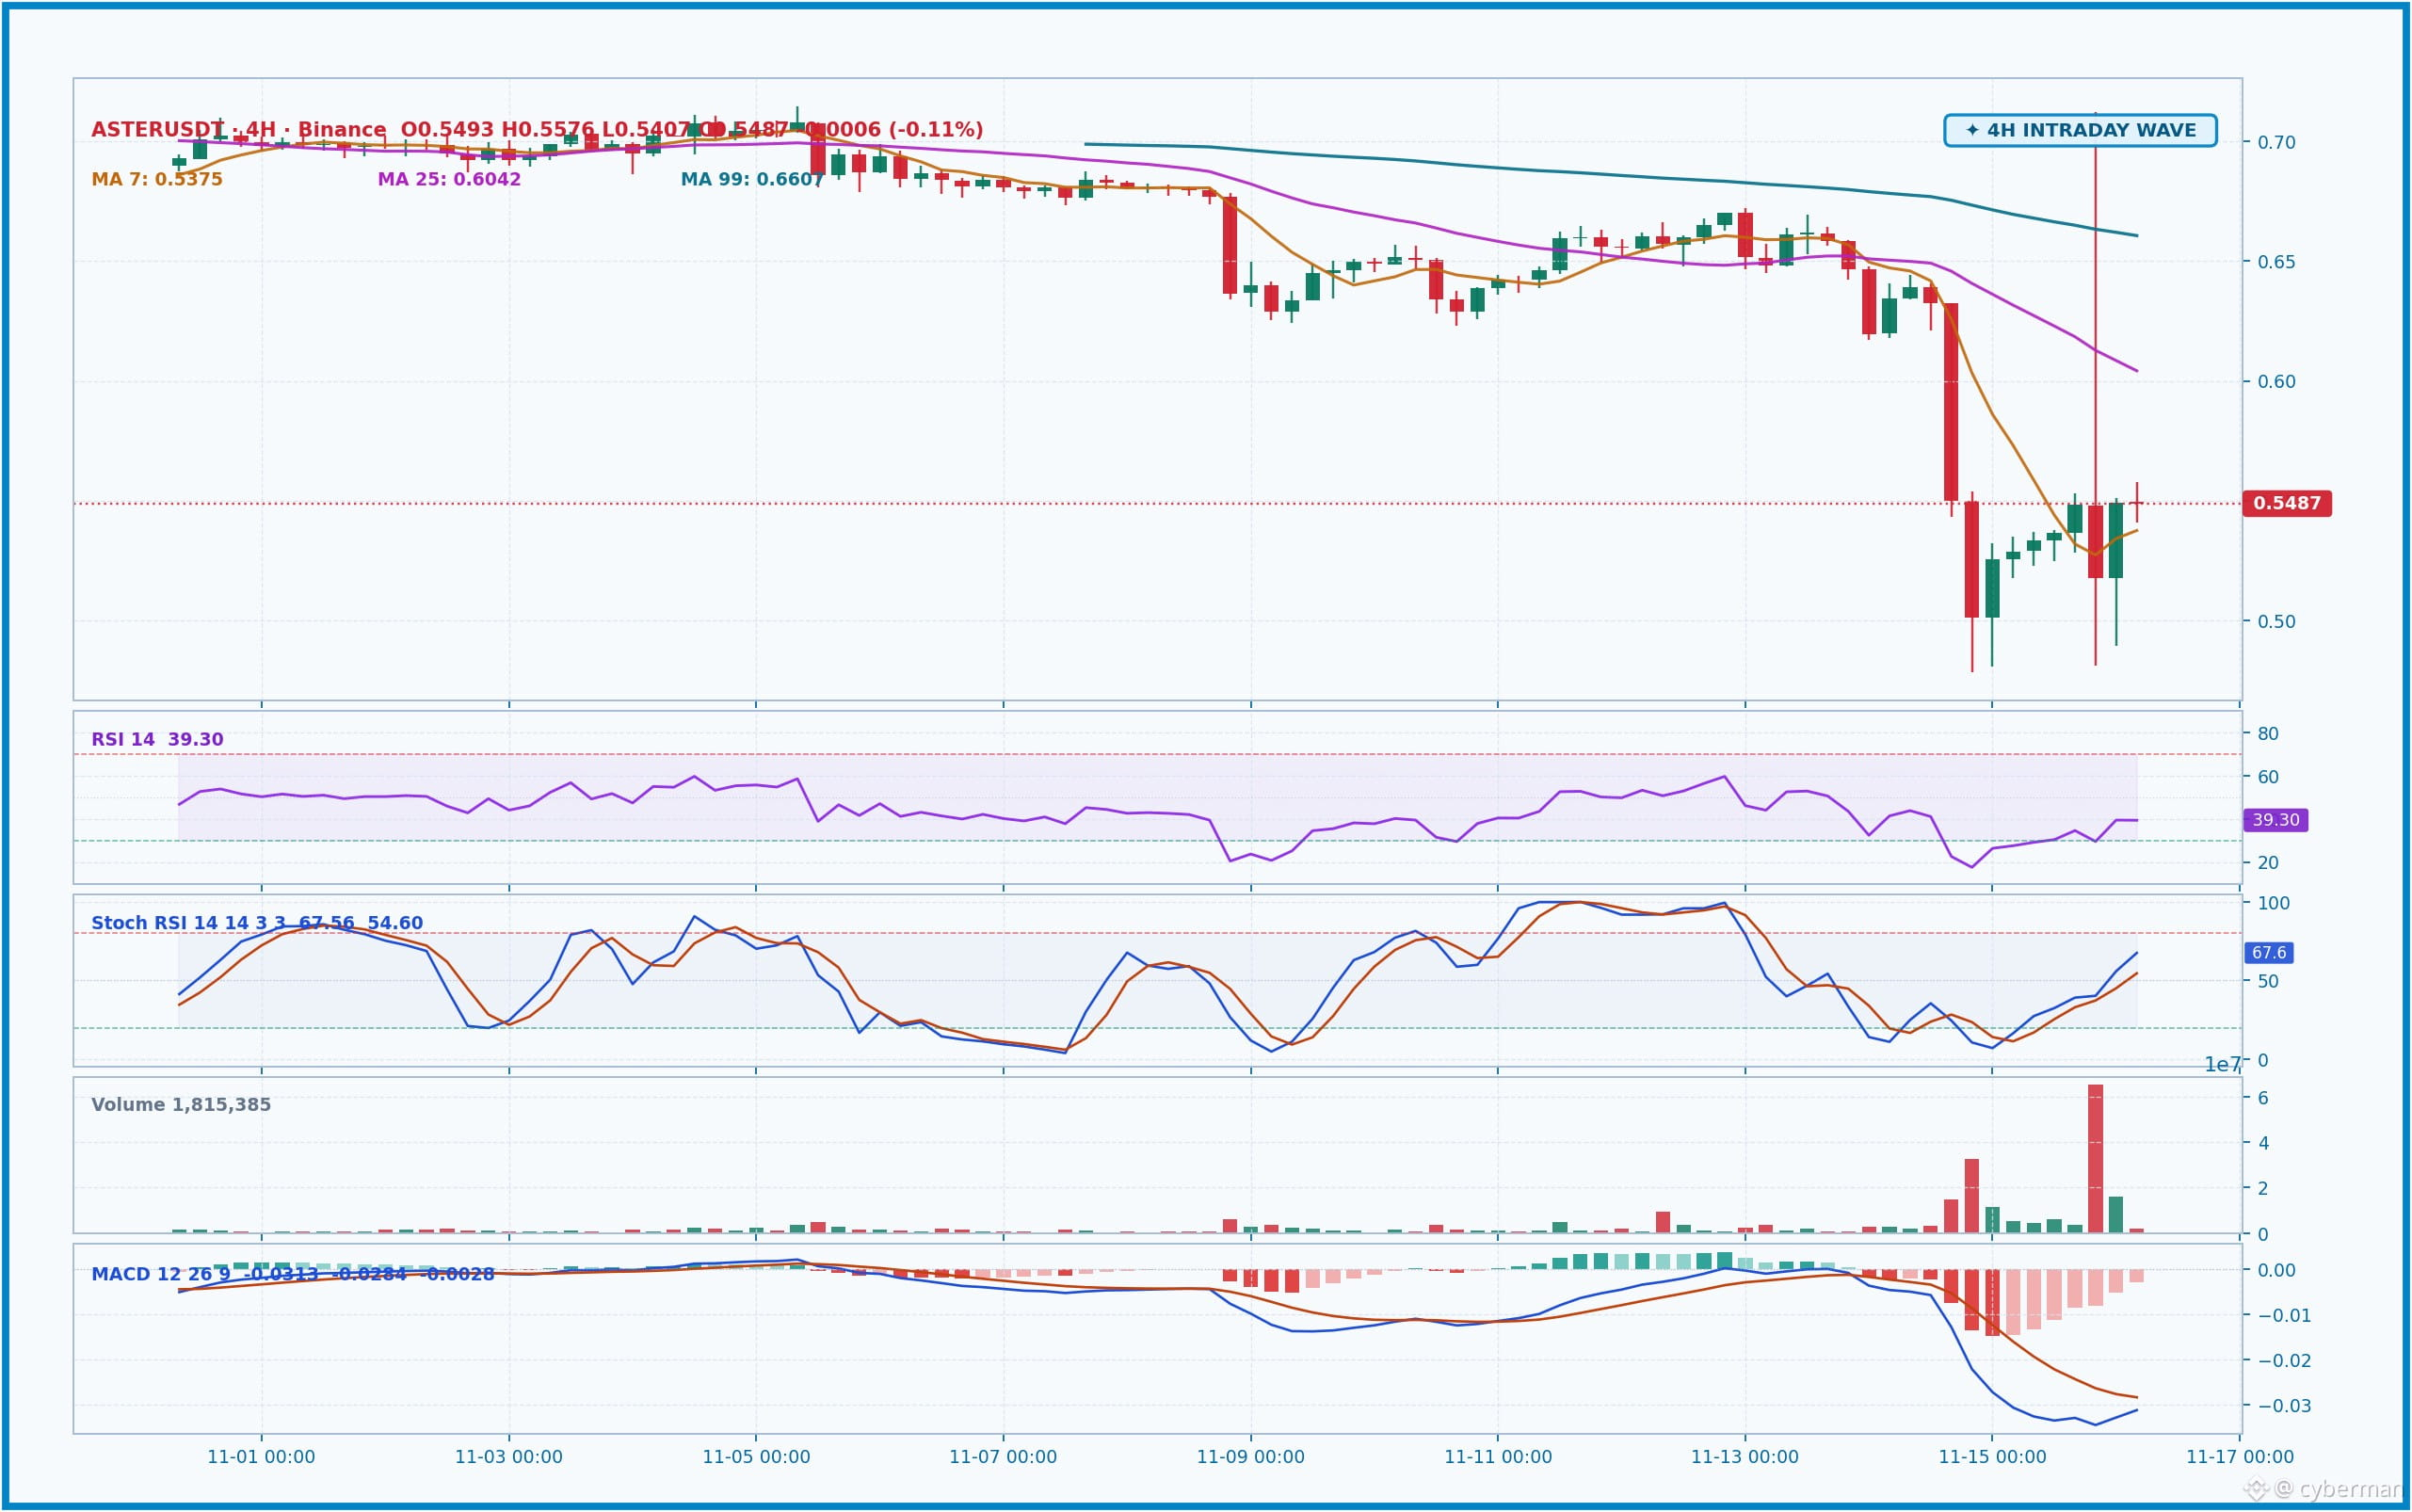
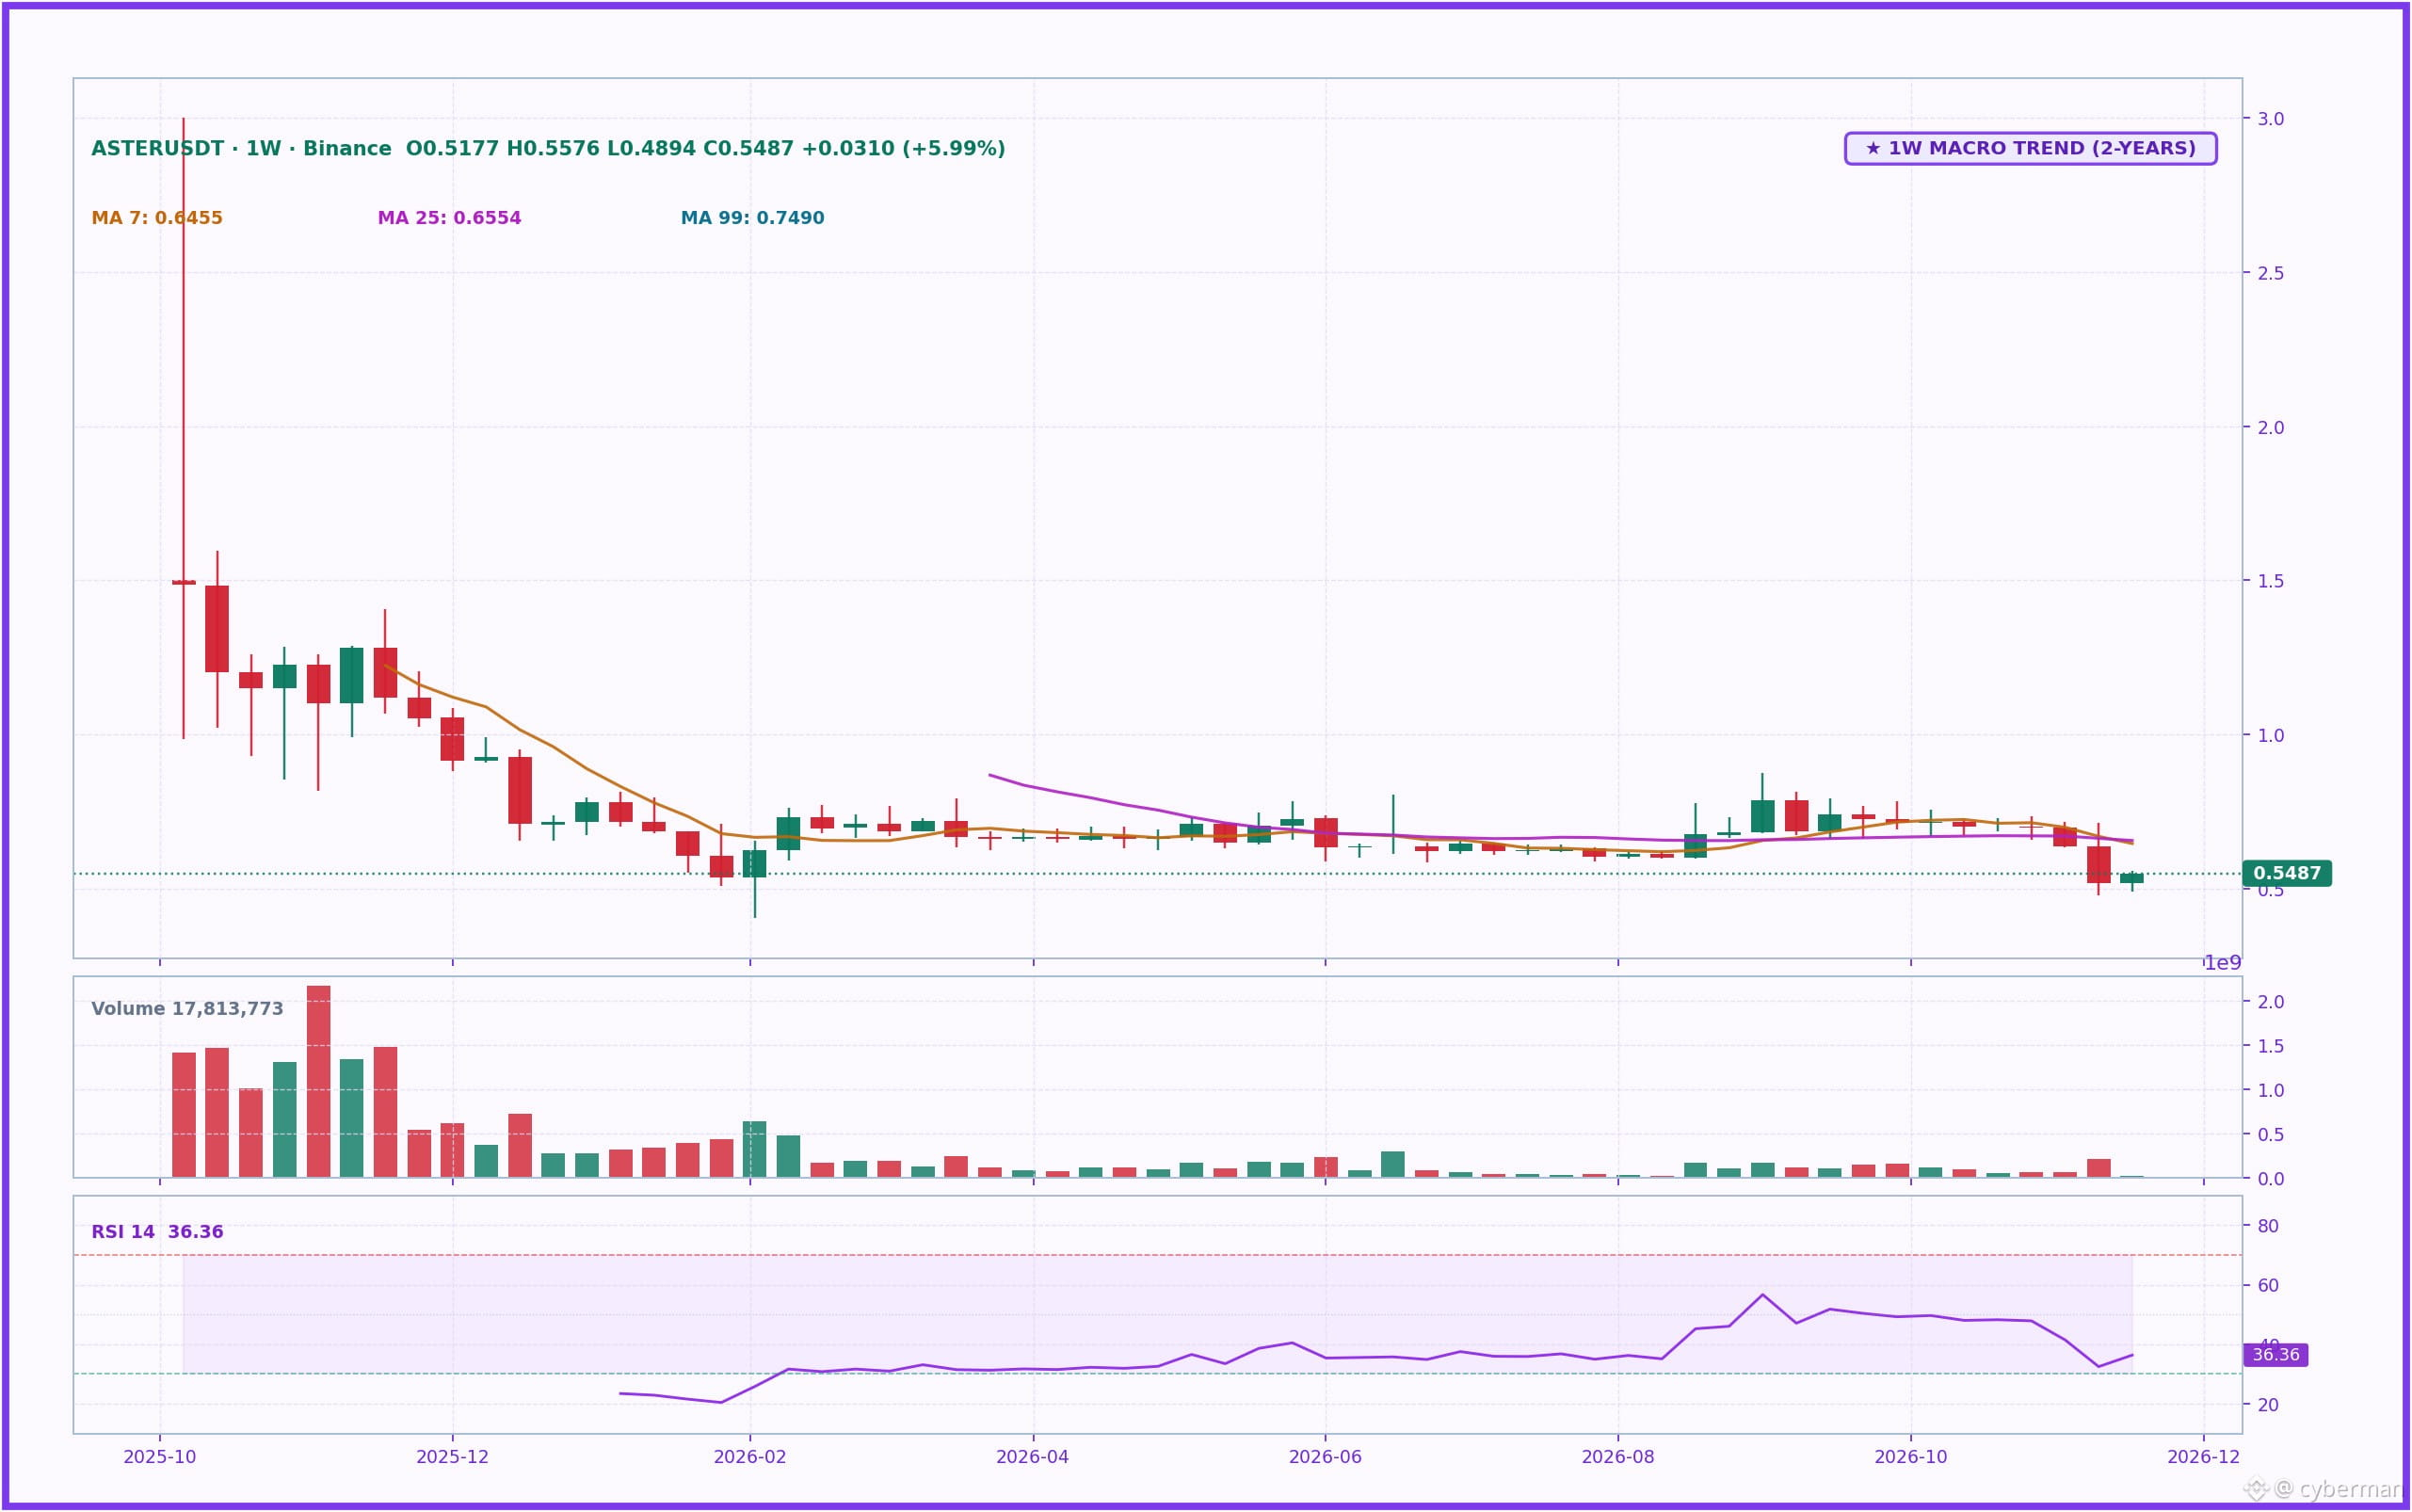
Looking at the 4H chart, the price is currently $0.5487. After a deep drop, it appears to be trying to recover. However, price action is still below all the key moving averages: MA7 at $0.5375, MA25 at $0.6042, and MA99 at $0.6607. Clearly, the short-term chart is still under downward pressure. On the 1W timeframe, the macro picture is also not very bright, as ASTER remains in a prevailing downtrend, with the weekly RSI at 36.4, suggesting momentum is still weak. Although it was up 5.20% over 24 hours at one point yesterday, with trading volume reaching $55,941,106 USDT, this may just be a technical rebound within a downtrend.
What I think is worth paying attention to is that Astar's CEO has just spoken out about investigating the recent sharp price swings, which are suspected to be due to "deliberate leveraged liquidations"—it really does have the smell of market manipulation. Coming up, significant ASTER token unlocks on November 17, 24, and 29, 2026, will add further selling pressure.
$ASTER There was a pretty sharp candle spike just now. The long traders seem quite pleased, but if you look closely, things may not be as rosy as they seem. 😏
Looking at the 4H chart, the price is currently $0.5487. After a deep drop, it appears to be trying to recover. However, price action is still below all the key moving averages: MA7 at $0.5375, MA25 at $0.6042, and MA99 at $0.6607. Clearly, the short-term chart is still under downward pressure. On the 1W timeframe, the macro picture is also not very bright, as ASTER remains in a prevailing downtrend, with the weekly RSI at 36.4, suggesting momentum is still weak. Although it was up 5.20% over 24 hours at one point yesterday, with trading volume reaching $55,941,106 USDT, this may just be a technical rebound within a downtrend.
What I think is worth paying attention to is that Astar's CEO has just spoken out about investigating the recent sharp price swings, which are suspected to be due to "deliberate leveraged liquidations"—it really does have the smell of market manipulation. Coming up, significant ASTER token unlocks on November 17, 24, and 29, 2026, will add further selling pressure.
Looking at the 4H chart, the price is currently $0.5487. After a deep drop, it appears to be trying to recover. However, price action is still below all the key moving averages: MA7 at $0.5375, MA25 at $0.6042, and MA99 at $0.6607. Clearly, the short-term chart is still under downward pressure. On the 1W timeframe, the macro picture is also not very bright, as ASTER remains in a prevailing downtrend, with the weekly RSI at 36.4, suggesting momentum is still weak. Although it was up 5.20% over 24 hours at one point yesterday, with trading volume reaching $55,941,106 USDT, this may just be a technical rebound within a downtrend.
What I think is worth paying attention to is that Astar's CEO has just spoken out about investigating the recent sharp price swings, which are suspected to be due to "deliberate leveraged liquidations"—it really does have the smell of market manipulation. Coming up, significant ASTER token unlocks on November 17, 24, and 29, 2026, will add further selling pressure.
174
·
--
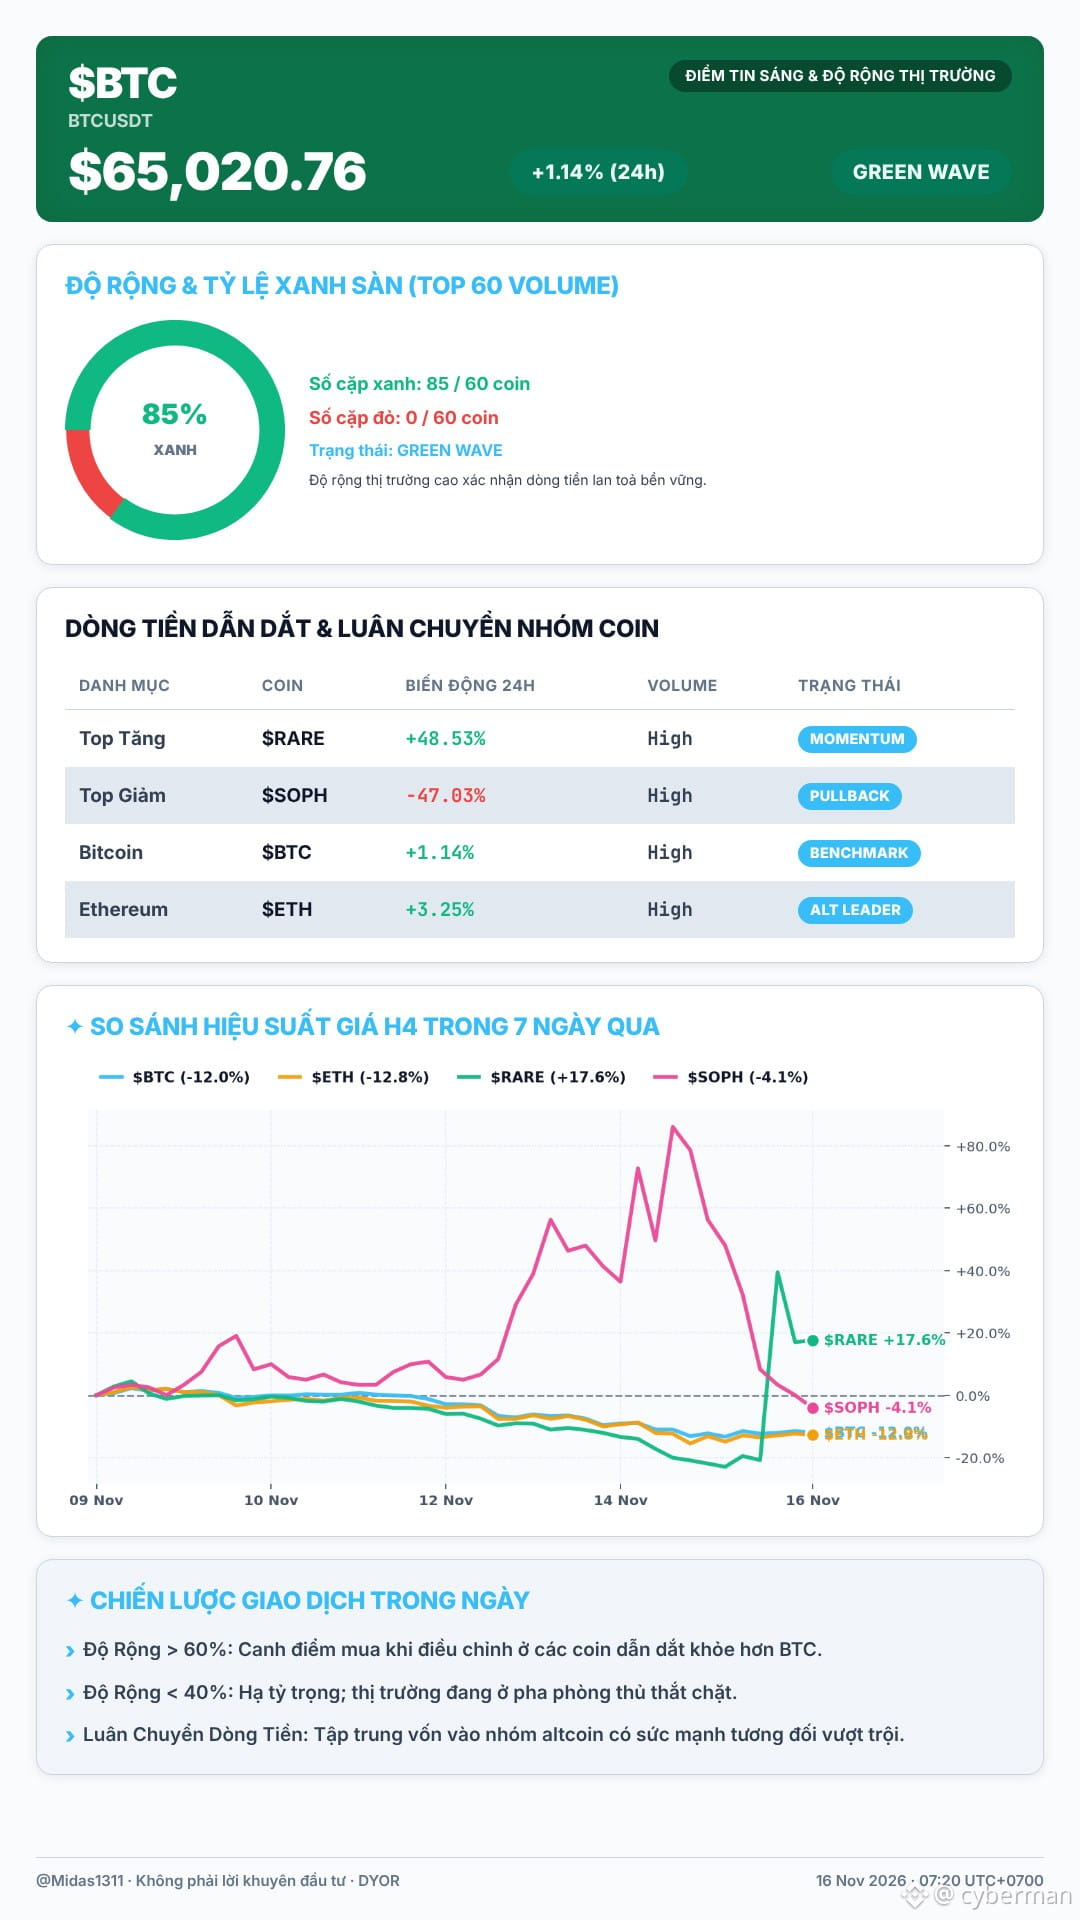
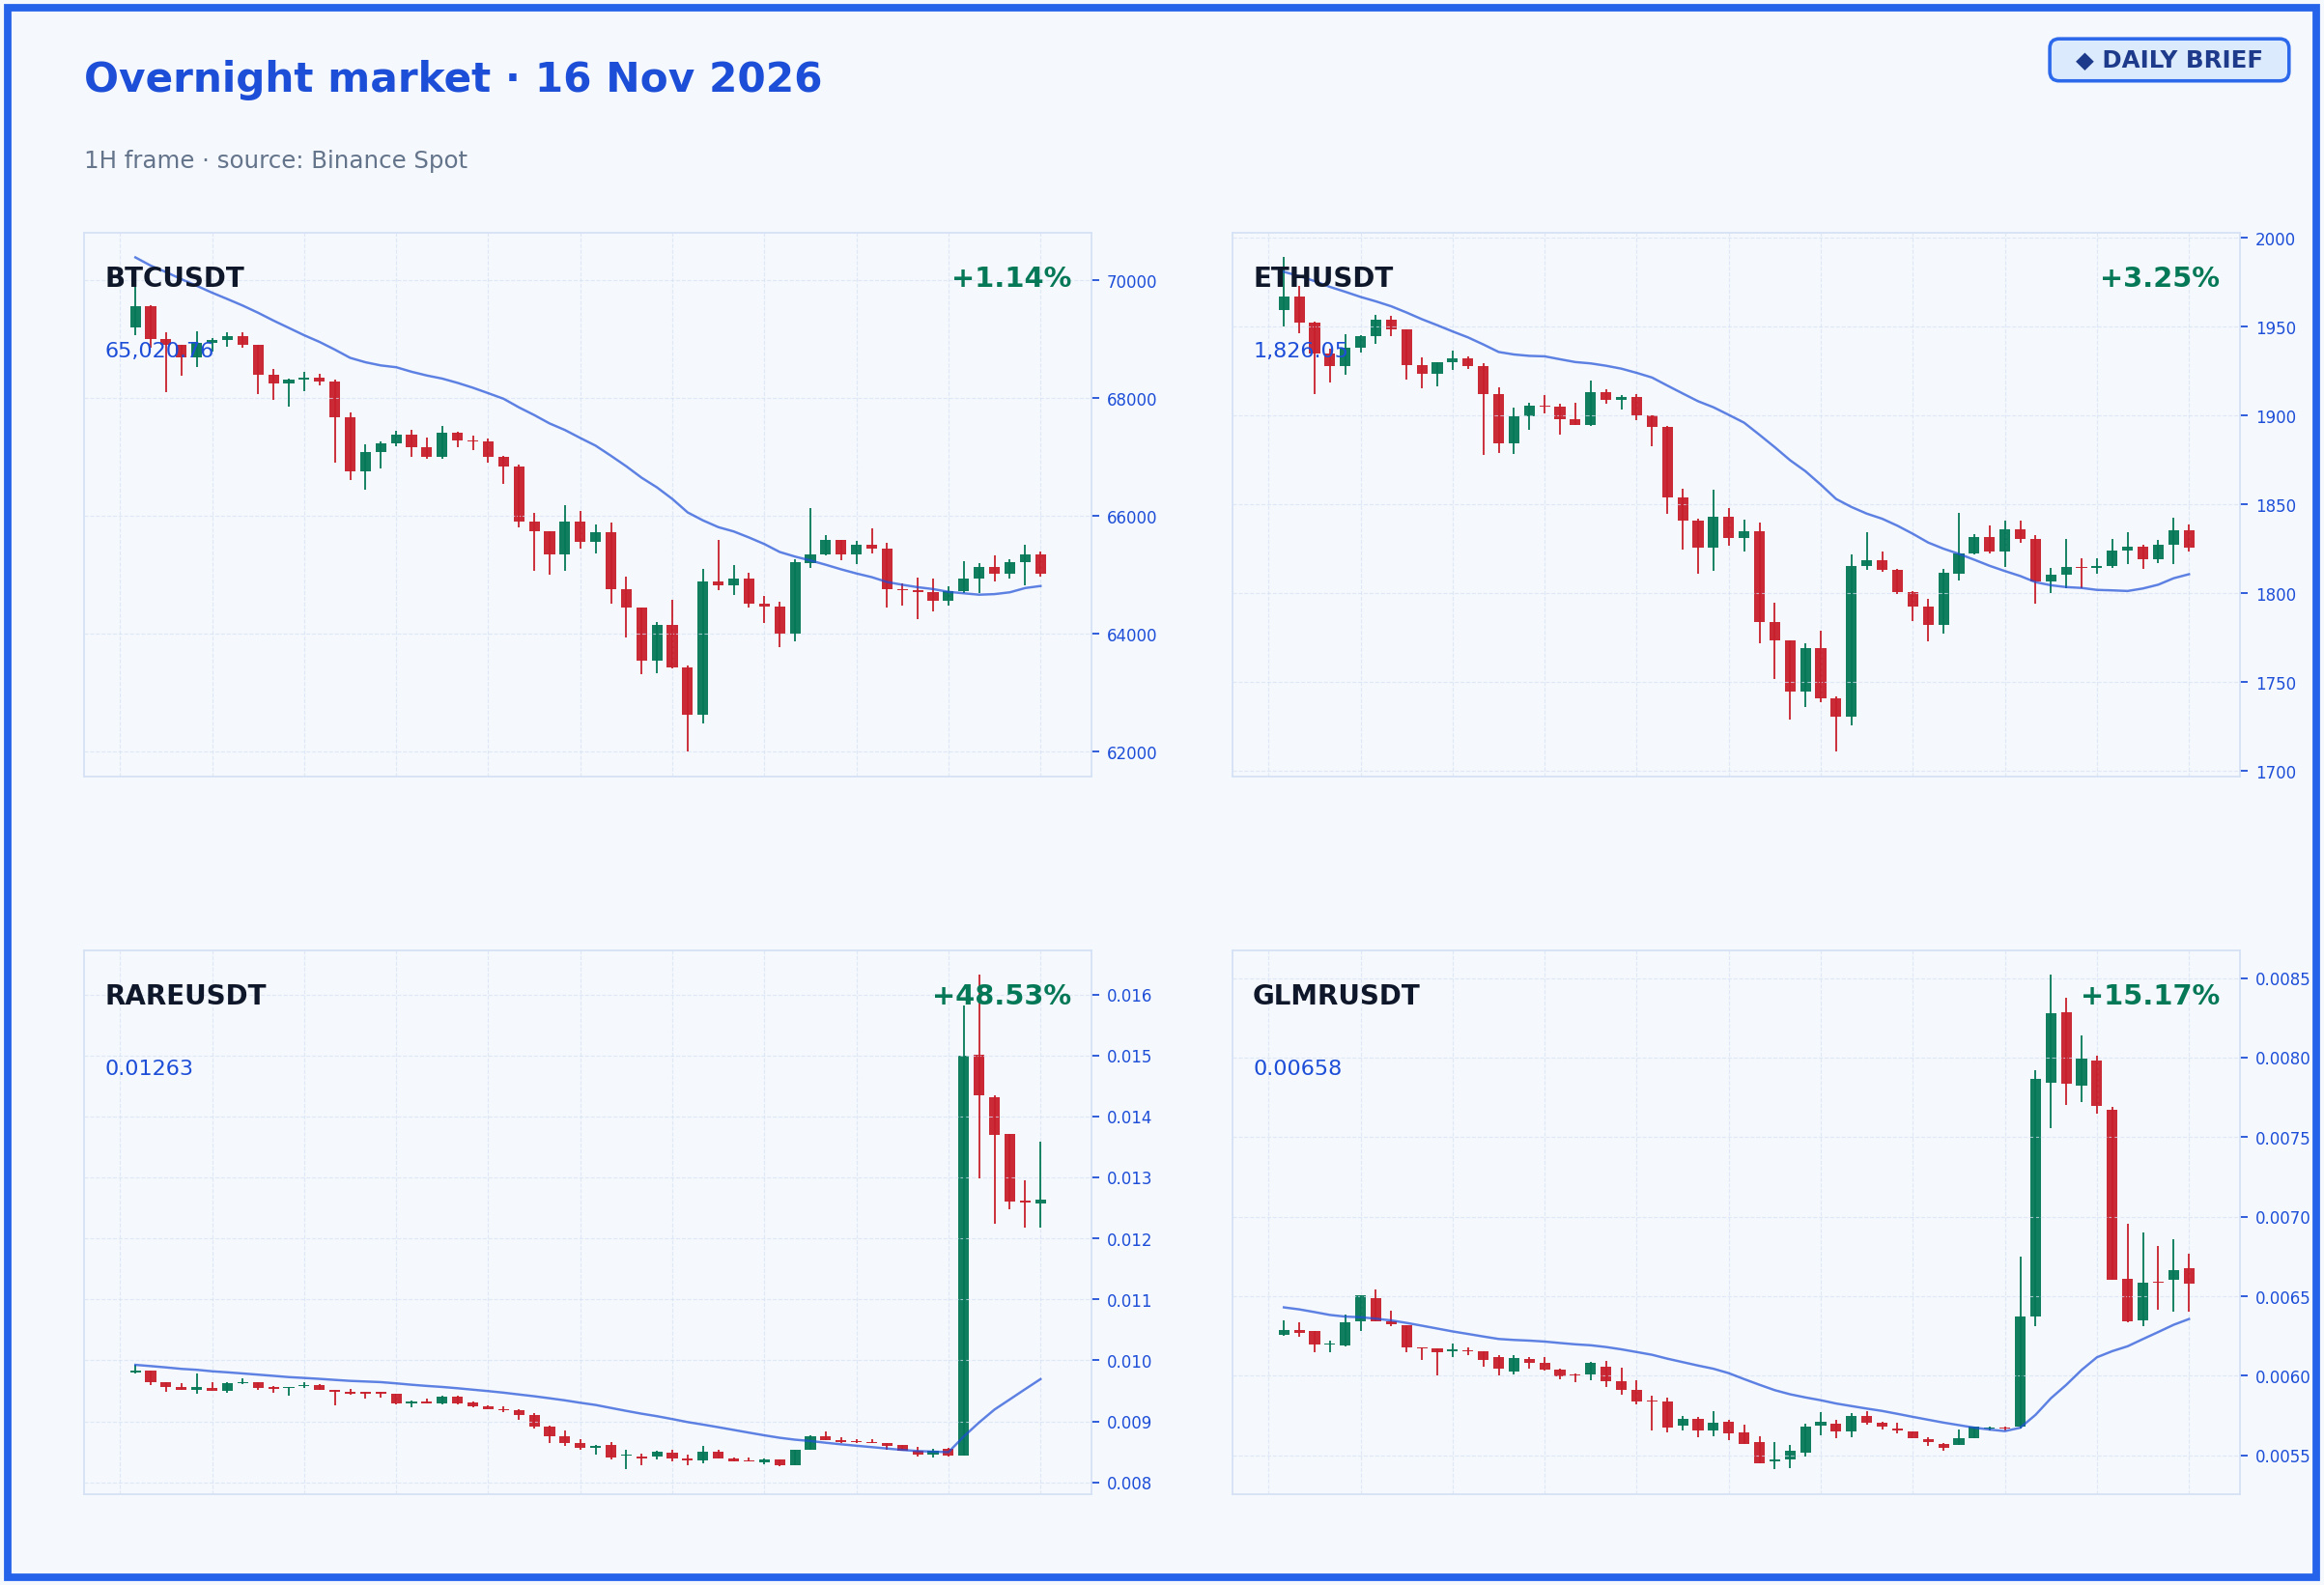
The overnight BTC chart looks a little more reassuring after several days of widespread “structural breakdowns,” but that doesn’t mean macroeconomic pressure is over.
BTC is trading around $65,020.76, up 1.14% after sweeping long stops from the $70,000 region down to below $63,000 over the past week, as spot Bitcoin ETF funds saw net outflows of nearly $2.35 billion over the last two weeks. Ethereum also made a slight recovery, rising 3.25% to $1,826.05. Market breadth shows 85% of altcoins in the green, with total volume among the top 100 reaching $4.38 billion, though most of this is still localized movement.
A notable highlight is $RARE surging 48.53%, while SOPH plunged 47.03%, showing that capital rotation remains very fast and fierce. The market is reacting to US core CPI rising 0.3% in October, above forecasts, increasing the likelihood of a Fed rate hike in December. Whales continue quietly accumulating, with wallets holding more than 1,000 BTC buying around 47,000 BTC during the sharp downturn.
The overnight BTC chart looks a little more reassuring after several days of widespread “structural breakdowns,” but that doesn’t mean macroeconomic pressure is over.
BTC is trading around $65,020.76, up 1.14% after sweeping long stops from the $70,000 region down to below $63,000 over the past week, as spot Bitcoin ETF funds saw net outflows of nearly $2.35 billion over the last two weeks. Ethereum also made a slight recovery, rising 3.25% to $1,826.05. Market breadth shows 85% of altcoins in the green, with total volume among the top 100 reaching $4.38 billion, though most of this is still localized movement.
A notable highlight is $RARE surging 48.53%, while SOPH plunged 47.03%, showing that capital rotation remains very fast and fierce. The market is reacting to US core CPI rising 0.3% in October, above forecasts, increasing the likelihood of a Fed rate hike in December. Whales continue quietly accumulating, with wallets holding more than 1,000 BTC buying around 47,000 BTC during the sharp downturn.
BTC is trading around $65,020.76, up 1.14% after sweeping long stops from the $70,000 region down to below $63,000 over the past week, as spot Bitcoin ETF funds saw net outflows of nearly $2.35 billion over the last two weeks. Ethereum also made a slight recovery, rising 3.25% to $1,826.05. Market breadth shows 85% of altcoins in the green, with total volume among the top 100 reaching $4.38 billion, though most of this is still localized movement.
A notable highlight is $RARE surging 48.53%, while SOPH plunged 47.03%, showing that capital rotation remains very fast and fierce. The market is reacting to US core CPI rising 0.3% in October, above forecasts, increasing the likelihood of a Fed rate hike in December. Whales continue quietly accumulating, with wallets holding more than 1,000 BTC buying around 47,000 BTC during the sharp downturn.
104
·
--
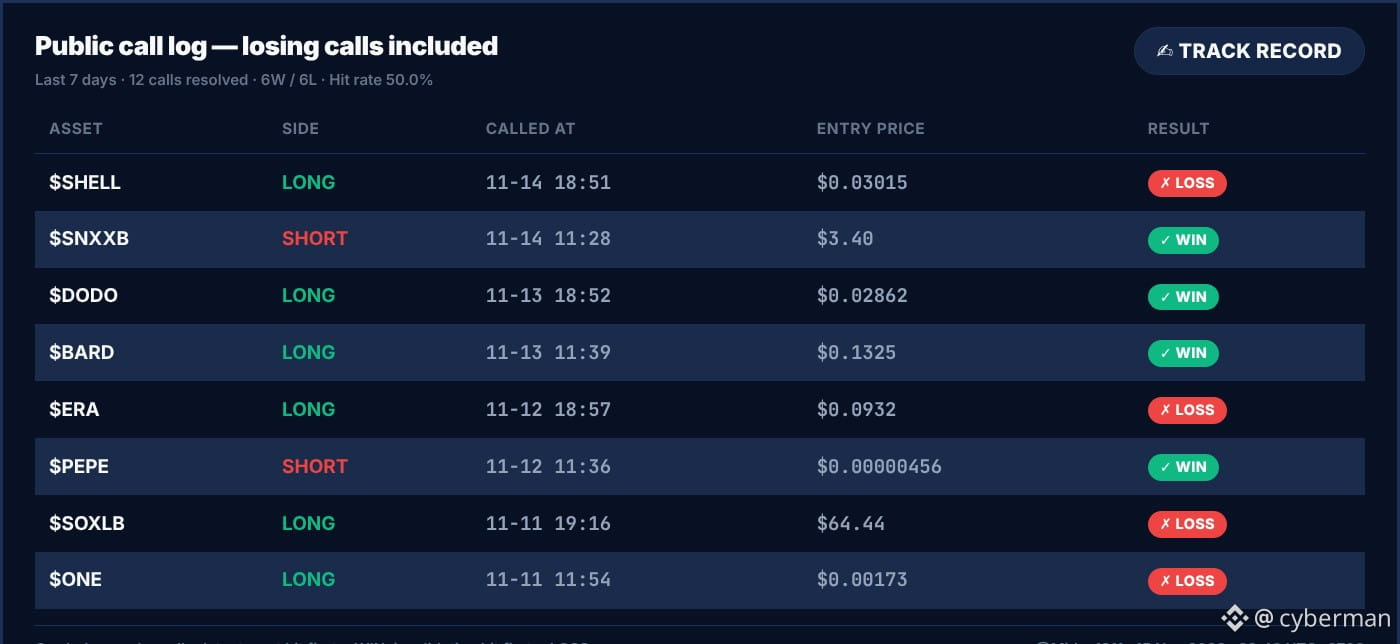
Looking at the chart $BTC right now, I feel torn—the moves up and down both make sense. My past week was exactly the same: 12 closed trades, 6 wins / 6 losses. A 50% win rate shows there’s still plenty to analyze. ✍️
Time for an honest review of those 6 painful losses 💀. The LONG Shell (0.03015, 14/11) and ERA (0.0932, 12/11) trades failed quickly after breaking their invalidation levels. Clearly, I entered too early and misread short-term momentum. The LONG SOXLB (64.44, 11/11) and ONE (0.00173, 11/11) trades also broke invalidation. SOXLB took nearly 2 days to officially invalidate, and I was overconfident holding onto a losing position instead of managing risk closely. There wasn’t enough buying pressure for Altcoin Longs. 😅 A mistake is a mistake—no beating around the bush.
Winning trades like SHORT SNXXB (3.40, 14/11), LONG DODO (0.02862, 13/11), LONG BARD (0.1325, 13/11), and SHORT PEPE (0.00000456, 12/11) all reached their targets pretty cleanly.
This week’s lesson is to ABSOLUTELY respect invalidation levels and avoid holding onto losing positions. Next time, I’ll pay more attention to volume breakout signals before entering Altcoin Longs, so I don’t get caught in weak sell-offs. 📒
Looking at the chart $BTC right now, I feel torn—the moves up and down both make sense. My past week was exactly the same: 12 closed trades, 6 wins / 6 losses. A 50% win rate shows there’s still plenty to analyze. ✍️
Time for an honest review of those 6 painful losses 💀. The LONG Shell (0.03015, 14/11) and ERA (0.0932, 12/11) trades failed quickly after breaking their invalidation levels. Clearly, I entered too early and misread short-term momentum. The LONG SOXLB (64.44, 11/11) and ONE (0.00173, 11/11) trades also broke invalidation. SOXLB took nearly 2 days to officially invalidate, and I was overconfident holding onto a losing position instead of managing risk closely. There wasn’t enough buying pressure for Altcoin Longs. 😅 A mistake is a mistake—no beating around the bush.
Winning trades like SHORT SNXXB (3.40, 14/11), LONG DODO (0.02862, 13/11), LONG BARD (0.1325, 13/11), and SHORT PEPE (0.00000456, 12/11) all reached their targets pretty cleanly.
This week’s lesson is to ABSOLUTELY respect invalidation levels and avoid holding onto losing positions. Next time, I’ll pay more attention to volume breakout signals before entering Altcoin Longs, so I don’t get caught in weak sell-offs. 📒
Time for an honest review of those 6 painful losses 💀. The LONG Shell (0.03015, 14/11) and ERA (0.0932, 12/11) trades failed quickly after breaking their invalidation levels. Clearly, I entered too early and misread short-term momentum. The LONG SOXLB (64.44, 11/11) and ONE (0.00173, 11/11) trades also broke invalidation. SOXLB took nearly 2 days to officially invalidate, and I was overconfident holding onto a losing position instead of managing risk closely. There wasn’t enough buying pressure for Altcoin Longs. 😅 A mistake is a mistake—no beating around the bush.
Winning trades like SHORT SNXXB (3.40, 14/11), LONG DODO (0.02862, 13/11), LONG BARD (0.1325, 13/11), and SHORT PEPE (0.00000456, 12/11) all reached their targets pretty cleanly.
This week’s lesson is to ABSOLUTELY respect invalidation levels and avoid holding onto losing positions. Next time, I’ll pay more attention to volume breakout signals before entering Altcoin Longs, so I don’t get caught in weak sell-offs. 📒
267
·
--
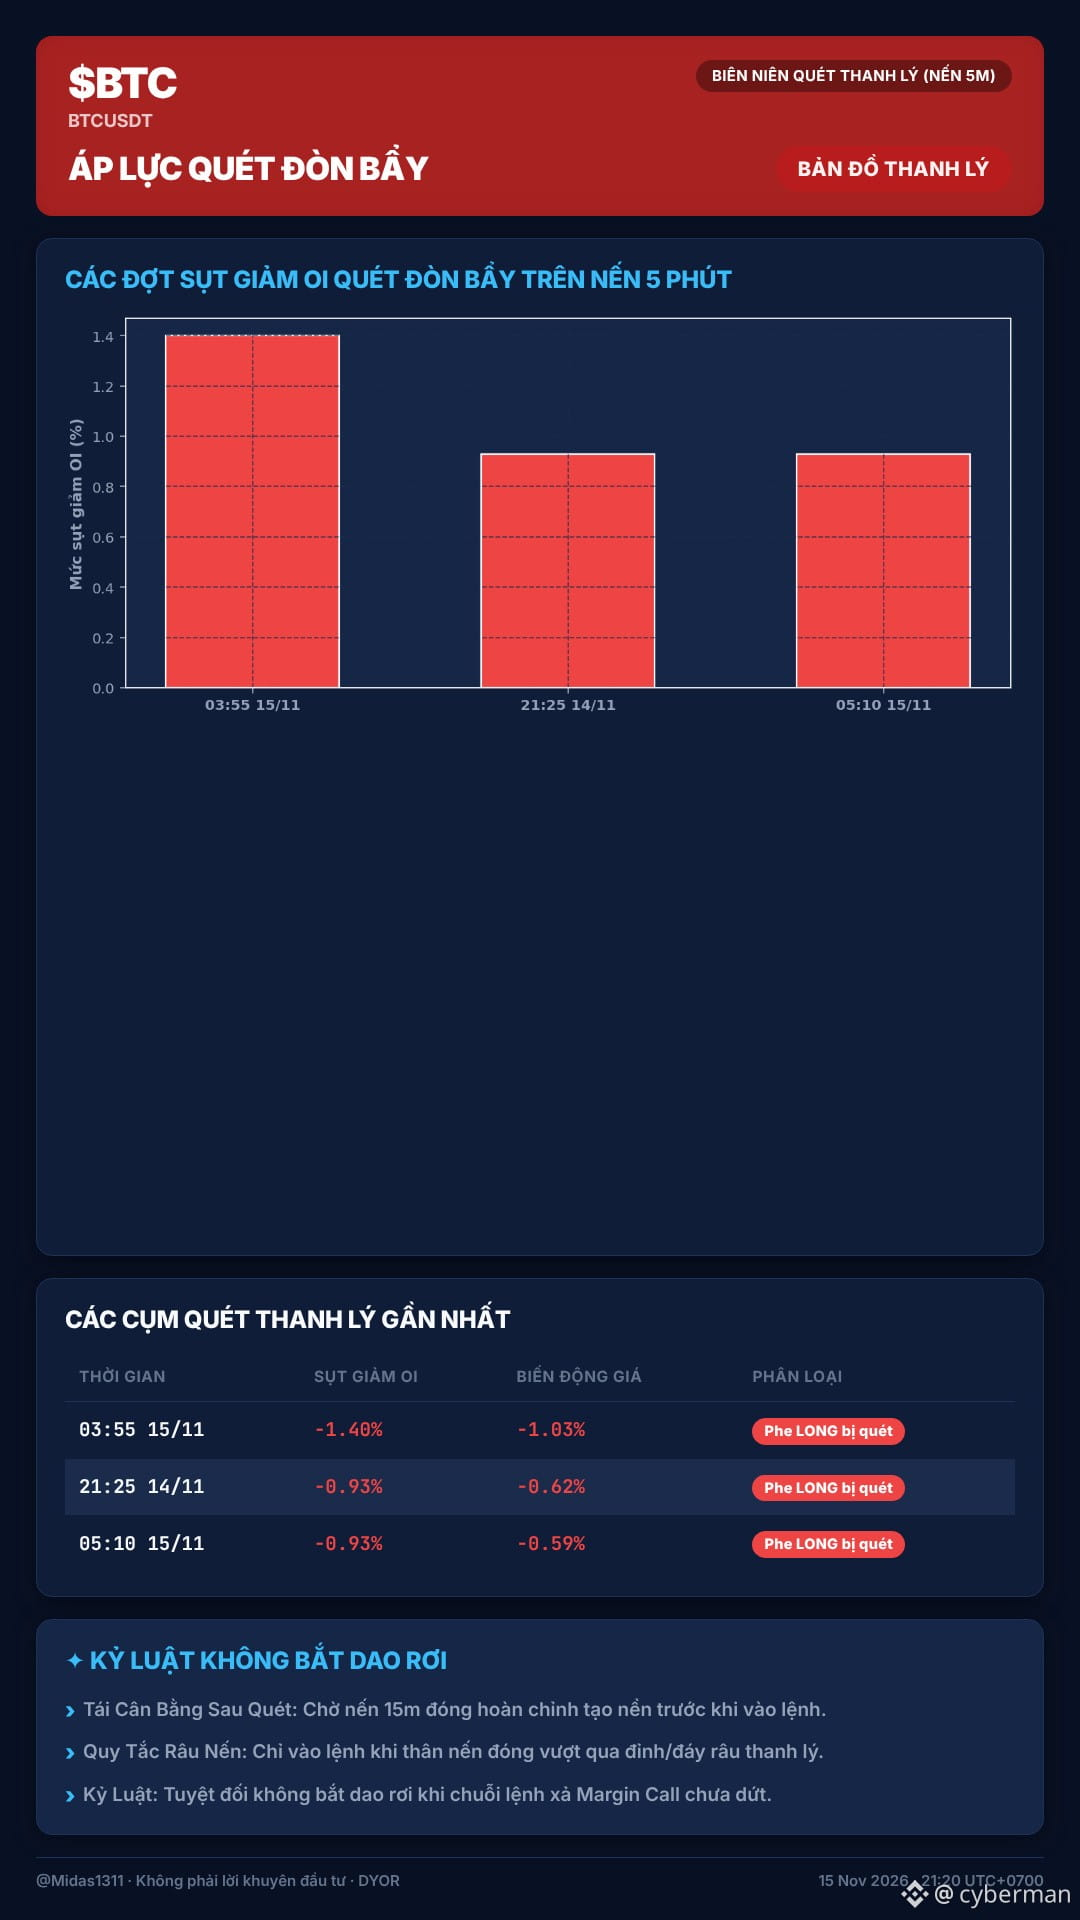
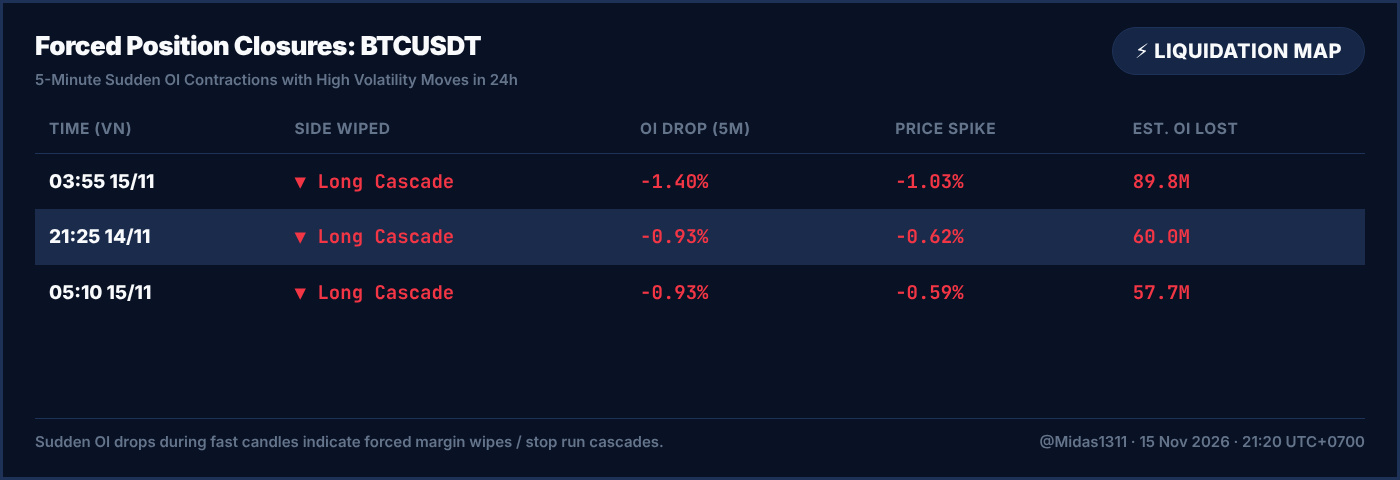
The market $BTC is calm, but the liquidation chart on Binance Futures is quite noisy. The biggest Long sweep in the past 24 hours happened at 03:55 on 15/11, causing OI to drop by -1.40% and price to plunge by -1.03%. 😐
Next, at 21:25 on 14/11, OI fell by -0.93% as price slipped by -0.62%—another Long wipeout. Most recently, at 05:10 on 15/11, OI continued to evaporate by -0.93% as price declined by -0.59%. Clearly, these three consecutive sweeps show that Long traders have repeatedly capitulated or been liquidated as prices continued to come under pressure. 🤓
With three powerful Long sweeps in a short period, a significant portion of leveraged liquidity on the buying side has been cleared out. This could ease immediate pressure, but it also points to new liquidity zones the market may target. 📐 If you’re holding leveraged positions, manage your risk carefully. Don’t let yourself become another number in the next OI statistics. 😏
Is the market $BTC ready for a clearer move, or will it keep searching for liquidity?
The market $BTC is calm, but the liquidation chart on Binance Futures is quite noisy. The biggest Long sweep in the past 24 hours happened at 03:55 on 15/11, causing OI to drop by -1.40% and price to plunge by -1.03%. 😐
Next, at 21:25 on 14/11, OI fell by -0.93% as price slipped by -0.62%—another Long wipeout. Most recently, at 05:10 on 15/11, OI continued to evaporate by -0.93% as price declined by -0.59%. Clearly, these three consecutive sweeps show that Long traders have repeatedly capitulated or been liquidated as prices continued to come under pressure. 🤓
With three powerful Long sweeps in a short period, a significant portion of leveraged liquidity on the buying side has been cleared out. This could ease immediate pressure, but it also points to new liquidity zones the market may target. 📐 If you’re holding leveraged positions, manage your risk carefully. Don’t let yourself become another number in the next OI statistics. 😏
Is the market $BTC ready for a clearer move, or will it keep searching for liquidity?
Next, at 21:25 on 14/11, OI fell by -0.93% as price slipped by -0.62%—another Long wipeout. Most recently, at 05:10 on 15/11, OI continued to evaporate by -0.93% as price declined by -0.59%. Clearly, these three consecutive sweeps show that Long traders have repeatedly capitulated or been liquidated as prices continued to come under pressure. 🤓
With three powerful Long sweeps in a short period, a significant portion of leveraged liquidity on the buying side has been cleared out. This could ease immediate pressure, but it also points to new liquidity zones the market may target. 📐 If you’re holding leveraged positions, manage your risk carefully. Don’t let yourself become another number in the next OI statistics. 😏
Is the market $BTC ready for a clearer move, or will it keep searching for liquidity?
38
·
--
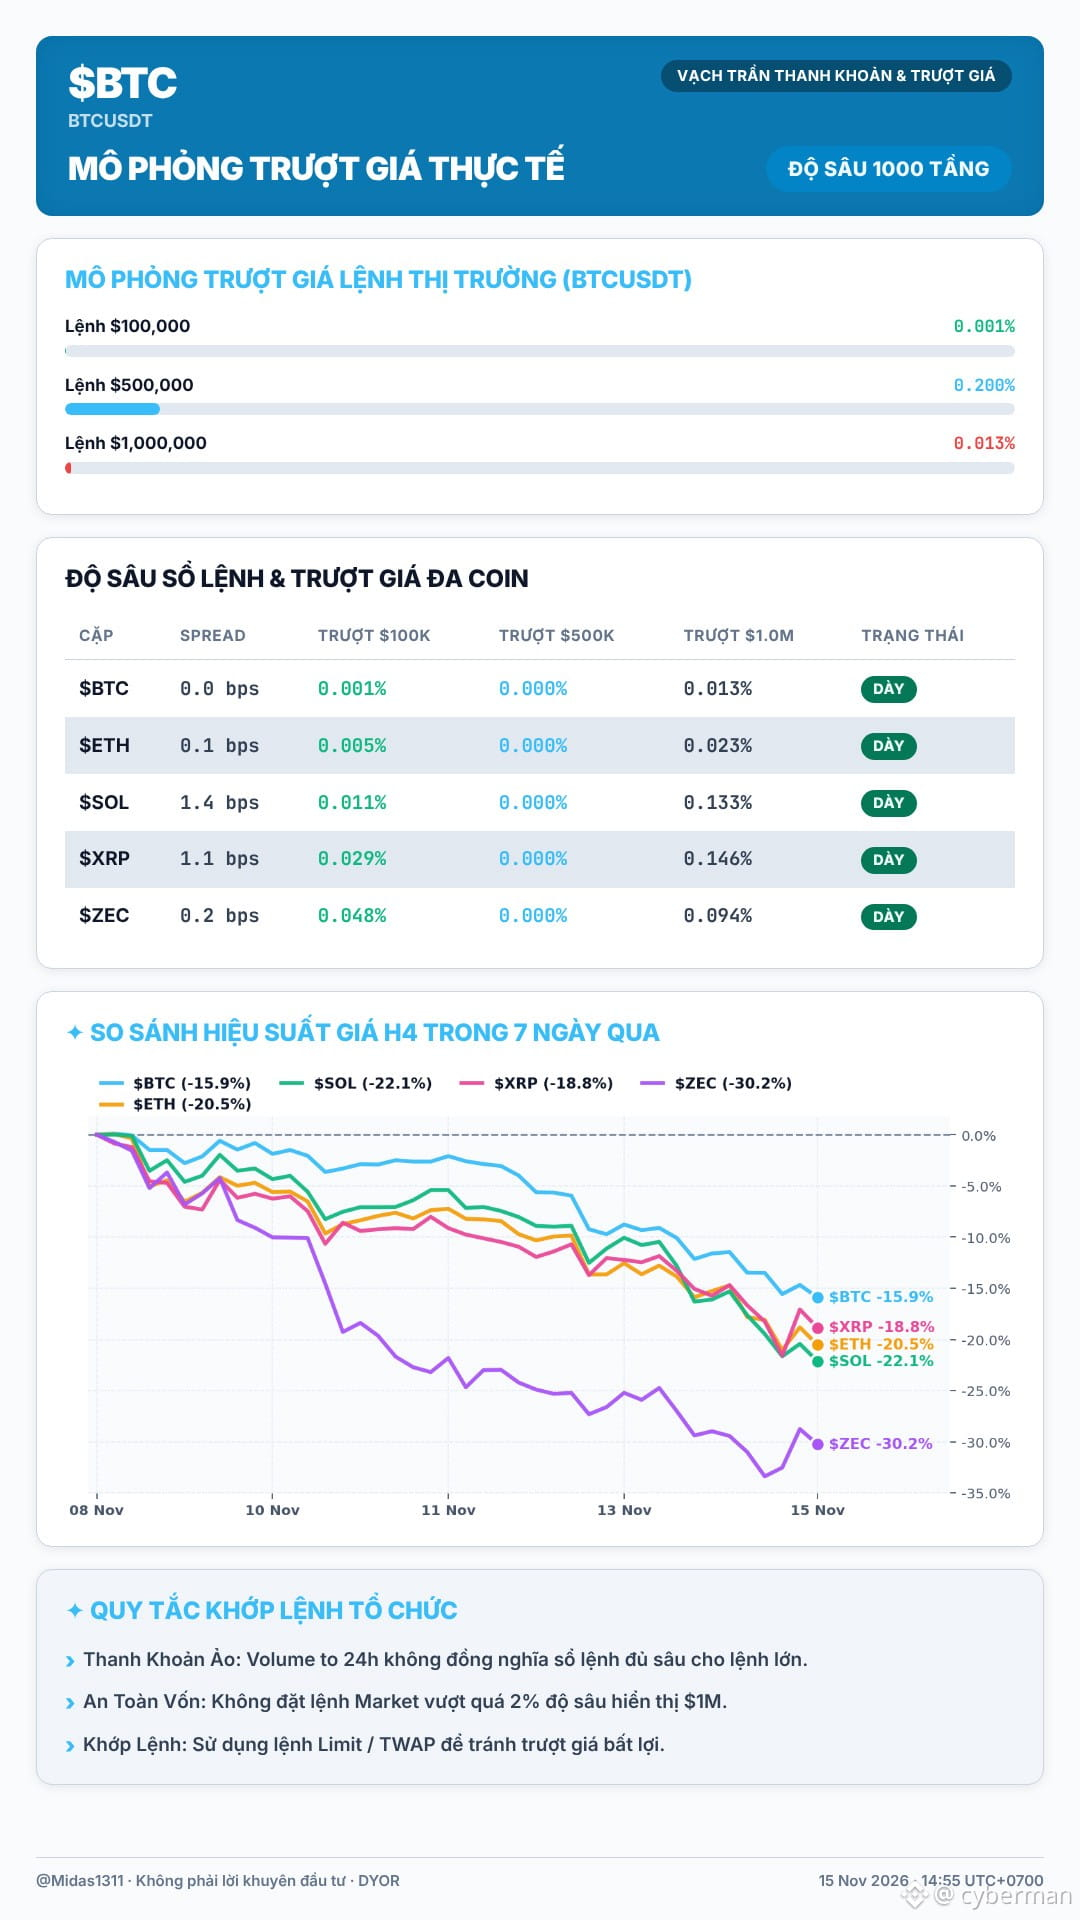
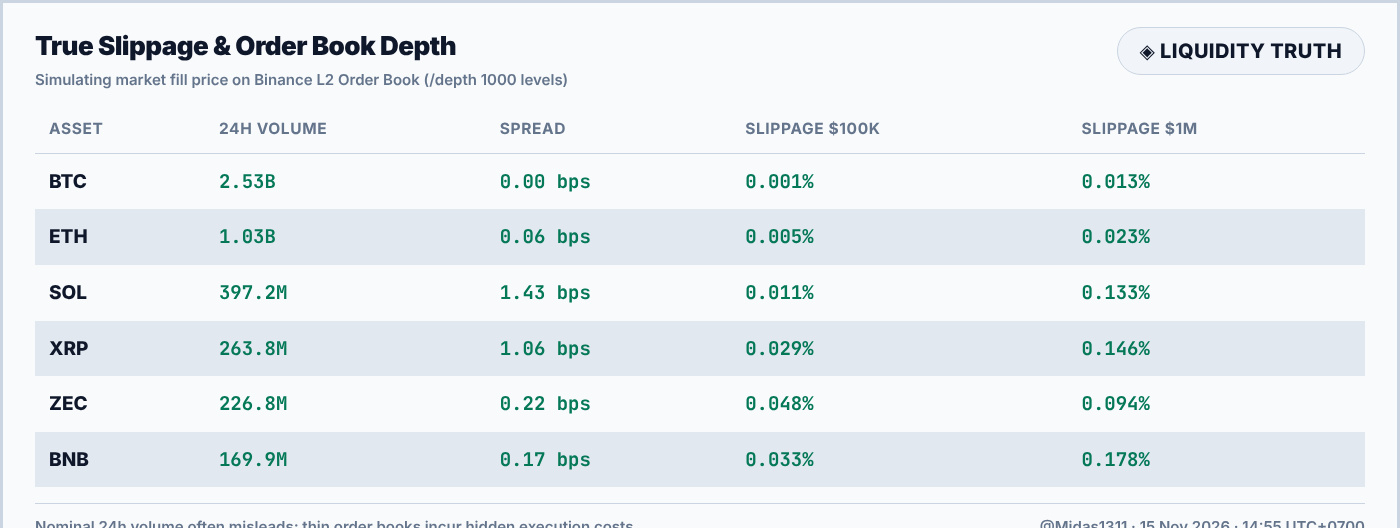
The crypto market is showing signs of weakening overall liquidity. Although many altcoins still have 24-hour volumes of several hundred million dollars, their actual order books are surprisingly thin. 😐 $BTC With a volume of over $2.5 billion, a $1 million order causes just 0.013% slippage. But look at Solana (SOL), with a volume of nearly $400 million: a $1 million order causes as much as 0.133% slippage. XRP, with a volume of $263 million, has 0.146% slippage on a $1 million order. On Zcash (ZEC), even a $100,000 order causes 0.048% slippage—not to mention that a $1 million order eats through 0.094% of the order book. Clearly, 24-hour volume is a figure from the past. Your ability to enter and exit trades depends on the depth of the order book right now. Hidden costs from spreads (like SOL's 1.43 bps) and slippage are what drain your account fastest. 🤓 Check the funding rate before reading the news, then place your trades. To protect your capital, always check the order book and prioritize Limit orders over Market orders. Placing Market orders on altcoins with "fake" volume is just setting yourself up to get rekt. 📐 $BTC is holding up relatively well compared with the rest. What levels are you watching to load up?
The crypto market is showing signs of weakening overall liquidity. Although many altcoins still have 24-hour volumes of several hundred million dollars, their actual order books are surprisingly thin. 😐 $BTC With a volume of over $2.5 billion, a $1 million order causes just 0.013% slippage. But look at Solana (SOL), with a volume of nearly $400 million: a $1 million order causes as much as 0.133% slippage. XRP, with a volume of $263 million, has 0.146% slippage on a $1 million order. On Zcash (ZEC), even a $100,000 order causes 0.048% slippage—not to mention that a $1 million order eats through 0.094% of the order book. Clearly, 24-hour volume is a figure from the past. Your ability to enter and exit trades depends on the depth of the order book right now. Hidden costs from spreads (like SOL's 1.43 bps) and slippage are what drain your account fastest. 🤓 Check the funding rate before reading the news, then place your trades. To protect your capital, always check the order book and prioritize Limit orders over Market orders. Placing Market orders on altcoins with "fake" volume is just setting yourself up to get rekt. 📐 $BTC is holding up relatively well compared with the rest. What levels are you watching to load up?
53
Log in to explore more content
Join global crypto users on Binance Square
⚡️ Get latest and useful information about crypto.
💬 Trusted by the world’s largest crypto exchange.
👍 Discover real insights from verified creators.
Email / Phone number
Trending Topics
NvidiaBeatsEstimatesWith$130BQ4Outlook
16,372 views
192 Discussing
Nvidia Beats With $115.8 Billion in Revenue, Guides to $130 Billion and Adds $150 Billion Buyback
Binance News
·49 Likes
·42.7k views
AnthropicIPOPriceCouldExceed$80
20,922 views
166 Discussing
CanNvidia’sDataCenterGrowthContinue?
63,849 views
825 Discussing