
0xSawa
360 Posts
 LIVE
LIVE0xSawa
交易结构而非价格|X: @0xsawa|💰手续费8折邀请码:SAWA888
11 Following
1.0K+ Followers
741 Liked
Posts
All
Quotes
Videos
Live
PINNED
Valuable advice:
In a bear market, absolutely absolutely absolutely do not leverage to buy the dip, only trade spot and diversify your holdings.
Short yourself, overcome human nature.
In a bear market, absolutely absolutely absolutely do not leverage to buy the dip, only trade spot and diversify your holdings.
Short yourself, overcome human nature.
9.7 #BTC market analysis
The video is paused for one day because today the U.S. stock market is closed, and the low-volatility continuation continues into the weekend
BTC 79,500 - 80,200 consolidates in a tight range at the high end, squeezing between resistance 82,500 and support 76,000-78,000
ETH is relatively strong; resistance is 2,500, support is 2,340-2,400
After a rebound, gold is capped by resistance from the trendline; resistance is 4,450, support is 4,250-4,300
The video is paused for one day because today the U.S. stock market is closed, and the low-volatility continuation continues into the weekend
BTC 79,500 - 80,200 consolidates in a tight range at the high end, squeezing between resistance 82,500 and support 76,000-78,000
ETH is relatively strong; resistance is 2,500, support is 2,340-2,400
After a rebound, gold is capped by resistance from the trendline; resistance is 4,450, support is 4,250-4,300
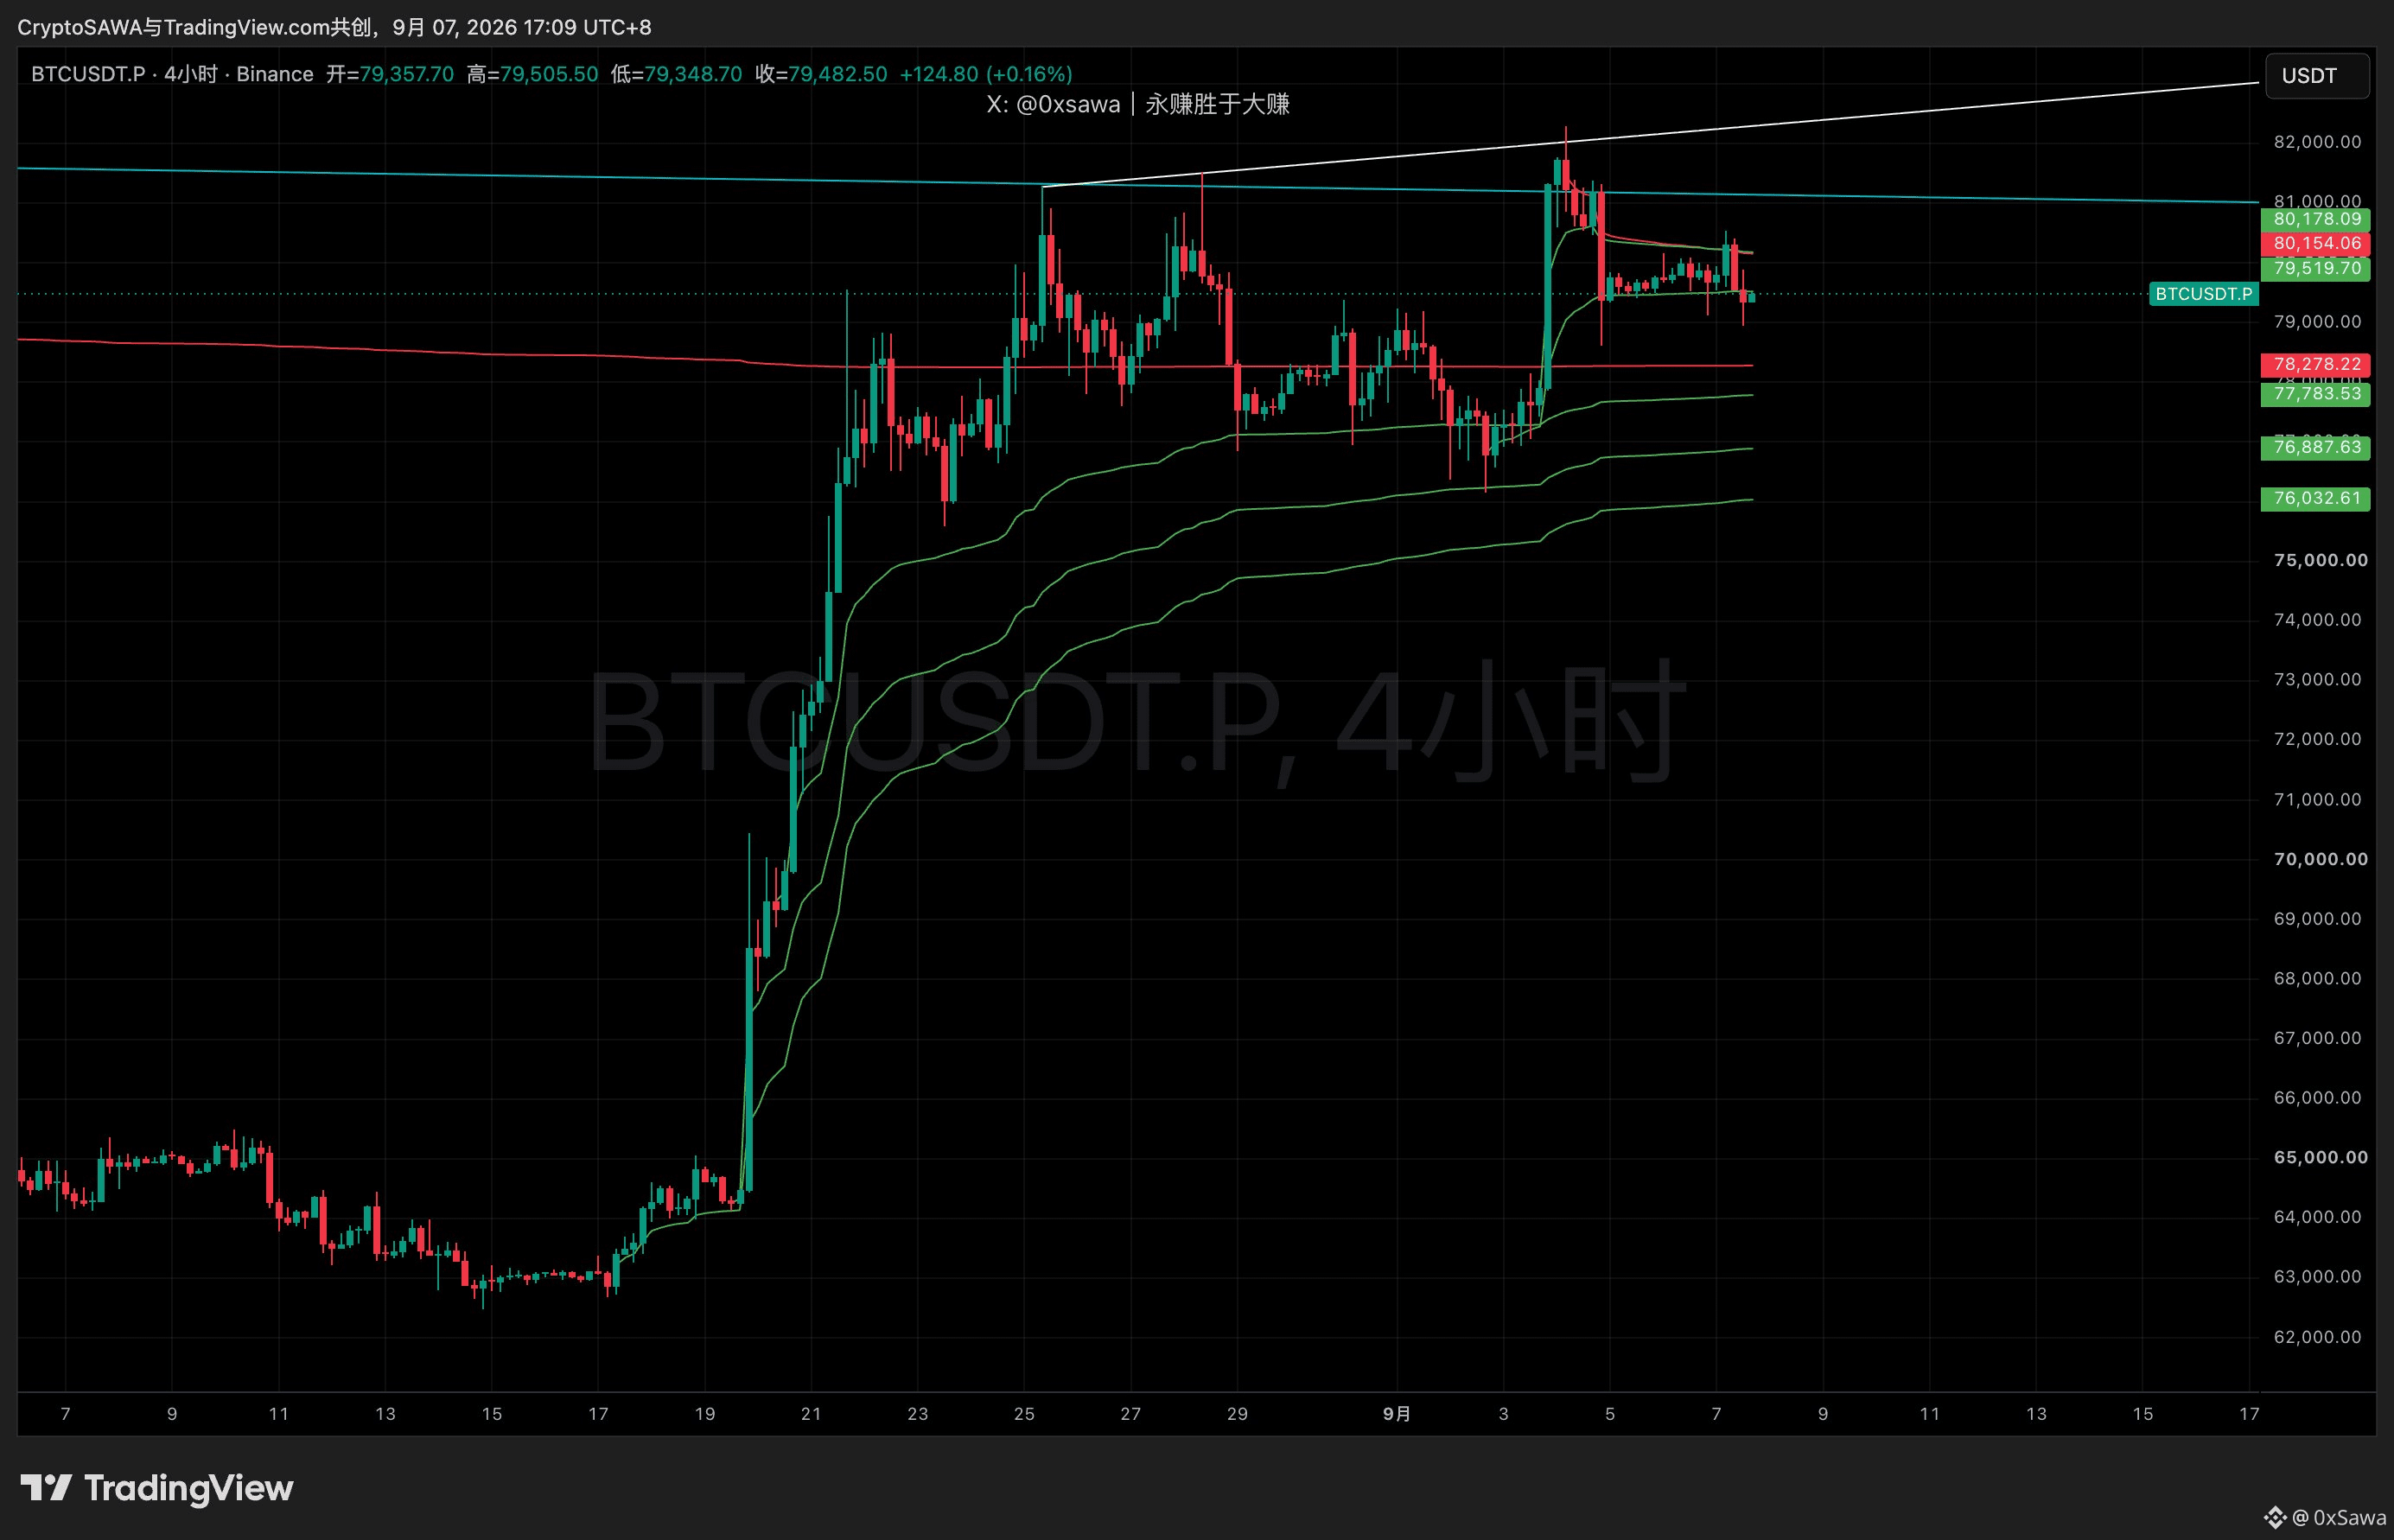
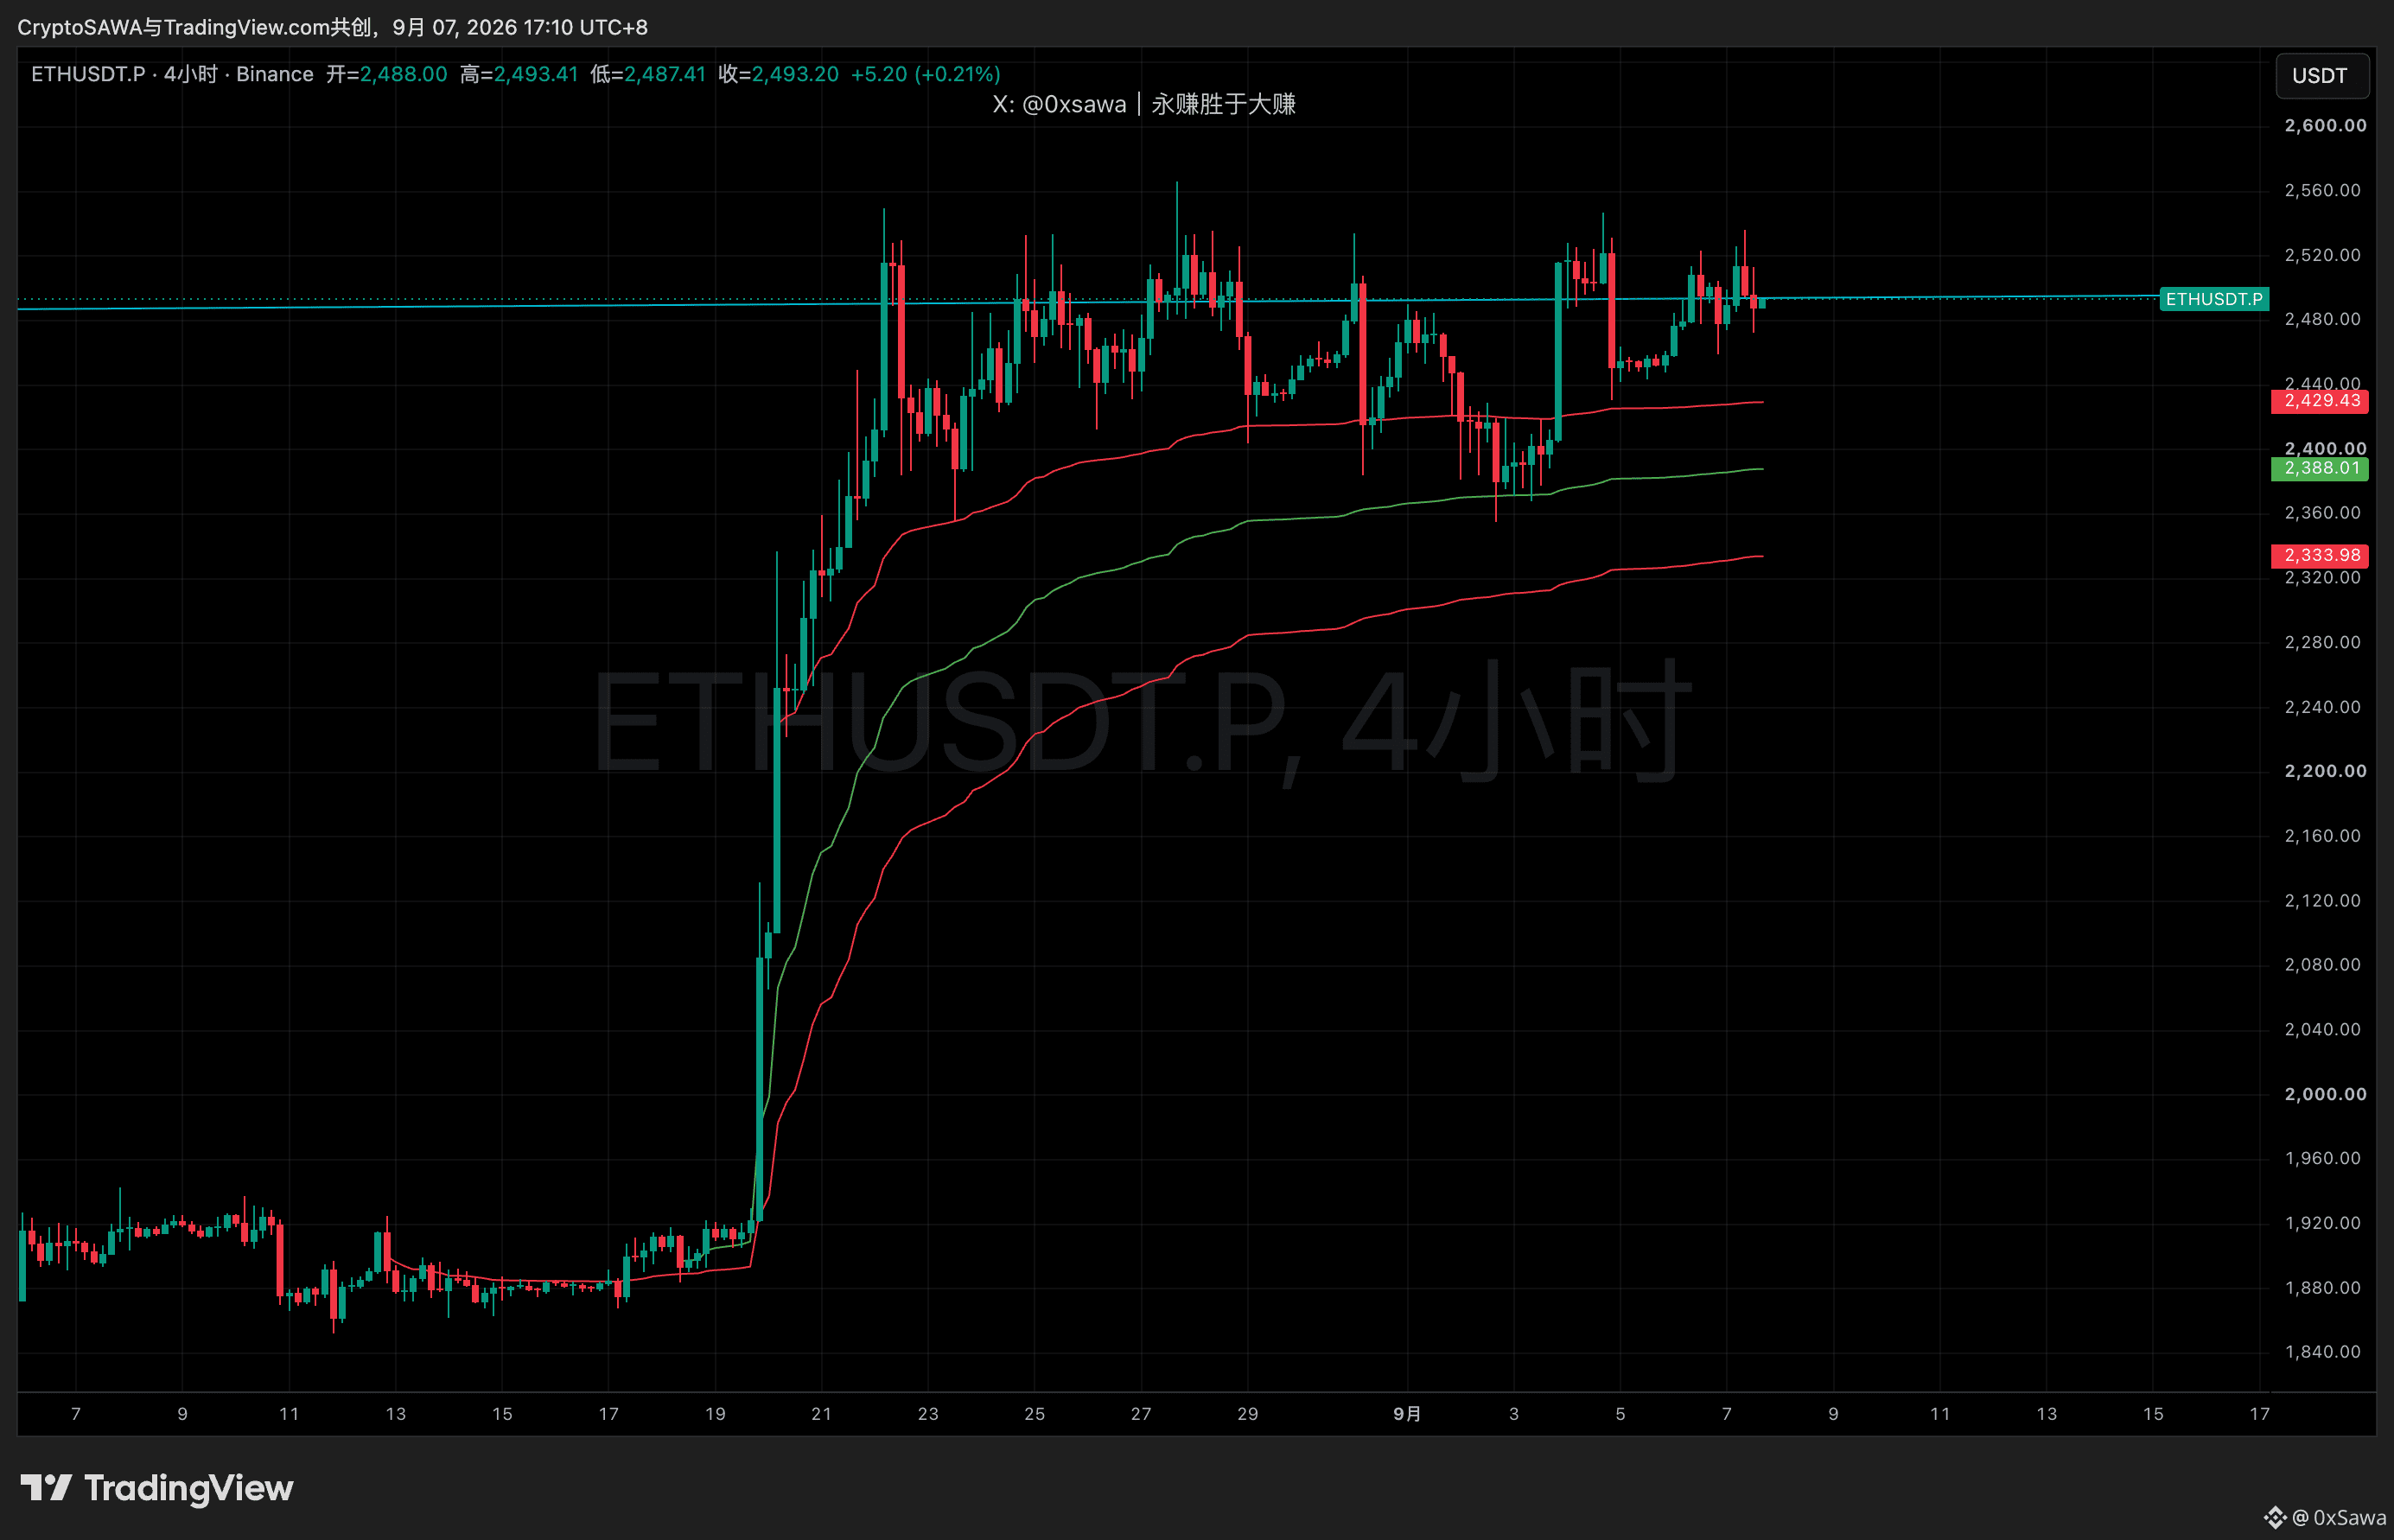
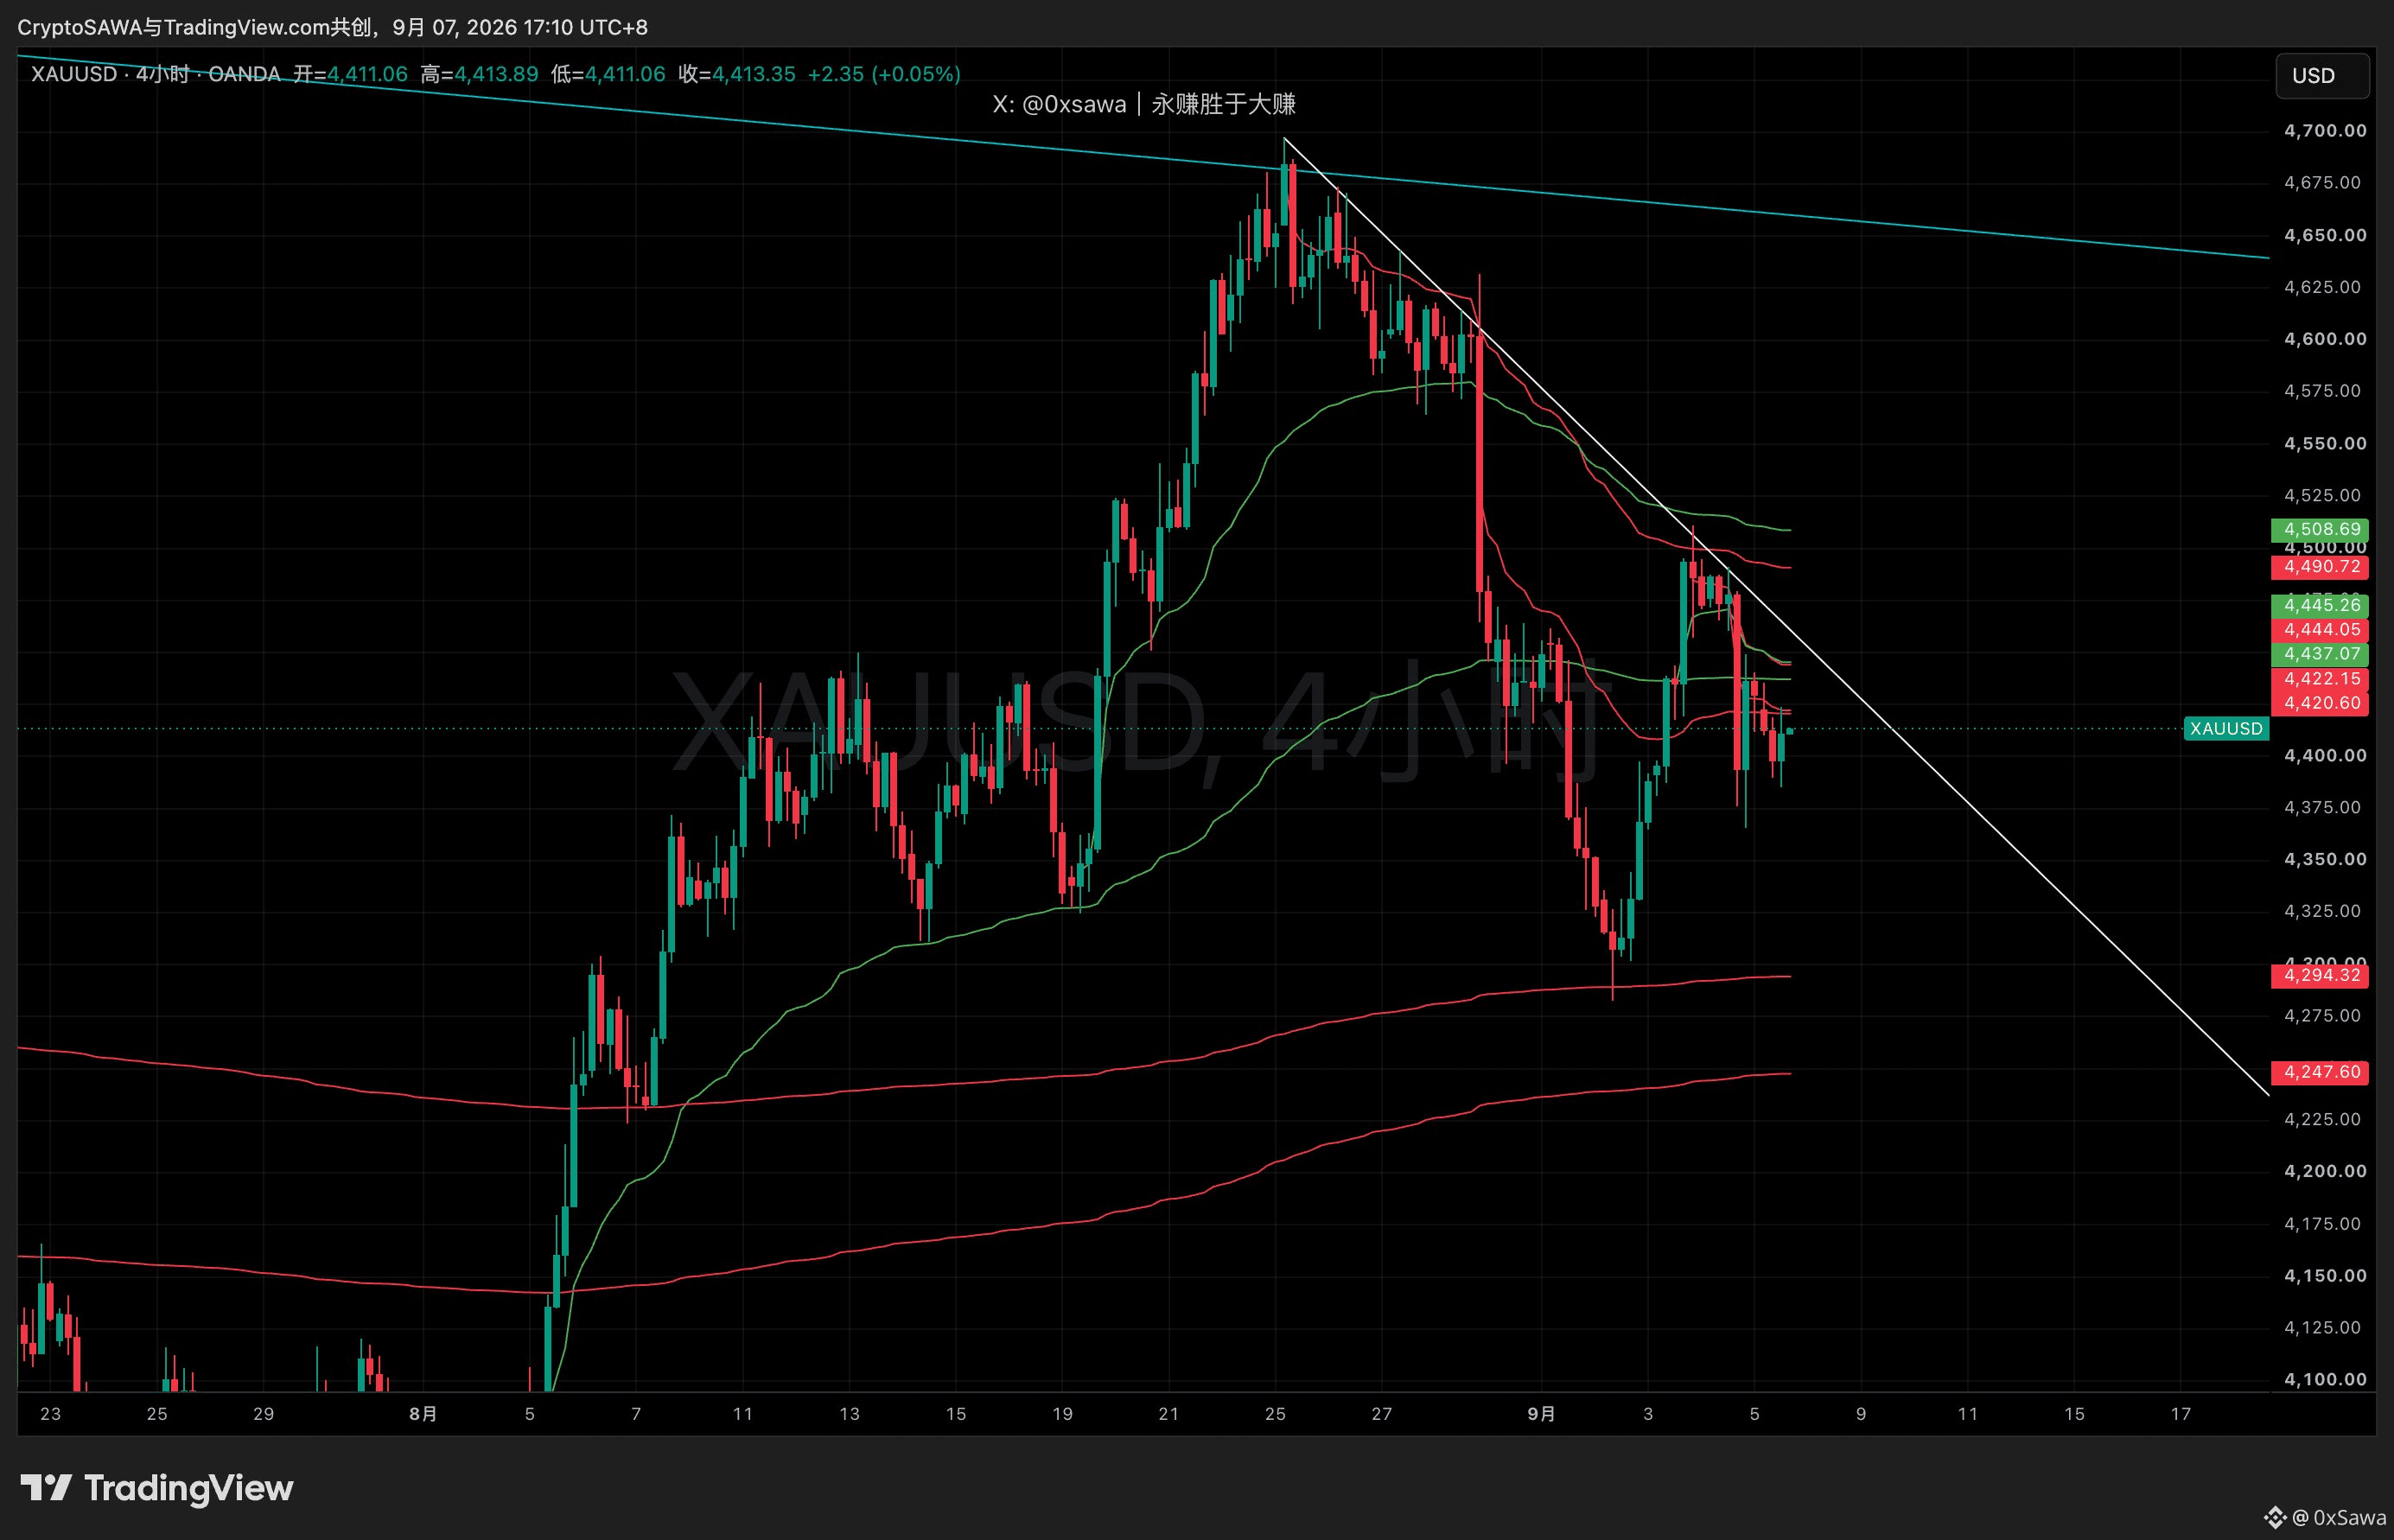

I’m just some stinky little doodler, and I’ve heard plenty of comments like “just draw a few lines and say whether it’s going to rise or fall.”
Technical analysis doesn’t predict the future, and it can’t predict the future either. But it can give probability distributions for different scenarios, along with preparation for different 대응 strategies.
Traders rarely speak in absolutes. If they tell you it’ll definitely go up or definitely go down—tomorrow after 1,000,000 it’ll be zero—it’s just nonsense, like a human-shaped bearish divergence… a big idiot with a pen.
It might go up, might go down, or might just trade sideways—this isn’t empty talk. But you need to add one more thing: if a, then I’ll do b; if !a, then I’ll do c.
For beginners, the biggest obsession is to find the so-called Holy Grail: some indicator or strategy.
Little do they realize most indicators are based on calculations derived from candlestick open-high-close-low data—just different mathematical expressions.
As for strategies, they also always end up failing at some point. For example, earlier this year when BTC crashed hard, the RSI was extremely oversold. A bullish divergence showed, but then more divergences kept happening—yet when you tried to catch the bottom, you got wiped out.
There is only one Holy Grail in trading:
🫡 Always be in awe, and always keep iterating.
Technical analysis doesn’t predict the future, and it can’t predict the future either. But it can give probability distributions for different scenarios, along with preparation for different 대응 strategies.
Traders rarely speak in absolutes. If they tell you it’ll definitely go up or definitely go down—tomorrow after 1,000,000 it’ll be zero—it’s just nonsense, like a human-shaped bearish divergence… a big idiot with a pen.
It might go up, might go down, or might just trade sideways—this isn’t empty talk. But you need to add one more thing: if a, then I’ll do b; if !a, then I’ll do c.
For beginners, the biggest obsession is to find the so-called Holy Grail: some indicator or strategy.
Little do they realize most indicators are based on calculations derived from candlestick open-high-close-low data—just different mathematical expressions.
As for strategies, they also always end up failing at some point. For example, earlier this year when BTC crashed hard, the RSI was extremely oversold. A bullish divergence showed, but then more divergences kept happening—yet when you tried to catch the bottom, you got wiped out.
There is only one Holy Grail in trading:
🫡 Always be in awe, and always keep iterating.

Although I don’t understand why this fellow Waller can step out and walk a couple of steps and somehow get such a big positive effect—maybe it’s because he’s of the same family as Wosh?
With the current crude oil trend, it’s a bit suspicious that CPI can come down.
But the candlesticks are honest: I chased the long position urgently yesterday and got filled to the maximum. Tonight is the Non-Farm Payrolls—keep observing price action. If 81.5k can’t be reclaimed, then it will form a daily bearish divergence at the top.
With the current crude oil trend, it’s a bit suspicious that CPI can come down.
But the candlesticks are honest: I chased the long position urgently yesterday and got filled to the maximum. Tonight is the Non-Farm Payrolls—keep observing price action. If 81.5k can’t be reclaimed, then it will form a daily bearish divergence at the top.
0xSawa
·
--
Extreme intraday trading—during ranging markets you can trade both long and short. Not bulls, not bears… just slick traders 🤪
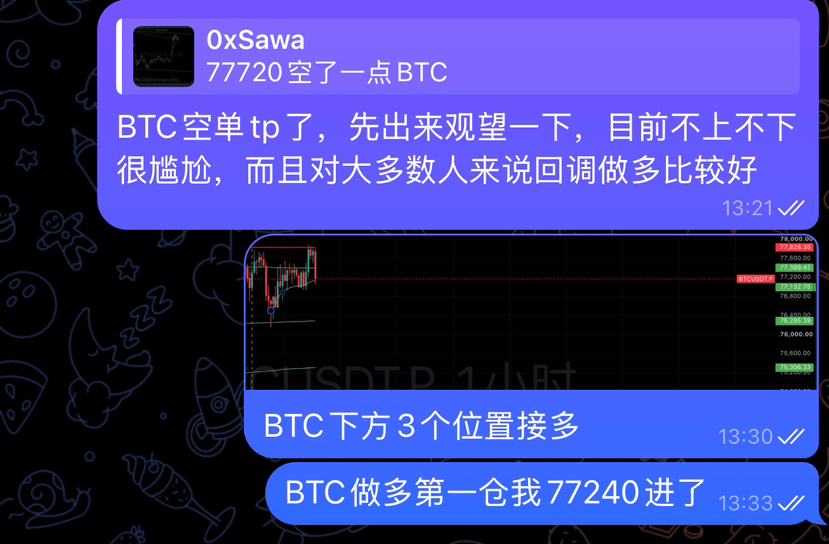
Extreme intraday trading—during ranging markets you can trade both long and short. Not bulls, not bears… just slick traders 🤪
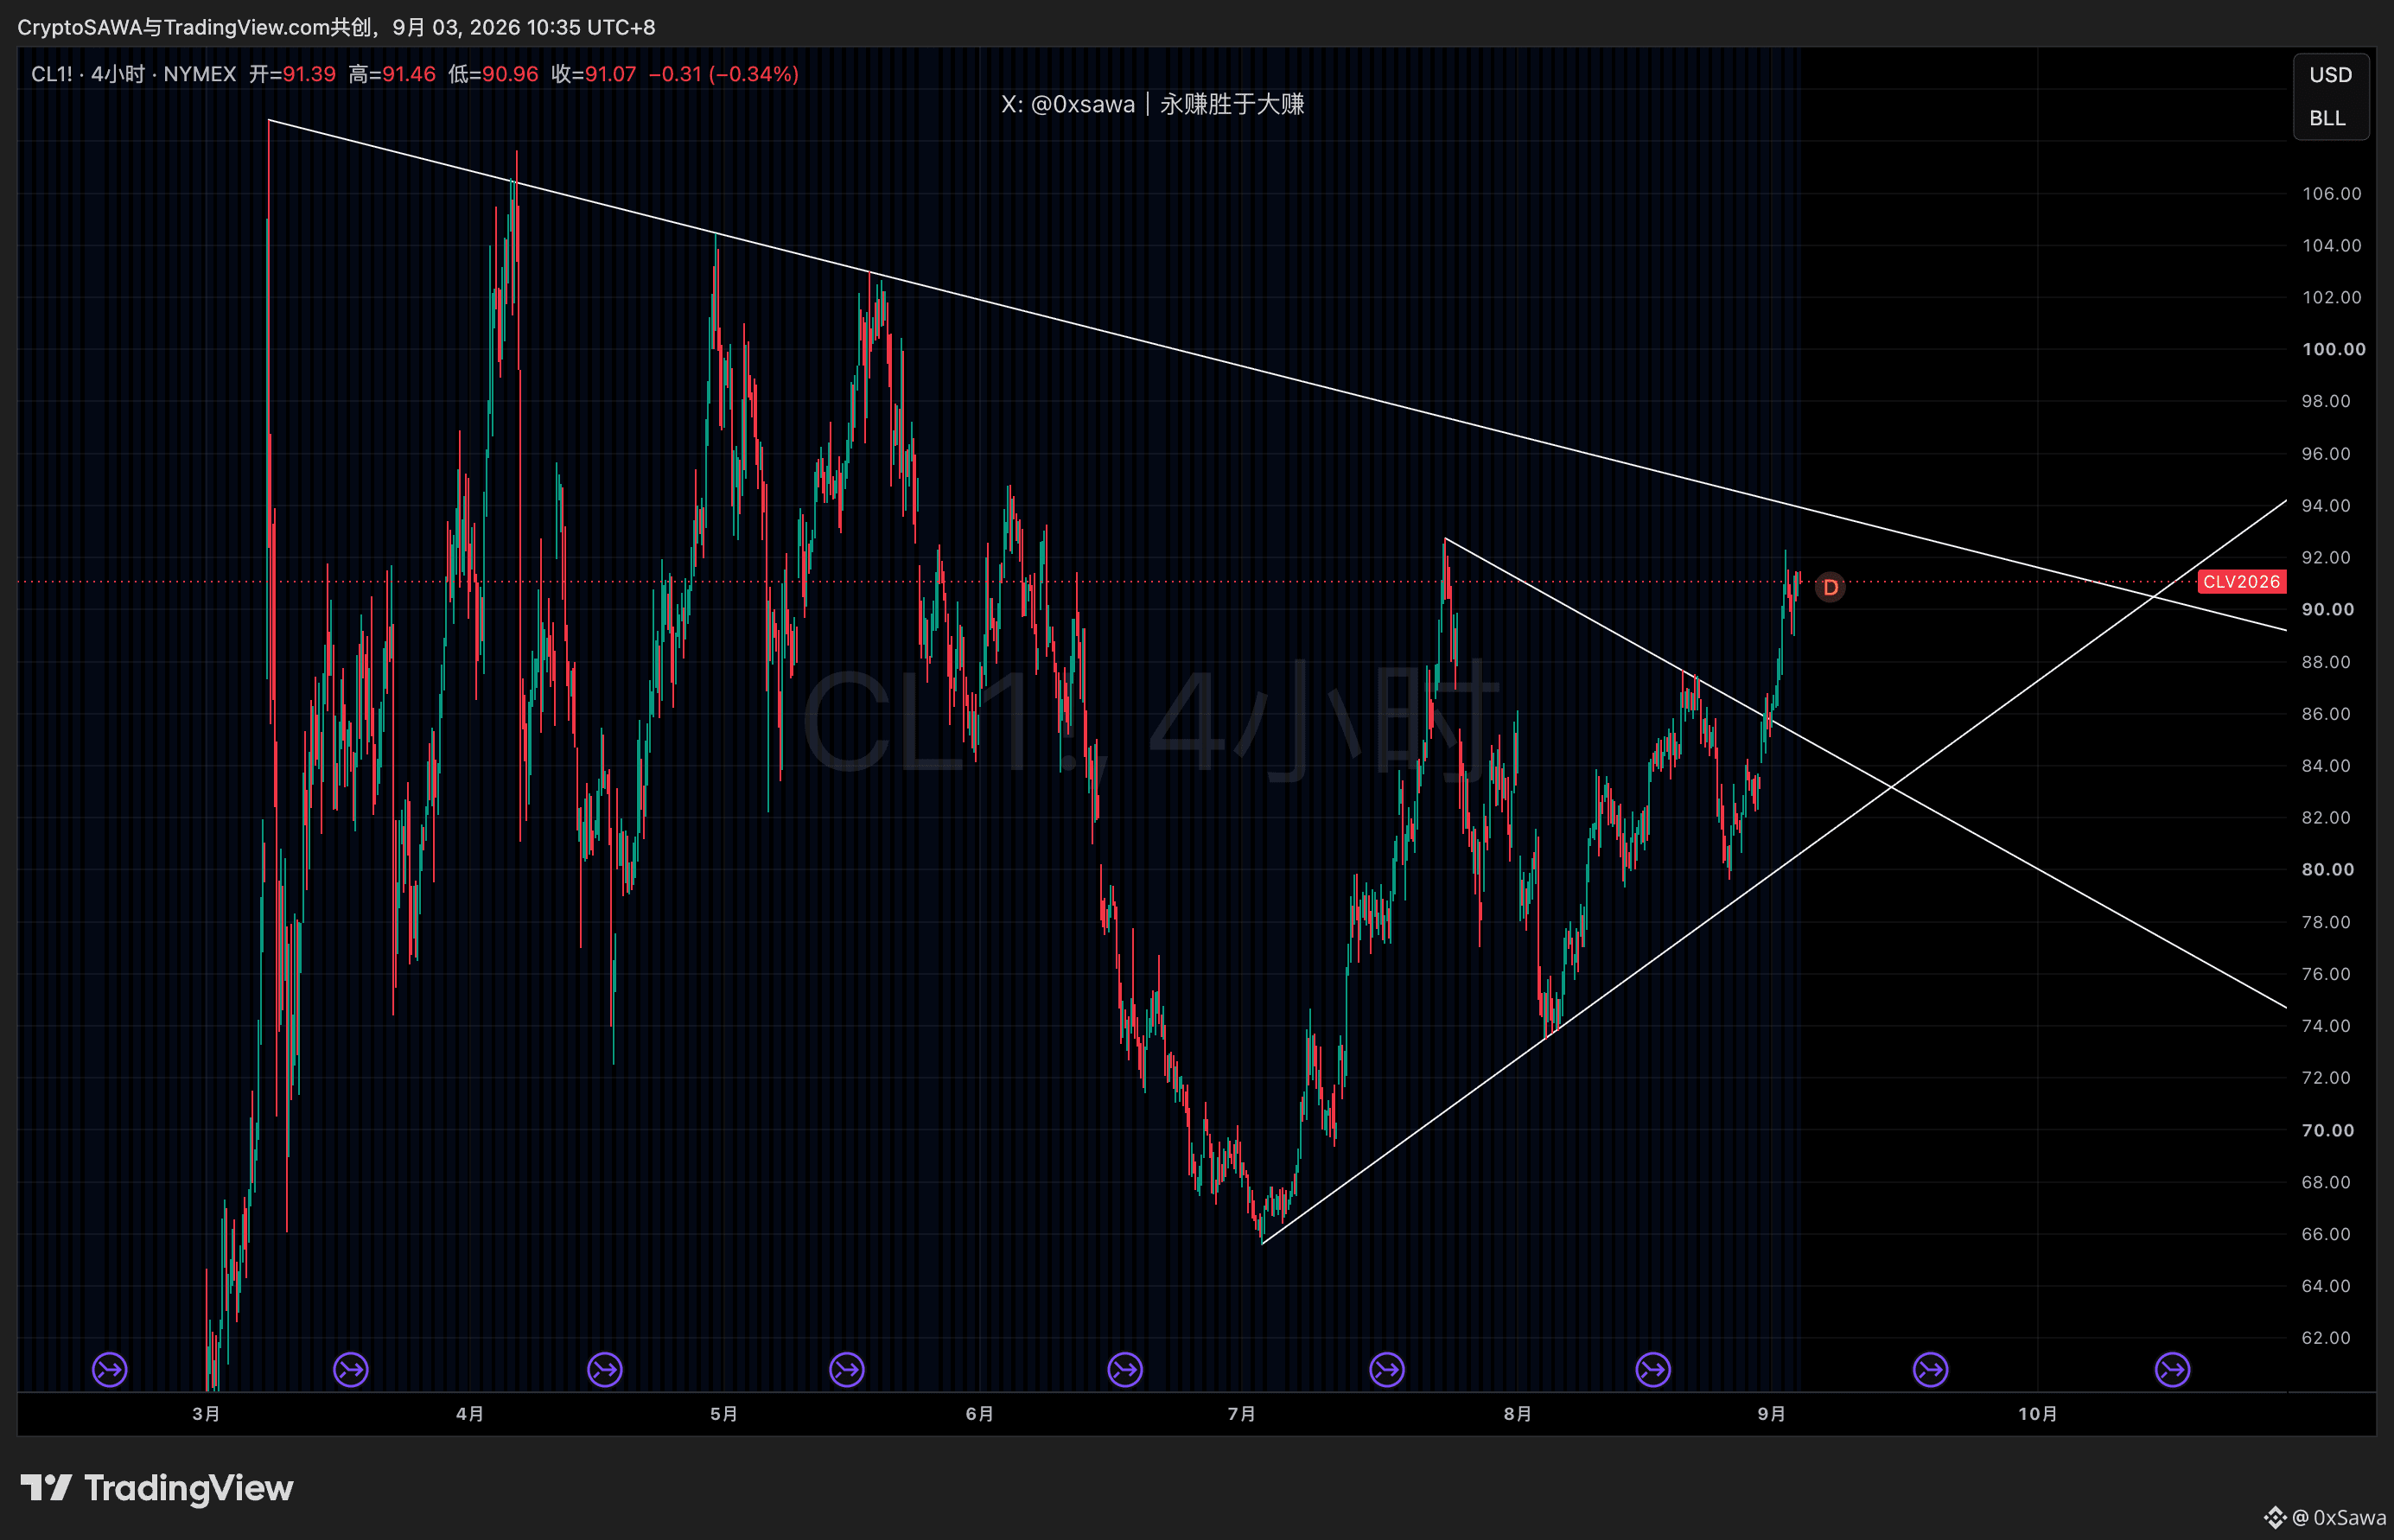
Crude oil strongly breaks out and converges within a triangle; above, there is still a trendline acting as resistance
At halftime, the breakout is only a matter of time. Just wait for crude oil to squeeze the shorts—worldwide
At halftime, the breakout is only a matter of time. Just wait for crude oil to squeeze the shorts—worldwide
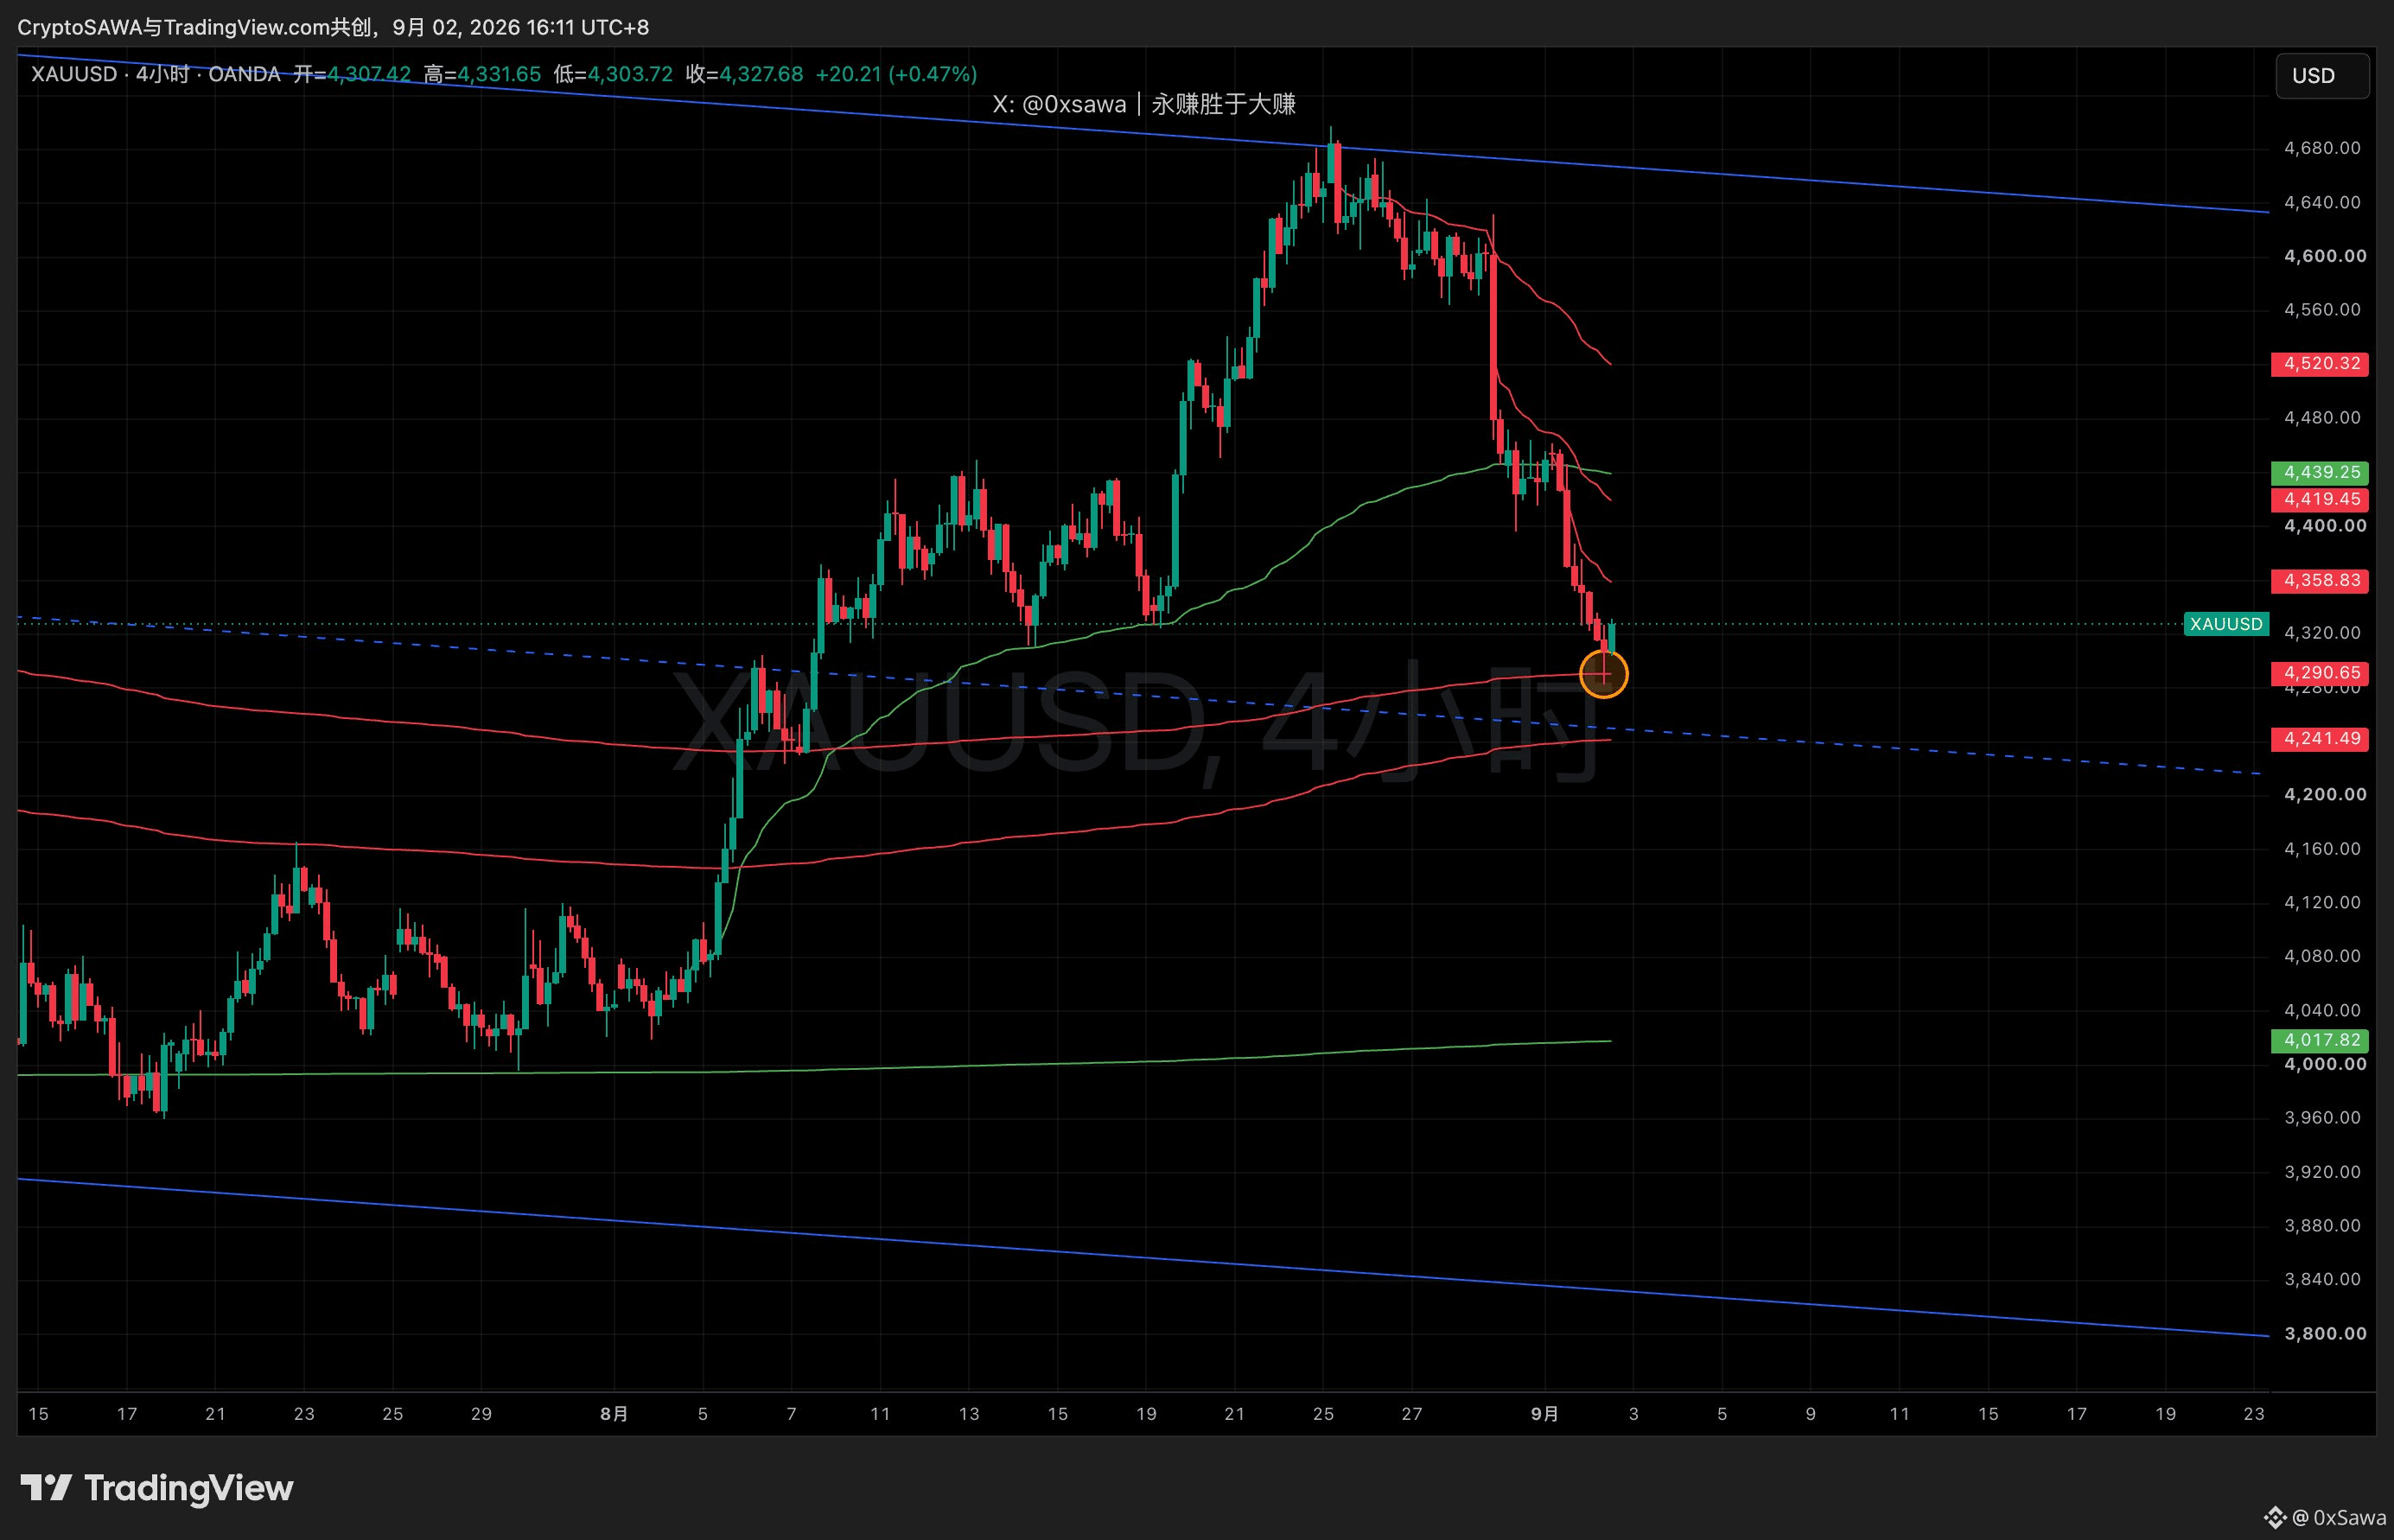
Indicator Teaching: How to Use VWAP to Identify Support and Resistance
VWAP (Volume Weighted Average Price), calculated from the starting breakout point, is the average cost of the bulls over this move.
If the price hasn’t been pushed through (smashed) and pullbacks don’t break it, it means the bulls are still pushing. If it gets pushed through and the rebound can’t hold, then support turns into resistance.
No matter what indicator you use, trading is about finding support and resistance: short at resistance, and go long at support.
For practical teaching, here’s an example of finding resistance and shorting on the 15-minute gold timeframe.
VWAP is a living fit that you need to practice a lot.
VWAP (Volume Weighted Average Price), calculated from the starting breakout point, is the average cost of the bulls over this move.
If the price hasn’t been pushed through (smashed) and pullbacks don’t break it, it means the bulls are still pushing. If it gets pushed through and the rebound can’t hold, then support turns into resistance.
No matter what indicator you use, trading is about finding support and resistance: short at resistance, and go long at support.
For practical teaching, here’s an example of finding resistance and shorting on the 15-minute gold timeframe.
VWAP is a living fit that you need to practice a lot.
# Technical Analysis of Gold Is Very Pure
The authoritative VWAP remains authoritative. My short position’s TP has been hit, and I’ve completely switched to a bearish mindset—selling short on rallies.
The authoritative VWAP remains authoritative. My short position’s TP has been hit, and I’ve completely switched to a bearish mindset—selling short on rallies.
Live trading clips: if the liquidation price is very low, does that mean it’s safe? Should you stop-loss or not?
Many people don’t set a stop-loss, saying that this trade won’t liquidate, or that the liquidation price is very low.
A low liquidation price doesn’t mean it’s safe.
If it breaks through a key support level and you still keep holding, there will always be a time when you can’t hold the position.
If you’re afraid it will rally back, then wait until it confirms a false breakdown before you re-enter.
What we want to do is minimize losses as much as possible.
Many people don’t set a stop-loss, saying that this trade won’t liquidate, or that the liquidation price is very low.
A low liquidation price doesn’t mean it’s safe.
If it breaks through a key support level and you still keep holding, there will always be a time when you can’t hold the position.
If you’re afraid it will rally back, then wait until it confirms a false breakdown before you re-enter.
What we want to do is minimize losses as much as possible.
9.1 BTC Downward Channel: 79,000 Locks Every Bounce|Gold 4450: Two VWAPs in Convergence You Can’t Get Through
【BTC】
It’s moving in a downward channel; every rebound high has been locked down by the 79,000 red VWAP.
Buy in two lots from 75,000 to 76,000, and take profit when the bounce reaches the upper edge of the channel.
【ETH】
The bull flag inside the blue channel—today’s two rebounds were both capped by the upper edge.
Place buys across three VWAP levels at 2427, 2371, and 2303, with allocation ratio 1:1:2.
High volatility—don’t put too much size on. If price breaks down through 2303, cut losses.
【Gold】
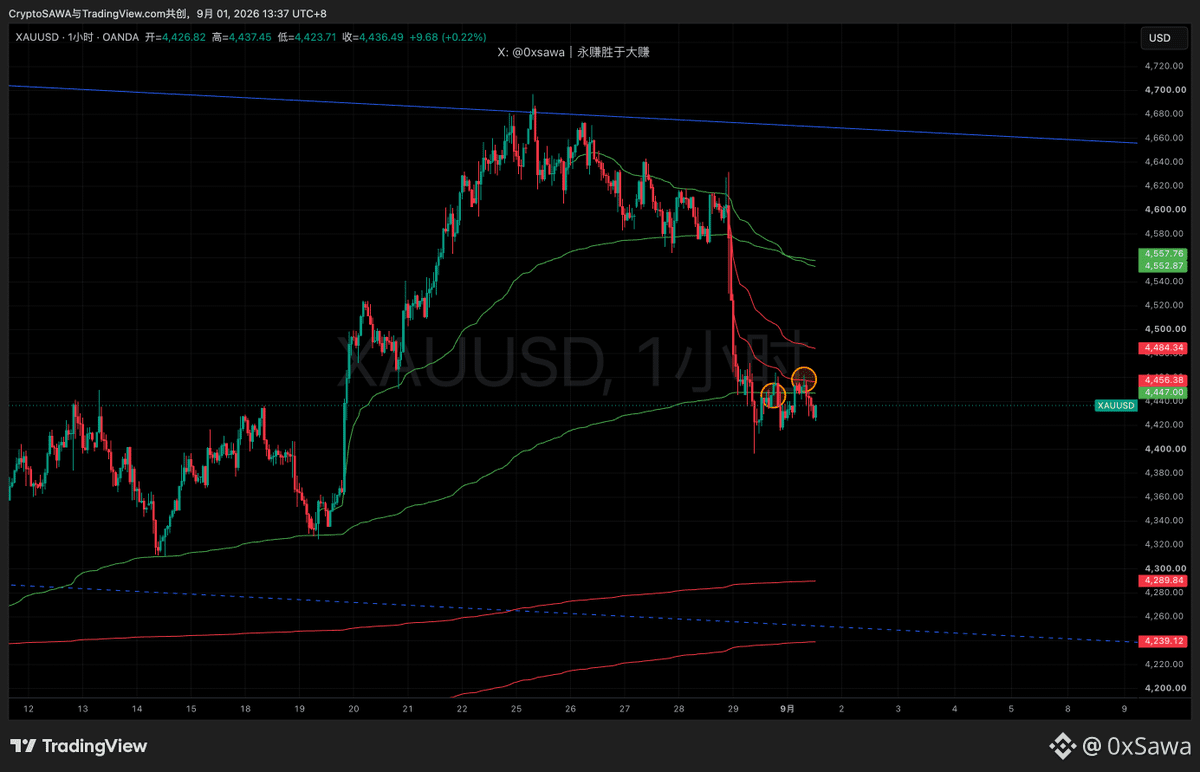
At 4450, there are two VWAPs converging. The pullback can’t break higher—during yesterday’s live stream, I sold short there in batches.
On yesterday’s live stream, we followed the bearish plan and shorted; half the position has already been taken profit on, and the rest is pushed to break-even.
Take profit shorts below at 4290 and 4253, or flip to long to bet on one more rebound.
【BTC】
It’s moving in a downward channel; every rebound high has been locked down by the 79,000 red VWAP.
Buy in two lots from 75,000 to 76,000, and take profit when the bounce reaches the upper edge of the channel.
【ETH】
The bull flag inside the blue channel—today’s two rebounds were both capped by the upper edge.
Place buys across three VWAP levels at 2427, 2371, and 2303, with allocation ratio 1:1:2.
High volatility—don’t put too much size on. If price breaks down through 2303, cut losses.
【Gold】
At 4450, there are two VWAPs converging. The pullback can’t break higher—during yesterday’s live stream, I sold short there in batches.
On yesterday’s live stream, we followed the bearish plan and shorted; half the position has already been taken profit on, and the rest is pushed to break-even.
Take profit shorts below at 4290 and 4253, or flip to long to bet on one more rebound.
Last night’s live stream clearly showed a bearish view on gold, and today it has been confirmed again. At the key level, cut the long position—if you need to flip, you flip!
Partly True
September key events overview
9/4 US Non-Farm Payrolls
9/11 US CPI
9/17 FOMC interest rate decision
9/18 BOJ interest rate decision
9/4 US Non-Farm Payrolls
9/11 US CPI
9/17 FOMC interest rate decision
9/18 BOJ interest rate decision

Log in to explore more content