

CryptoLoverArtist
828 Posts

CryptoLoverArtist
Report
Block User
I have been in crypto since 2016, on Binance since 2021. I love cryptocurrencies. I'm also an artist and a designer. Trading is my first love! BTC is Love
Open Trade

BNB Holder
Occasional Trader
8.6 Years
617 Following
696 Followers
1.1K+ Liked
Posts
Portfolio
All
Quotes
Videos
·
--
Bearish
Verified
Holding $XRP 187.8 USDT
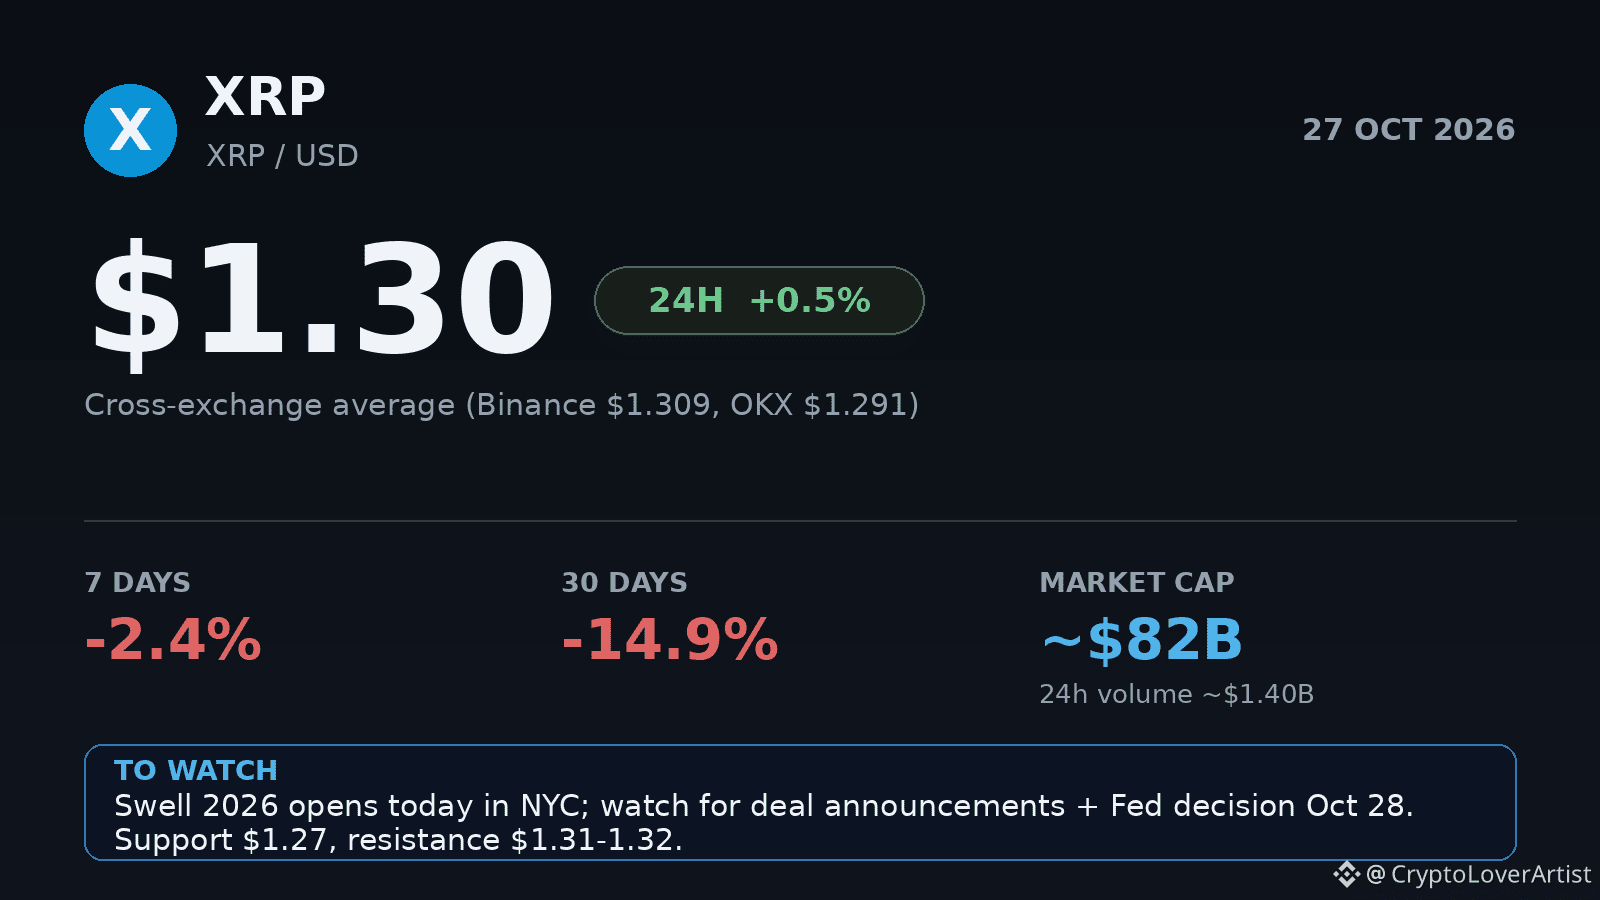
XRP is trading around $1.30 this morning, roughly flat over the last 24 hours (Binance +1.0% at $1.309). Ripple's Swell 2026 conference opens today in New York: its biggest edition yet, with 1,500+ attendees and a Garlinghouse–Tom Farley fireside! but the price hasn't reacted, sitting near a one-month low after sliding from about $1.57 in late September.
$XRP
The Fed's policy meeting (Oct 27–28) runs through the same window and may matter more than the conference.
To watch: any partnership or deal announcements out of Swell, and whether $1.27 support holds, a break below it opens the way lower, while $1.31–1.32 is the first resistance.
#XRP
$XRP
The Fed's policy meeting (Oct 27–28) runs through the same window and may matter more than the conference.
To watch: any partnership or deal announcements out of Swell, and whether $1.27 support holds, a break below it opens the way lower, while $1.31–1.32 is the first resistance.
#XRP
1
1
614
Still valid . check out the risks
Still valid . check out the risks
CryptoLoverArtist
·
--
Bitcoin, Ethereum and Solana Brace for a Volatile Weekend as U.S.–Iran Strike Risk Builds
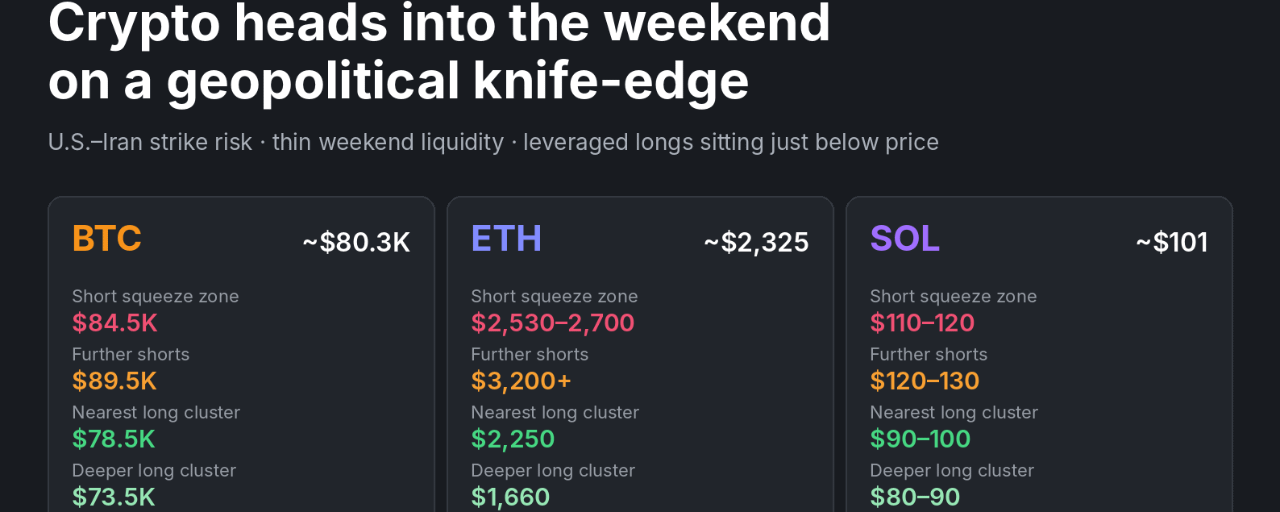
Crypto is heading into the weekend in a fragile position. Bitcoin has slipped below its 50-day moving average for the first time in 66 days. Spot Bitcoin ETFs just had their biggest one-day outflow since June (about $636M on Oct 22). And geopolitical risk is rising fast.
On Friday, Reuters quoted an envoy saying the U.S. could strike Iran this weekend. Brent crude climbed to a five-month high above $114. The U.S. also ordered non-essential staff out of Saudi Arabia and cut staffing at its embassies in Jordan, Lebanon, Qatar and the UAE, citing increased threats from Iran and the Houthis. U.S. officials say the drawdowns are not tied to possible strikes, but markets are reading them as a sign of escalation.
Weekend trading is usually thin, so one headline can move price sharply. That's why the liquidation maps matter right now.
Bitcoin: nearest pressure is below
Bitcoin is trading around $80,300 after losing its 50-day average near $81,800.
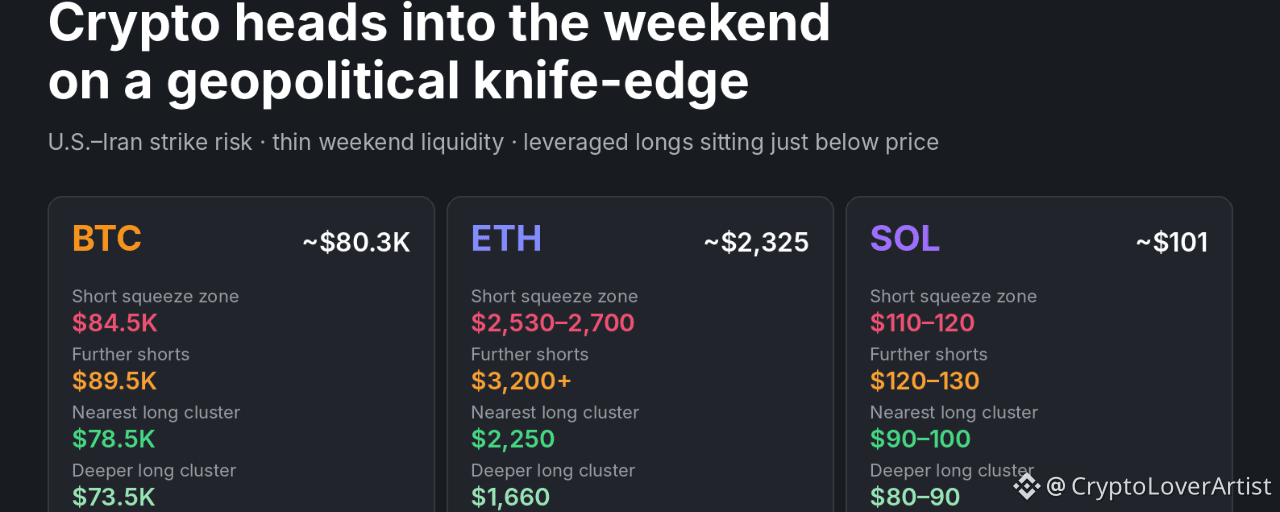
The map shows an imbalance. A cluster of about $69M in 25x long liquidations sits near $78,500, only about 1.5% below price. The matching 25x short cluster, about $67M, is near $84,500, roughly 6% above. Between $80K and $84K there is very little liquidation liquidity at all.
Downside: A dip into $78,500 could set off forced selling. If buyers don't step in, the next larger cluster is near $73,500 (about $51M in 10x longs). Below that, the 100-day average sits near $75,000.Upside: If the weekend passes without escalation, a recovery back above $81,800 would put the $84,500 short cluster in play. A move into it could quickly turn into a short squeeze, where shorts are forced to buy back. Further short liquidations sit around $89,500 and $97,000.
Ethereum: longs are closer, short fuel is thin
ETH is near $2,325 and sits below both its 20-day and 50-day averages. The nearest leveraged longs, about $23M in 10x positions, cluster around $2,250, only about 2% away. The next big pocket is much lower, around $1,660 (3x longs).
Above price, short liquidations only start around $2,530 and add up to about $20M by $2,700. Any squeeze would have less fuel than Bitcoin's. A move toward $2,530–2,700 is possible after a flush, but that is a ceiling to test, not a target.
Solana: small exposure, wide zones
SOL is around $101. Long liquidations spread from $100 down to $80, and short liquidations sit at $110–130. The map uses $10-wide price bands and shows only a few million dollars on each side, so it marks broad zones rather than exact levels. A break below $90 or a push through $110 are the levels to watch.
What matters this weekend
What matters most is how the market reacts after liquidations hit, not whether they hit. If Bitcoin sweeps $78,500 and quickly reclaims $80,000–81,800, forced selling has probably run its course. If it stays below, that points to another leg toward $73,500–75,000.
Watch these next:
U.S.–Iran headlinesOil pricesETF flows on MondayThe Fed decision on Oct 28. Markets mostly expect no change, and the focus will be on any hint of a December hike.
Disclaimer: There is always risk in crypto. Liquidation levels are estimates from third-party maps, not actual orders. This is market commentary, not financial advice. Crypto assets can lose substantial value.
63
·
--
Bearish
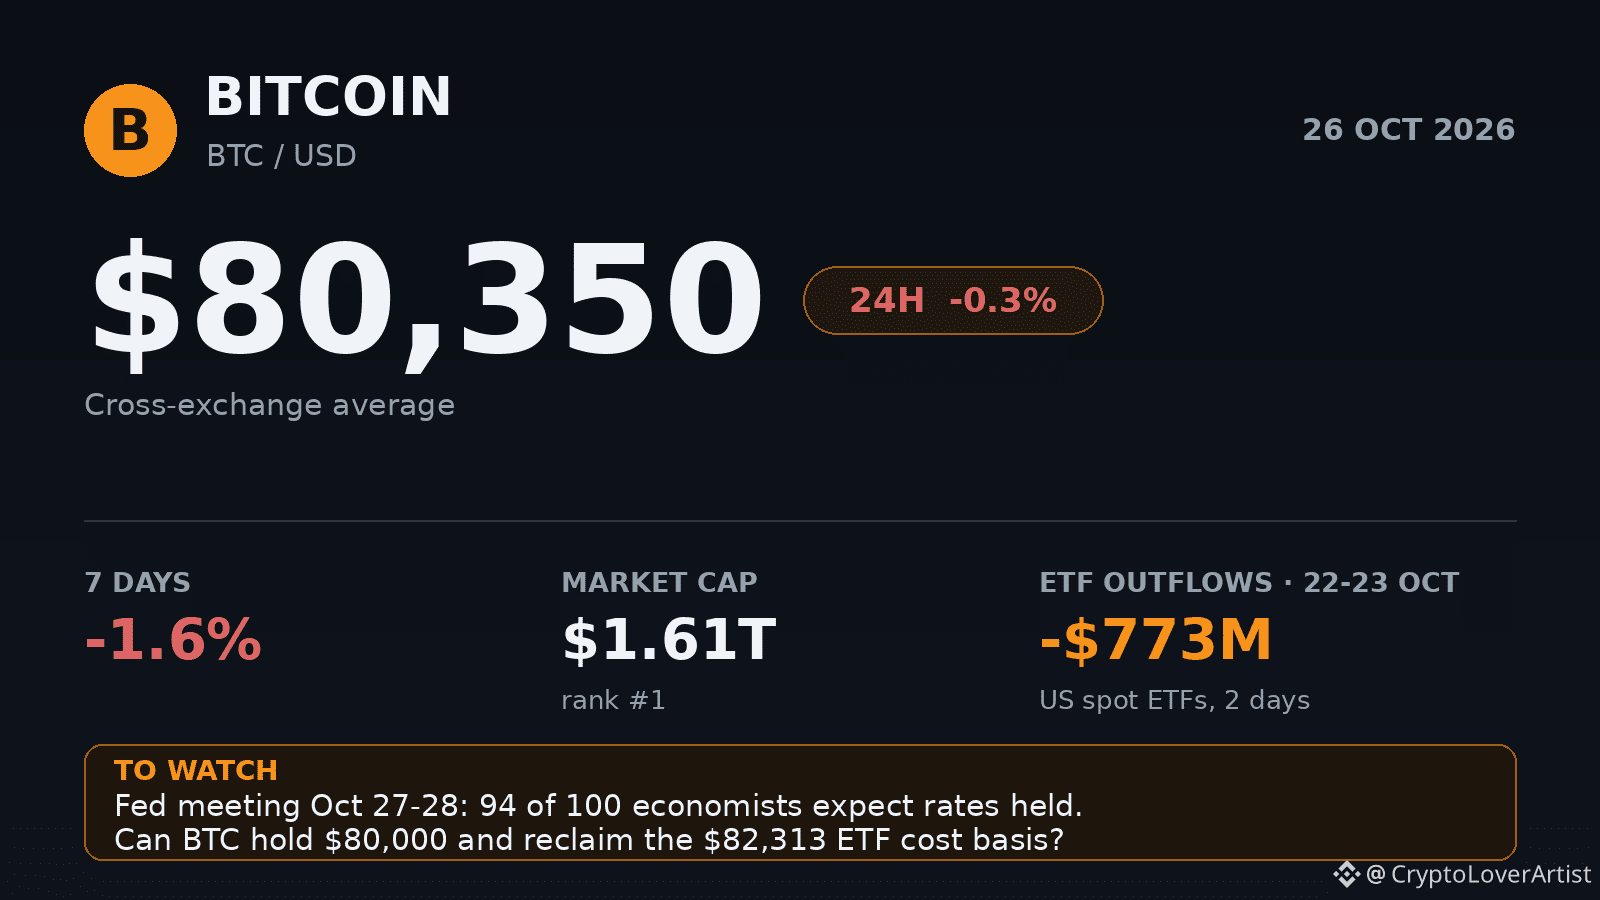
Bitcoin (BTC) is trading around $80,350, down about 0.3% in the last 24 hours (cross-exchange average; Binance $80,154). The slide follows $773 million of net outflows from US spot Bitcoin ETFs over October 22–23, including a $636 million single-day outflow on October 22, the largest since June, and Bitcoin dipped below $80,000 on October 24 for the first time in about a month.
$BTC
It is down about 1.6% over the past week and sits roughly 36% below its $126,080 all-time high from October 2025.
To watch: the Fed meeting on October 27–28, with 94 of 100 economists expecting rates held, and whether Bitcoin can hold $80,000 and reclaim the $82,313 average cost basis of ETF holders.
#binance
1
1
178
Verified
Article
Bitcoin, Ethereum and Solana Brace for a Volatile Weekend as U.S.–Iran Strike Risk BuildsCrypto is heading into the weekend in a fragile position. Bitcoin has slipped below its 50-day moving average for the first time in 66 days. Spot Bitcoin ETFs just had their biggest one-day outflow since June (about $636M on Oct 22). And geopolitical risk is rising fast.
On Friday, Reuters quoted an envoy saying the U.S. could strike Iran this weekend. Brent crude climbed to a five-month high above $114. The U.S. also ordered non-essential staff out of Saudi Arabia and cut staffing at its embassies in Jordan, Lebanon, Qatar and the UAE, citing increased threats from Iran and the Houthis. U.S. officials say the drawdowns are not tied to possible strikes, but markets are reading them as a sign of escalation.
Weekend trading is usually thin, so one headline can move price sharply. That's why the liquidation maps matter right now.
Bitcoin: nearest pressure is below
Bitcoin is trading around $80,300 after losing its 50-day average near $81,800.
The map shows an imbalance. A cluster of about $69M in 25x long liquidations sits near $78,500, only about 1.5% below price. The matching 25x short cluster, about $67M, is near $84,500, roughly 6% above. Between $80K and $84K there is very little liquidation liquidity at all.
Downside: A dip into $78,500 could set off forced selling. If buyers don't step in, the next larger cluster is near $73,500 (about $51M in 10x longs). Below that, the 100-day average sits near $75,000.Upside: If the weekend passes without escalation, a recovery back above $81,800 would put the $84,500 short cluster in play. A move into it could quickly turn into a short squeeze, where shorts are forced to buy back. Further short liquidations sit around $89,500 and $97,000.
Ethereum: longs are closer, short fuel is thin
ETH is near $2,325 and sits below both its 20-day and 50-day averages. The nearest leveraged longs, about $23M in 10x positions, cluster around $2,250, only about 2% away. The next big pocket is much lower, around $1,660 (3x longs).
Above price, short liquidations only start around $2,530 and add up to about $20M by $2,700. Any squeeze would have less fuel than Bitcoin's. A move toward $2,530–2,700 is possible after a flush, but that is a ceiling to test, not a target.
Solana: small exposure, wide zones
SOL is around $101. Long liquidations spread from $100 down to $80, and short liquidations sit at $110–130. The map uses $10-wide price bands and shows only a few million dollars on each side, so it marks broad zones rather than exact levels. A break below $90 or a push through $110 are the levels to watch.
What matters this weekend
What matters most is how the market reacts after liquidations hit, not whether they hit. If Bitcoin sweeps $78,500 and quickly reclaims $80,000–81,800, forced selling has probably run its course. If it stays below, that points to another leg toward $73,500–75,000.
Watch these next:
U.S.–Iran headlinesOil pricesETF flows on MondayThe Fed decision on Oct 28. Markets mostly expect no change, and the focus will be on any hint of a December hike.
Disclaimer: There is always risk in crypto. Liquidation levels are estimates from third-party maps, not actual orders. This is market commentary, not financial advice. Crypto assets can lose substantial value.
Bitcoin, Ethereum and Solana Brace for a Volatile Weekend as U.S.–Iran Strike Risk Builds
Crypto is heading into the weekend in a fragile position. Bitcoin has slipped below its 50-day moving average for the first time in 66 days. Spot Bitcoin ETFs just had their biggest one-day outflow since June (about $636M on Oct 22). And geopolitical risk is rising fast.
On Friday, Reuters quoted an envoy saying the U.S. could strike Iran this weekend. Brent crude climbed to a five-month high above $114. The U.S. also ordered non-essential staff out of Saudi Arabia and cut staffing at its embassies in Jordan, Lebanon, Qatar and the UAE, citing increased threats from Iran and the Houthis. U.S. officials say the drawdowns are not tied to possible strikes, but markets are reading them as a sign of escalation.
Weekend trading is usually thin, so one headline can move price sharply. That's why the liquidation maps matter right now.
Bitcoin: nearest pressure is below
Bitcoin is trading around $80,300 after losing its 50-day average near $81,800.
The map shows an imbalance. A cluster of about $69M in 25x long liquidations sits near $78,500, only about 1.5% below price. The matching 25x short cluster, about $67M, is near $84,500, roughly 6% above. Between $80K and $84K there is very little liquidation liquidity at all.
Downside: A dip into $78,500 could set off forced selling. If buyers don't step in, the next larger cluster is near $73,500 (about $51M in 10x longs). Below that, the 100-day average sits near $75,000.Upside: If the weekend passes without escalation, a recovery back above $81,800 would put the $84,500 short cluster in play. A move into it could quickly turn into a short squeeze, where shorts are forced to buy back. Further short liquidations sit around $89,500 and $97,000.
Ethereum: longs are closer, short fuel is thin
ETH is near $2,325 and sits below both its 20-day and 50-day averages. The nearest leveraged longs, about $23M in 10x positions, cluster around $2,250, only about 2% away. The next big pocket is much lower, around $1,660 (3x longs).
Above price, short liquidations only start around $2,530 and add up to about $20M by $2,700. Any squeeze would have less fuel than Bitcoin's. A move toward $2,530–2,700 is possible after a flush, but that is a ceiling to test, not a target.
Solana: small exposure, wide zones
SOL is around $101. Long liquidations spread from $100 down to $80, and short liquidations sit at $110–130. The map uses $10-wide price bands and shows only a few million dollars on each side, so it marks broad zones rather than exact levels. A break below $90 or a push through $110 are the levels to watch.
What matters this weekend
What matters most is how the market reacts after liquidations hit, not whether they hit. If Bitcoin sweeps $78,500 and quickly reclaims $80,000–81,800, forced selling has probably run its course. If it stays below, that points to another leg toward $73,500–75,000.
Watch these next:
U.S.–Iran headlinesOil pricesETF flows on MondayThe Fed decision on Oct 28. Markets mostly expect no change, and the focus will be on any hint of a December hike.
Disclaimer: There is always risk in crypto. Liquidation levels are estimates from third-party maps, not actual orders. This is market commentary, not financial advice. Crypto assets can lose substantial value.
On Friday, Reuters quoted an envoy saying the U.S. could strike Iran this weekend. Brent crude climbed to a five-month high above $114. The U.S. also ordered non-essential staff out of Saudi Arabia and cut staffing at its embassies in Jordan, Lebanon, Qatar and the UAE, citing increased threats from Iran and the Houthis. U.S. officials say the drawdowns are not tied to possible strikes, but markets are reading them as a sign of escalation.
Weekend trading is usually thin, so one headline can move price sharply. That's why the liquidation maps matter right now.
Bitcoin: nearest pressure is below
Bitcoin is trading around $80,300 after losing its 50-day average near $81,800.
The map shows an imbalance. A cluster of about $69M in 25x long liquidations sits near $78,500, only about 1.5% below price. The matching 25x short cluster, about $67M, is near $84,500, roughly 6% above. Between $80K and $84K there is very little liquidation liquidity at all.
Downside: A dip into $78,500 could set off forced selling. If buyers don't step in, the next larger cluster is near $73,500 (about $51M in 10x longs). Below that, the 100-day average sits near $75,000.Upside: If the weekend passes without escalation, a recovery back above $81,800 would put the $84,500 short cluster in play. A move into it could quickly turn into a short squeeze, where shorts are forced to buy back. Further short liquidations sit around $89,500 and $97,000.
Ethereum: longs are closer, short fuel is thin
ETH is near $2,325 and sits below both its 20-day and 50-day averages. The nearest leveraged longs, about $23M in 10x positions, cluster around $2,250, only about 2% away. The next big pocket is much lower, around $1,660 (3x longs).
Above price, short liquidations only start around $2,530 and add up to about $20M by $2,700. Any squeeze would have less fuel than Bitcoin's. A move toward $2,530–2,700 is possible after a flush, but that is a ceiling to test, not a target.
Solana: small exposure, wide zones
SOL is around $101. Long liquidations spread from $100 down to $80, and short liquidations sit at $110–130. The map uses $10-wide price bands and shows only a few million dollars on each side, so it marks broad zones rather than exact levels. A break below $90 or a push through $110 are the levels to watch.
What matters this weekend
What matters most is how the market reacts after liquidations hit, not whether they hit. If Bitcoin sweeps $78,500 and quickly reclaims $80,000–81,800, forced selling has probably run its course. If it stays below, that points to another leg toward $73,500–75,000.
Watch these next:
U.S.–Iran headlinesOil pricesETF flows on MondayThe Fed decision on Oct 28. Markets mostly expect no change, and the focus will be on any hint of a December hike.
Disclaimer: There is always risk in crypto. Liquidation levels are estimates from third-party maps, not actual orders. This is market commentary, not financial advice. Crypto assets can lose substantial value.
2
1
1
711
·
--
Bearish
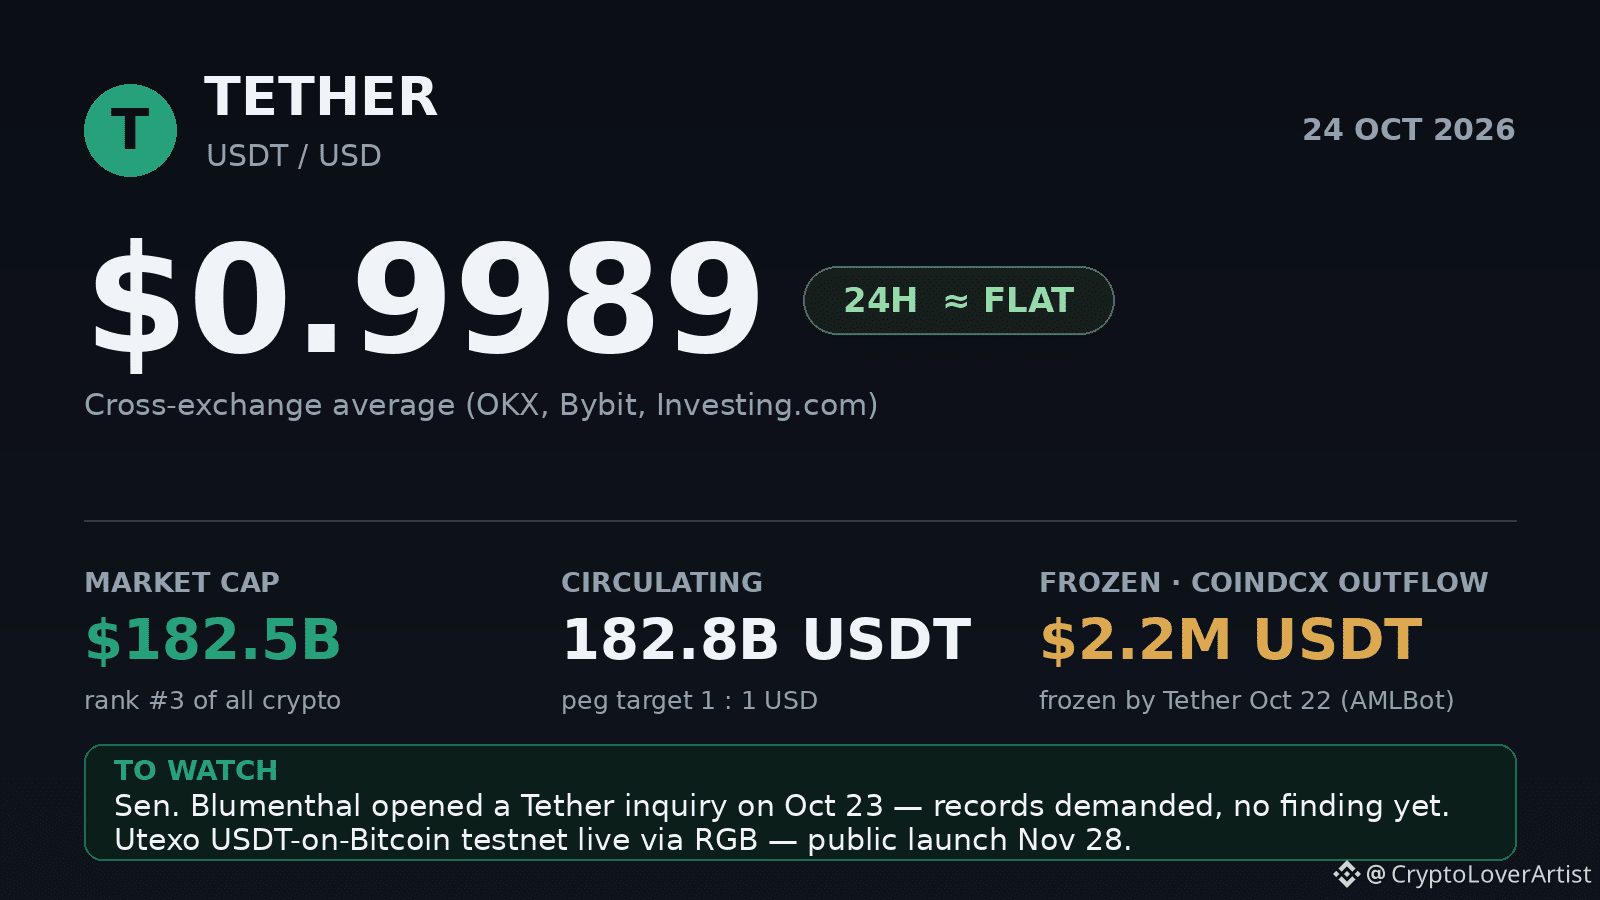
USDT is at $0.9989, essentially flat over 24h Market cap ~$182.5B, still the # 3 crypto.
The mover: Tether froze about $2.2M in USDT on TRON tied to a ~$16M outflow from wallets linked to Indian exchange CoinDCX. The funds left ~40 deposit addresses on Oct 21 (CoinDCX called it a sweeping failure); Tether froze the parked addresses on Oct 22, reported by AMLBot on Oct 23.
To watch: Sen. Blumenthal opened an inquiry into Tether on Oct 23 over reported payments to a consultancy linked to a former crypto adviser. An inquiry, not a finding. Also live: Utexo's USDT-on-Bitcoin testnet via RGB, with public launch set for Nov 28.
1
72
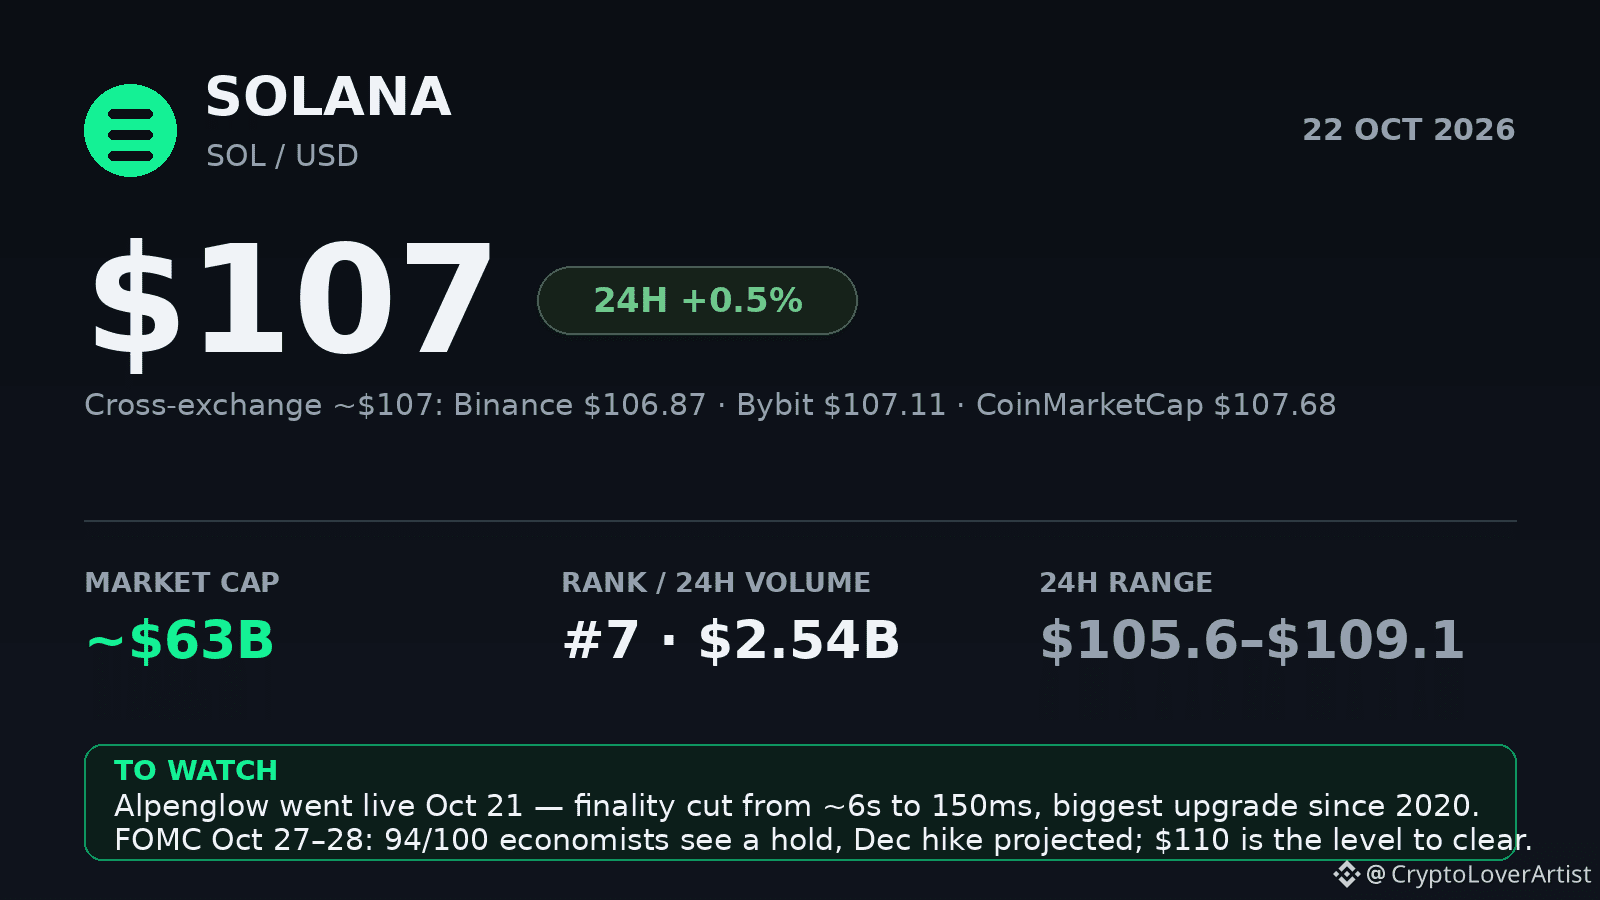
Solana ($SOL ) is trading around $107, up roughly half a percent in 24h — cross-exchange average of $106.87 on Binance, $107.11 on Bybit, $107.68 on CoinMarketCap — with a day range of $105.56 to $109.08.
The mover is yesterday's Alpenglow activation, Solana's biggest consensus upgrade since 2020, cutting transaction finality from about 6 seconds to 150ms; the wider market is also firm, with BTC near $85K.
24h volume is about $2.54B and market cap ~$63B, rank #7.
Watch: the Fed's Oct 27–28 meeting — 94 of 100 economists in a Reuters survey expect rates held this month but project a December hike; on the chart, $110 is the resistance SOL needs to break, with $105 as support.
#solana
1
1
176
#earningsseason Tesla more than expected . bullishness long term. buy
#earningsseason Tesla more than expected . bullishness long term. buy
80
·
--
Bearish
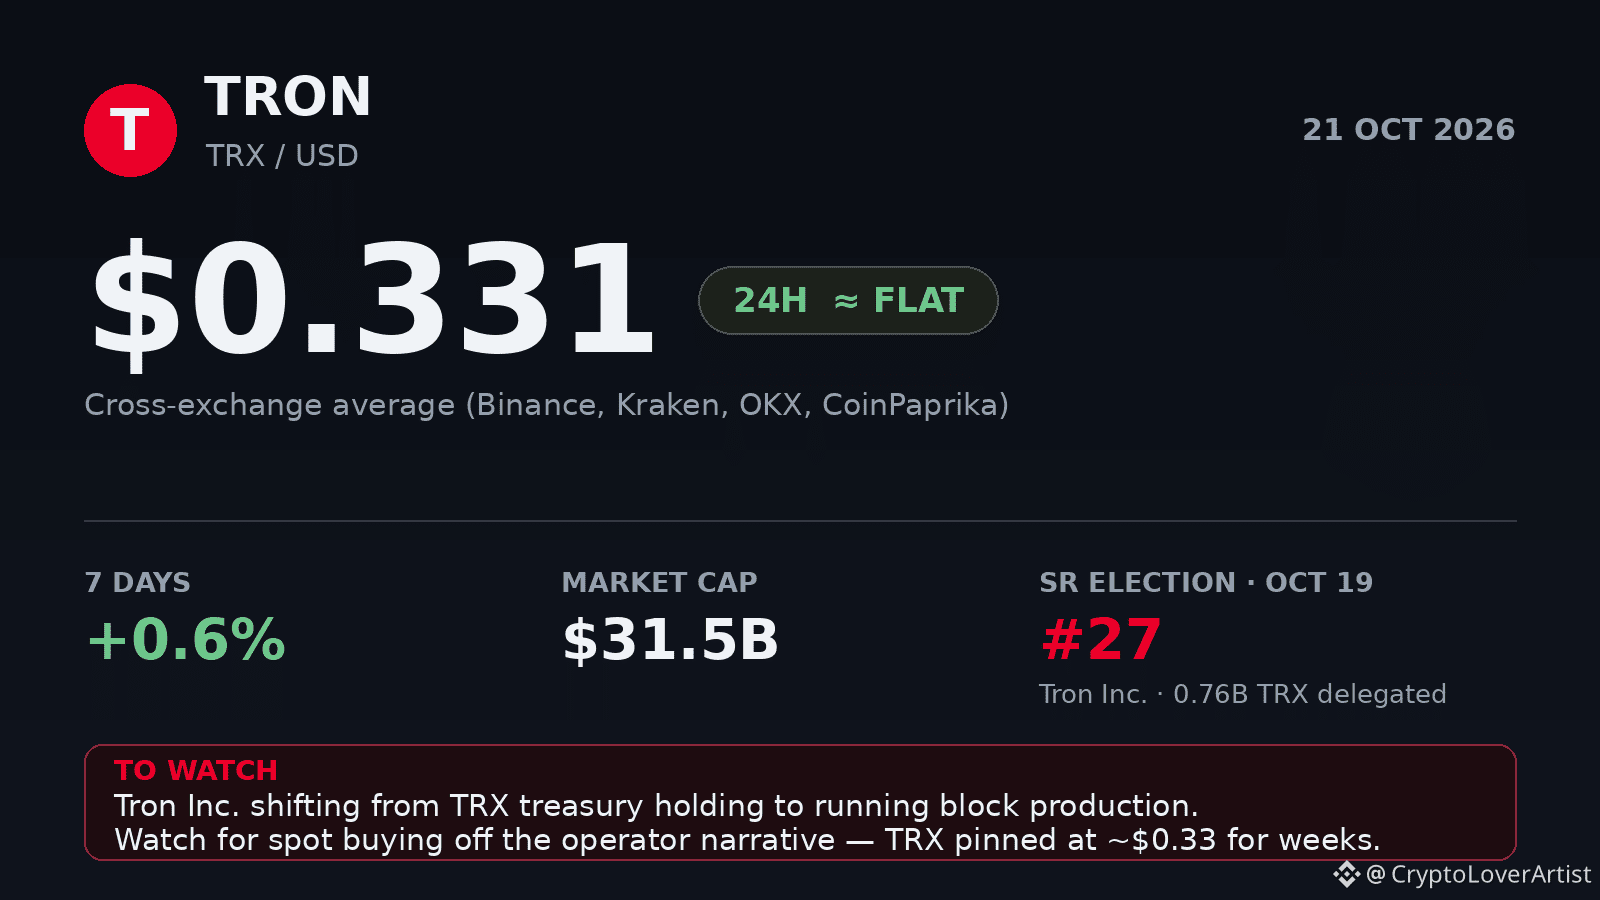
TRX is at 0.331, roughly flat over the last 24h
What moved: news, not price — Nasdaq-listed Tron Inc. was elected as Super Representative node #27 on the TRON network, announced Oct 19. It shifts from just holding TRX to running block production and validation, with 0.76B TRX delegated.
Context: the network keeps printing usage — 2.21T in stablecoin settlement in Q3 per TRON DAO's Oct 12 report — while the token itself stays pinned around 0.33.
Watch: whether the treasury-turned-operator narrative draws any real spot buying — $TRX
{spot}(TRXUSDT)
has been range-bound for weeks.
TRX is at 0.331, roughly flat over the last 24h
What moved: news, not price — Nasdaq-listed Tron Inc. was elected as Super Representative node #27 on the TRON network, announced Oct 19. It shifts from just holding TRX to running block production and validation, with 0.76B TRX delegated.
Context: the network keeps printing usage — 2.21T in stablecoin settlement in Q3 per TRON DAO's Oct 12 report — while the token itself stays pinned around 0.33.
Watch: whether the treasury-turned-operator narrative draws any real spot buying — $TRX
has been range-bound for weeks.
1
423
·
--
Bullish
Dogecoin is holding around $0.0796 (cross-exchange average), roughly flat over the last 24 hours — down about 6% on the week and ~60% on the year.
Quiet tape today: the move so far has been whale buying, with large holders adding roughly 600 million $DOGE (about $48M) between October 12 and 16, per Santiment data shared by Ali Martinez, while the DogeOS testnet's "The Grand Heist" game passed 1 million quests on October 17. Neither has lifted the price.
One to watch: DOGE's 50-day and 200-day moving averages near $0.087-$0.088 are converging, and a cross downward would be a classic death-cross signal — price needs to reclaim ~$0.081 first before that threat eases.
#doge
1
297
·
--
Bullish
Holding $BNB 32.4K USDT
BNB ($BNB ) — ~$716, up about 0.9% in the last 24h, holding steady after slipping around 6% this week from the $770 area.
The pullback tracked a broad market cooling after a strong stretch, though BNB again held up better than most large tokens and buyers stepped in near the $708.64 swing low.
To watch: the 37th quarterly BNB burn is due any day — the last one erased 1.62m BNB (~$932m) — and whether BNB can reclaim the 50-day average near $734 or breaks below the $708.64 floor.
Bonus: Follow me and get BNB nd regular GIFT packs!! See 👇 Below

Get BNB
From CryptoLoverArtist
1
32
Holding $BTC 1.6K USDT
Bitcoin ($BTC ) — ~$81,724, up about 0.6% in the last 24h, holding above $80k after bouncing off Thursday's four-week low near $79,770.
The bounce followed a soft Fed signal — Chair Warsh avoided pointing to another rate hike, easing pressure on risk assets.
Fresh driver: Charles Schwab has launched direct spot Bitcoin trading for its 40m+ retail clients, a major mainstream-adoption signal.
To watch: whether BTC can keep hold of $80k. MSCI has finalised rules that could strip bitcoin-heavy firms like Strategy from its indexes, risking around $2.8bn in passive selling, and hot US inflation data keeps Fed-hike bets alive.
#BitcoinForecast
77
$BTC
{spot}(BTCUSDT)
- Flat month overall: +0.9%, but that's deceptive — two failed rallies to 87,4K each sold off
- Currently **6.6% below the 30-day high** of 87,396, hovering just above the 79,800–80,800 support zone
- Price sits below both SMA7 ($82,277) and SMA14 ($83,178) → short/medium-term trend is down
- RSI(14) = 46 — neutral, no oversold capitulation yet
- Annualized vol 33% — moderate for BTC, meaning the drift lower is orderly, not panic-driven
1. Still digesting the 2025–26 bear leg. BTC is down 35% from its October 2025 all-time high of 126K, and 5% below where it started October. The recovery off the June low near 57.7K (a 2026 bottom so far) has stalled in the low-80Ks rather than reclaiming trend .
2. Macro overhang. The dominant bear driver since mid-2026 has been a strong US dollar and a hawkish Fed under Chair Kevin Warsh, with traders even pricing possible hikes — rates that high make cash and bonds compete with risk assets like BTC .
3. Leverage already washed out once. The February 2026 crash flushed 45% of peak futures open interest; VanEck characterized that selloff as late-stage stress with intact fundamentals — meaning the market entered this leg cleaner than typical bear phases .
4. ETF bid as a counterweight. Q3 spot ETF inflows of 6.3B absorbed selling pressure and are a key reason price has held the 80K area despite weak momentum .
Bottom line: the tape is weak but not broken — a slow bleed inside a broader post-crash repair phase. The battleground is 79.8K–80K support vs. 84K resistance; whichever breaks first likely defines the next 5–8K move. The bear case only truly reopens below the June 57.7K low .
*Not financial advice — crypto is volatile and these probabilities are judgment calls, not guarantees.*
#BitcoinShortTermHoldersReach4.08MBTC
$BTC
- Flat month overall: +0.9%, but that's deceptive — two failed rallies to 87,4K each sold off
- Currently **6.6% below the 30-day high** of 87,396, hovering just above the 79,800–80,800 support zone
- Price sits below both SMA7 ($82,277) and SMA14 ($83,178) → short/medium-term trend is down
- RSI(14) = 46 — neutral, no oversold capitulation yet
- Annualized vol 33% — moderate for BTC, meaning the drift lower is orderly, not panic-driven
1. Still digesting the 2025–26 bear leg. BTC is down 35% from its October 2025 all-time high of 126K, and 5% below where it started October. The recovery off the June low near 57.7K (a 2026 bottom so far) has stalled in the low-80Ks rather than reclaiming trend .
2. Macro overhang. The dominant bear driver since mid-2026 has been a strong US dollar and a hawkish Fed under Chair Kevin Warsh, with traders even pricing possible hikes — rates that high make cash and bonds compete with risk assets like BTC .
3. Leverage already washed out once. The February 2026 crash flushed 45% of peak futures open interest; VanEck characterized that selloff as late-stage stress with intact fundamentals — meaning the market entered this leg cleaner than typical bear phases .
4. ETF bid as a counterweight. Q3 spot ETF inflows of 6.3B absorbed selling pressure and are a key reason price has held the 80K area despite weak momentum .
Bottom line: the tape is weak but not broken — a slow bleed inside a broader post-crash repair phase. The battleground is 79.8K–80K support vs. 84K resistance; whichever breaks first likely defines the next 5–8K move. The bear case only truly reopens below the June 57.7K low .
*Not financial advice — crypto is volatile and these probabilities are judgment calls, not guarantees.*
#BitcoinShortTermHoldersReach4.08MBTC

122
·
--
Bearish
SOL is around $105, up roughly 1.4% in the last 24 hours, steadying after a rough month — it slid 13.7% since Oct 1 and spent yesterday hovering just above $100.
The pressure is mainly from flows: US spot #Solana ETFs have logged eight straight days of outflows, including a record $24.8M weekly withdrawal (about 84% from Bitwise's BSOL), while hot US inflation data keeps Fed-hike odds elevated.
On the constructive side, the Alpenglow upgrade lands around Oct 21, aiming to cut finality from ~12.8s to ~150ms, and tokenised equities on Solana just hit $611M across 1.42M holders.
$SOL
{spot}(SOLUSDT)
One thing to watch: $100 is the line — a Bitcoin break below $80k would likely drag SOL under it.
SOL is around $105, up roughly 1.4% in the last 24 hours, steadying after a rough month — it slid 13.7% since Oct 1 and spent yesterday hovering just above $100.
The pressure is mainly from flows: US spot #Solana ETFs have logged eight straight days of outflows, including a record $24.8M weekly withdrawal (about 84% from Bitwise's BSOL), while hot US inflation data keeps Fed-hike odds elevated.
On the constructive side, the Alpenglow upgrade lands around Oct 21, aiming to cut finality from ~12.8s to ~150ms, and tokenised equities on Solana just hit $611M across 1.42M holders.
$SOL
One thing to watch: $100 is the line — a Bitcoin break below $80k would likely drag SOL under it.
1
272
·
--
Bullish
Optimism (OP) quick writeup, Oct 15, 2026
Its down 16% as of this writing but has good potential
$OP
{future}(OPUSDT)
Latest news: OP has rallied about 25% in a week, with the catalyst being Uniswap moving Unichain's production operations onto OP Enterprise. The migration is slated for October 29, so it's a known event, and sell-the-news risk is real around that date.
Fundamentals: The Superchain held over 61% of L2 fee market share in early 2026 and handled roughly 13% of all crypto transactions.
Governance approved using 50% of Superchain sequencer revenue for monthly OP buybacks during a 12-month pilot, but that revenue was only about 5,900 ETH over the prior year, so the buyback is small relative to supply. Circulating supply is about 2.3B of 4.3B total, with a lot still vesting, so unlocks are a steady source of selling. OP is still roughly 68% below a year ago and about 97% below its all-time peak. Ecosystem growth hasn't translated into token performance so far.
Technicals (4h): Price is around $0.153, above all four major EMAs (20 at $0.1434, 50 at $0.1375, 100 at $0.1334, 200 at $0.1261). ADX near 27 signals an established trend. Resistance sits at $0.1585 to $0.1625, and a break above $0.16 could open $0.165. Indicator ratings are mixed, with a buy on shorter timeframes and a sell on the weekly.
Macro and sentiment: The broader market is soft, with BTC and SOL both down on Oct 14. OP is moving on its own news in a weak tape, which tends to fade faster.
Day-trade scenario (not a recommendation):
Setup: long on a pullback into EMA support, not a chase at resistance
Entry: $0.144 to $0.148
Stop loss: $0.1365 (below the 50 EMA)
Target 1: $0.1585 (about 1.3 to 1 reward/risk)
Target 2: $0.1625 (about 1.7 to 1)
Rough odds: about 45% to reach Target 1 before the stop, lower for Target 2
Invalidation: a 4h close below $0.1375, or BTC breaking down
Sizing: risk 1% of your account or less
This is for information only and is not financial advice. This is a risky coin
#OptimismFoundation
Optimism (OP) quick writeup, Oct 15, 2026
Its down 16% as of this writing but has good potential
$OP
Latest news: OP has rallied about 25% in a week, with the catalyst being Uniswap moving Unichain's production operations onto OP Enterprise. The migration is slated for October 29, so it's a known event, and sell-the-news risk is real around that date.
Fundamentals: The Superchain held over 61% of L2 fee market share in early 2026 and handled roughly 13% of all crypto transactions.
Governance approved using 50% of Superchain sequencer revenue for monthly OP buybacks during a 12-month pilot, but that revenue was only about 5,900 ETH over the prior year, so the buyback is small relative to supply. Circulating supply is about 2.3B of 4.3B total, with a lot still vesting, so unlocks are a steady source of selling. OP is still roughly 68% below a year ago and about 97% below its all-time peak. Ecosystem growth hasn't translated into token performance so far.
Technicals (4h): Price is around $0.153, above all four major EMAs (20 at $0.1434, 50 at $0.1375, 100 at $0.1334, 200 at $0.1261). ADX near 27 signals an established trend. Resistance sits at $0.1585 to $0.1625, and a break above $0.16 could open $0.165. Indicator ratings are mixed, with a buy on shorter timeframes and a sell on the weekly.
Macro and sentiment: The broader market is soft, with BTC and SOL both down on Oct 14. OP is moving on its own news in a weak tape, which tends to fade faster.
Day-trade scenario (not a recommendation):
Setup: long on a pullback into EMA support, not a chase at resistance
Entry: $0.144 to $0.148
Stop loss: $0.1365 (below the 50 EMA)
Target 1: $0.1585 (about 1.3 to 1 reward/risk)
Target 2: $0.1625 (about 1.7 to 1)
Rough odds: about 45% to reach Target 1 before the stop, lower for Target 2
Invalidation: a 4h close below $0.1375, or BTC breaking down
Sizing: risk 1% of your account or less
This is for information only and is not financial advice. This is a risky coin
#OptimismFoundation

1
373
US consumer prices rose 3.7% in the year to September, above the 3.6% forecast, and Bitcoin and gold fell within minutes. The hotter reading raises the odds of another Federal Reserve rate hike, which would lift borrowing costs.
Core inflation, which strips out volatile food and energy prices, also beat forecasts at 2.6%, against an expected 2.5%. Both measures climbed from August’s readings of 3.4% and 2.4%.
Core inflation, which strips out volatile food and energy prices, also beat forecasts at 2.6%, against an expected 2.5%. Both measures climbed from August’s readings of 3.4% and 2.4%.
1
1
283
Bitcoin keeps shrugging off bad news. Last week spot ETFs bled $681M — worst week in four months — and BTC still walked into today around $83.5k, back above the 20-day EMA and holding the $82.3k breakout shelf from the Oct 8 washout. Now the tape flipped: yesterday's +$175M was October's second-biggest inflow day, Fidelity leading with $103M. The map is simple: $84k is the first ceiling, $87k is the real test, $80k–$81.5k is the floor — that's the ETF cost basis zone, and whales have reportedly started buying again after a year of selling. CPI prints today, which could rewrite all this by afternoon. But if $82.3k holds, I'm looking for $87k retested this week. $BTC
{spot}(BTCUSDT)
Bitcoin keeps shrugging off bad news. Last week spot ETFs bled $681M — worst week in four months — and BTC still walked into today around $83.5k, back above the 20-day EMA and holding the $82.3k breakout shelf from the Oct 8 washout. Now the tape flipped: yesterday's +$175M was October's second-biggest inflow day, Fidelity leading with $103M. The map is simple: $84k is the first ceiling, $87k is the real test, $80k–$81.5k is the floor — that's the ETF cost basis zone, and whales have reportedly started buying again after a year of selling. CPI prints today, which could rewrite all this by afternoon. But if $82.3k holds, I'm looking for $87k retested this week. $BTC


2
1
338
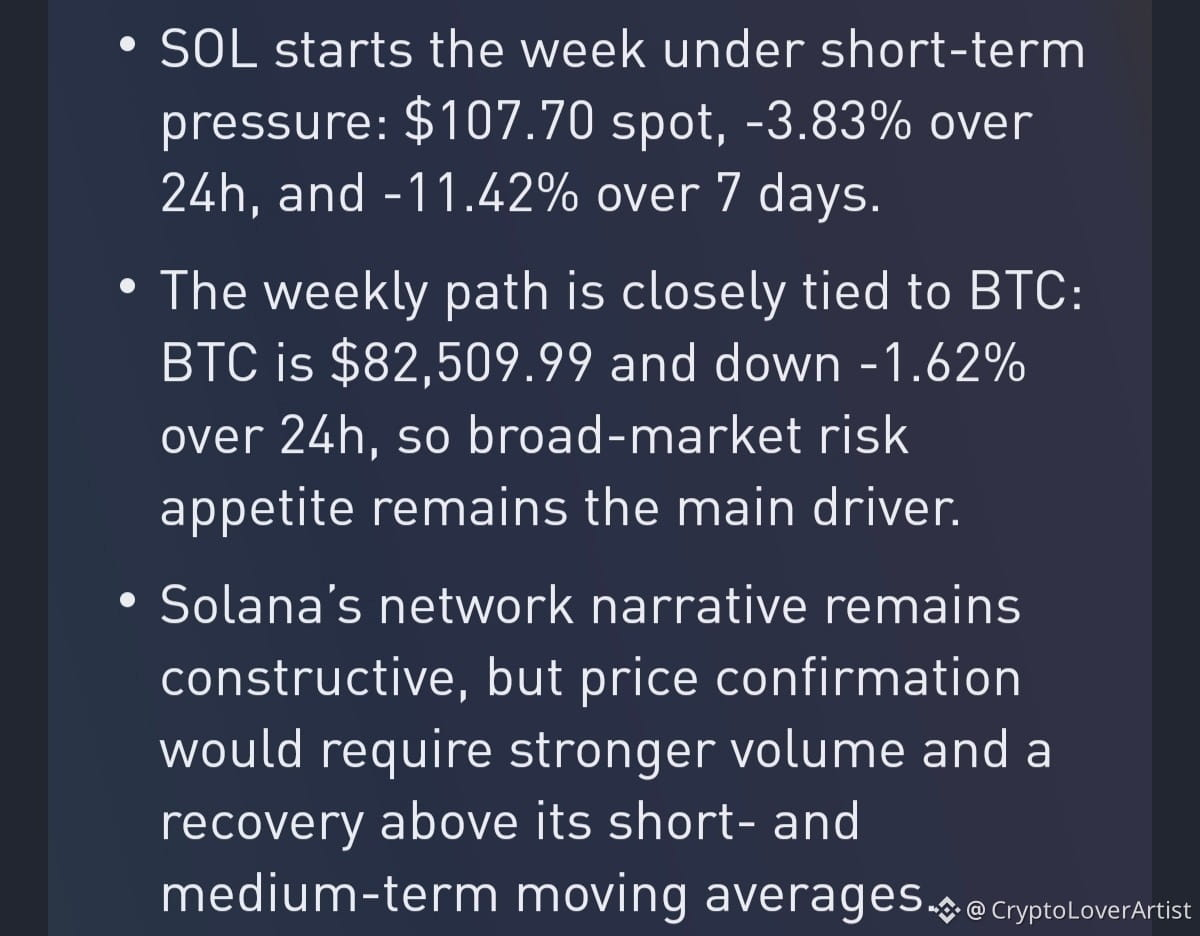
#Solana starts the week under short-term pressure: $107.70 spot, -3.83% over 24h, and -11.42% over 7 days.
The weekly path is closely tied to BTC: BTC is $82,509.99 and down -1.62% over 24h, so broad-market risk appetite remains the main driver.
Solana’s network $SOL
{spot}(SOLUSDT)
narrative remains constructive, but price confirmation would require stronger volume and a recovery above its short- and medium-term moving averages. I would be cautious before making an entry until Bitcoin is more clear
#Solana starts the week under short-term pressure: $107.70 spot, -3.83% over 24h, and -11.42% over 7 days.
The weekly path is closely tied to BTC: BTC is $82,509.99 and down -1.62% over 24h, so broad-market risk appetite remains the main driver.
Solana’s network $SOL
narrative remains constructive, but price confirmation would require stronger volume and a recovery above its short- and medium-term moving averages. I would be cautious before making an entry until Bitcoin is more clear
2
2
994
Holding $BTC 1.7K USDT
Executive Summary (as of October 11, 2026)
Bitcoin is in a strong medium-term uptrend, but the setup for the next month is conflicted. My balanced view for end of October 31, 2026 is cautiously neutral to moderately bullish. I expect a wide trading range, and I'd favor a modest, staged spot position over an aggressive or leveraged long.
Bitcoin trades around $82,980. That is roughly 31% above its level 90 days ago and about 3.8% below the recent high of $86,262 set on October 2.
Bullish factors:
- The 90-day recovery is strong, and price is still close to its recent high.
- Institutional adoption is growing, and the regulatory backdrop is improving.
- Derivatives leverage is moderate. Open interest is below its 30-day average and funding is near neutral.
- October has historically been a favorable month.
Bearish factors:
- Spot ETF flows turned negative in early October, after strong inflows in September.
- Treasury yields and real yields are elevated, and oil is above $100. Both add inflation pressure.
- Short-term holders are sitting on large profits, which raises the risk of profit-taking near resistance.
- Derivatives traders are leaning long (about 59.6% long accounts), so a break of support could trigger a downside flush.
- The Federal Reserve meeting on October 27-28 is a major event risk.
Central expectation: choppy consolidation around $80,000 to $88,000, with a base-case range of roughly $78,000 to $90,000 by month-end.
Scenarios (rough estimates, not statistical forecasts):
- Range-bound or modestly higher, about 45% likely: $80,000 to $90,000.
- Bullish breakout, about 30% likely: $92,000 to $100,000. This needs ETF inflows to return, yields to fall, and a clear move above $87,000 to $90,000.
- Bearish breakdown, about 25% likely: $70,000 to $78,000. This would follow continued ETF outflows, a hawkish Fed, and a loss of $80,000 to $82,000.
Key levels:
- Support: $80,000 to $82,000, then $78,000.
- Resistance: $85,500 to $87,000, then $90,000 to $95,000.
#Bitcoin❗ $BTC
1
1
262
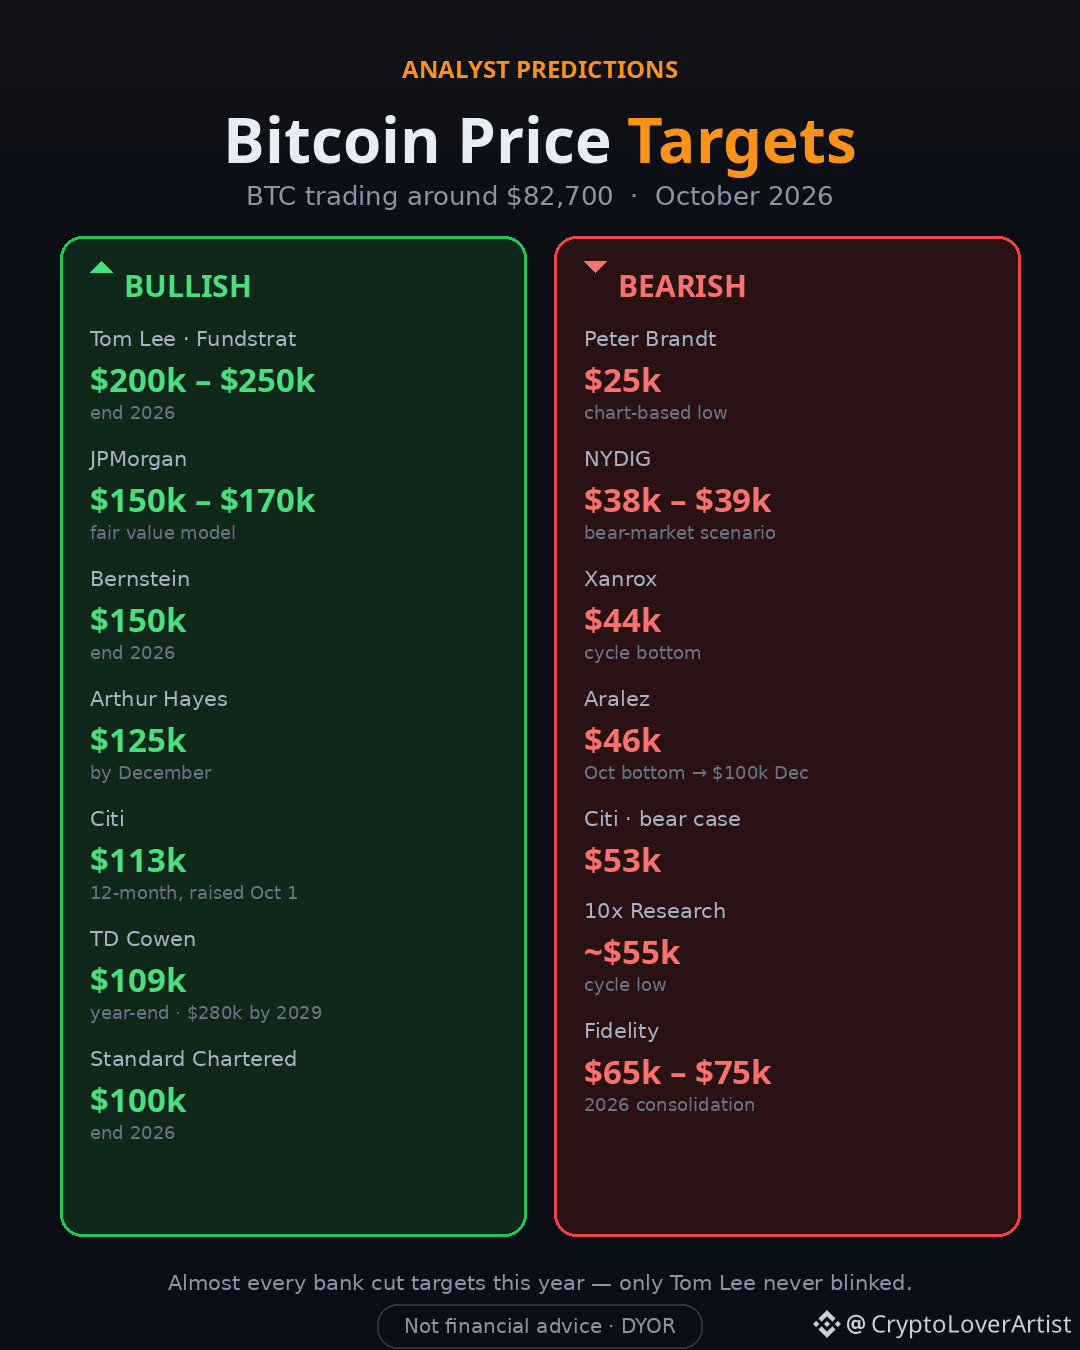
Here's the latest spread, with $BTC around $82.7k right now:
Bullish targets
- Tom Lee (Fundstrat): **$200k–$250k** by end 2026 — held all year despite the drawdown
- JPMorgan: **$150k–$170k** (fair-value model vs gold)
- Bernstein: **$150k** by end 2026 (cut from $200k)
- Arthur Hayes: **$125k** by December
- Citi: **$113k** (12-month — raised Oct 1 from $82k)
- TD Cowen: **$109k** year-end, **$280k** for 2029
- Standard Chartered: **$100k** by end 2026 (cut twice, from $300k)
- Fidelity (Timmer): **$300k** by 2029
Bearish targets
- Peter Brandt: as low as **$25k** (chart-based)
- NYDIG: **$38k–$39k** scenario if the drawdown matches 2014/2018/2022 depth (scenario, not a forecast)
- Xanrox / analysts: **$44k** bottom around now, then recovery
- Aralez: **$46k** October bottom, then back to $100k by December
- Citi bear case: **$53k**
- 10x Research: **~$55k** low
- Fidelity: **$65k–$75k** consolidation range for 2026
The honest context: almost every bank *cut* targets this year — Citi went $143k → $82k before bouncing back to $113k this month, StanChart $300k → $100k. Only Tom Lee never blinked.
What do you think about #bitcoin
1
3
675
·
--
Bearish
As of today, Oct. 7, 2026, BTC has fallen from roughly $86–87K to the low-$83Ks, and you're seeing around $82K on your exchange. The important thing is why the move accelerated:
What is causing the sudden drop?
1. Massive long liquidations 🔥
This is probably the biggest immediate accelerator. Around $550M of leveraged crypto positions were liquidated over 24 hours, with roughly $487M being long positions.
The mechanism is:
> BTC drops → leveraged longs get liquidated → forced BTC selling → BTC drops further → more longs liquidated.
That's why a move that might otherwise have been 1–2% can suddenly become a 5%+ waterfall.
2. $87K rejection was important
BTC repeatedly failed to break the $86.5–87K area. That encouraged profit-taking and left a large amount of leverage positioned for another breakout. Once BTC started falling, those positions became fuel for the decline.
3. Macro conditions suddenly became hostile
This is a particularly important part.
US 10-year Treasury yield → above 5.3%
Dollar → strengthening
Brent crude → around $101–102
Middle East/Strait of Hormuz tensions → pushing oil higher
Traders are waiting for the Fed minutes
Higher yields + stronger dollar generally hurt speculative assets like BTC.
4. ETF flows have weakened
Bitcoin spot ETFs recorded about $89.9M of net outflows, after two days of inflows. That's not enormous compared with Bitcoin's market cap, but it removes some of the institutional buying support that had helped BTC climb.
The next areas I'd watch are roughly:
$82K → $80K → $78K
One analyst specifically identified ~$78K as a possible next support if $83K fails.
One interesting thing
BTC is not necessarily collapsing because fundamentals suddenly changed. The current evidence points heavily toward macro pressure + crowded leverage + forced liquidations.
In fact, analysts quoted today are describing it more as a "leverage flush" than confirmation of a new bear market.
#bitcoin

1
454
Log in to explore more content
Join global crypto users on Binance Square
⚡️ Get latest and useful information about crypto.
💬 Trusted by the world’s largest crypto exchange.
👍 Discover real insights from verified creators.
Email / Phone number
Trending Topics
BinancePick
3.3M views
161,452 Discussing
Join #EarningsSeason: Predict Earnings on Binance Pick, Share Your Take on Binance Square!
Binance Square Official
·417 Likes
·344.6k views
EarningsSeason
5.4M views
26,545 Discussing
StrategySkipsBitcoinPurchasesSpends$205MOnSTRCBuybacks
56 views
6 Discussing