
MaverickVS
15 Posts

MaverickVS
Report
Block User

SOL Holder
Frequent Trader
5.6 Years
1 Following
29 Followers
34 Liked
Posts
·
--
#BTC $81,322
• Price at 81,322, near the upper end of the 24h range of 80,397–81,823; consolidating for 11 hours within a 1.5% range
• Price moved up from 17:00 to 19:00, then gave back some gains at 20:00 (pullback from 81,789 to 81,322)
• 1h MACD is rising, but shows bearish divergence; CVD is +0.25 on 60m and −0.24 on 5m — mixed signals
In the short term, price has bounced up from the lower boundary of the range, but remains within the sideways range and has yet to confirm a reversal. The ensemble mode (0% in BTC) remains in effect: no scenario is in a long position. The hourly picture is moderately positive, but there are signs of fading momentum.
Watch: For the mode to change, the fast EMAs on the 4h chart need to move above the slow ones; watch for 4h closes above the upper boundary of the range, around 81.8k.
#BTC $81,322
• Price at 81,322, near the upper end of the 24h range of 80,397–81,823; consolidating for 11 hours within a 1.5% range
• Price moved up from 17:00 to 19:00, then gave back some gains at 20:00 (pullback from 81,789 to 81,322)
• 1h MACD is rising, but shows bearish divergence; CVD is +0.25 on 60m and −0.24 on 5m — mixed signals
In the short term, price has bounced up from the lower boundary of the range, but remains within the sideways range and has yet to confirm a reversal. The ensemble mode (0% in BTC) remains in effect: no scenario is in a long position. The hourly picture is moderately positive, but there are signs of fading momentum.
Watch: For the mode to change, the fast EMAs on the 4h chart need to move above the slow ones; watch for 4h closes above the upper boundary of the range, around 81.8k.
• Price at 81,322, near the upper end of the 24h range of 80,397–81,823; consolidating for 11 hours within a 1.5% range
• Price moved up from 17:00 to 19:00, then gave back some gains at 20:00 (pullback from 81,789 to 81,322)
• 1h MACD is rising, but shows bearish divergence; CVD is +0.25 on 60m and −0.24 on 5m — mixed signals
In the short term, price has bounced up from the lower boundary of the range, but remains within the sideways range and has yet to confirm a reversal. The ensemble mode (0% in BTC) remains in effect: no scenario is in a long position. The hourly picture is moderately positive, but there are signs of fading momentum.
Watch: For the mode to change, the fast EMAs on the 4h chart need to move above the slow ones; watch for 4h closes above the upper boundary of the range, around 81.8k.
2
460
·
--
📊 HOURLY ANALYSIS BTC
⏰ 08:15 UTC | $80,762
- Price has stabilized near the 24h low (0.13% deviation)
- 1h MACD histogram is rising (76, not in deep oversold)
- CVD reversed after a lack of liquidations
- 3 out of 4 reversal signs are active (lacking volume)
Plan:
- LONG
- Entry: $80,762 (current price)
- Stop: $80,498 (below the 24h low, -0.33%)
- Take profit: $82,377 (+2.0%)
Conclusion: Entry is justified as 3 out of 4 reversal signals are active, and the stop is tight below the day's low, minimizing the risk of a false breakout.
📊 HOURLY ANALYSIS BTC
⏰ 08:15 UTC | $80,762
- Price has stabilized near the 24h low (0.13% deviation)
- 1h MACD histogram is rising (76, not in deep oversold)
- CVD reversed after a lack of liquidations
- 3 out of 4 reversal signs are active (lacking volume)
Plan:
- LONG
- Entry: $80,762 (current price)
- Stop: $80,498 (below the 24h low, -0.33%)
- Take profit: $82,377 (+2.0%)
Conclusion: Entry is justified as 3 out of 4 reversal signals are active, and the stop is tight below the day's low, minimizing the risk of a false breakout.
⏰ 08:15 UTC | $80,762
- Price has stabilized near the 24h low (0.13% deviation)
- 1h MACD histogram is rising (76, not in deep oversold)
- CVD reversed after a lack of liquidations
- 3 out of 4 reversal signs are active (lacking volume)
Plan:
- LONG
- Entry: $80,762 (current price)
- Stop: $80,498 (below the 24h low, -0.33%)
- Take profit: $82,377 (+2.0%)
Conclusion: Entry is justified as 3 out of 4 reversal signals are active, and the stop is tight below the day's low, minimizing the risk of a false breakout.
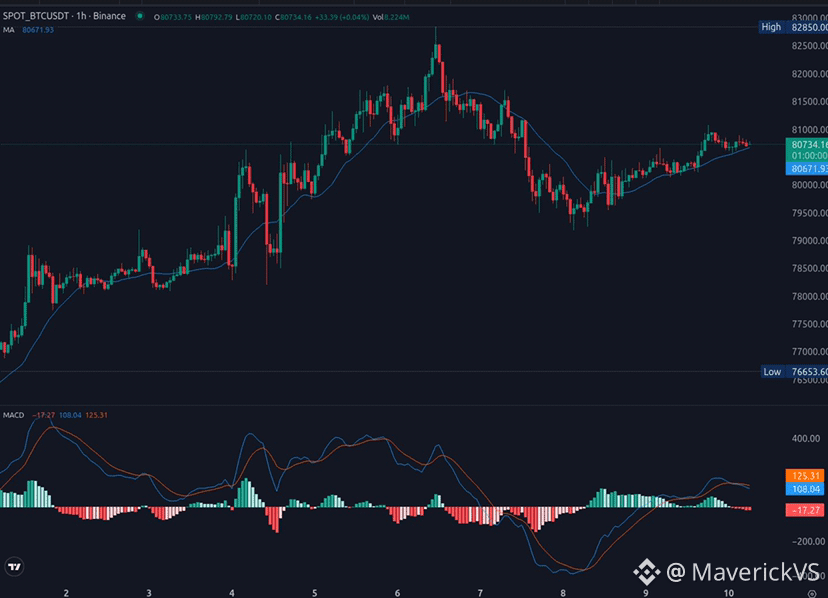
166
·
--
📊 HOURLY ANALYSIS BTC
⏰ 22:15 UTC | $80,887
Waiting. Not enough confirmations.
Justification:
Out of 4 reversal signs, only 2 are present (price stabilization and decline in the 1h MACD histogram). There's no short capitulation or CVD reversal. On-chain is neutral. The market hasn't given an entry signal—I'm waiting for stronger bearish patterns or a structural breakout.
📊 HOURLY ANALYSIS BTC
⏰ 22:15 UTC | $80,887
Waiting. Not enough confirmations.
Justification:
Out of 4 reversal signs, only 2 are present (price stabilization and decline in the 1h MACD histogram). There's no short capitulation or CVD reversal. On-chain is neutral. The market hasn't given an entry signal—I'm waiting for stronger bearish patterns or a structural breakout.
⏰ 22:15 UTC | $80,887
Waiting. Not enough confirmations.
Justification:
Out of 4 reversal signs, only 2 are present (price stabilization and decline in the 1h MACD histogram). There's no short capitulation or CVD reversal. On-chain is neutral. The market hasn't given an entry signal—I'm waiting for stronger bearish patterns or a structural breakout.
200
·
--
📉 XRP under pressure: correction continues, but support holds.📊 Last price: $2.857
📉 Change over 24h: -3.46%
🔺 Maximum: $3.035
🔻 Minimum: $2.803
📈 Volume: 415 million XRP
🔍 Market overview
The price of XRP shows a downward trend, losing about 3.5% over the last 24 hours.
After an unsuccessful attempt to stay above $3.00, a steady decline is observed, accompanied by significant volumes, especially in selling zones.
📉 XRP under pressure: correction continues, but support holds.
📊 Last price: $2.857
📉 Change over 24h: -3.46%
🔺 Maximum: $3.035
🔻 Minimum: $2.803
📈 Volume: 415 million XRP
🔍 Market overview
The price of XRP shows a downward trend, losing about 3.5% over the last 24 hours.
After an unsuccessful attempt to stay above $3.00, a steady decline is observed, accompanied by significant volumes, especially in selling zones.
📉 Change over 24h: -3.46%
🔺 Maximum: $3.035
🔻 Minimum: $2.803
📈 Volume: 415 million XRP
🔍 Market overview
The price of XRP shows a downward trend, losing about 3.5% over the last 24 hours.
After an unsuccessful attempt to stay above $3.00, a steady decline is observed, accompanied by significant volumes, especially in selling zones.
2
1.8k
·
--
🌊 Ripple and XRP: growth potential in the ETF market and a new wave of interest.$XRPUSDT
XRP could double its share in the ETF market, says industry veteran Stephen McClerg, CEO of Canary Capital.
According to him, XRP and Ethereum could reach a 6% share of the ETF market soon, as institutional interest grows and their role as financial instruments is better understood.
🔍 Key takeaways:
🌊 Ripple and XRP: growth potential in the ETF market and a new wave of interest.
$XRPUSDT
XRP could double its share in the ETF market, says industry veteran Stephen McClerg, CEO of Canary Capital.
According to him, XRP and Ethereum could reach a 6% share of the ETF market soon, as institutional interest grows and their role as financial instruments is better understood.
🔍 Key takeaways:
XRP could double its share in the ETF market, says industry veteran Stephen McClerg, CEO of Canary Capital.
According to him, XRP and Ethereum could reach a 6% share of the ETF market soon, as institutional interest grows and their role as financial instruments is better understood.
🔍 Key takeaways:
1
322
·
--
🚀 Ethereum aims for $4000 after breaking above $2900$ETHUSDT
Ethereum has confidently surpassed resistance at $2900, establishing itself above a key level amid strong volume growth and institutional activity. At the time of publication, ETH is trading around $3038, with a daily volume reaching $32 billion, which is double recent figures.
📈 Technical signals confirm bullish momentum:
🚀 Ethereum aims for $4000 after breaking above $2900
$ETHUSDT
Ethereum has confidently surpassed resistance at $2900, establishing itself above a key level amid strong volume growth and institutional activity. At the time of publication, ETH is trading around $3038, with a daily volume reaching $32 billion, which is double recent figures.
📈 Technical signals confirm bullish momentum:
Ethereum has confidently surpassed resistance at $2900, establishing itself above a key level amid strong volume growth and institutional activity. At the time of publication, ETH is trading around $3038, with a daily volume reaching $32 billion, which is double recent figures.
📈 Technical signals confirm bullish momentum:
162
·
--
📉 Bitcoin under pressure: short-term correction continues!$BTCUSDT
📊 Last price: $117,002
📉 Change for 24h: -4.26%
🔺 Maximum for 24h: $123,218
🔻 Minimum for 24h: $116,250
📈 Volume for 24h: 27,354 BTC
🧠 Market overview:
In the last 24 hours, Bitcoin has shown a pronounced decline, losing over 4% of its value.
Despite an attempt by bulls to maintain positions above $120,000 early in the day, selling pressure increased, leading to testing support around $116,250.
📉 Bitcoin under pressure: short-term correction continues!
$BTCUSDT
📊 Last price: $117,002
📉 Change for 24h: -4.26%
🔺 Maximum for 24h: $123,218
🔻 Minimum for 24h: $116,250
📈 Volume for 24h: 27,354 BTC
🧠 Market overview:
In the last 24 hours, Bitcoin has shown a pronounced decline, losing over 4% of its value.
Despite an attempt by bulls to maintain positions above $120,000 early in the day, selling pressure increased, leading to testing support around $116,250.
📊 Last price: $117,002
📉 Change for 24h: -4.26%
🔺 Maximum for 24h: $123,218
🔻 Minimum for 24h: $116,250
📈 Volume for 24h: 27,354 BTC
🧠 Market overview:
In the last 24 hours, Bitcoin has shown a pronounced decline, losing over 4% of its value.
Despite an attempt by bulls to maintain positions above $120,000 early in the day, selling pressure increased, leading to testing support around $116,250.
185
·
--
#SpotVSFuturesStrategy how to choose, let's discuss!
#SpotVSFuturesStrategy how to choose, let's discuss!
2
·
--
XRP may exhibit growth around $3.17 in August 2025.$XRPUSDT
In July 2025, XRP demonstrated significant bullish momentum: its price increased by more than 37%, reigniting investor interest ahead of August.
Market data shows a significant spike in trading volume, indicating strong participation that may support XRP's goal of overcoming the critical resistance level at $3.
XRP may exhibit growth around $3.17 in August 2025.
$XRPUSDT
In July 2025, XRP demonstrated significant bullish momentum: its price increased by more than 37%, reigniting investor interest ahead of August.
Market data shows a significant spike in trading volume, indicating strong participation that may support XRP's goal of overcoming the critical resistance level at $3.
In July 2025, XRP demonstrated significant bullish momentum: its price increased by more than 37%, reigniting investor interest ahead of August.
Market data shows a significant spike in trading volume, indicating strong participation that may support XRP's goal of overcoming the critical resistance level at $3.
1
1
2
3.1k
·
--
🚀 Bitcoin breaks the level! Is the growth continuing?#BTC
📊 Last price: $122,336.90
📈 Change in 24h: +3.7%
🔻 Minimum in 24h: $117,689.63
🔺 Maximum in 24h: $122,666.00
📉 Trading volume (24h): 19,343 BTC
🔥 BTC at the peak: what’s behind it?
Bitcoin demonstrates a confident upward movement against the backdrop of increasing volume and aggressive breakouts of key levels.
In the last 24 hours, the price has risen nearly $5,000, breaking resistances and setting a new local maximum at $122,666.
🚀 Bitcoin breaks the level! Is the growth continuing?
#BTC
📊 Last price: $122,336.90
📈 Change in 24h: +3.7%
🔻 Minimum in 24h: $117,689.63
🔺 Maximum in 24h: $122,666.00
📉 Trading volume (24h): 19,343 BTC
🔥 BTC at the peak: what’s behind it?
Bitcoin demonstrates a confident upward movement against the backdrop of increasing volume and aggressive breakouts of key levels.
In the last 24 hours, the price has risen nearly $5,000, breaking resistances and setting a new local maximum at $122,666.
📊 Last price: $122,336.90
📈 Change in 24h: +3.7%
🔻 Minimum in 24h: $117,689.63
🔺 Maximum in 24h: $122,666.00
📉 Trading volume (24h): 19,343 BTC
🔥 BTC at the peak: what’s behind it?
Bitcoin demonstrates a confident upward movement against the backdrop of increasing volume and aggressive breakouts of key levels.
In the last 24 hours, the price has risen nearly $5,000, breaking resistances and setting a new local maximum at $122,666.
1
468
·
--
BTC Market Analysis: Consolidation Before a Breakout? #BTC #Bitcoin #CryptoAnalysis📊 Current Price: $117,789.68
📆 Change over 24h: +0.02%
🔻 Minimum in 24h: $116,900.05
🔺 Maximum in 24h: $118,200.00
📉 Trading Volume: 7,507 BTC
📉 What is happening with the BTC price?
Over the last 24 hours, Bitcoin has shown slight sideways movement, maintaining stability in a narrow range. Despite a minor daily change, internal dynamics indicate recovery after a short-term dip.
BTC Market Analysis: Consolidation Before a Breakout? #BTC #Bitcoin #CryptoAnalysis
📊 Current Price: $117,789.68
📆 Change over 24h: +0.02%
🔻 Minimum in 24h: $116,900.05
🔺 Maximum in 24h: $118,200.00
📉 Trading Volume: 7,507 BTC
📉 What is happening with the BTC price?
Over the last 24 hours, Bitcoin has shown slight sideways movement, maintaining stability in a narrow range. Despite a minor daily change, internal dynamics indicate recovery after a short-term dip.
📆 Change over 24h: +0.02%
🔻 Minimum in 24h: $116,900.05
🔺 Maximum in 24h: $118,200.00
📉 Trading Volume: 7,507 BTC
📉 What is happening with the BTC price?
Over the last 24 hours, Bitcoin has shown slight sideways movement, maintaining stability in a narrow range. Despite a minor daily change, internal dynamics indicate recovery after a short-term dip.
1
169
·
--
#BinanceTurns8 Join the celebration #BinanceTurns8 and win a share of 888 888$ in BNB! https://www.binance.com/activity/binance-turns-8?ref=GRO_19600_X1JR8
#BinanceTurns8 Join the celebration #BinanceTurns8 and win a share of 888 888$ in BNB! https://www.binance.com/activity/binance-turns-8?ref=GRO_19600_X1JR8
9
9
·
--
BTC Market Analysis: Forecasts for the Near Future#BTCUSDT
The cryptocurrency market is once again demonstrating interesting price fluctuations, and Bitcoin (BTC) is no exception. Over the past 24 hours, the price of BTC has shown a slight increase of 0.302%, raising questions among many traders and investors: what awaits us next?
Let's analyze the latest data in more detail to understand where the price of Bitcoin may move in the near future.
BTC Market Analysis: Forecasts for the Near Future
#BTCUSDT
The cryptocurrency market is once again demonstrating interesting price fluctuations, and Bitcoin (BTC) is no exception. Over the past 24 hours, the price of BTC has shown a slight increase of 0.302%, raising questions among many traders and investors: what awaits us next?
Let's analyze the latest data in more detail to understand where the price of Bitcoin may move in the near future.
The cryptocurrency market is once again demonstrating interesting price fluctuations, and Bitcoin (BTC) is no exception. Over the past 24 hours, the price of BTC has shown a slight increase of 0.302%, raising questions among many traders and investors: what awaits us next?
Let's analyze the latest data in more detail to understand where the price of Bitcoin may move in the near future.
2
1
8
1k
·
--
Bitcoin on the brink of a new wave: what to expect after a 6.32% rise?#BTCUSDT
📊 Brief overview of BTC: July 10-11, 2025 📉
Today, Bitcoin continues to show interesting dynamics. Over the past 24 hours, its price has fluctuated between 110500.00 and 118869.98 dollars, with a growth of 6.32%. At the moment, the price is 117787.70 USD, indicating a stable recovery after minor fluctuations.
Bitcoin on the brink of a new wave: what to expect after a 6.32% rise?
#BTCUSDT
📊 Brief overview of BTC: July 10-11, 2025 📉
Today, Bitcoin continues to show interesting dynamics. Over the past 24 hours, its price has fluctuated between 110500.00 and 118869.98 dollars, with a growth of 6.32%. At the moment, the price is 117787.70 USD, indicating a stable recovery after minor fluctuations.
📊 Brief overview of BTC: July 10-11, 2025 📉
Today, Bitcoin continues to show interesting dynamics. Over the past 24 hours, its price has fluctuated between 110500.00 and 118869.98 dollars, with a growth of 6.32%. At the moment, the price is 117787.70 USD, indicating a stable recovery after minor fluctuations.
1
1
8
182
Log in to explore more content
Join global crypto users on Binance Square
⚡️ Get latest and useful information about crypto.
💬 Trusted by the world’s largest crypto exchange.
👍 Discover real insights from verified creators.
Email / Phone number
Trending Topics
SouthKoreaDraftLawTargets15To20%ShareholderCap
99 views
17 Discussing
#SouthKoreaDraftLawTargets15To20%ShareholderCap
🇰🇷 South Korea Eyes Crypto Exchange Ownership Cap 🚨
South Korea's push to limit major shareholders in crypto exchanges is heating up. 🔥 The Financial Services Commission first floated a 15% to 20% cap to avoid conflicts of interest. 📉 Later reports say regulators and lawmakers settled on a 20% cap, with stakes of up to 34% allowed in certain exceptions. ⚖️ (Yahoo Finance) (theblock)
The rule would sit inside the Digital Asset Basic Act, and Bithumb and Gopax would likely need big ownership changes. 🏦 Industry players are pushing back hard. 💬 (theblock)
Will this make the market fairer, or hurt innovation? 🤔
#SouthKorea #Upbit #Bithumb 🚀
#Nadeemgujjar143
@aasho @长风Nova @Eşsiz kimi @Fatima SheRazi Official @Ayeza998
$BTC
$BNB
$ETH
NADEEM Gujjar143
·0 Likes
·28 views
KeplrAdvisesSocialLoginUsersToTransferAssets
4,722 views
152 Discussing
TetherPlans€28.8MForJuventusCapitalIncrease
2,821 views
122 Discussing