
Crypto_Radar-
198 Posts

Crypto_Radar-
Report
Block User
Ділюся власними думками та аналізом крипторинку 📊Не фінансова порада. DYOR 🔍
High-Frequency Trader
5.7 Years
0 Following
127 Followers
159 Liked
Posts
All
Quotes
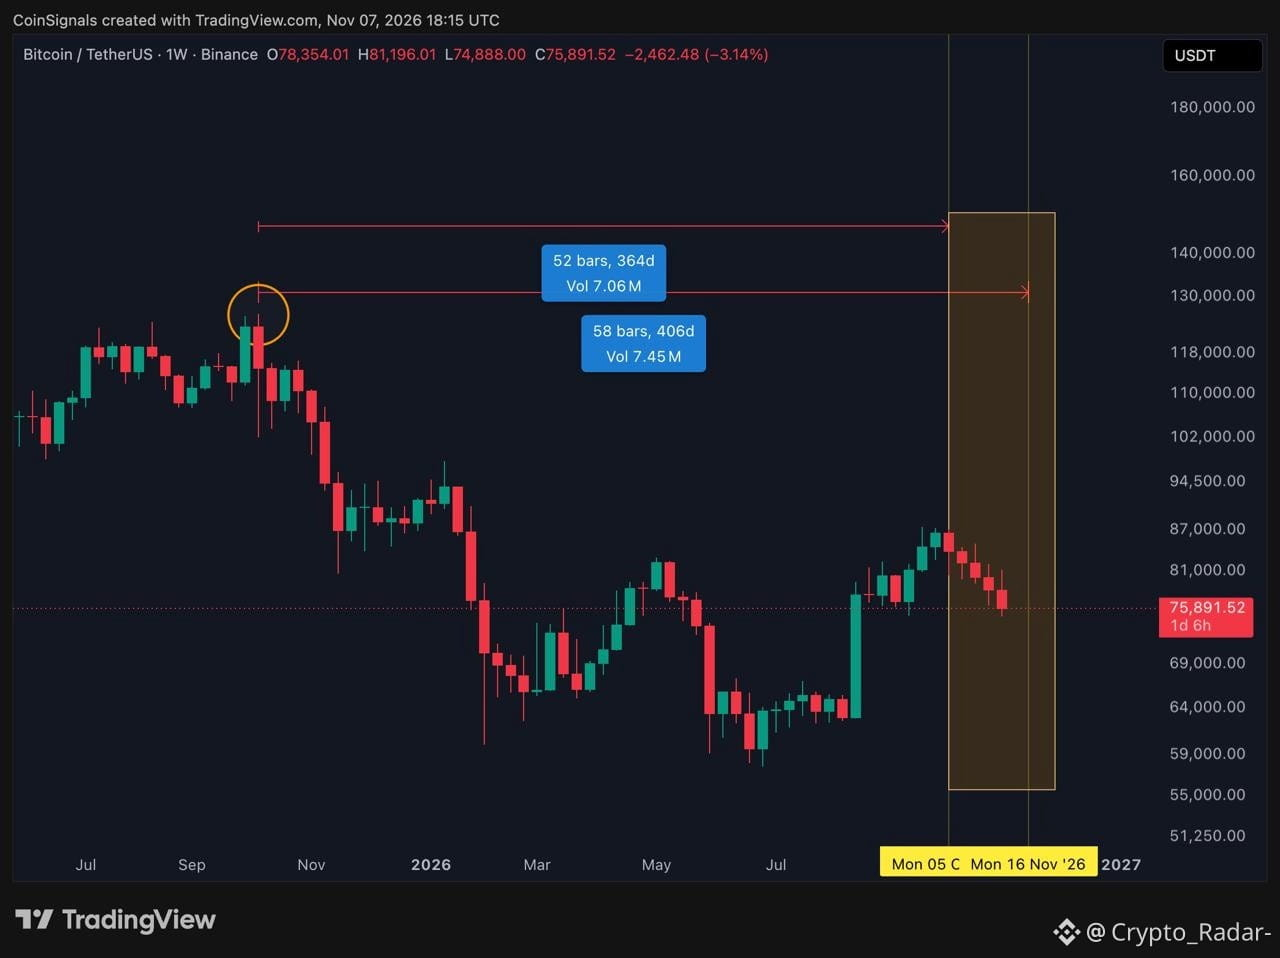
$BTC Previous lows from three cycles were observed approximately 365–406 days after the corresponding highs.
Based on this historical pattern, the current four-year cycle low will likely occur by the end of November or in December.
⚠️ The next two months are crucial.
$BTC Previous lows from three cycles were observed approximately 365–406 days after the corresponding highs.
Based on this historical pattern, the current four-year cycle low will likely occur by the end of November or in December.
⚠️ The next two months are crucial.
Based on this historical pattern, the current four-year cycle low will likely occur by the end of November or in December.
⚠️ The next two months are crucial.
854

$BTC
$BTC

Crypto_Radar-
·
--
💰 $BTC
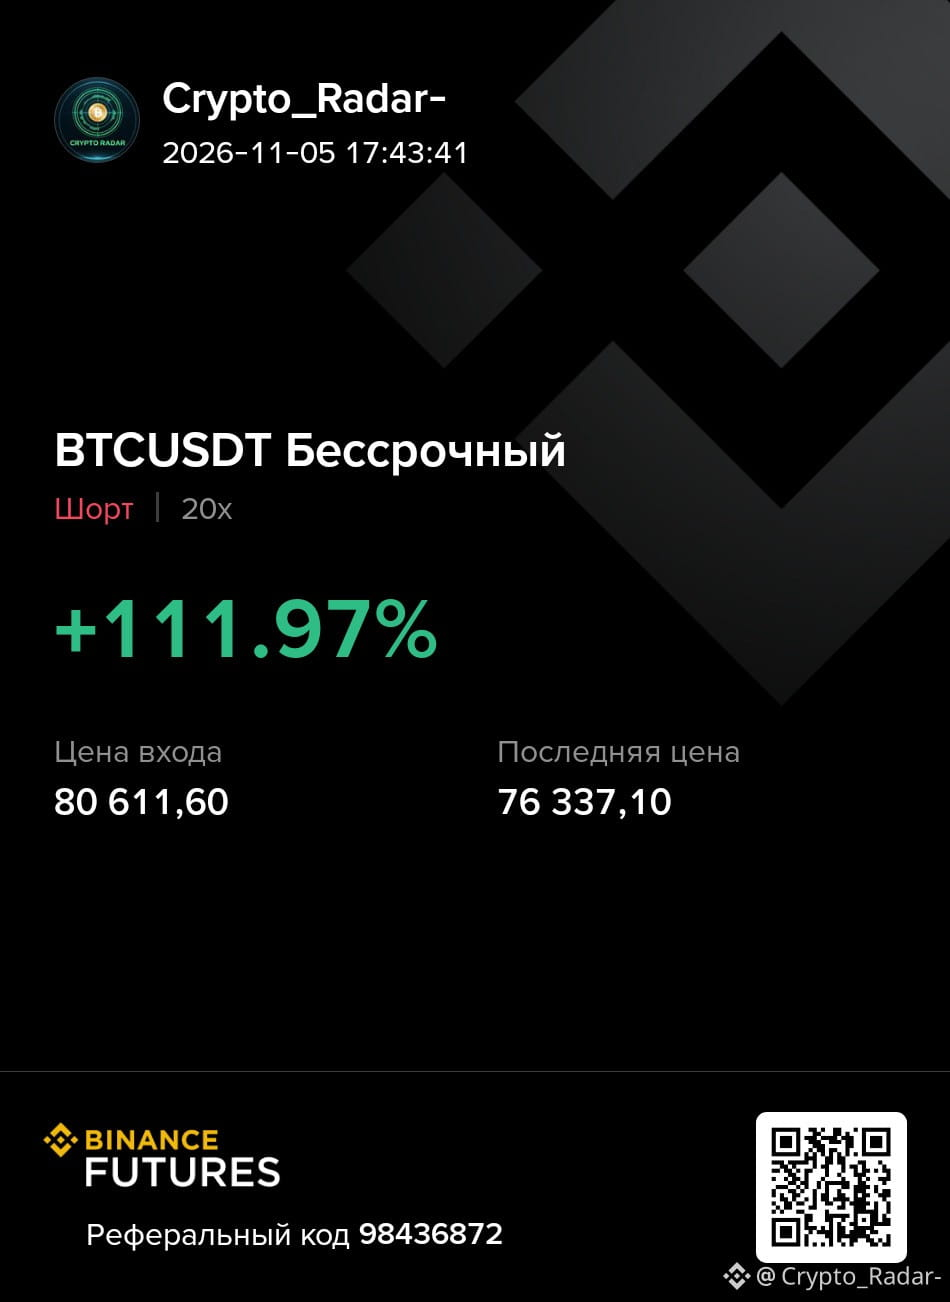
Break below the $80,000 level (50-day exponential moving average).
Short position in the $80,000–$81,000 range, as planned.
Break below the $80,000 level (50-day exponential moving average).
Short position in the $80,000–$81,000 range, as planned.
12
💰 $BTC
{future}(BTCUSDT)
Break below the $80,000 level (50-day exponential moving average).
Short position in the $80,000–$81,000 range, as planned.
💰 $BTC
Break below the $80,000 level (50-day exponential moving average).
Short position in the $80,000–$81,000 range, as planned.
Break below the $80,000 level (50-day exponential moving average).
Short position in the $80,000–$81,000 range, as planned.
1
3
2.3k
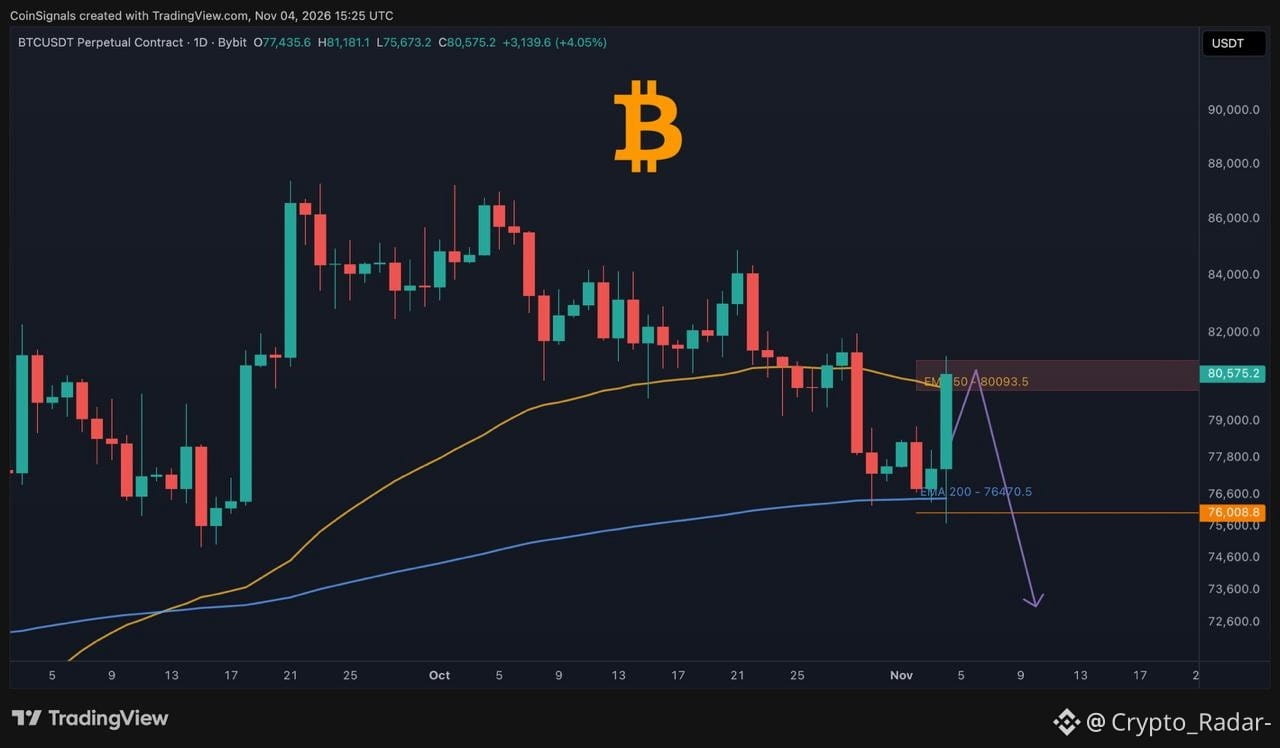
💰 Price $BTC , as expected, fell below $76,000 and found support at the 200-day exponential moving average (EMA).
A bounce toward $78,500–$80,000 (the 50-day EMA) is expected, after which another decline toward $73,000 may follow.
We are holding short positions from several levels, starting at $86,000. We will actively add to our positions within the highlighted red zone.
{future}(BTCUSDT)
💰 Price $BTC , as expected, fell below $76,000 and found support at the 200-day exponential moving average (EMA).
A bounce toward $78,500–$80,000 (the 50-day EMA) is expected, after which another decline toward $73,000 may follow.
We are holding short positions from several levels, starting at $86,000. We will actively add to our positions within the highlighted red zone.
A bounce toward $78,500–$80,000 (the 50-day EMA) is expected, after which another decline toward $73,000 may follow.
We are holding short positions from several levels, starting at $86,000. We will actively add to our positions within the highlighted red zone.
3
1.8k
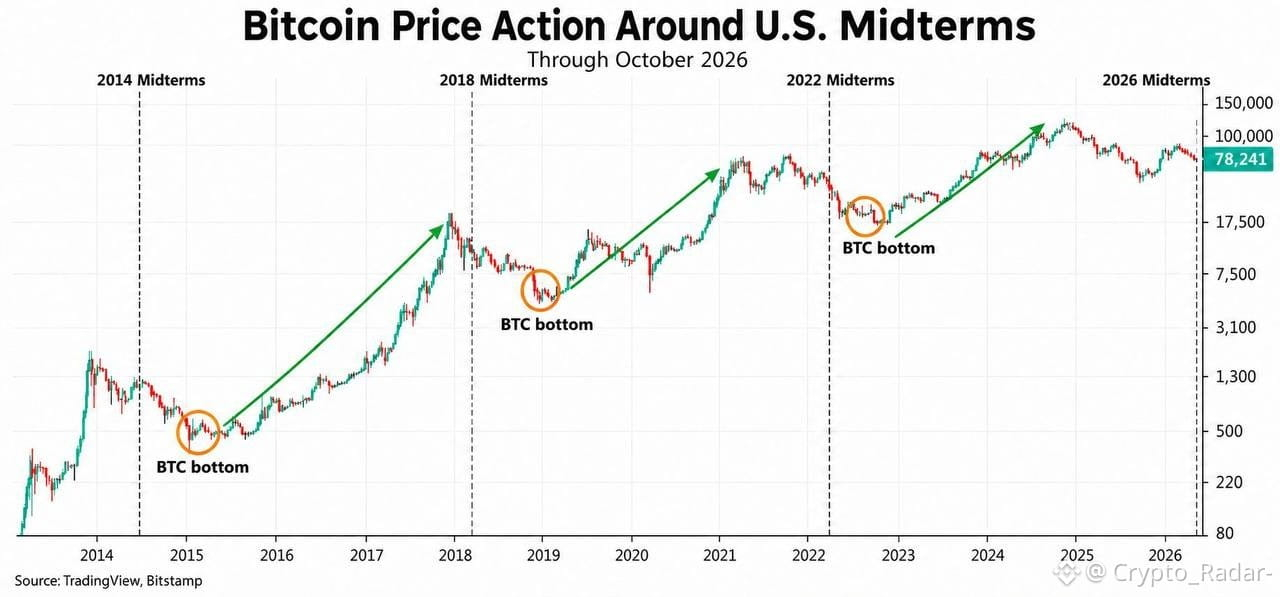
🚨$BTC The last THREE Bitcoin cycle lows occurred shortly after the U.S. midterm elections.
2014 → 71 days later
2018 → 39 days later
2022 → 13 days later
The next U.S. midterm elections are today, November 3.
This matches our forecast: "A low in late November or mid-December."
{future}(BTCUSDT)
🚨$BTC The last THREE Bitcoin cycle lows occurred shortly after the U.S. midterm elections.
2014 → 71 days later
2018 → 39 days later
2022 → 13 days later
The next U.S. midterm elections are today, November 3.
This matches our forecast: "A low in late November or mid-December."
2014 → 71 days later
2018 → 39 days later
2022 → 13 days later
The next U.S. midterm elections are today, November 3.
This matches our forecast: "A low in late November or mid-December."
4
7k
Today, the U.S. is holding midterm elections. 🇺🇸
Control of Congress is at stake, and the outcome could affect stock, cryptocurrency, and bond prices, as well as the dollar exchange rate.
* <b>Republican victory:</b> fewer obstacles to cryptocurrency development, but interest rates and the dollar could rise.
* <b>Democratic victory:</b> longer discussions about cryptocurrencies and deeper budget disagreements.
* <b>Divided Congress:</b> passing important laws becomes harder, with greater uncertainty around funding.
* <b>Uncertain or prolonged result:</b> short-term volatility until the situation becomes clear.
Don’t try to predict the first move. Manage your risks. 👊
Today, the U.S. is holding midterm elections. 🇺🇸
Control of Congress is at stake, and the outcome could affect stock, cryptocurrency, and bond prices, as well as the dollar exchange rate.
* <b>Republican victory:</b> fewer obstacles to cryptocurrency development, but interest rates and the dollar could rise.
* <b>Democratic victory:</b> longer discussions about cryptocurrencies and deeper budget disagreements.
* <b>Divided Congress:</b> passing important laws becomes harder, with greater uncertainty around funding.
* <b>Uncertain or prolonged result:</b> short-term volatility until the situation becomes clear.
Don’t try to predict the first move. Manage your risks. 👊
Control of Congress is at stake, and the outcome could affect stock, cryptocurrency, and bond prices, as well as the dollar exchange rate.
* <b>Republican victory:</b> fewer obstacles to cryptocurrency development, but interest rates and the dollar could rise.
* <b>Democratic victory:</b> longer discussions about cryptocurrencies and deeper budget disagreements.
* <b>Divided Congress:</b> passing important laws becomes harder, with greater uncertainty around funding.
* <b>Uncertain or prolonged result:</b> short-term volatility until the situation becomes clear.
Don’t try to predict the first move. Manage your risks. 👊
388
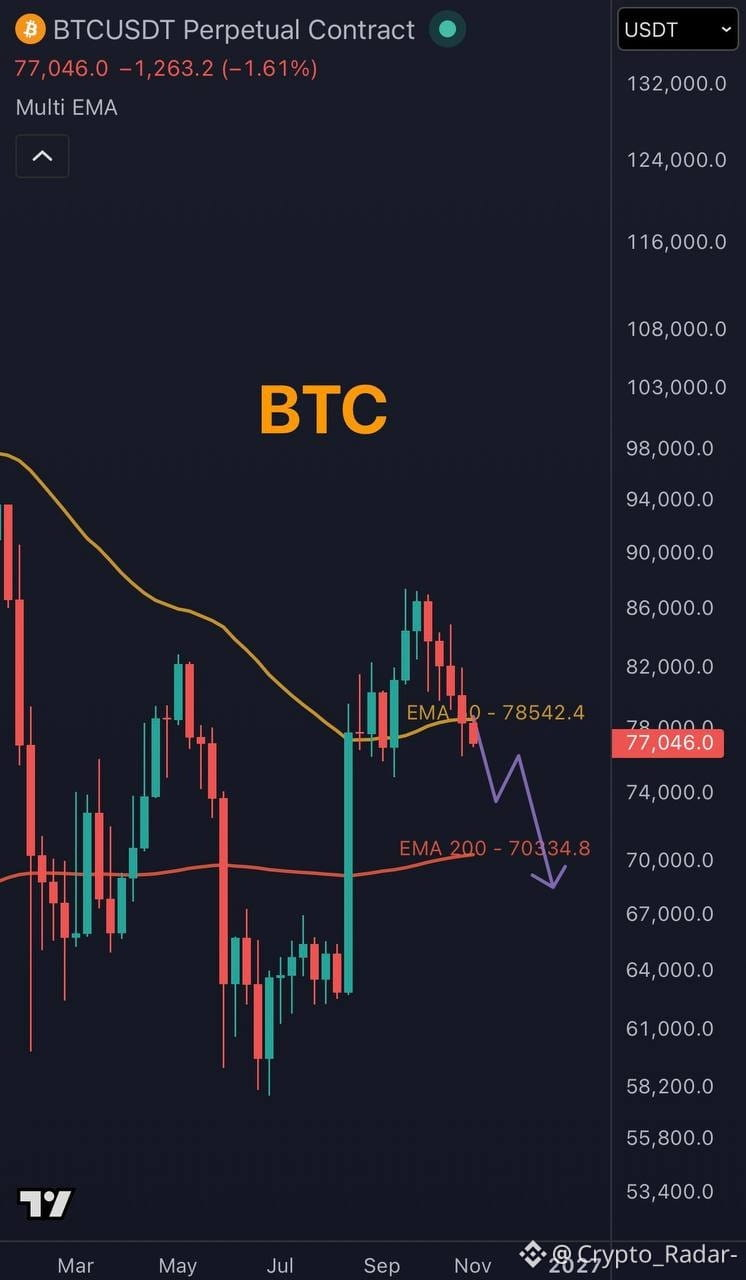
💰🚨 Bitcoin has lost the 50-week exponential moving average (bull/bear market indicator).
$BTC
If it fails to climb back above this level, it could plunge to the 200-week exponential moving average, in the $69,000–$70,000 range.
{future}(BTCUSDT)
💰🚨 Bitcoin has lost the 50-week exponential moving average (bull/bear market indicator).
$BTC
If it fails to climb back above this level, it could plunge to the 200-week exponential moving average, in the $69,000–$70,000 range.
$BTC
If it fails to climb back above this level, it could plunge to the 200-week exponential moving average, in the $69,000–$70,000 range.
1
1.3k
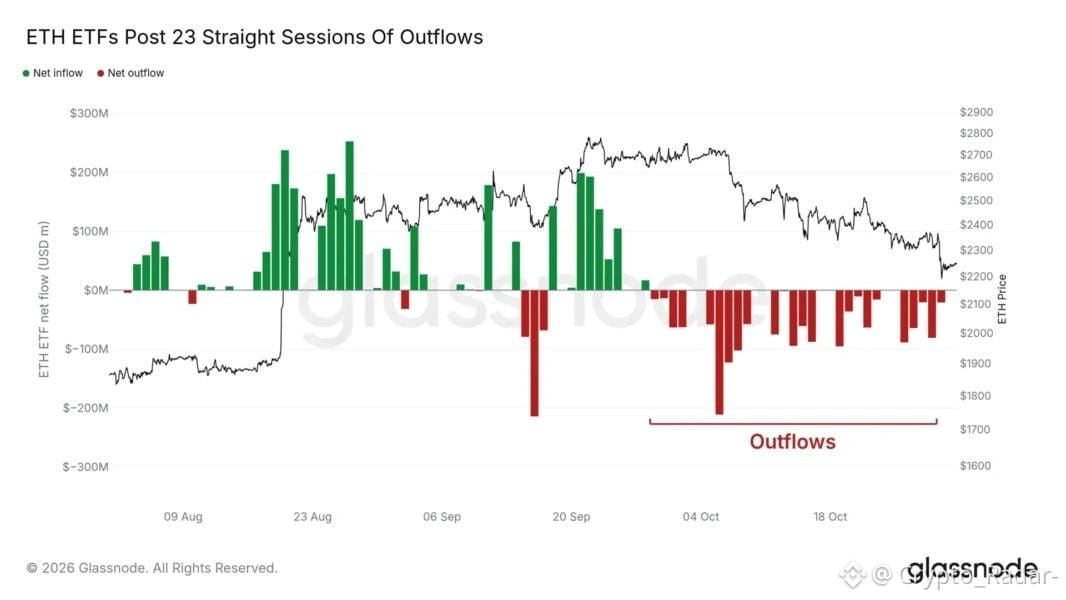
📉💰 Spot ETFs for $ETH have recorded net outflows for 23 consecutive trading days—the longest streak since their launch.
📉💰 Spot ETFs for $ETH have recorded net outflows for 23 consecutive trading days—the longest streak since their launch.
132
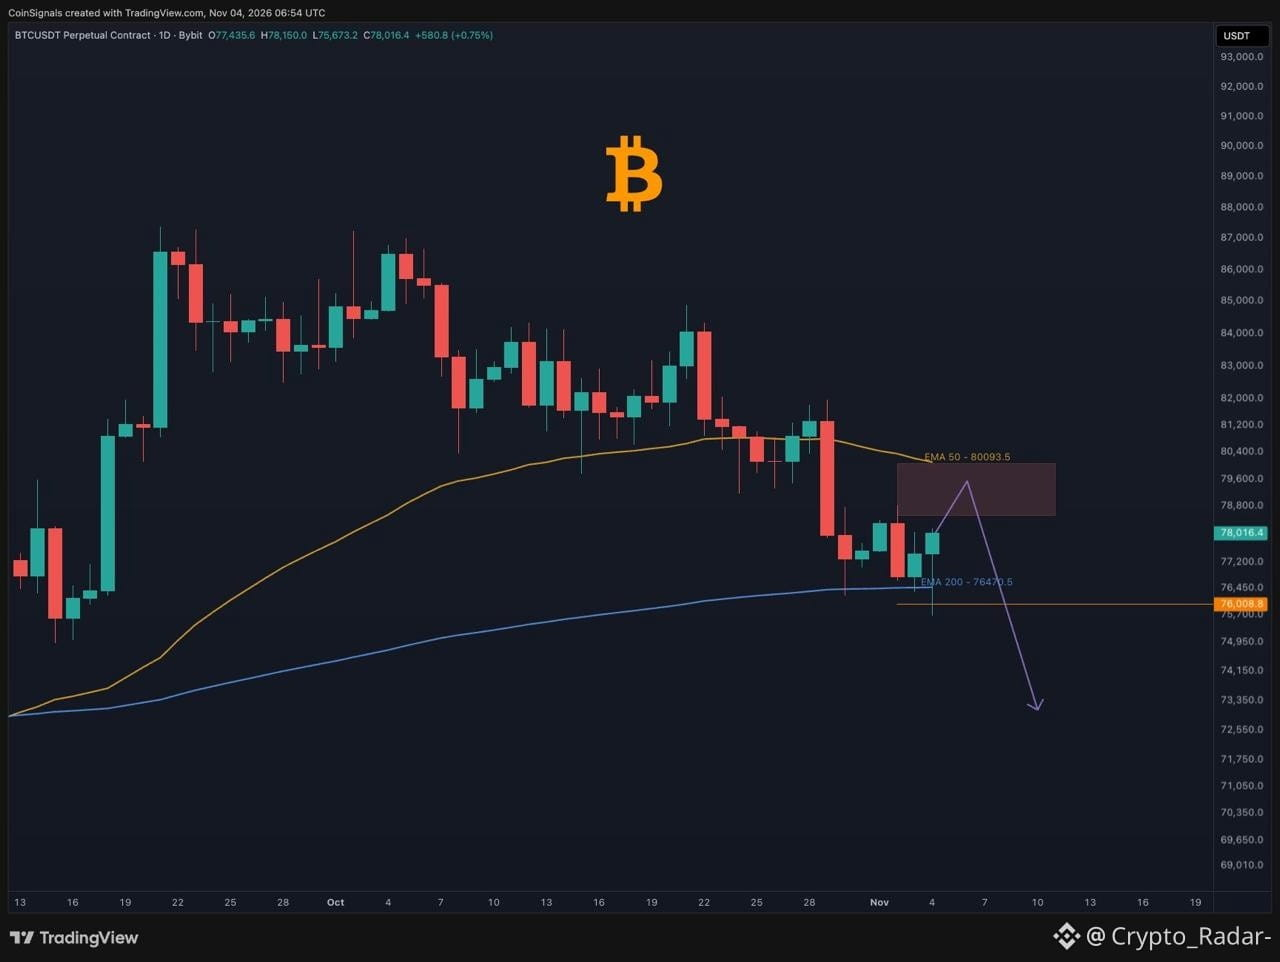
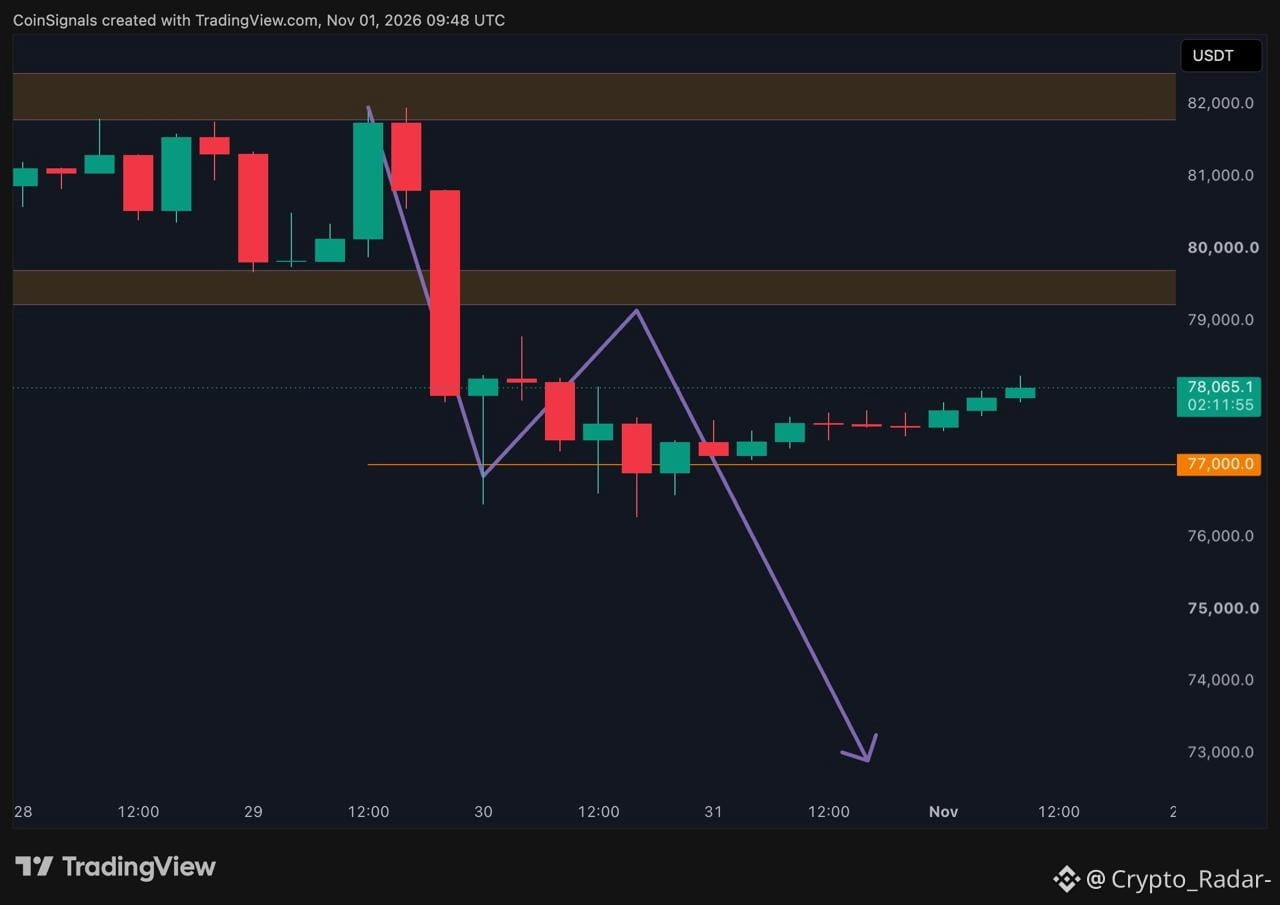
💰 The price $BTC reached our target of $82,000, then fell to $77,000.
It then bounced back into the $78,500–$79,500 range before dropping to $76,000, as expected.
We may see another attempt to break through the $78,000–$79,500 range before the price moves down toward $75,000.
💰 The price $BTC reached our target of $82,000, then fell to $77,000.
It then bounced back into the $78,500–$79,500 range before dropping to $76,000, as expected.
We may see another attempt to break through the $78,000–$79,500 range before the price moves down toward $75,000.
It then bounced back into the $78,500–$79,500 range before dropping to $76,000, as expected.
We may see another attempt to break through the $78,000–$79,500 range before the price moves down toward $75,000.
3
3.3k
Market Analysis
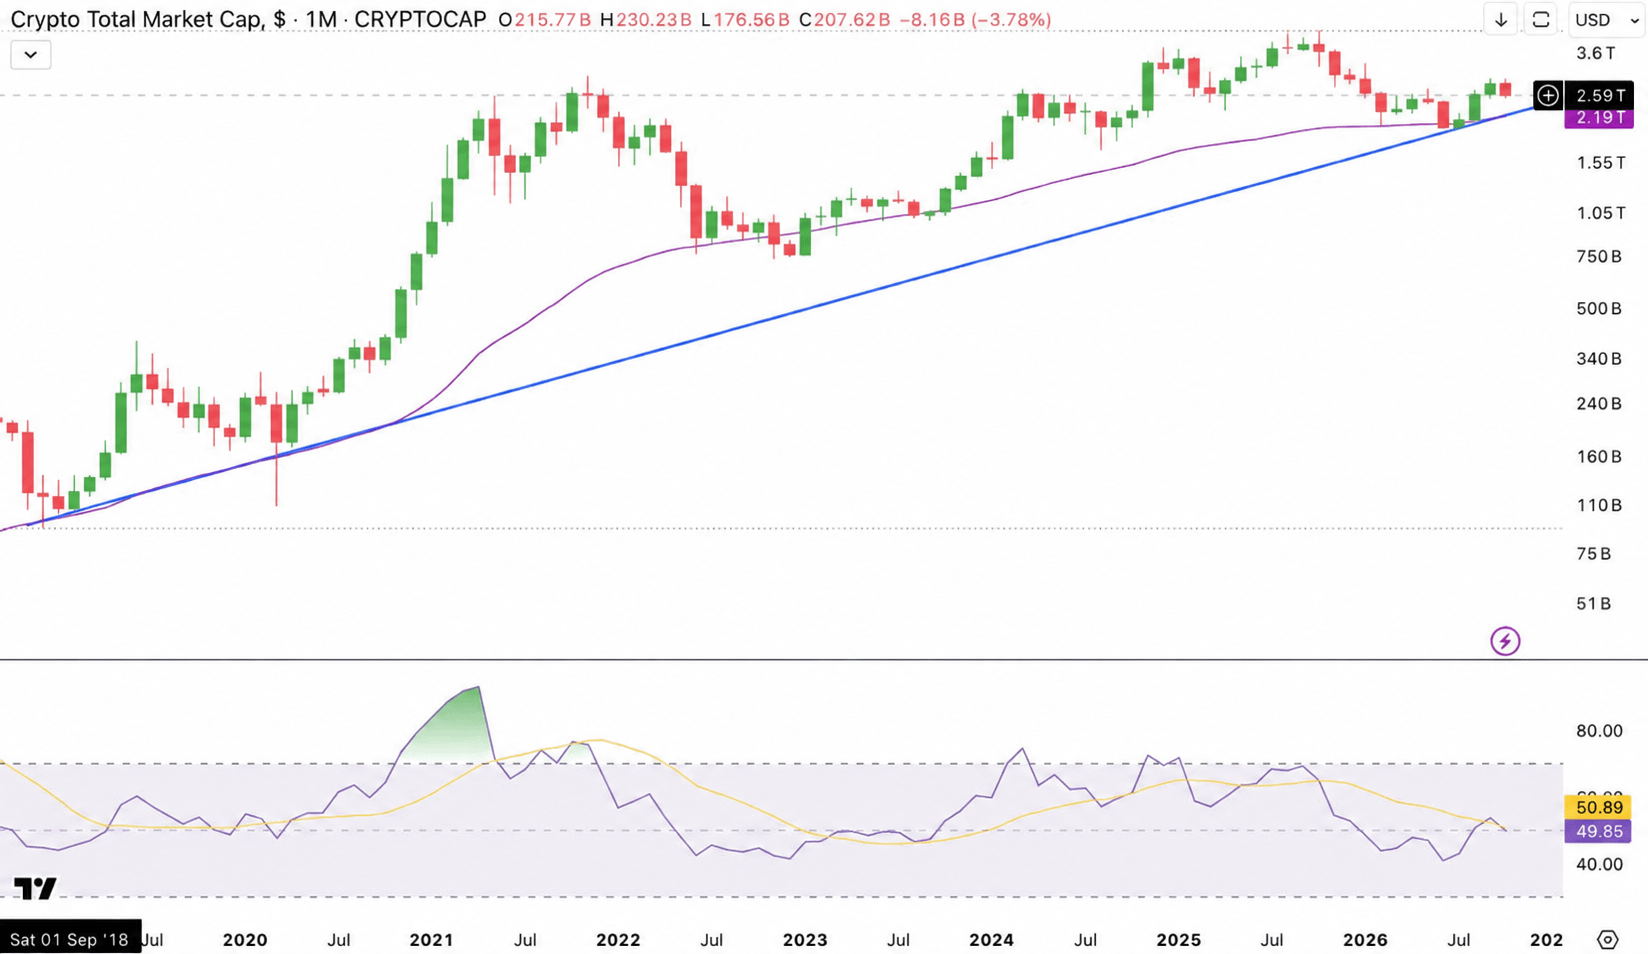
The total cryptocurrency market capitalization in October was $2.59 trillion, marking a decline after the growth seen over the previous two months. The market structure remains stable: the long-term uptrend line that began at the 2018 lows and the 50-day moving average are both near $2.19 trillion. The RSI indicator also ended the month near 50, pointing to neutral momentum at the start of November.
Bullish scenario: holding above $2.19 trillion and returning to $2.80 trillion would open the way to $3.00 trillion and the highs of $3.60 trillion.
Bearish scenario: a break below $2.19 trillion late in the month and a breach of the uptrend line could lead to a decline to $1.55 trillion.
Is October’s decline just a temporary pause in the broader uptrend, or the beginning of a deeper correction?
#Binance
Market Analysis
The total cryptocurrency market capitalization in October was $2.59 trillion, marking a decline after the growth seen over the previous two months. The market structure remains stable: the long-term uptrend line that began at the 2018 lows and the 50-day moving average are both near $2.19 trillion. The RSI indicator also ended the month near 50, pointing to neutral momentum at the start of November.
Bullish scenario: holding above $2.19 trillion and returning to $2.80 trillion would open the way to $3.00 trillion and the highs of $3.60 trillion.
Bearish scenario: a break below $2.19 trillion late in the month and a breach of the uptrend line could lead to a decline to $1.55 trillion.
Is October’s decline just a temporary pause in the broader uptrend, or the beginning of a deeper correction?
#Binance
The total cryptocurrency market capitalization in October was $2.59 trillion, marking a decline after the growth seen over the previous two months. The market structure remains stable: the long-term uptrend line that began at the 2018 lows and the 50-day moving average are both near $2.19 trillion. The RSI indicator also ended the month near 50, pointing to neutral momentum at the start of November.
Bullish scenario: holding above $2.19 trillion and returning to $2.80 trillion would open the way to $3.00 trillion and the highs of $3.60 trillion.
Bearish scenario: a break below $2.19 trillion late in the month and a breach of the uptrend line could lead to a decline to $1.55 trillion.
Is October’s decline just a temporary pause in the broader uptrend, or the beginning of a deeper correction?
#Binance
123
November 2022 vs. November 2026 👀
📉 November 2022:
• Federal Reserve interest rates: 3.75–4%
• FTX collapse
• U.S. midterm elections
• Crypto market lows
🔄 By November 2026:
• Federal Reserve interest rates: 3.75–4%
• Binance hack
• U.S. midterm elections
• The next crypto market low?
A 4-year difference. Almost identical situations. 💀
November 2022 vs. November 2026 👀
📉 November 2022:
• Federal Reserve interest rates: 3.75–4%
• FTX collapse
• U.S. midterm elections
• Crypto market lows
🔄 By November 2026:
• Federal Reserve interest rates: 3.75–4%
• Binance hack
• U.S. midterm elections
• The next crypto market low?
A 4-year difference. Almost identical situations. 💀
📉 November 2022:
• Federal Reserve interest rates: 3.75–4%
• FTX collapse
• U.S. midterm elections
• Crypto market lows
🔄 By November 2026:
• Federal Reserve interest rates: 3.75–4%
• Binance hack
• U.S. midterm elections
• The next crypto market low?
A 4-year difference. Almost identical situations. 💀
97
$BTC $ETH November 2022 vs. November 2026 👀
📉 November 2022:
• Federal Reserve interest rates: 3.75–4%
• FTX collapse
• U.S. midterm elections
• Crypto lows
🔄 By November 2026:
• Federal Reserve interest rates: 3.75–4%
• Binance hack
• U.S. midterm elections
• The next crypto low?
A 4-year difference. An almost identical situation. 💀
$BTC $ETH November 2022 vs. November 2026 👀
📉 November 2022:
• Federal Reserve interest rates: 3.75–4%
• FTX collapse
• U.S. midterm elections
• Crypto lows
🔄 By November 2026:
• Federal Reserve interest rates: 3.75–4%
• Binance hack
• U.S. midterm elections
• The next crypto low?
A 4-year difference. An almost identical situation. 💀
📉 November 2022:
• Federal Reserve interest rates: 3.75–4%
• FTX collapse
• U.S. midterm elections
• Crypto lows
🔄 By November 2026:
• Federal Reserve interest rates: 3.75–4%
• Binance hack
• U.S. midterm elections
• The next crypto low?
A 4-year difference. An almost identical situation. 💀
4
$BTC Price reduction targets (Base case / Worst-case scenario)
• In October, below $80,000 / $70,000
• In November, below $70,000 / $60,000
December: significant rise — “money printing” 🚀
{future}(BTCUSDT)
$BTC Price reduction targets (Base case / Worst-case scenario)
• In October, below $80,000 / $70,000
• In November, below $70,000 / $60,000
December: significant rise — “money printing” 🚀
• In October, below $80,000 / $70,000
• In November, below $70,000 / $60,000
December: significant rise — “money printing” 🚀
188
$BTC 82 000 US dollars -> 77 000 US dollars ✅
$BTC 82 000 US dollars -> 77 000 US dollars ✅
Crypto_Radar-
·
--
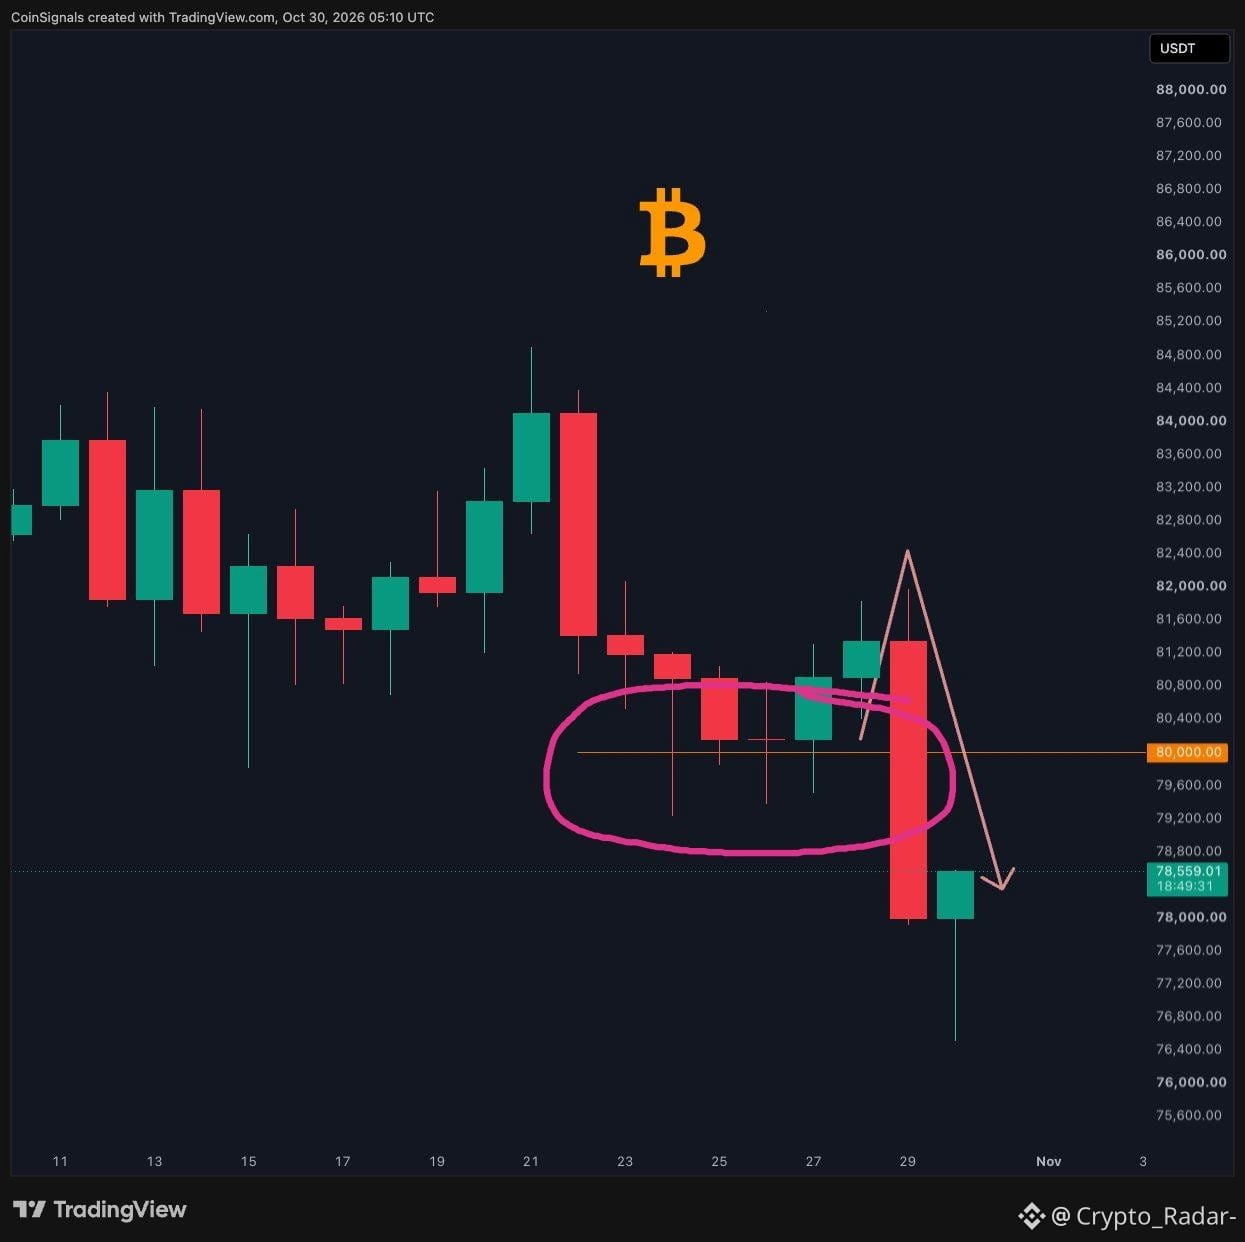
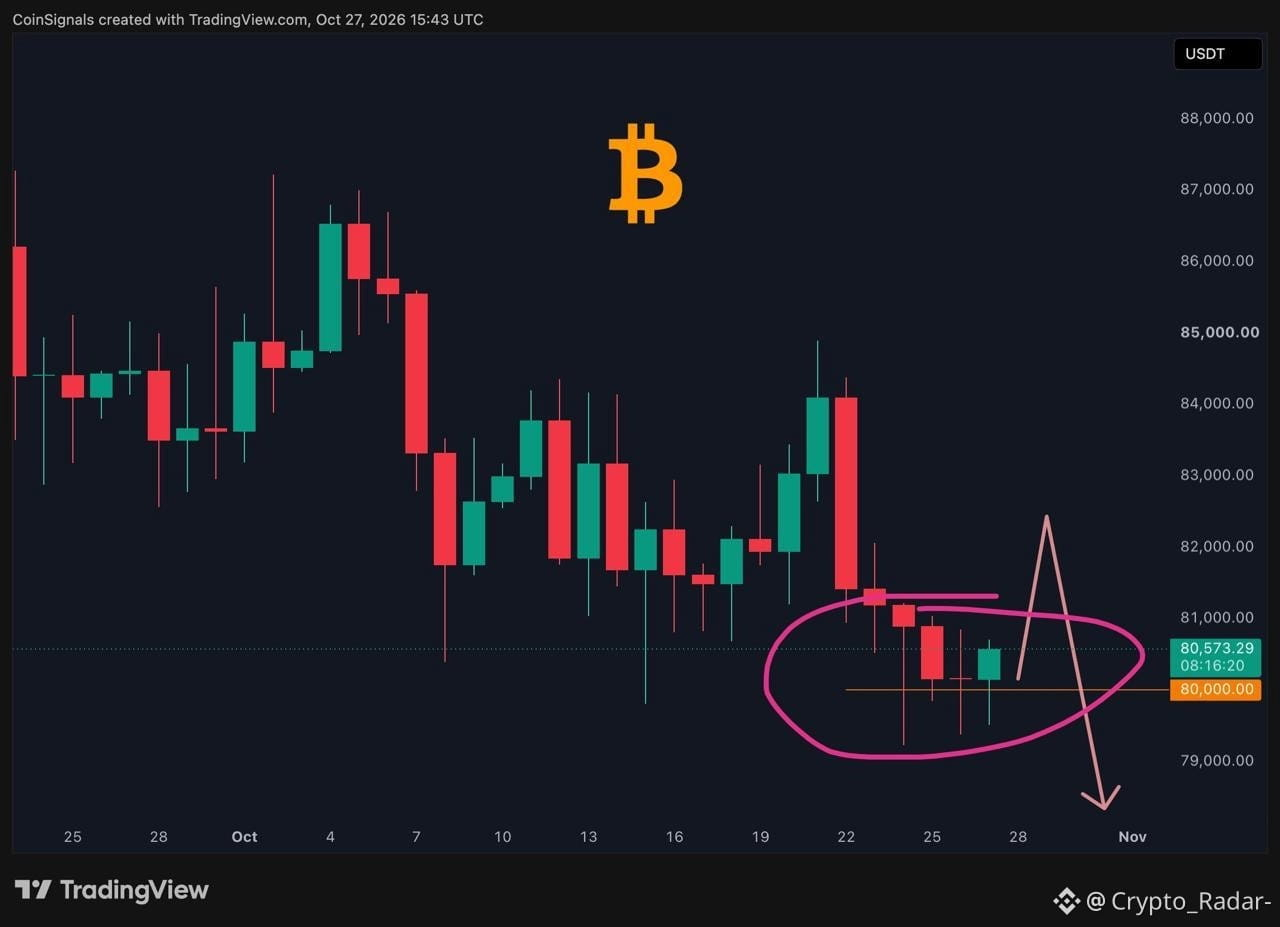
🚨💰 The price $BTC has fallen below the $80,000 mark four times in the past 4 days.
However, each time the price returned above $80,000, preventing a major sell-off.
We expect another small spike, followed by price manipulation driven by FOMC actions, before the real drop begins.
However, each time the price returned above $80,000, preventing a major sell-off.
We expect another small spike, followed by price manipulation driven by FOMC actions, before the real drop begins.
150
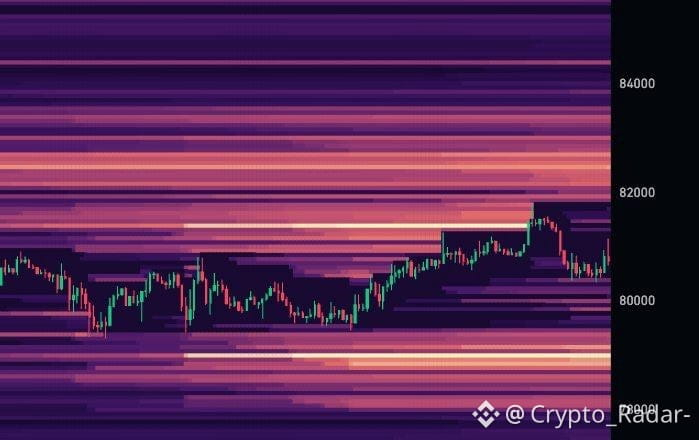
$BTC 💰⚠️ A large volume of sell orders is below the $80,000 mark. It will likely be cleared quickly.
{future}(BTCUSDT)
$BTC 💰⚠️ A large volume of sell orders is below the $80,000 mark. It will likely be cleared quickly.
1.1k
🇺🇸 The Federal Reserve kept interest rates at their current level.$BTC
🇺🇸 The Federal Reserve kept interest rates at their current level.$BTC
78
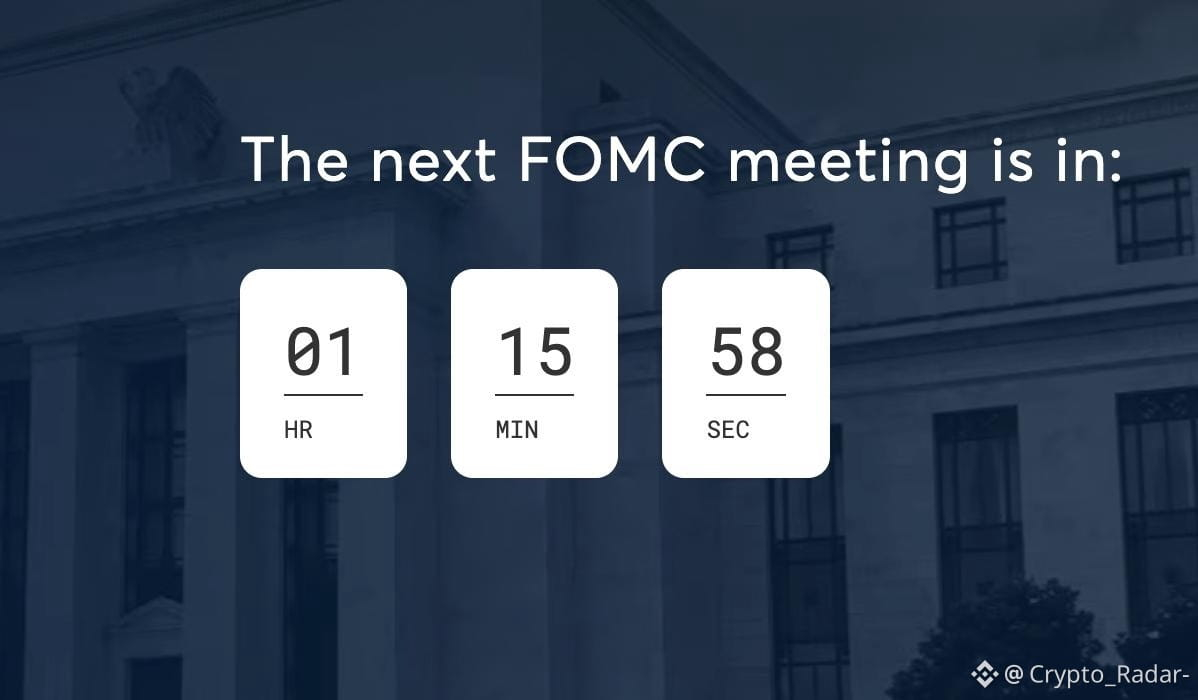
⚠️ Reminder: The Federal Open Market Committee (FOMC) meeting will begin in 1 hour and 15 minutes.
$BTC $ETH
⚠️ Reminder: The Federal Open Market Committee (FOMC) meeting will begin in 1 hour and 15 minutes.
$BTC $ETH
$BTC $ETH
181
$HYPE Market Analysis
HYPE is currently at 81,444, showing strong growth after bouncing off the rising trendline formed from the early-August lows near 75,000. The price is now pushing toward the 81,000–82,000 zone, which has capped every recovery attempt since mid-October.
Bullish scenario: break above 82,000 and continue rising toward 86,000, paving the way back to the 90,000 zone.
Bearish scenario: bounce off the current level and fall below 78,000, bringing the price back to the trendline near 76,000.
Will the bounce off the trendline break through the upper boundary, or will price be rejected once again at resistance?
{future}(HYPEUSDT)
#hype
$HYPE Market Analysis
HYPE is currently at 81,444, showing strong growth after bouncing off the rising trendline formed from the early-August lows near 75,000. The price is now pushing toward the 81,000–82,000 zone, which has capped every recovery attempt since mid-October.
Bullish scenario: break above 82,000 and continue rising toward 86,000, paving the way back to the 90,000 zone.
Bearish scenario: bounce off the current level and fall below 78,000, bringing the price back to the trendline near 76,000.
Will the bounce off the trendline break through the upper boundary, or will price be rejected once again at resistance?
#hype
HYPE is currently at 81,444, showing strong growth after bouncing off the rising trendline formed from the early-August lows near 75,000. The price is now pushing toward the 81,000–82,000 zone, which has capped every recovery attempt since mid-October.
Bullish scenario: break above 82,000 and continue rising toward 86,000, paving the way back to the 90,000 zone.
Bearish scenario: bounce off the current level and fall below 78,000, bringing the price back to the trendline near 76,000.
Will the bounce off the trendline break through the upper boundary, or will price be rejected once again at resistance?
#hype
270
🚨💰 The price $BTC has fallen below the $80,000 mark four times in the past 4 days.
However, each time the price returned above $80,000, preventing a major sell-off.
We expect another small spike, followed by price manipulation driven by FOMC actions, before the real drop begins.
{future}(BTCUSDT)
🚨💰 The price $BTC has fallen below the $80,000 mark four times in the past 4 days.
However, each time the price returned above $80,000, preventing a major sell-off.
We expect another small spike, followed by price manipulation driven by FOMC actions, before the real drop begins.
However, each time the price returned above $80,000, preventing a major sell-off.
We expect another small spike, followed by price manipulation driven by FOMC actions, before the real drop begins.
1
1
2.3k
Log in to explore more content
Join global crypto users on Binance Square
⚡️ Get latest and useful information about crypto.
💬 Trusted by the world’s largest crypto exchange.
👍 Discover real insights from verified creators.
Email / Phone number
Trending Topics
HKSFCToExpandRestrictedTitlesList
31 views
32 Discussing
🚨 DON'T CHASE... WAIT FOR THIS ENTRY! 🚀
$KOMA just exploded over 55% and momentum is getting stronger. But smart traders don't FOMO into green candles.
📈 Trade Plan:
🟢 Entry: 0.0198 – 0.0202
🛑 Stop Loss: Below 0.0189
🎯 TP1: 0.0218
🎯 TP2: 0.0235
🎯 TP3: 0.0250
Volume is rising and buyers are still in control. If $KOMA holds above the breakout zone, another leg higher could follow.
⚠️ Never risk more than you can afford to lose. Wait for confirmation before entering.
👇 Are you BUYING, WAITING, or TAKING PROFITS?
#KOMA #HKSFCToExpandRestrictedTitlesList #JobsReportRaisesHikeOdds $IDOL
Adeem Jutt
·1 Likes
·139 views
JobsReportRaisesHikeOdds
582,007 views
3,673 Discussing
CPITestsDecemberRateOutlook
188,510 views
1,342 Discussing