

灯塔说
1.3k Posts

灯塔说
 Square Verified
老牌交易员,专注二级交易|投研,严谨计划交易,严格交易计划!合作|推特:@Cryptodengta

原创之星

NOKB Holder
Frequent Trader
7 Years
63 Following
13.9K+ Followers
19.6K+ Liked
1 Badges
Posts
All
Quotes
Videos
Live
PINNED

灯塔说
·
--
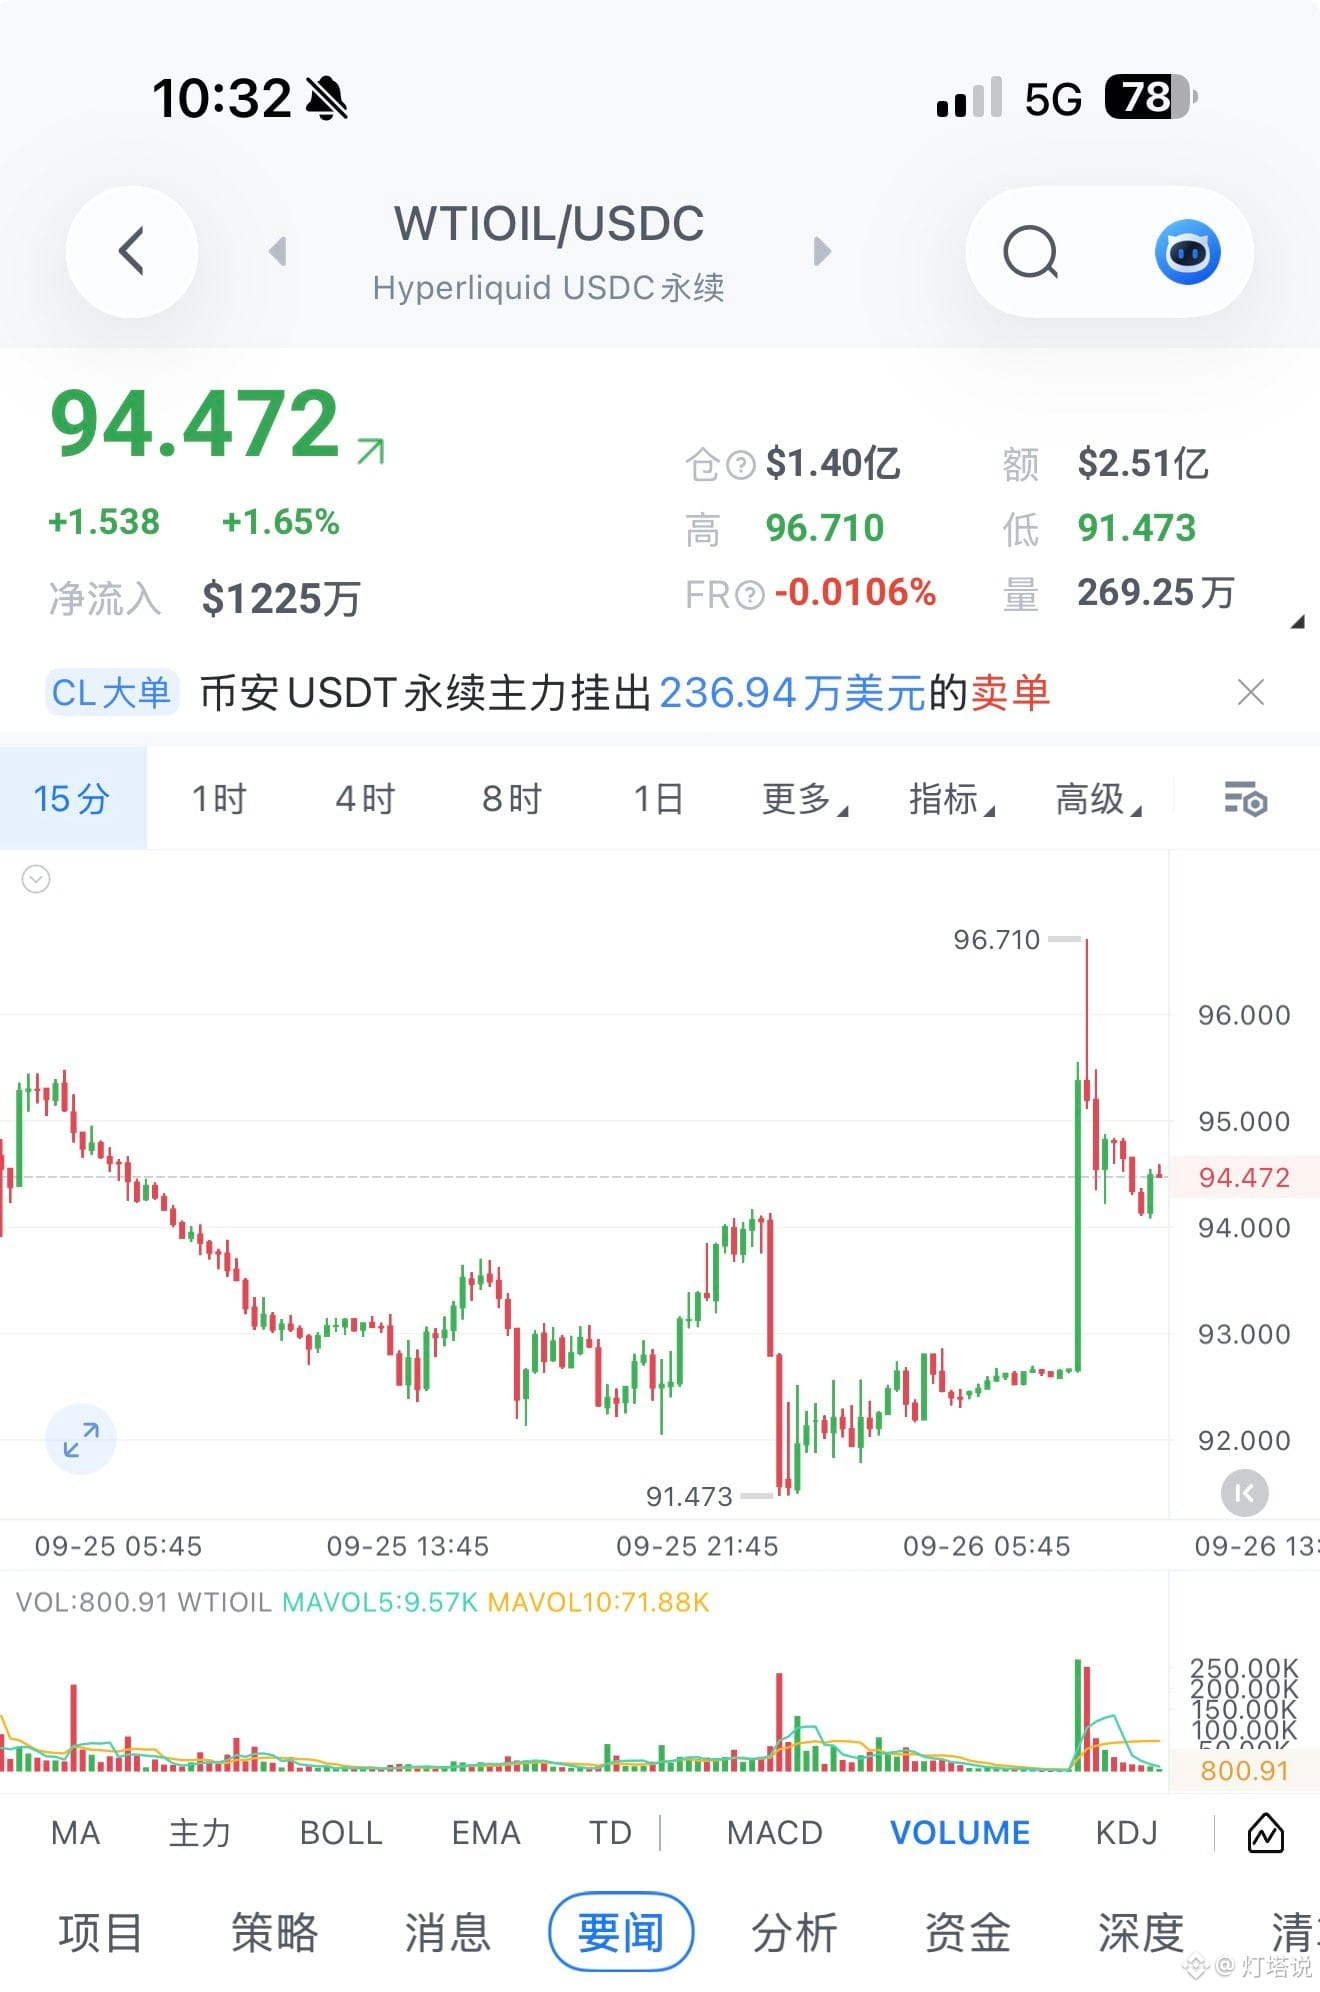
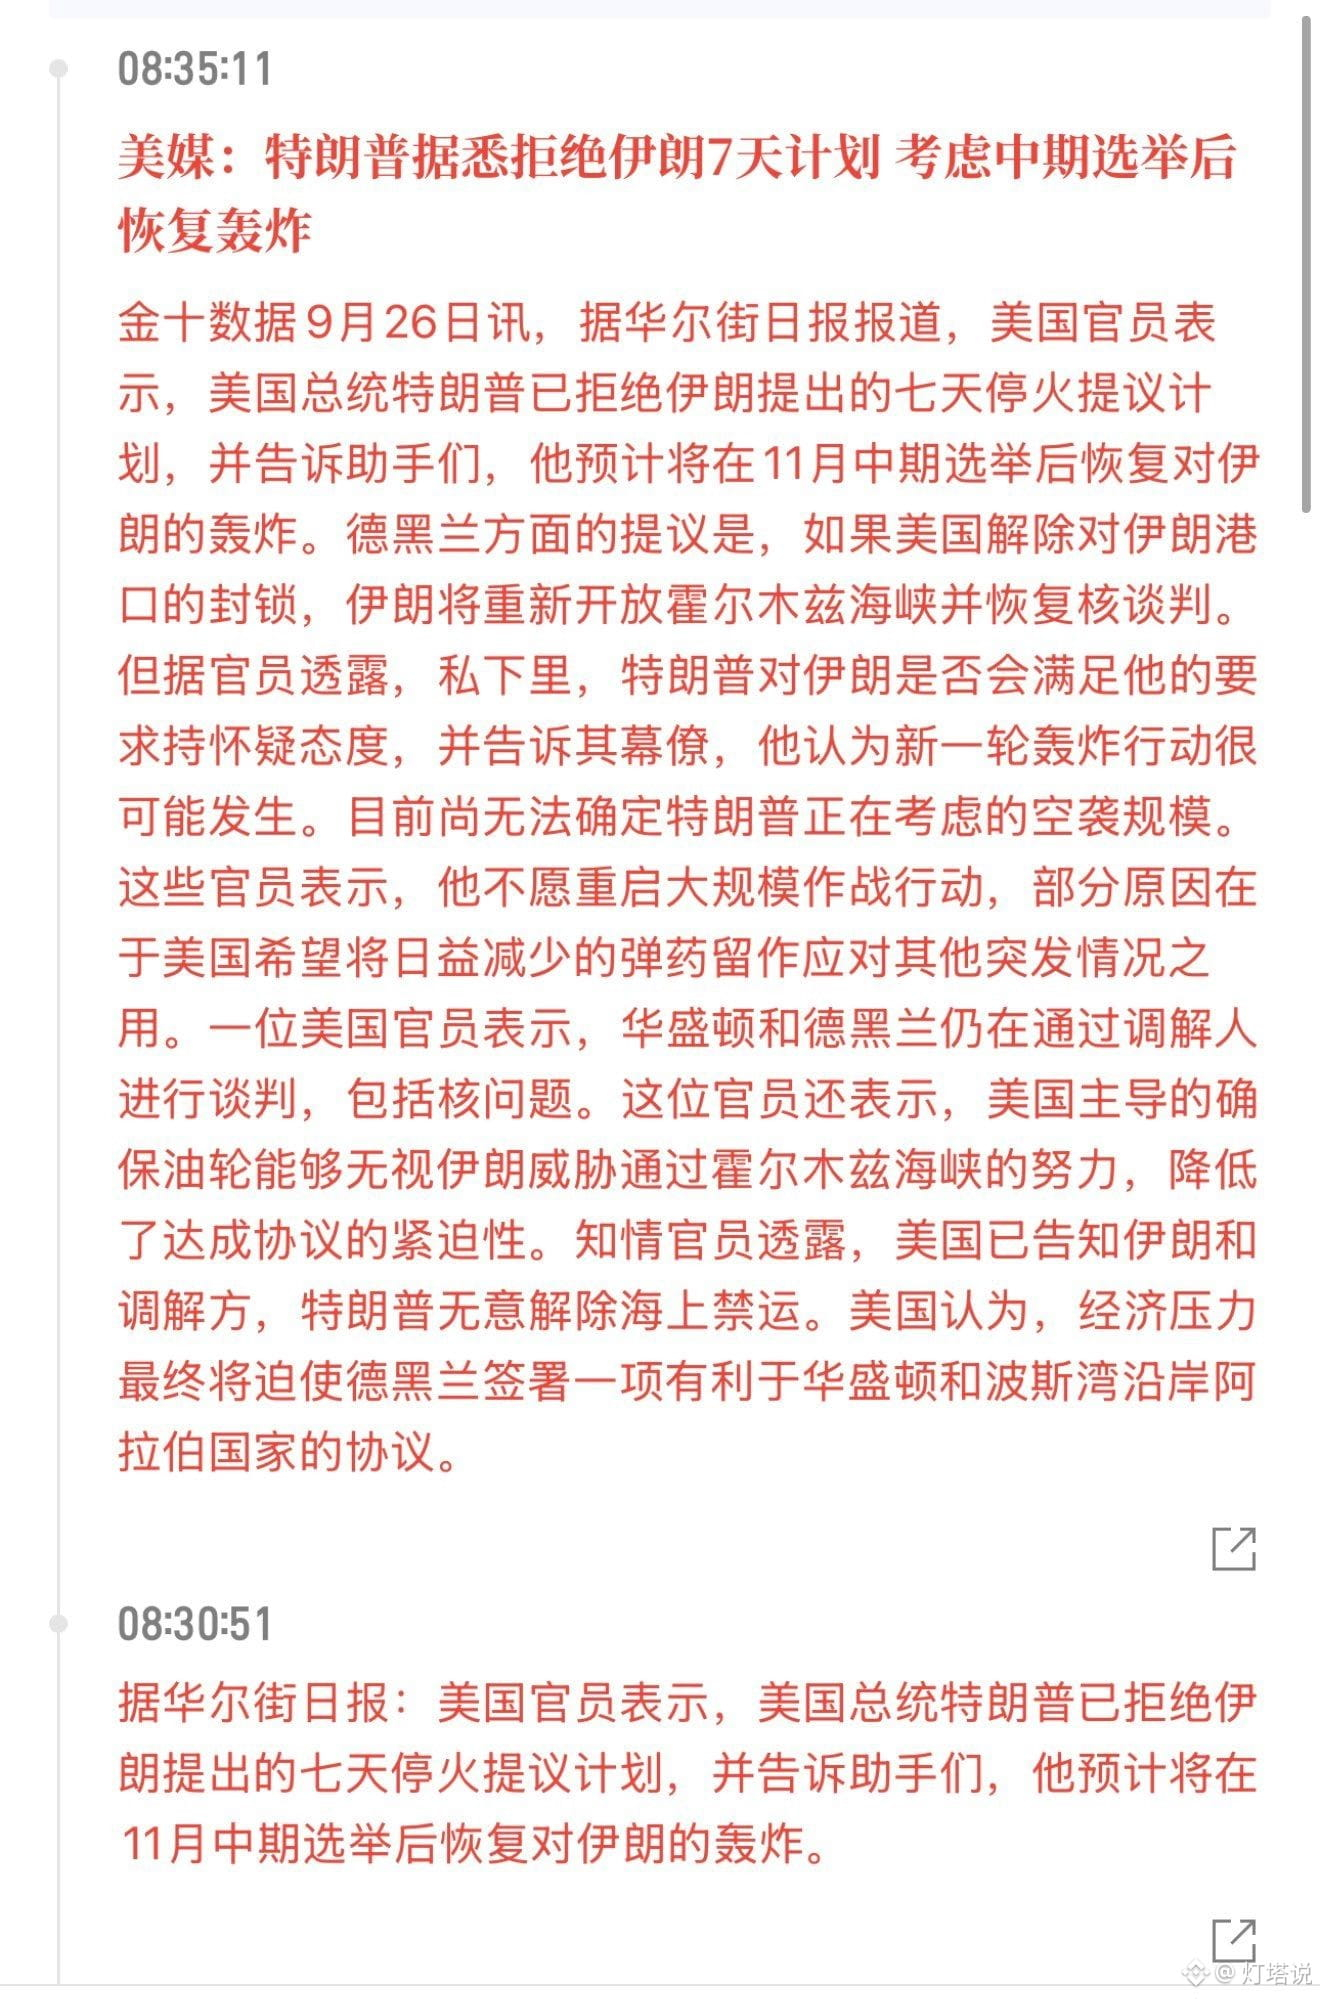
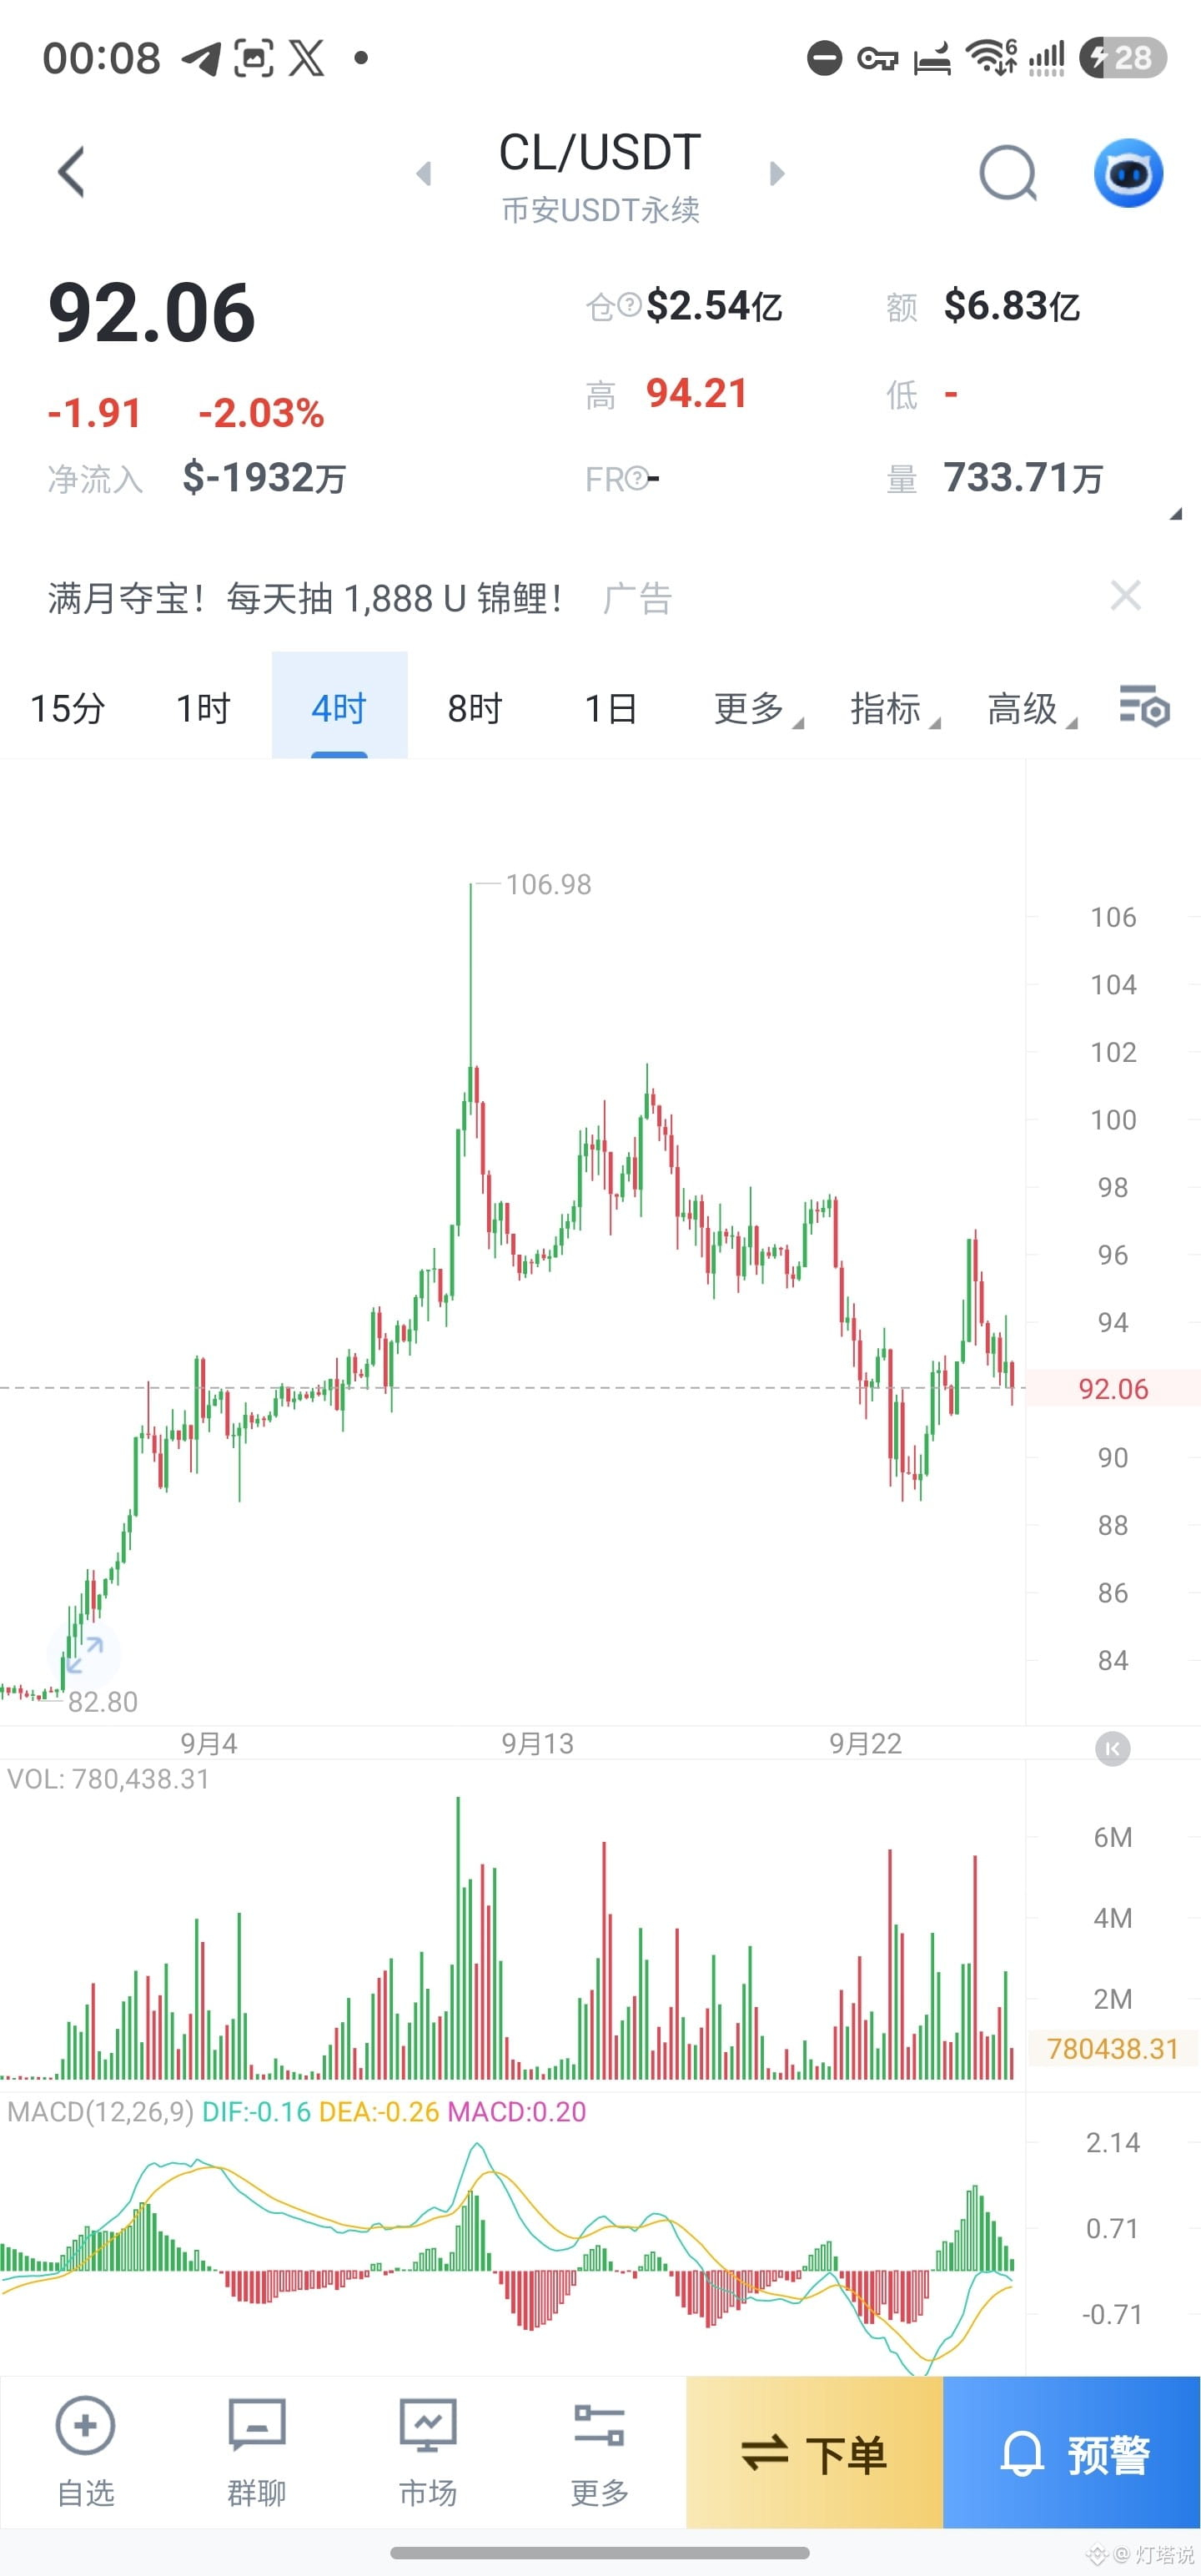
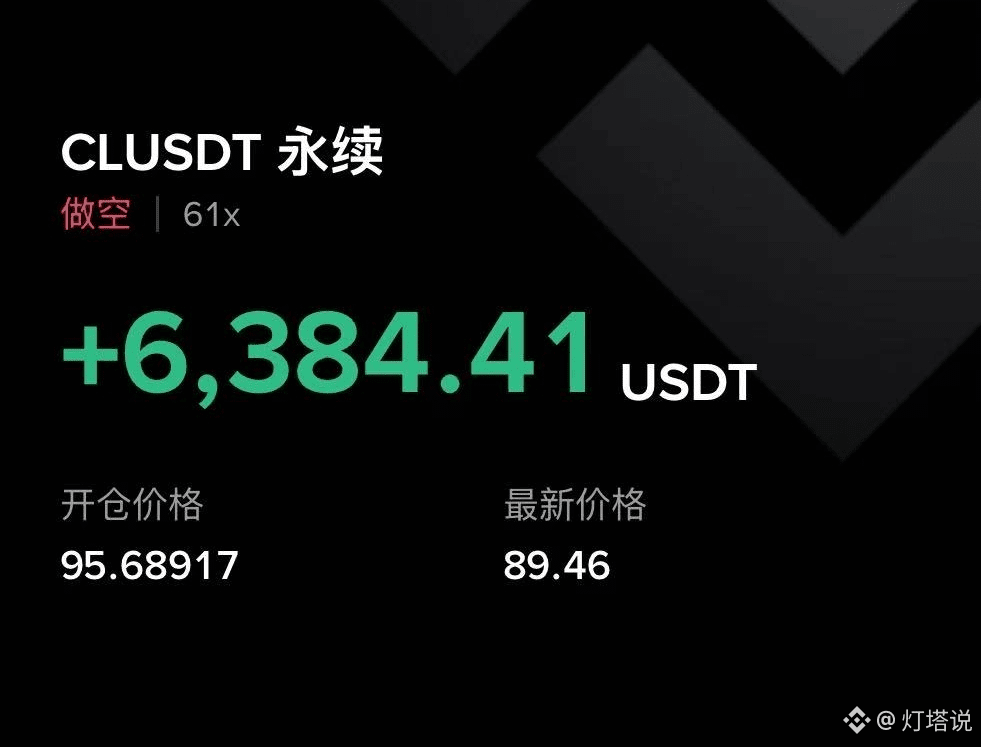
Crude oil and big pancakes: both go long and short, and let’s take a big bite
This comes from accurate judgment behind the price action
Crude oil: the forecast was fueled by speculation after negotiation news came out for several days
Big pancake: the forecast is based on the adjustment after the high-level pull-up showed weakness
$CL $BTC
This comes from accurate judgment behind the price action
Crude oil: the forecast was fueled by speculation after negotiation news came out for several days
Big pancake: the forecast is based on the adjustment after the high-level pull-up showed weakness
$CL $BTC

灯塔说
·
--
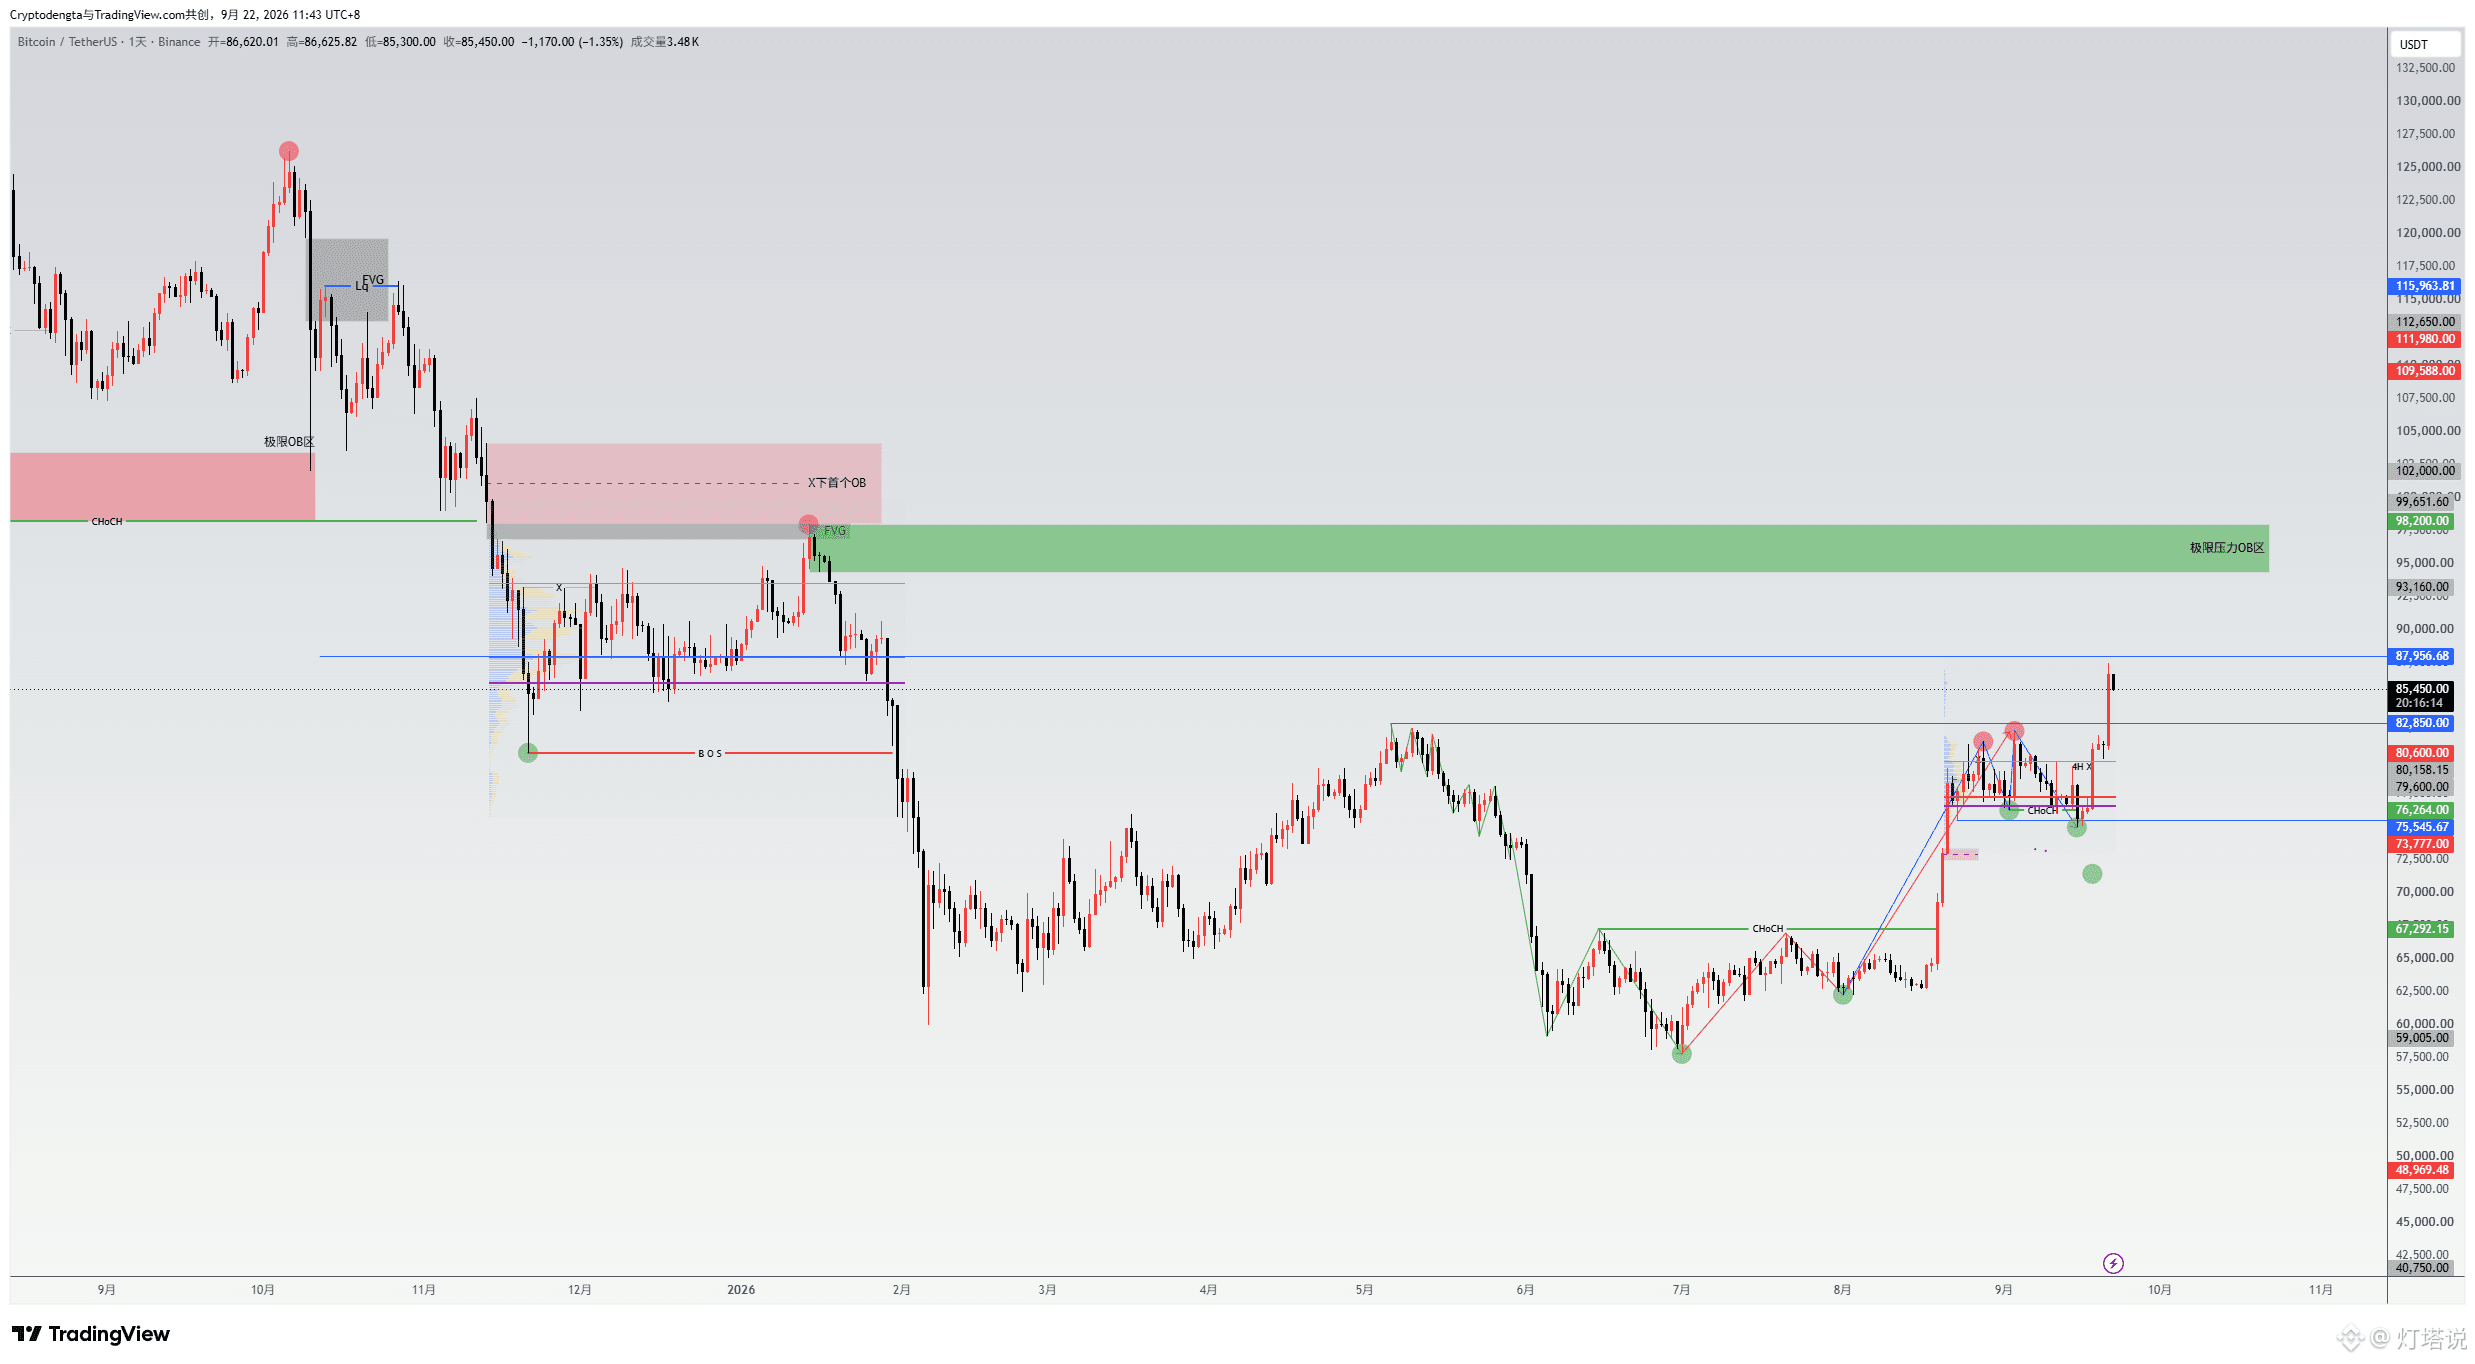
Simply put: $BTC
During yesterday’s BTC突破 85K, the market saw about $750 million in positions liquidated, of which around $648 million were short positions
That’s also why the price surged so fast
If this rally was driven by short liquidations, then breaking to new highs again to 90K would require more long positions buying in
Unless the price pulls back or ranges sideways at high levels to push up OI and increase buy-side demand.
This is not a warning to short
In the short term, watch around 84.6k for signs of a bounce and then look to go long again.
In terms of the trend: on the daily chart, below the 95–97K range, for now I’m only looking for a rebound. But the rebound profits have been very substantial, and it has also pulled some altcoins along—those who bravely bought the dip have already started to make money.
During yesterday’s BTC突破 85K, the market saw about $750 million in positions liquidated, of which around $648 million were short positions
That’s also why the price surged so fast
If this rally was driven by short liquidations, then breaking to new highs again to 90K would require more long positions buying in
Unless the price pulls back or ranges sideways at high levels to push up OI and increase buy-side demand.
This is not a warning to short
In the short term, watch around 84.6k for signs of a bounce and then look to go long again.
In terms of the trend: on the daily chart, below the 95–97K range, for now I’m only looking for a rebound. But the rebound profits have been very substantial, and it has also pulled some altcoins along—those who bravely bought the dip have already started to make money.
灯塔说
·
--
Jump like a pro:
In this round, the high point of $BTC should reach 95-97K
Along the way, 72-73K is a pullback low point
In this round, the high point of $BTC should reach 95-97K
Along the way, 72-73K is a pullback low point
灯塔说
·
--
Jump like a pro:
In this round, the high point of $BTC should reach 95-97K
Along the way, 72-73K is a pullback low point
In this round, the high point of $BTC should reach 95-97K
Along the way, 72-73K is a pullback low point
灯塔说
·
--
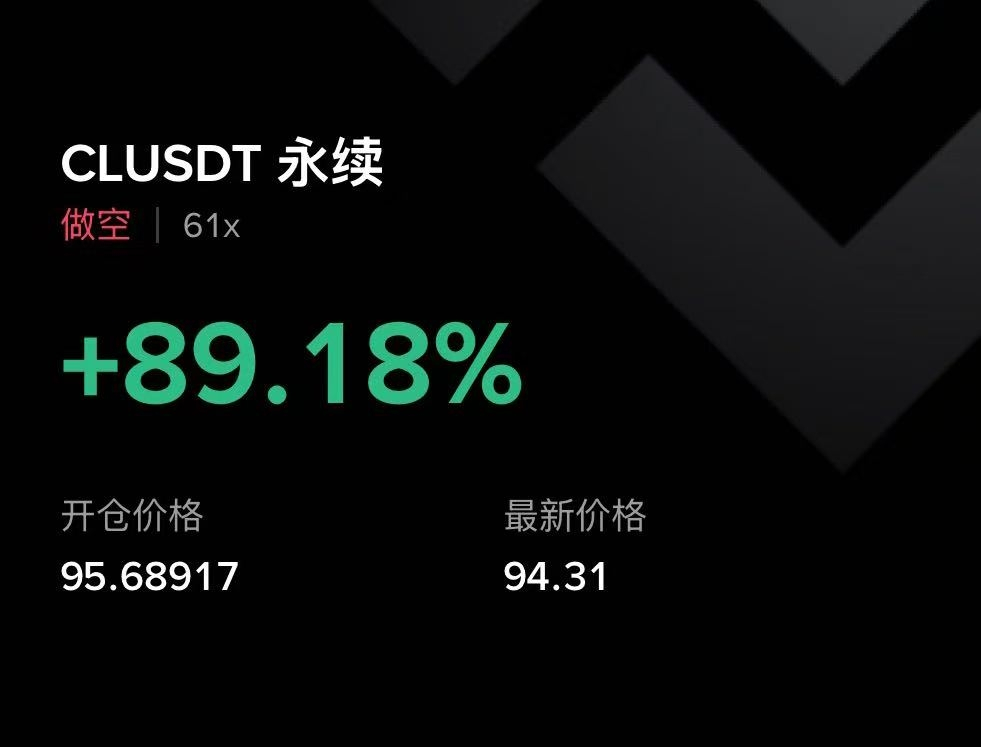
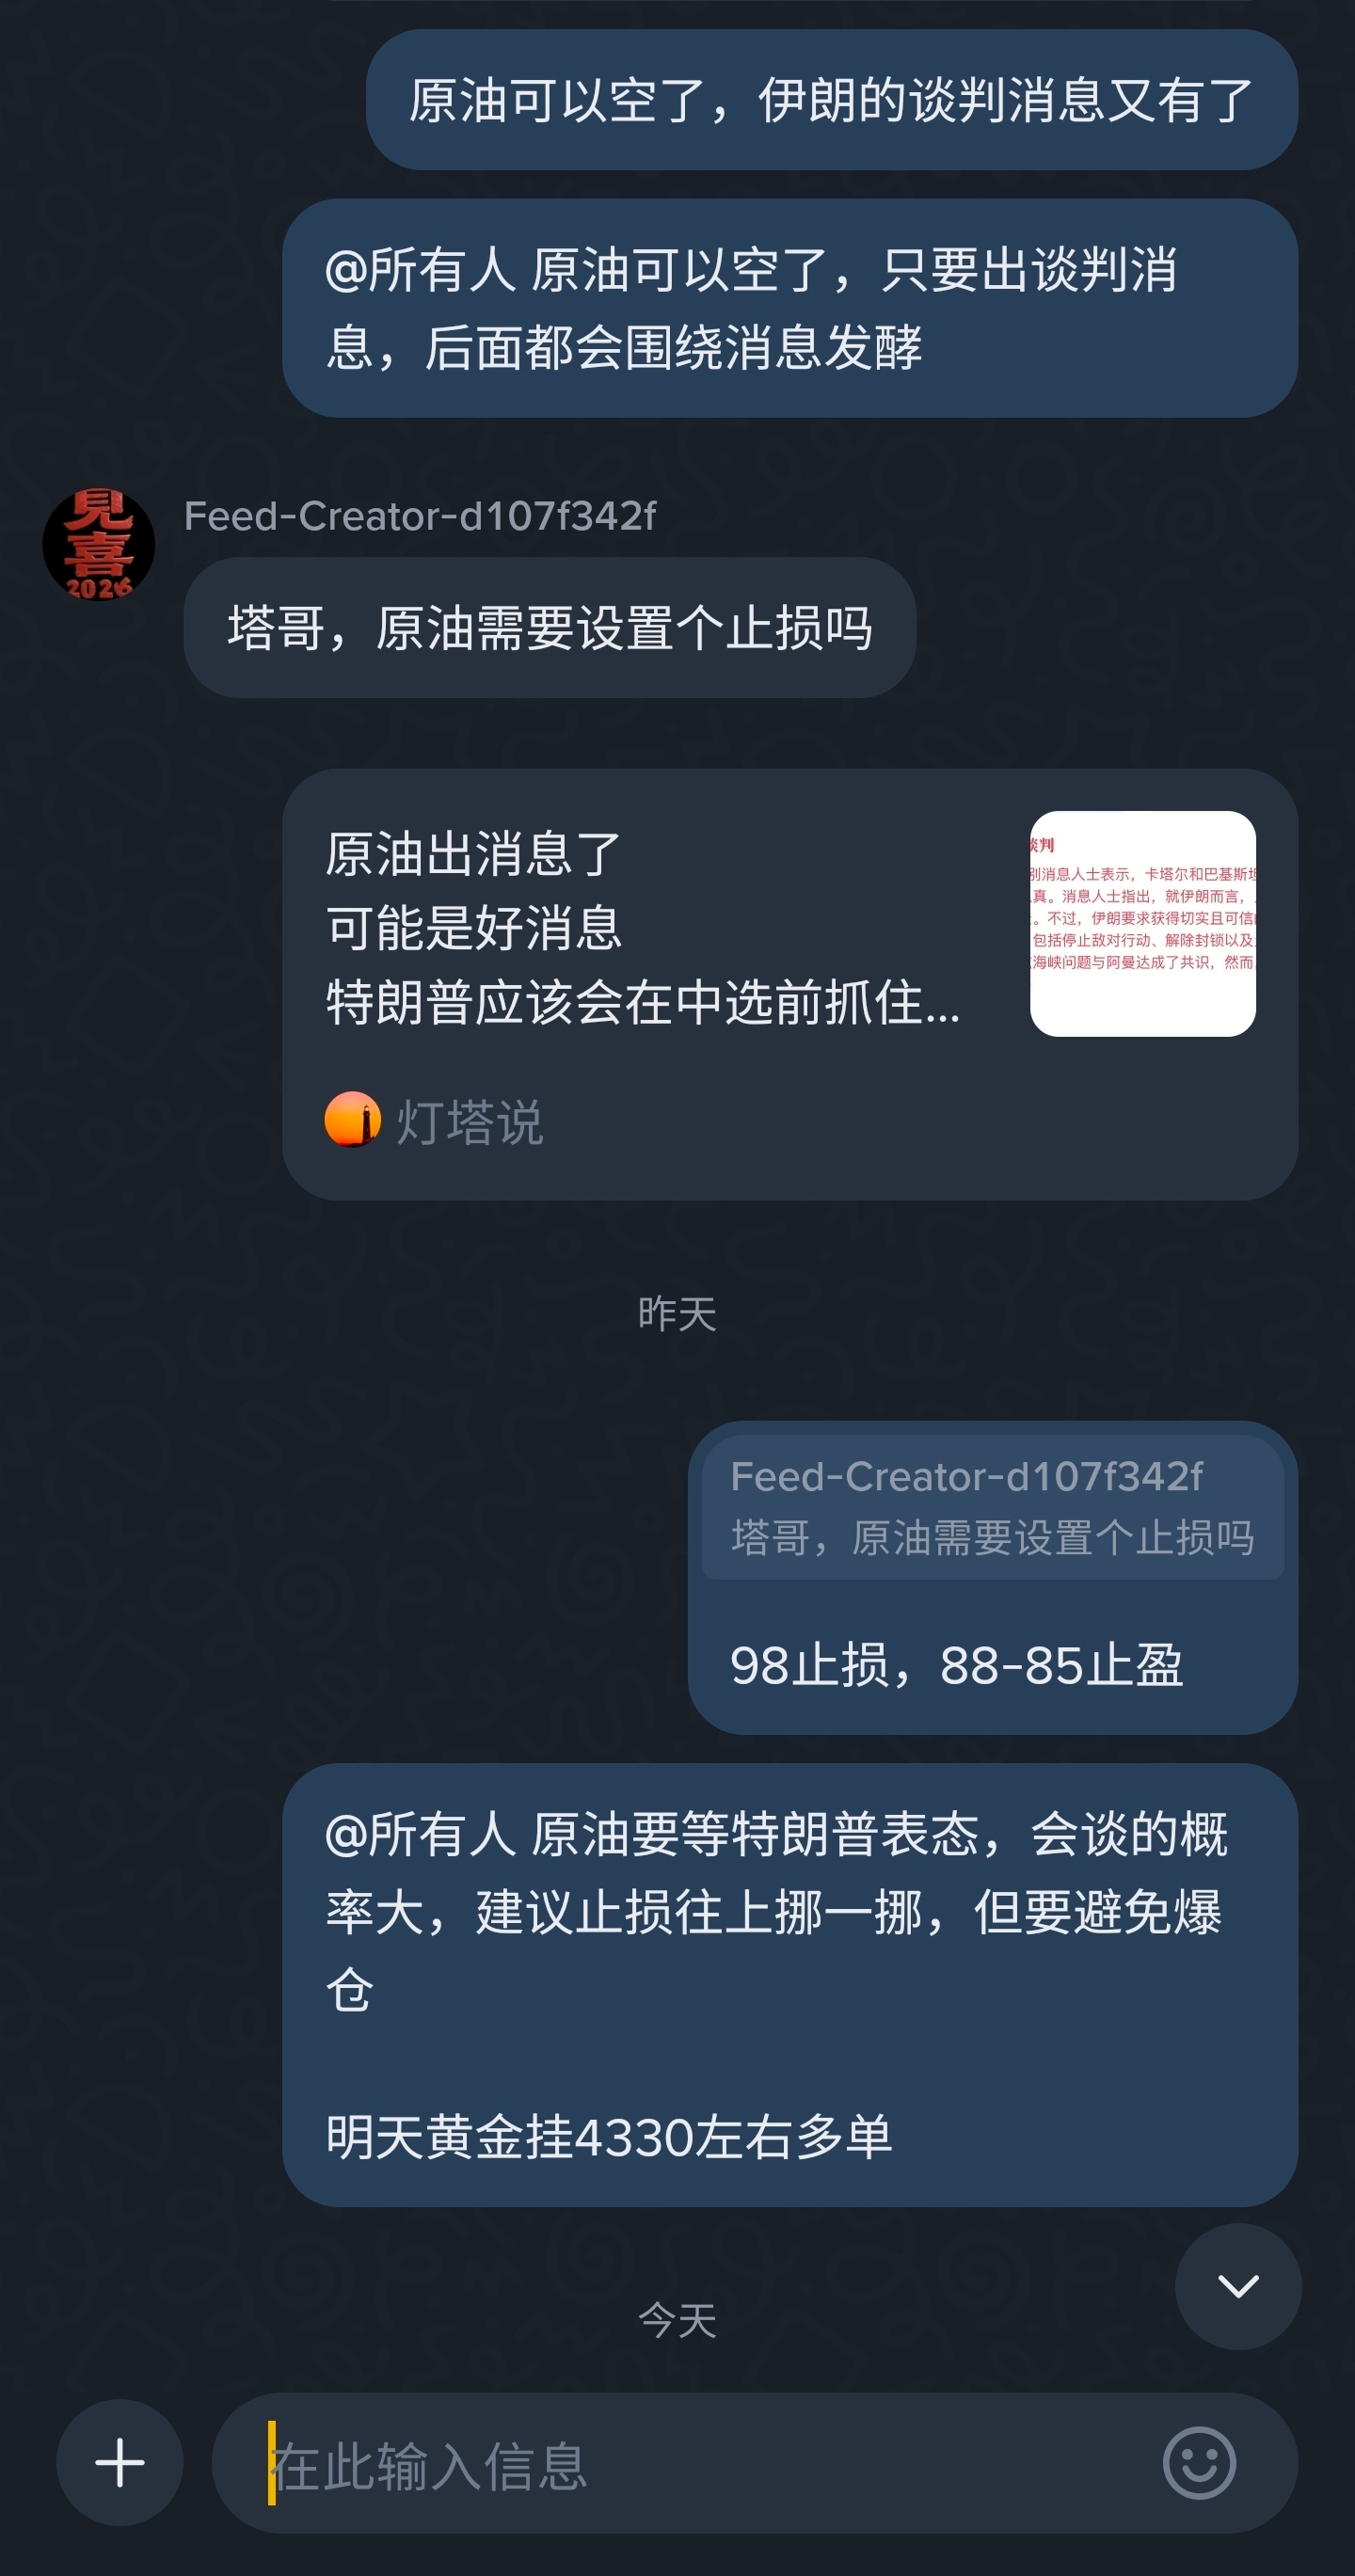
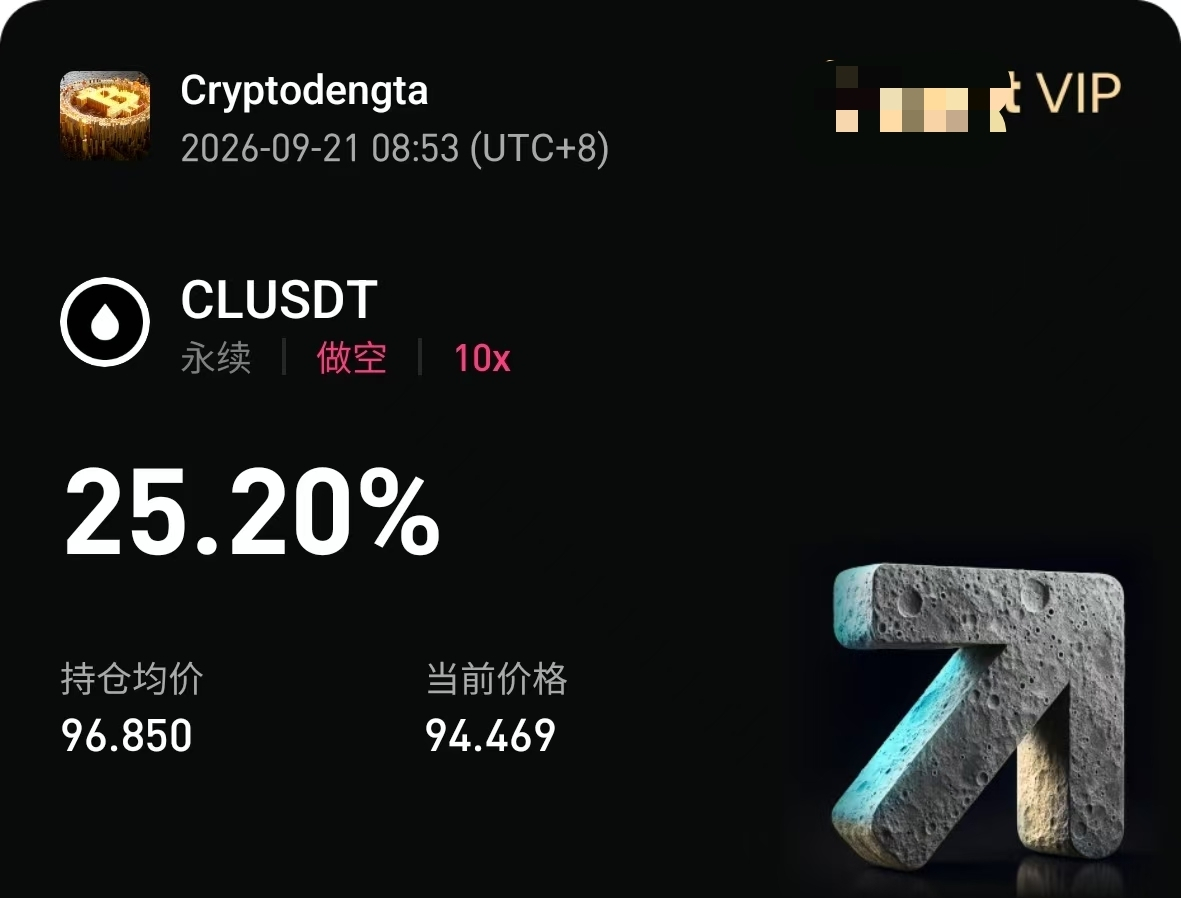
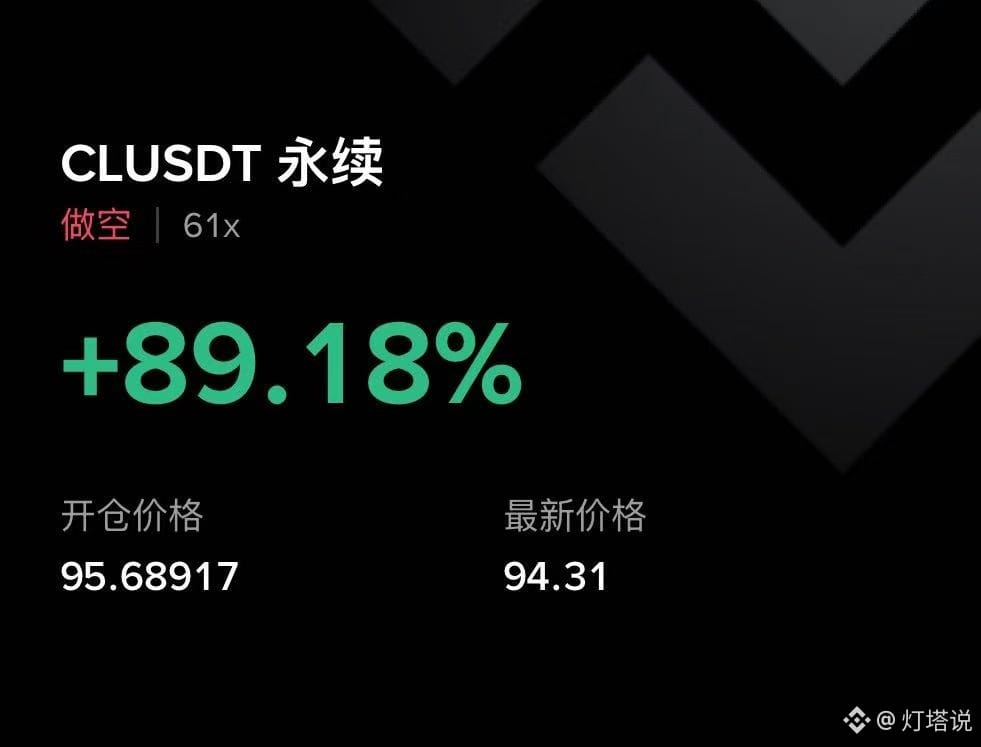
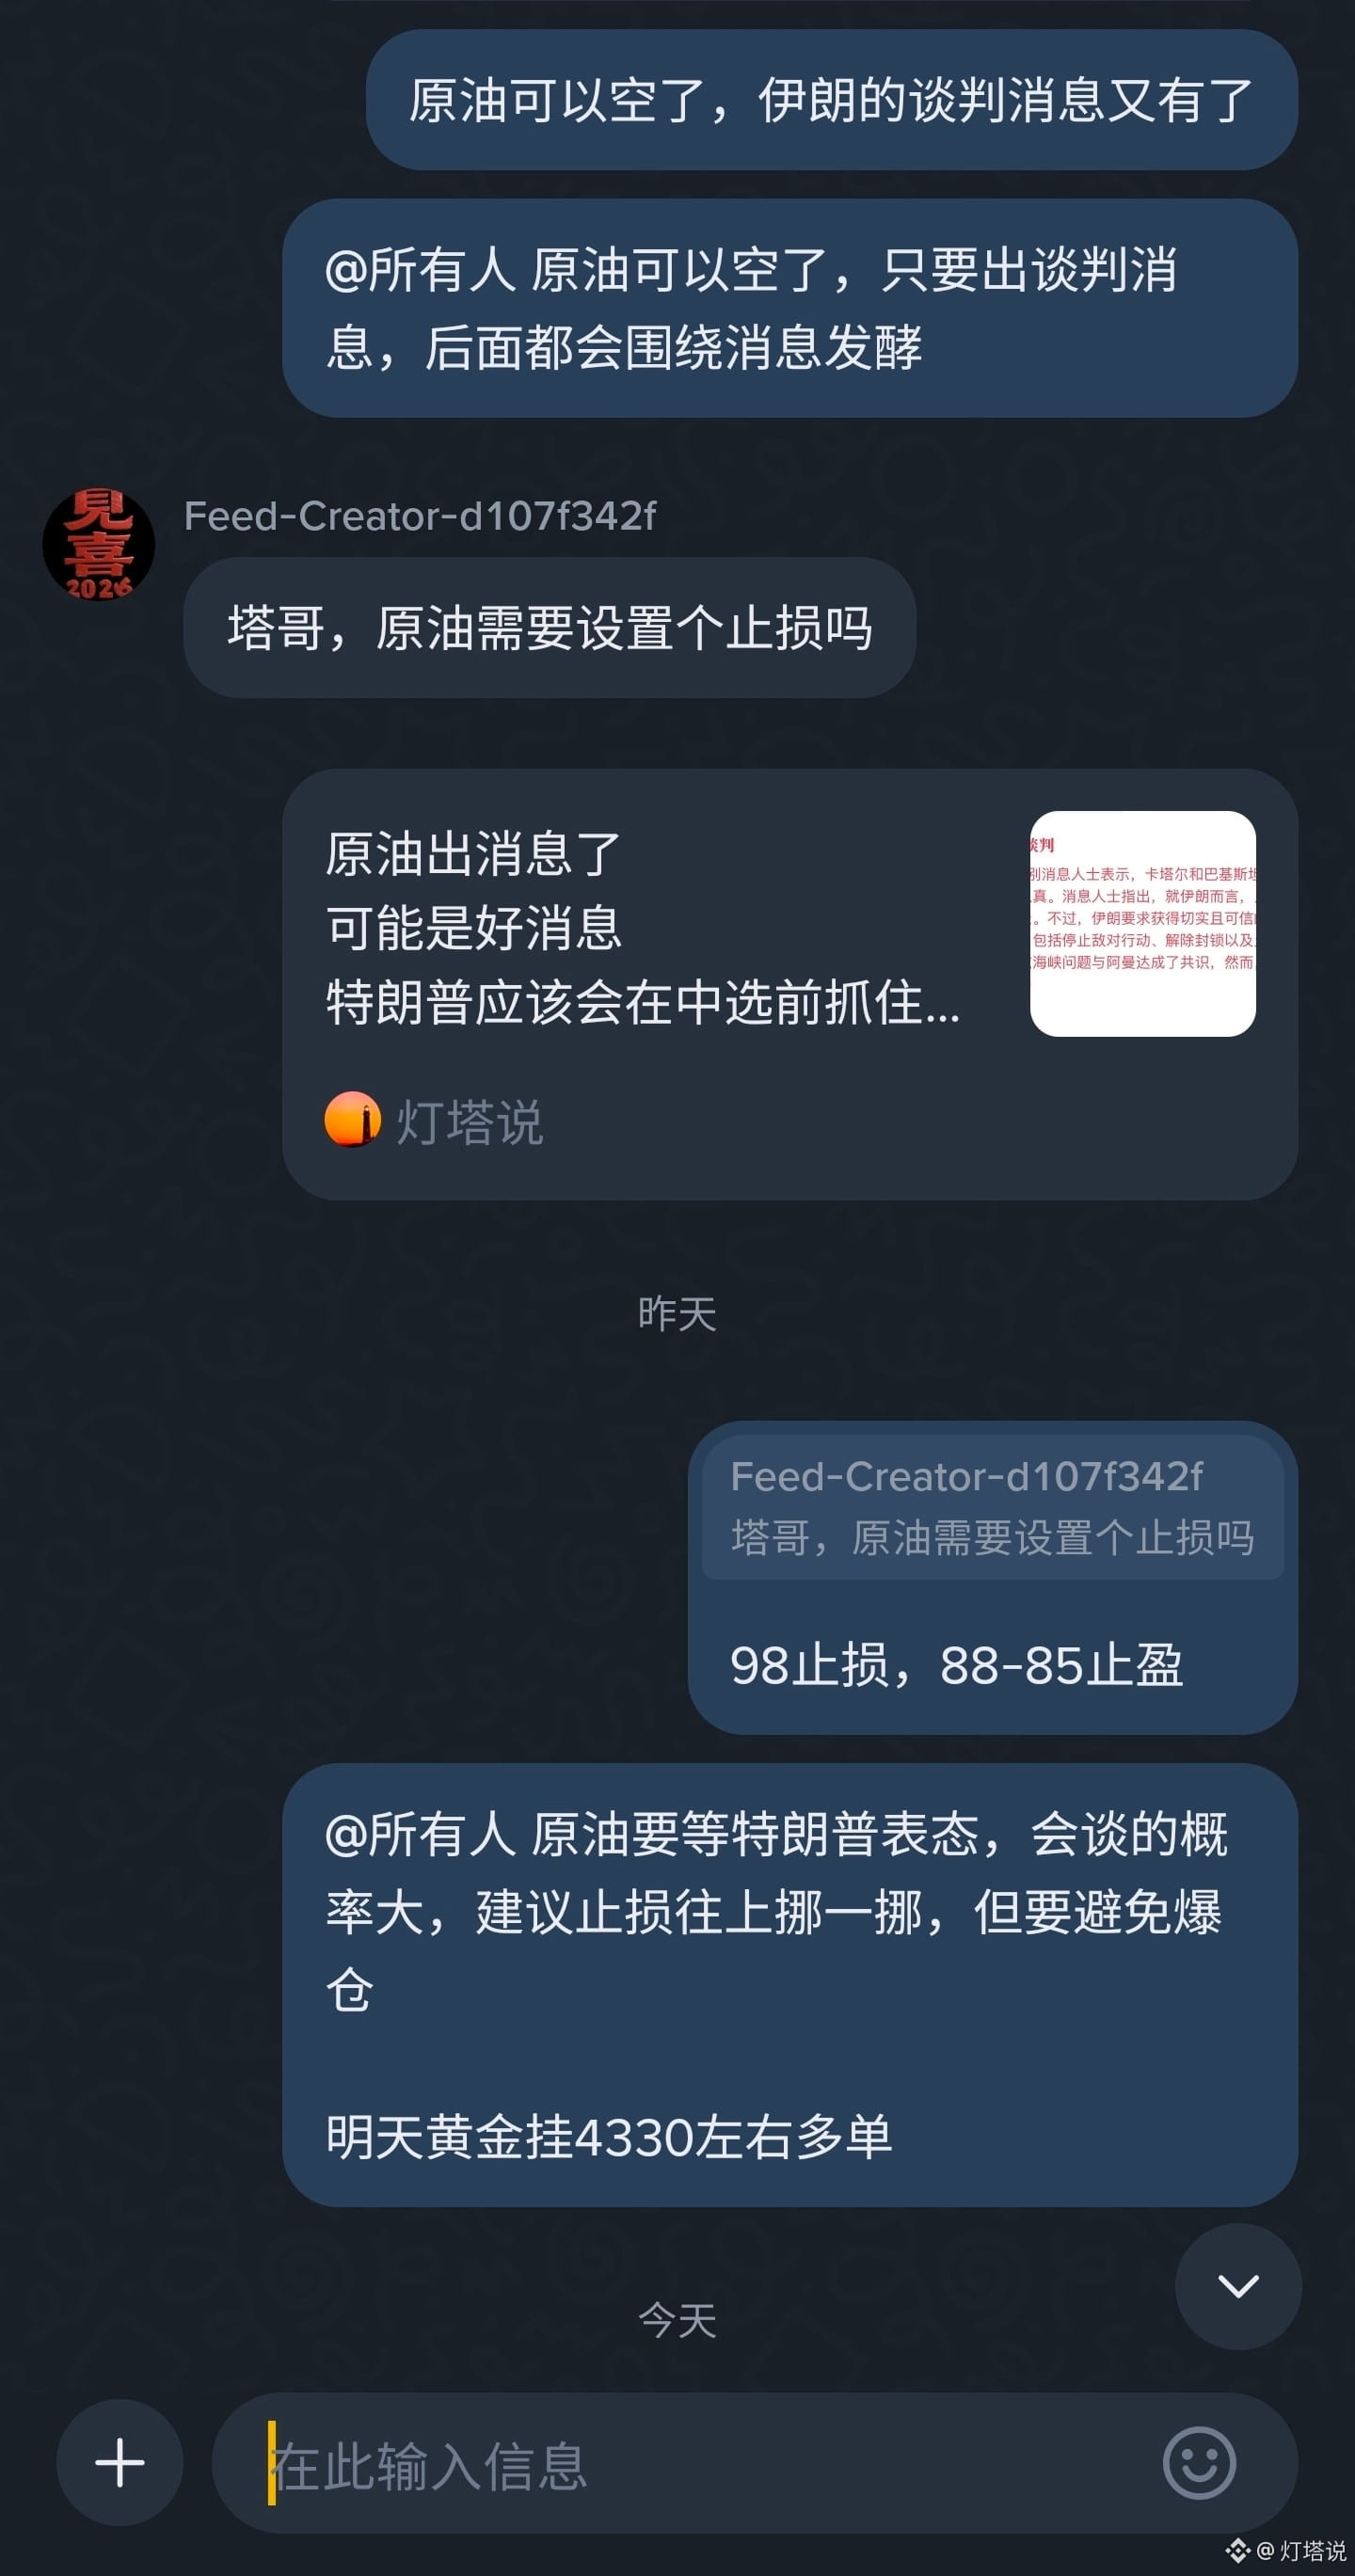
The expected crude oil price trend has begun
Over these few days, I’ve come to realize that you can only profit if you dare to start positions before the expected trend plays out
Otherwise, once it’s realized, you’ll be left holding the bag
So, for crude oil, you can only make expectations based on the news
If this round of talks goes smoothly, then the current drop is only just the beginning
Calm down and focus on your own trading!
For gold, wait for opportunities to go long; right now it’s in the lower half of a volatile range.
$CL $XAU
Over these few days, I’ve come to realize that you can only profit if you dare to start positions before the expected trend plays out
Otherwise, once it’s realized, you’ll be left holding the bag
So, for crude oil, you can only make expectations based on the news
If this round of talks goes smoothly, then the current drop is only just the beginning
Calm down and focus on your own trading!
For gold, wait for opportunities to go long; right now it’s in the lower half of a volatile range.
$CL $XAU
灯塔说
·
--
Trump has spoken—there’s no exclusion of talks
On Wednesday, he will meet with the Iranian president at the United Nations General Assembly
This is a great dialogue within the framework of an international conference
When oil prices come down, it’s good for everything
The crypto market is looking up!
If the big coin breaks 82,500, it can surge straight to 85K
Last time, I said the main goal was 95–97K
The key is that altcoin season is coming. Now, only some of the best coins have seen the biggest rise of just 3x, and some big coins haven’t even started yet!
In one sentence: embrace the long-term trend—buy the pullbacks!
$CL $XAU $BTC
On Wednesday, he will meet with the Iranian president at the United Nations General Assembly
This is a great dialogue within the framework of an international conference
When oil prices come down, it’s good for everything
The crypto market is looking up!
If the big coin breaks 82,500, it can surge straight to 85K
Last time, I said the main goal was 95–97K
The key is that altcoin season is coming. Now, only some of the best coins have seen the biggest rise of just 3x, and some big coins haven’t even started yet!
In one sentence: embrace the long-term trend—buy the pullbacks!
$CL $XAU $BTC
灯塔说
·
--
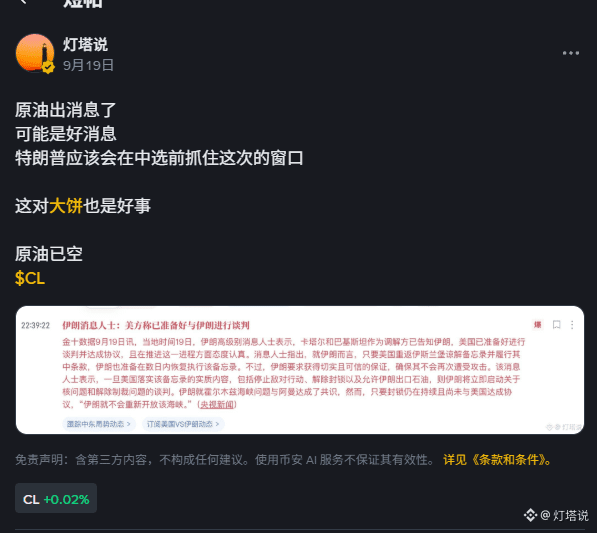
Crude oil has news
Maybe good news
Trump will probably take advantage of this window before the midterm elections
This is also good news for big bread
Crude oil is already empty
$CL
Maybe good news
Trump will probably take advantage of this window before the midterm elections
This is also good news for big bread
Crude oil is already empty
$CL


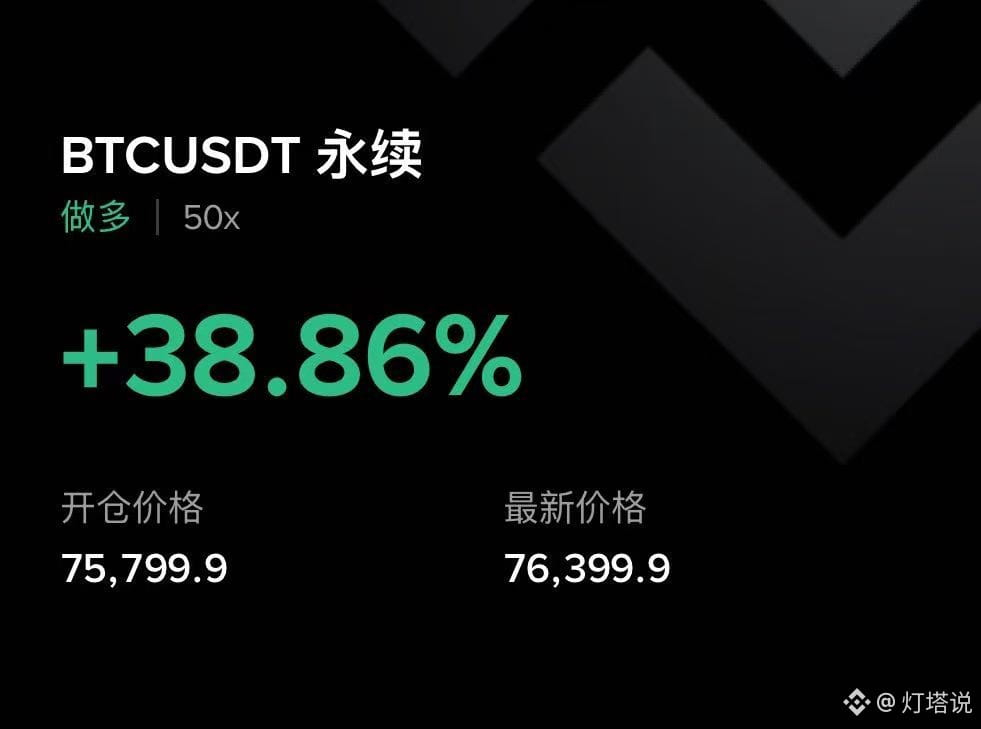
灯塔说
·
--
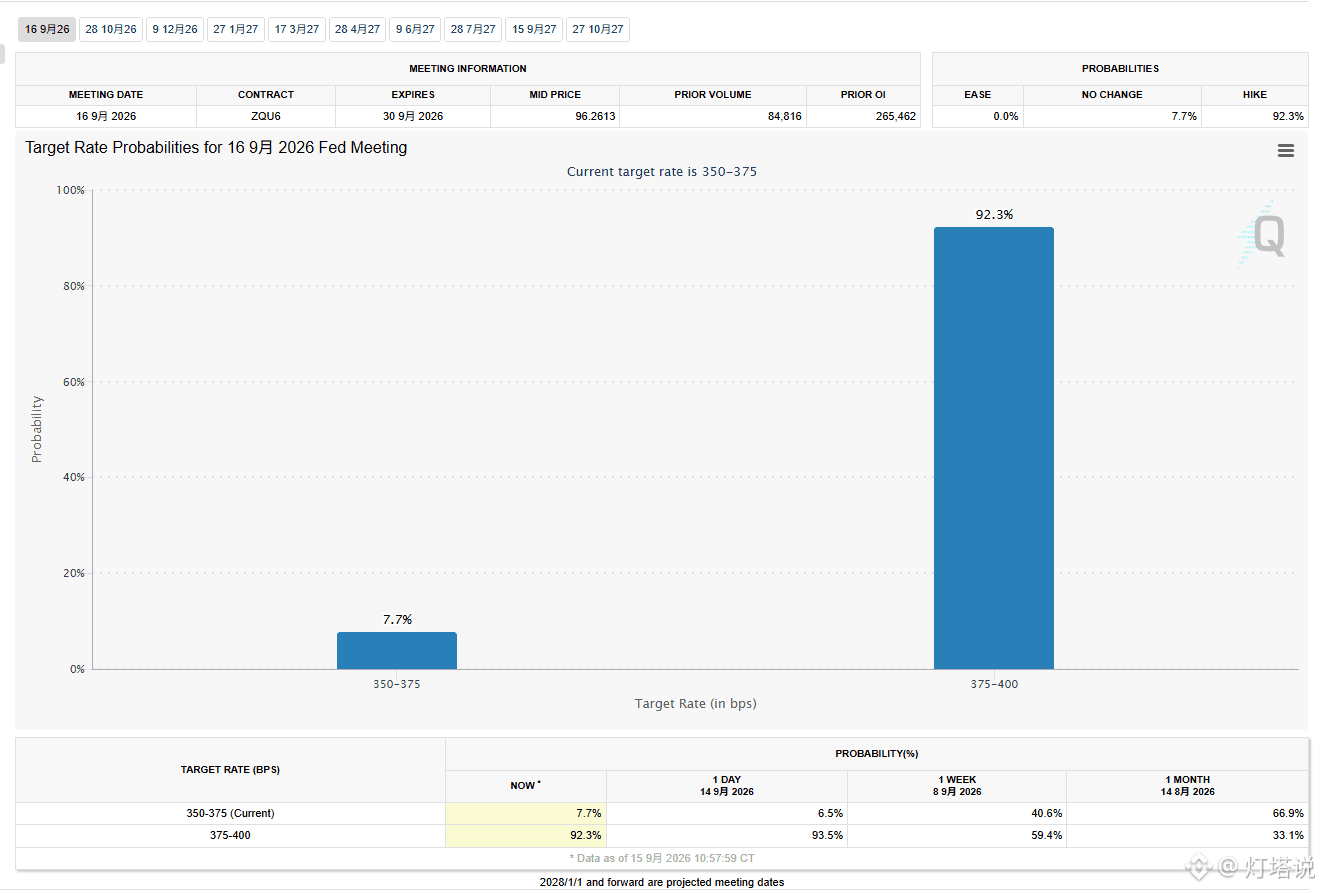
Don't disappoint the interest rate decision tonight.
Previous value 3.75%, expected 4% (a 25 BP hike)
No matter how it's announced, it will either meet expectations or be below expectations.
The bearish market has already dropped as much as it should.
If the remarks after the Fed are dovish, then it's the script of a rebound after the needle.
Otherwise, the downtrend will continue! $BTC $XAU
Previous value 3.75%, expected 4% (a 25 BP hike)
No matter how it's announced, it will either meet expectations or be below expectations.
The bearish market has already dropped as much as it should.
If the remarks after the Fed are dovish, then it's the script of a rebound after the needle.
Otherwise, the downtrend will continue! $BTC $XAU

Partly True
灯塔说
·
--
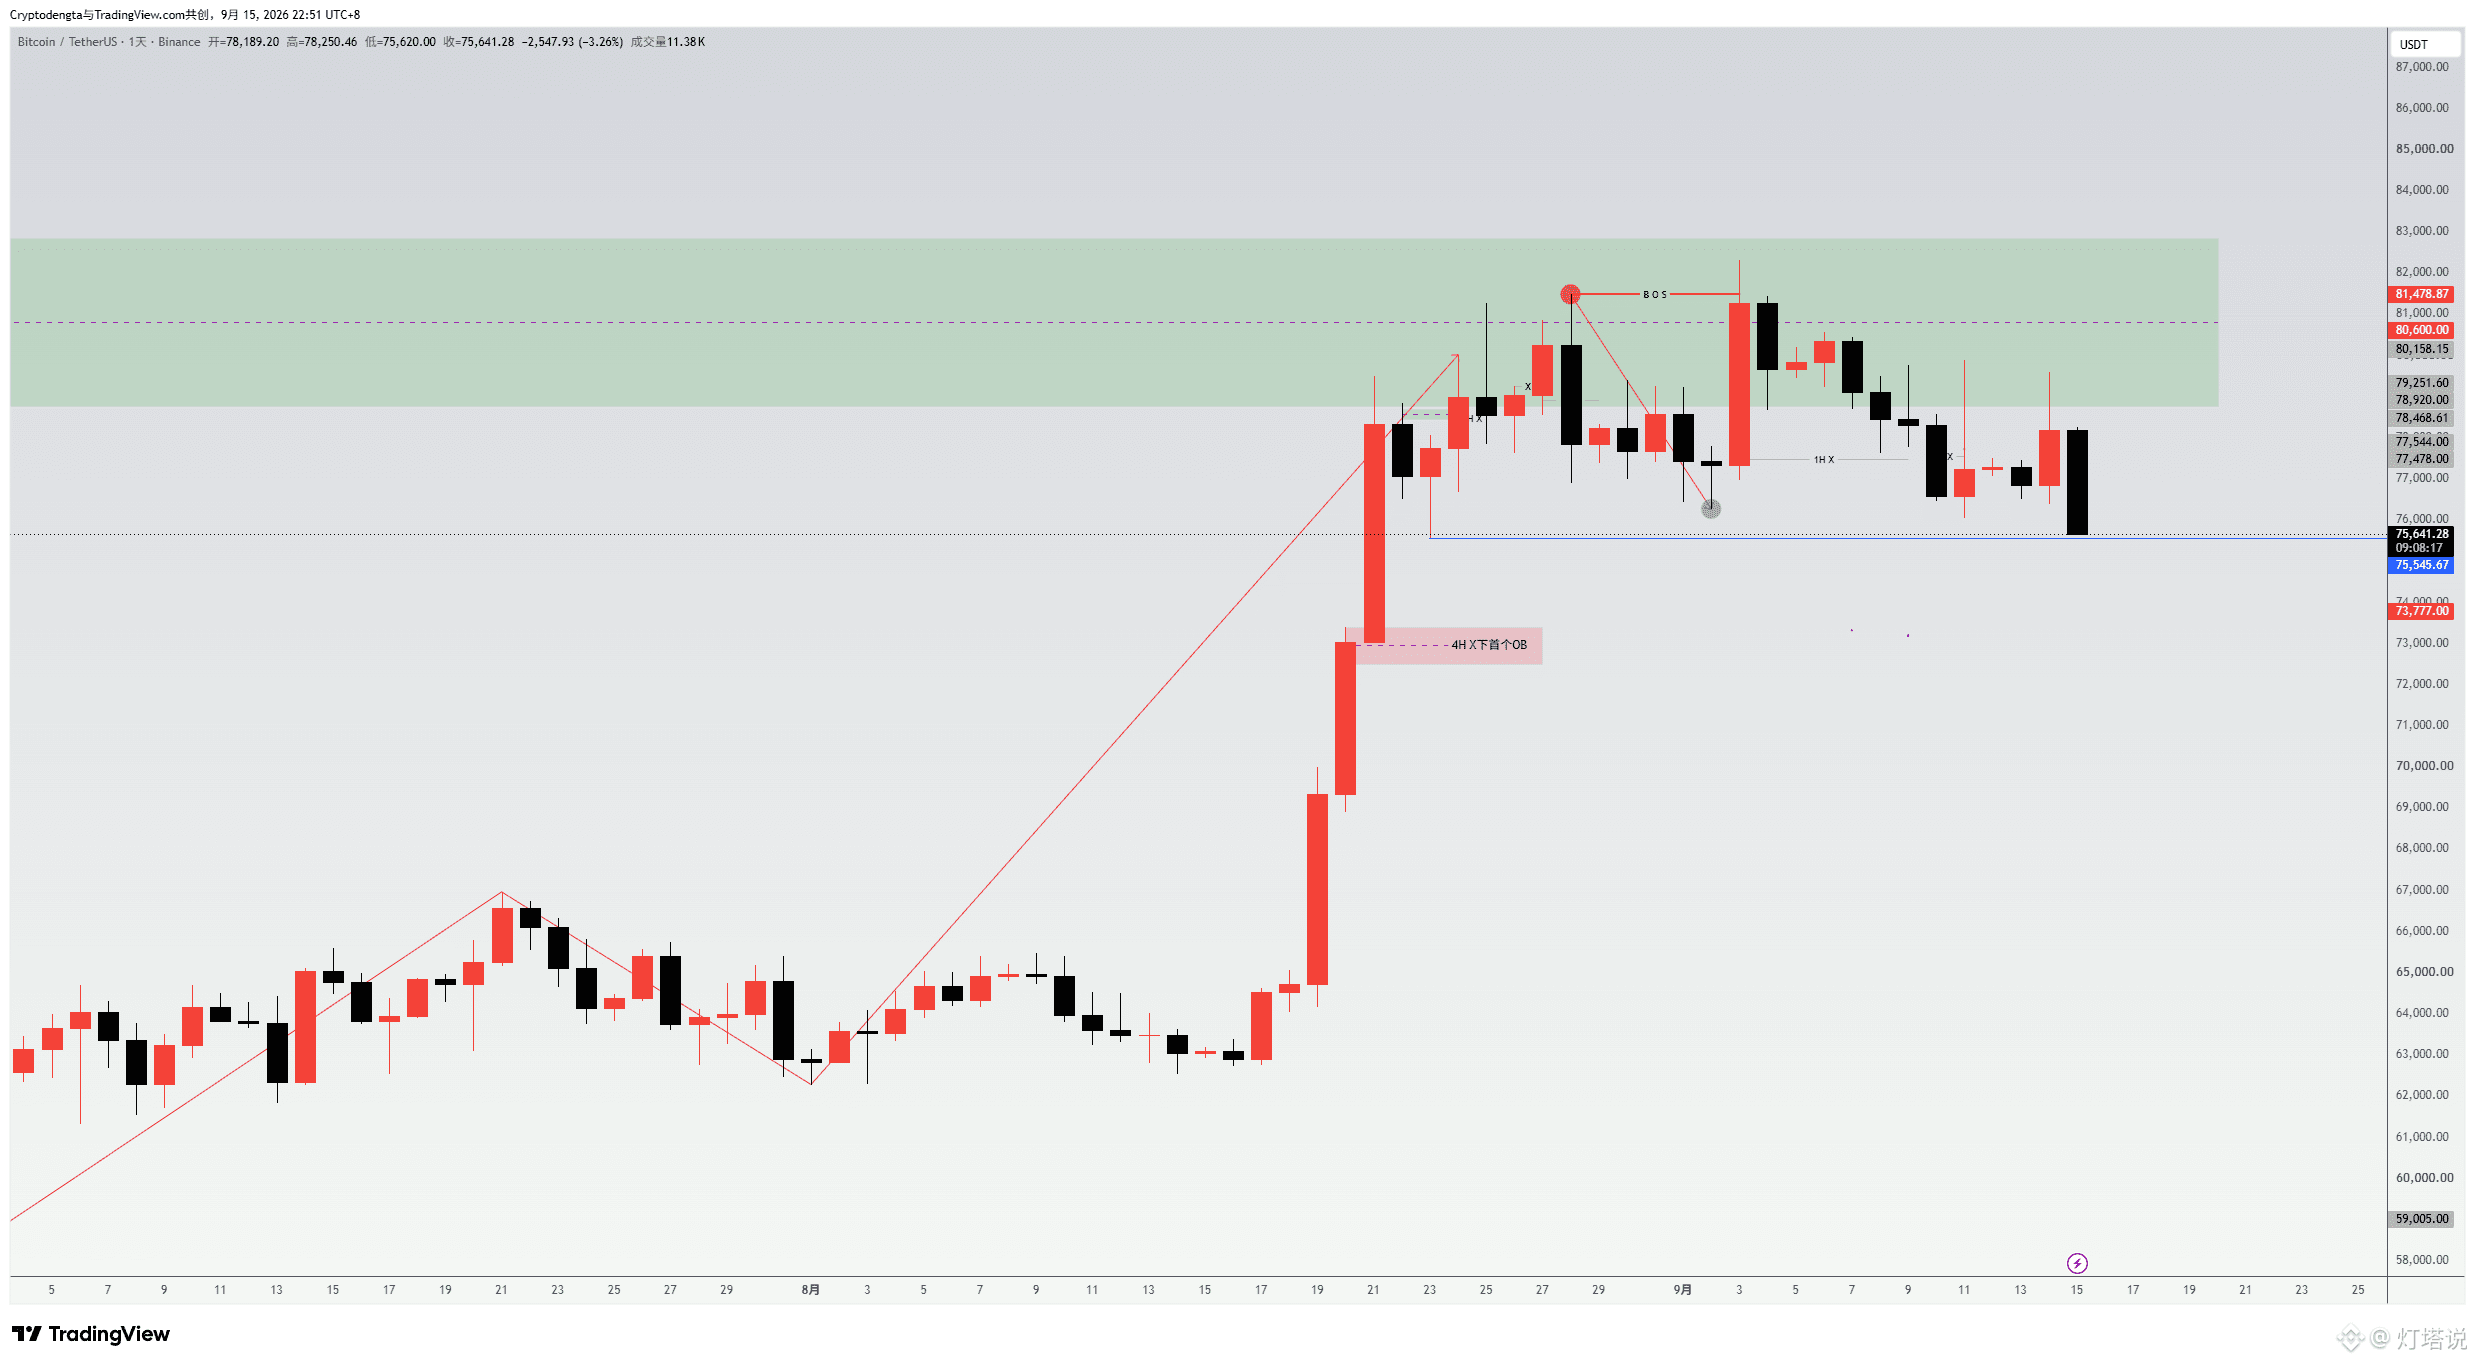
Even if rates are raised tonight
At this position and timing, can you still bring yourself to chase short?$BTC
At this position and timing, can you still bring yourself to chase short?$BTC
灯塔说
·
--
A new week begins, and this week’s key focus is the interest rate decision meeting.
At present, most major institutions have concluded that this meeting will result in a rate hike, and the market is also trading according to these expectations. The current conditions show that the probability of a rate hike is steadily rising, but there are also many conditions that would prevent a hike.
Now the pressure is on the Fed. I previously expected the Fed to withstand the pressure, but this time both the oil price and the two forward-looking data releases lean toward a rate-hike expectation, so I’m starting to wonder whether the Fed might actually raise rates this time.
However, there are several scenarios for a rate hike, and both the announcement of the rate-hike decision and the remarks during the subsequent press conference will have a major impact.
If the Fed truly raises rates by 25 basis points in September, but downplays the possibility of continued hikes afterward, then the downside move that has been priced in early may be limited, and the room for a further pullback would be narrow.
If, after raising rates by 25 basis points, the Fed further reinforces expectations of ongoing tightening, then the market could face persistent downward pressure.
On the contrary, if the Fed withstands the pressure and keeps the interest rate unchanged, the market may rebound. But if, at the press conference, the tone is hawkish and it emphasizes that subsequent hikes could be delayed, that would also affect the market. Still, I think this probability is too low. If they don’t hike in September, then they certainly won’t in October either (even though oil prices surged in September).
So, based on the above and in combination with the market outlook, the probability of a bottoming-and-rebound versus sustained decline is 6:4. I’m more inclined to look for opportunities around the lows for a range/bottoming play. I believe the Fed should maintain its stance—hawkish in words but unchanged in action.
$BTC
At present, most major institutions have concluded that this meeting will result in a rate hike, and the market is also trading according to these expectations. The current conditions show that the probability of a rate hike is steadily rising, but there are also many conditions that would prevent a hike.
Now the pressure is on the Fed. I previously expected the Fed to withstand the pressure, but this time both the oil price and the two forward-looking data releases lean toward a rate-hike expectation, so I’m starting to wonder whether the Fed might actually raise rates this time.
However, there are several scenarios for a rate hike, and both the announcement of the rate-hike decision and the remarks during the subsequent press conference will have a major impact.
If the Fed truly raises rates by 25 basis points in September, but downplays the possibility of continued hikes afterward, then the downside move that has been priced in early may be limited, and the room for a further pullback would be narrow.
If, after raising rates by 25 basis points, the Fed further reinforces expectations of ongoing tightening, then the market could face persistent downward pressure.
On the contrary, if the Fed withstands the pressure and keeps the interest rate unchanged, the market may rebound. But if, at the press conference, the tone is hawkish and it emphasizes that subsequent hikes could be delayed, that would also affect the market. Still, I think this probability is too low. If they don’t hike in September, then they certainly won’t in October either (even though oil prices surged in September).
So, based on the above and in combination with the market outlook, the probability of a bottoming-and-rebound versus sustained decline is 6:4. I’m more inclined to look for opportunities around the lows for a range/bottoming play. I believe the Fed should maintain its stance—hawkish in words but unchanged in action.
$BTC
Log in to explore more content