
CRYPTO ACADEMY 711
54 Posts

CRYPTO ACADEMY 711
Report
Block User
Crypto Analyst | BTC & Altcoin Analysis | Daily Market Updates | Candlestick Charts | Learn and Grow | Follow for Crypto Insights
Open Trade
8 Days
2 Following
1 Followers
3 Liked
Posts
Portfolio
·
--
Bearish
🌍 GLOBAL CRYPTO MARKET UPDATE
📅 November 6, 2026
📊 TOTAL CRYPTO MARKET OVERVIEW
💰 Total Market Cap: $2.79 Trillion
📈 24H Trading Volume: $96.8 Billion
₿ $BTC Dominance: 58.1%
Ξ $ETH Dominance: 10.6%
🔥 TOP 20 CRYPTOCURRENCIES – LIVE MARKET SNAPSHOT
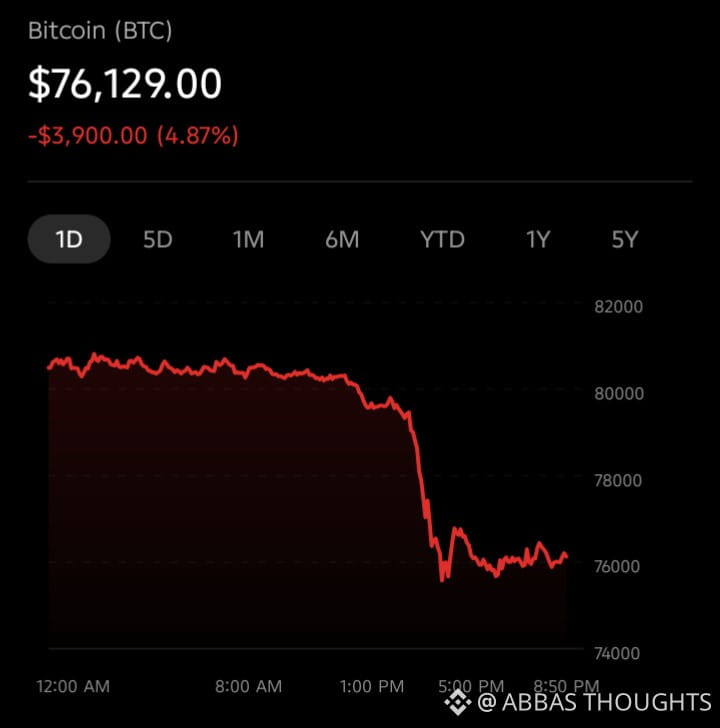
1. BTC — $80,737.53 (+4.7%)
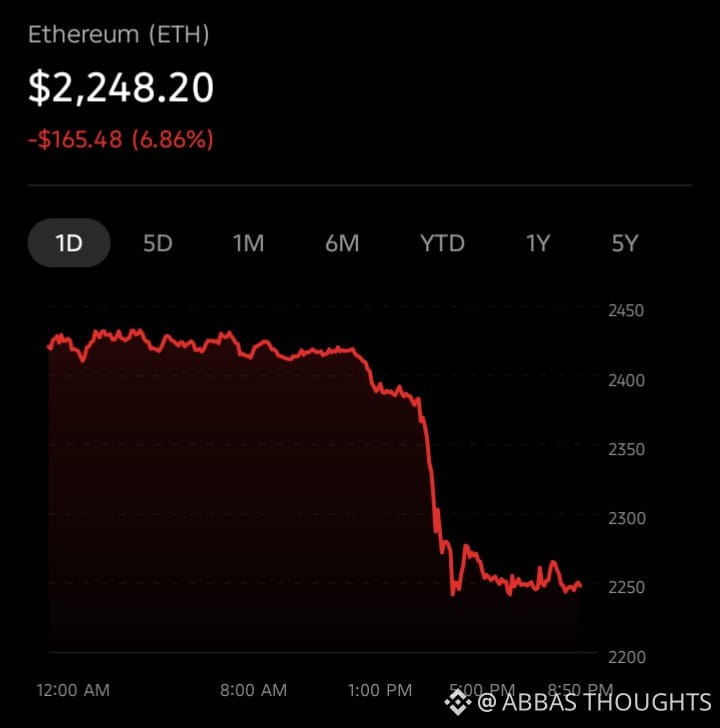
2. ETH — $2,432.85 (+7.3%)
3. USDT — $0.9993 (0.0%)
4. BNB — $716.89 (+3.5%)
5. XRP — $1.31 (+4.3%)
6. USDC — $0.9997 (0.0%)
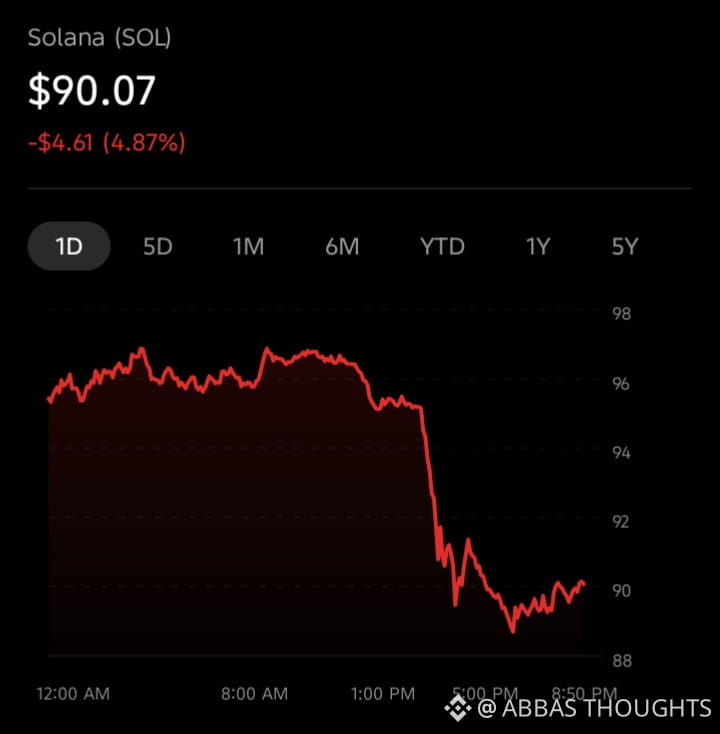
7. SOL — $96.80 (+4.8%)
8. TRX — $0.3192 (+0.9%)
9. FIGR_HELOC — $1.05 (+1.5%)
10. ZEC — $1,323.77 (+10.0%)
11. HYPE — $84.25 (+1.6%)
12. DOGE — $0.07729 (+4.3%)
13. XMR — $636.79 (+1.4%)
14. USDS — $1.00 (0.0%)
15. WBT — $78.15 (+5.5%)
16. LINK — $11.60 (+5.8%)
17. LEO — $9.35 (+0.6%)
18. $ADA — $0.1990 (+6.1%)
19. XLM — $0.1688 (+5.5%)
20. BCH — $282.51 (+3.8%)
📌 MARKET HIGHLIGHTS
🟢 Ethereum is showing strong daily performance.
🟢 Zcash is leading the top 20 gainers.
🟢 Bitcoin remains the dominant cryptocurrency.
🟢 Solana and Cardano are showing positive momentum.
🟢 Chainlink is also recording solid gains.
🟢 Stablecoins remain close to their $1 peg.
📈 MARKET OUTLOOK
The overall market snapshot is positive, with several major cryptocurrencies showing gains.
Bitcoin dominance remains high, so traders should watch BTC movement before expecting a sustained altcoin rally.
⚠️ IMPORTANT:
Watch trading volume, support and resistance levels. Always verify prices on your exchange before trading. Cryptocurrency markets are highly volatile.
💬 What is your favourite cryptocurrency right now?
🚀 BULLISH or 🐻 BEARISH?
{spot}(BTCUSDT)
{spot}(ADAUSDT)
{spot}(ETHUSDT)
#CryptoMarket #Bitcoin #Ethereum #BNB #XRP #Solana #Cardano #Dogecoin #Zcash #Chainlink #Binance #CryptoTrading #Altcoins
🌍 GLOBAL CRYPTO MARKET UPDATE
📅 November 6, 2026
📊 TOTAL CRYPTO MARKET OVERVIEW
💰 Total Market Cap: $2.79 Trillion
📈 24H Trading Volume: $96.8 Billion
₿ $BTC Dominance: 58.1%
Ξ $ETH Dominance: 10.6%
🔥 TOP 20 CRYPTOCURRENCIES – LIVE MARKET SNAPSHOT
1. BTC — $80,737.53 (+4.7%)
2. ETH — $2,432.85 (+7.3%)
3. USDT — $0.9993 (0.0%)
4. BNB — $716.89 (+3.5%)
5. XRP — $1.31 (+4.3%)
6. USDC — $0.9997 (0.0%)
7. SOL — $96.80 (+4.8%)
8. TRX — $0.3192 (+0.9%)
9. FIGR_HELOC — $1.05 (+1.5%)
10. ZEC — $1,323.77 (+10.0%)
11. HYPE — $84.25 (+1.6%)
12. DOGE — $0.07729 (+4.3%)
13. XMR — $636.79 (+1.4%)
14. USDS — $1.00 (0.0%)
15. WBT — $78.15 (+5.5%)
16. LINK — $11.60 (+5.8%)
17. LEO — $9.35 (+0.6%)
18. $ADA — $0.1990 (+6.1%)
19. XLM — $0.1688 (+5.5%)
20. BCH — $282.51 (+3.8%)
📌 MARKET HIGHLIGHTS
🟢 Ethereum is showing strong daily performance.
🟢 Zcash is leading the top 20 gainers.
🟢 Bitcoin remains the dominant cryptocurrency.
🟢 Solana and Cardano are showing positive momentum.
🟢 Chainlink is also recording solid gains.
🟢 Stablecoins remain close to their $1 peg.
📈 MARKET OUTLOOK
The overall market snapshot is positive, with several major cryptocurrencies showing gains.
Bitcoin dominance remains high, so traders should watch BTC movement before expecting a sustained altcoin rally.
⚠️ IMPORTANT:
Watch trading volume, support and resistance levels. Always verify prices on your exchange before trading. Cryptocurrency markets are highly volatile.
💬 What is your favourite cryptocurrency right now?
🚀 BULLISH or 🐻 BEARISH?
#CryptoMarket #Bitcoin #Ethereum #BNB #XRP #Solana #Cardano #Dogecoin #Zcash #Chainlink #Binance #CryptoTrading #Altcoins
📅 November 6, 2026
📊 TOTAL CRYPTO MARKET OVERVIEW
💰 Total Market Cap: $2.79 Trillion
📈 24H Trading Volume: $96.8 Billion
₿ $BTC Dominance: 58.1%
Ξ $ETH Dominance: 10.6%
🔥 TOP 20 CRYPTOCURRENCIES – LIVE MARKET SNAPSHOT
1. BTC — $80,737.53 (+4.7%)
2. ETH — $2,432.85 (+7.3%)
3. USDT — $0.9993 (0.0%)
4. BNB — $716.89 (+3.5%)
5. XRP — $1.31 (+4.3%)
6. USDC — $0.9997 (0.0%)
7. SOL — $96.80 (+4.8%)
8. TRX — $0.3192 (+0.9%)
9. FIGR_HELOC — $1.05 (+1.5%)
10. ZEC — $1,323.77 (+10.0%)
11. HYPE — $84.25 (+1.6%)
12. DOGE — $0.07729 (+4.3%)
13. XMR — $636.79 (+1.4%)
14. USDS — $1.00 (0.0%)
15. WBT — $78.15 (+5.5%)
16. LINK — $11.60 (+5.8%)
17. LEO — $9.35 (+0.6%)
18. $ADA — $0.1990 (+6.1%)
19. XLM — $0.1688 (+5.5%)
20. BCH — $282.51 (+3.8%)
📌 MARKET HIGHLIGHTS
🟢 Ethereum is showing strong daily performance.
🟢 Zcash is leading the top 20 gainers.
🟢 Bitcoin remains the dominant cryptocurrency.
🟢 Solana and Cardano are showing positive momentum.
🟢 Chainlink is also recording solid gains.
🟢 Stablecoins remain close to their $1 peg.
📈 MARKET OUTLOOK
The overall market snapshot is positive, with several major cryptocurrencies showing gains.
Bitcoin dominance remains high, so traders should watch BTC movement before expecting a sustained altcoin rally.
⚠️ IMPORTANT:
Watch trading volume, support and resistance levels. Always verify prices on your exchange before trading. Cryptocurrency markets are highly volatile.
💬 What is your favourite cryptocurrency right now?
🚀 BULLISH or 🐻 BEARISH?
#CryptoMarket #Bitcoin #Ethereum #BNB #XRP #Solana #Cardano #Dogecoin #Zcash #Chainlink #Binance #CryptoTrading #Altcoins

95
·
--
Bearish
$ETH ETHEREUM (ETH) LIVE MARKET ANALYSIS
📊 ETH/USDT – Market Outlook
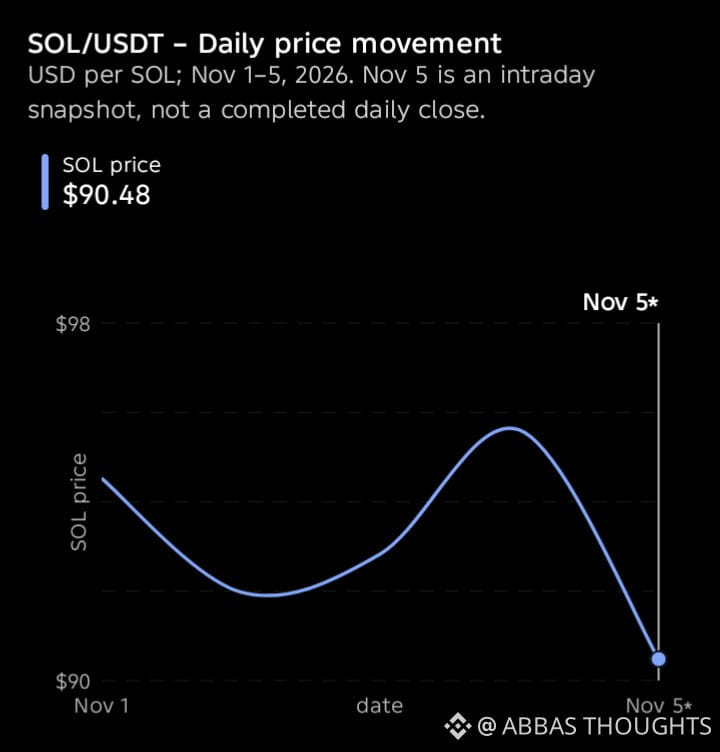
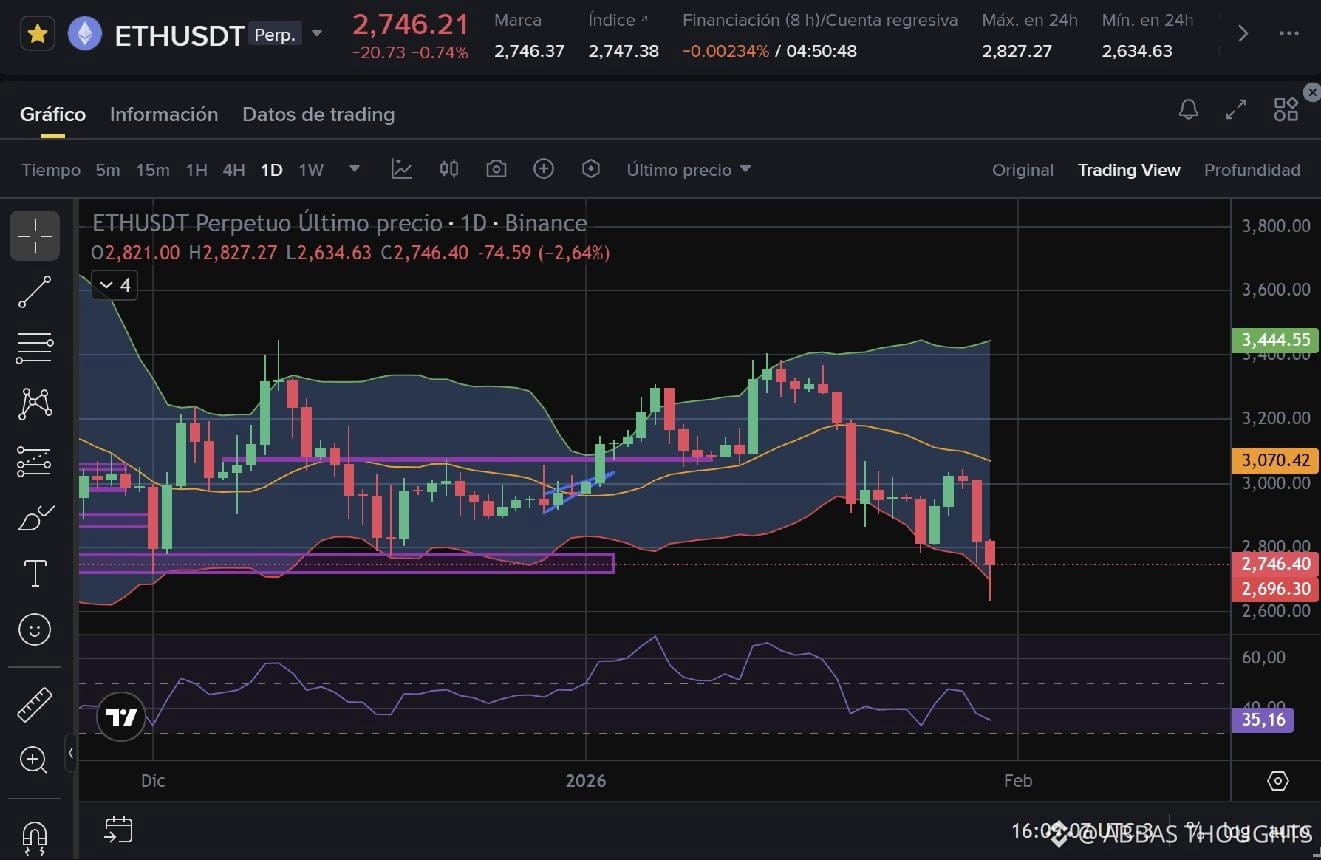
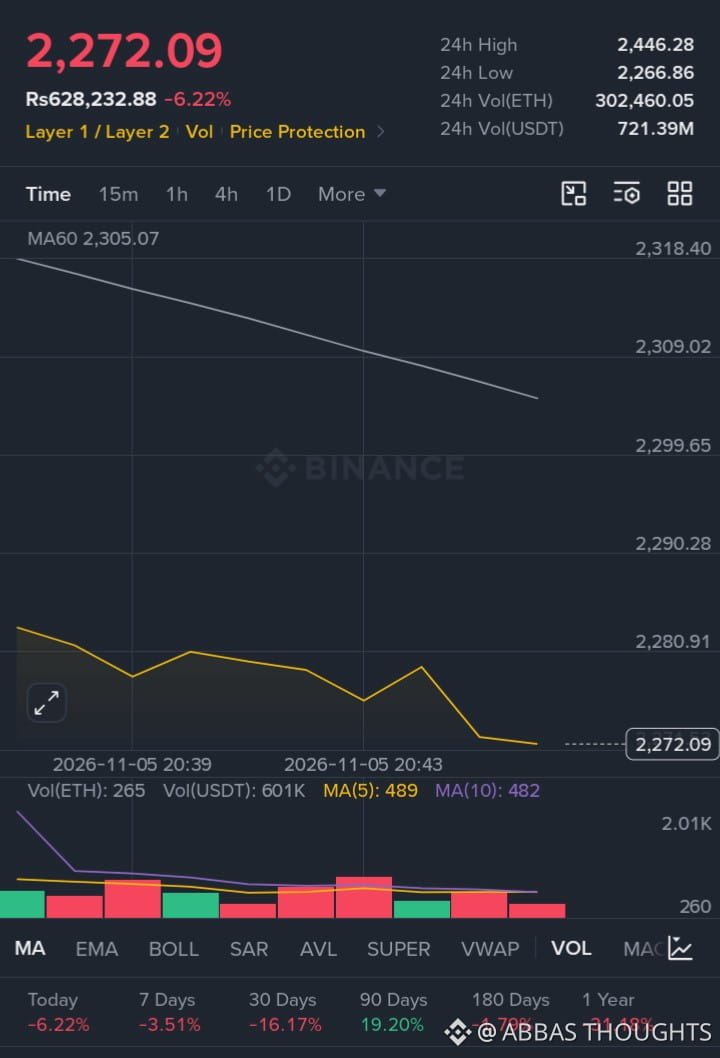
Ethereum is showing mixed market signals, with short-term bullish momentum on the 4-hour chart but a bearish trend on the daily timeframe.
💰 Latest Retrieved Price Snapshot: $2,286
📉 24H Change: -6.11%
🔍 Key Support Levels
- $2,238
- $2,227
🎯 Key Resistance Levels
- $2,321
- $2,330
- $2,452
📈 Bullish Scenario:
If ETH breaks above $2,330 and maintains momentum, buyers could push the price toward higher resistance zones.
📉 Bearish Scenario:
If ETH loses the $2,227 support zone, further downside pressure may develop.
📊 Market Sentiment:
Short-term: Mixed / cautiously bullish
Daily trend: Bearish
💡 Trading Strategy:
Wait for a confirmed breakout or breakdown before entering a trade. Avoid chasing sudden price movements.
⚠️ Always use proper risk management. This analysis is for educational purposes, not financial advice.
{spot}(ETHUSDT)
#ETH #Ethereum #ETHUSDT #CryptoAnalysis #Binance #Trading #CryptoMarket
$ETH ETHEREUM (ETH) LIVE MARKET ANALYSIS
📊 ETH/USDT – Market Outlook
Ethereum is showing mixed market signals, with short-term bullish momentum on the 4-hour chart but a bearish trend on the daily timeframe.
💰 Latest Retrieved Price Snapshot: $2,286
📉 24H Change: -6.11%
🔍 Key Support Levels
- $2,238
- $2,227
🎯 Key Resistance Levels
- $2,321
- $2,330
- $2,452
📈 Bullish Scenario:
If ETH breaks above $2,330 and maintains momentum, buyers could push the price toward higher resistance zones.
📉 Bearish Scenario:
If ETH loses the $2,227 support zone, further downside pressure may develop.
📊 Market Sentiment:
Short-term: Mixed / cautiously bullish
Daily trend: Bearish
💡 Trading Strategy:
Wait for a confirmed breakout or breakdown before entering a trade. Avoid chasing sudden price movements.
⚠️ Always use proper risk management. This analysis is for educational purposes, not financial advice.
#ETH #Ethereum #ETHUSDT #CryptoAnalysis #Binance #Trading #CryptoMarket
📊 ETH/USDT – Market Outlook
Ethereum is showing mixed market signals, with short-term bullish momentum on the 4-hour chart but a bearish trend on the daily timeframe.
💰 Latest Retrieved Price Snapshot: $2,286
📉 24H Change: -6.11%
🔍 Key Support Levels
- $2,238
- $2,227
🎯 Key Resistance Levels
- $2,321
- $2,330
- $2,452
📈 Bullish Scenario:
If ETH breaks above $2,330 and maintains momentum, buyers could push the price toward higher resistance zones.
📉 Bearish Scenario:
If ETH loses the $2,227 support zone, further downside pressure may develop.
📊 Market Sentiment:
Short-term: Mixed / cautiously bullish
Daily trend: Bearish
💡 Trading Strategy:
Wait for a confirmed breakout or breakdown before entering a trade. Avoid chasing sudden price movements.
⚠️ Always use proper risk management. This analysis is for educational purposes, not financial advice.
#ETH #Ethereum #ETHUSDT #CryptoAnalysis #Binance #Trading #CryptoMarket
2
·
--
Bearish
51
·
--
Bearish
31
7
·
--
Bearish
99
·
--
Bearish
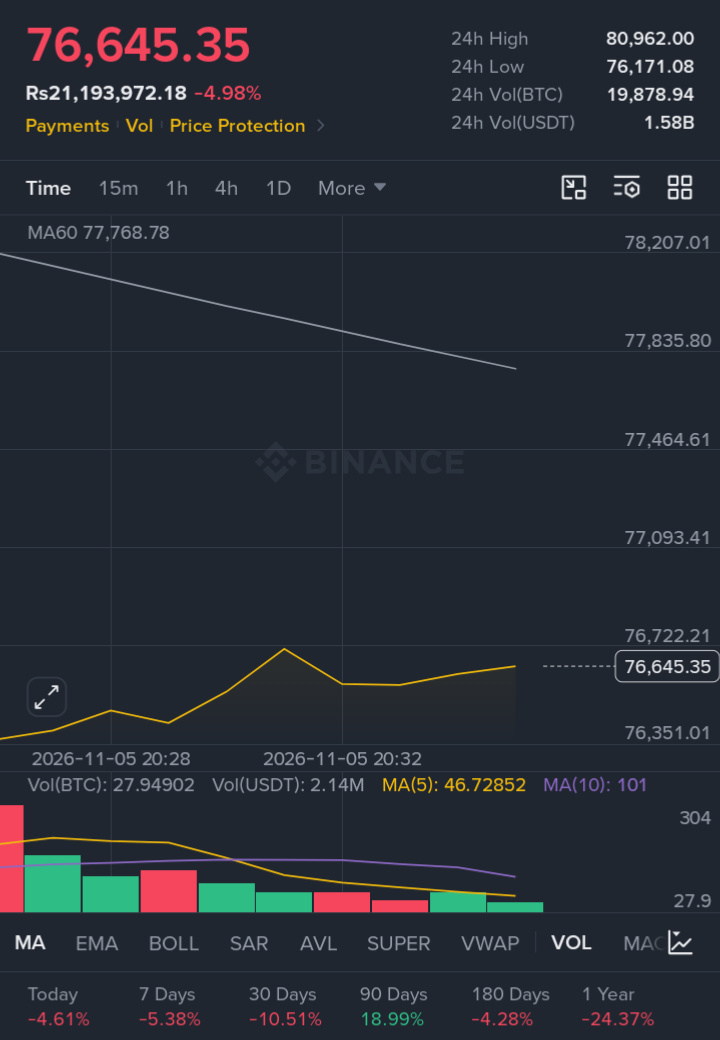
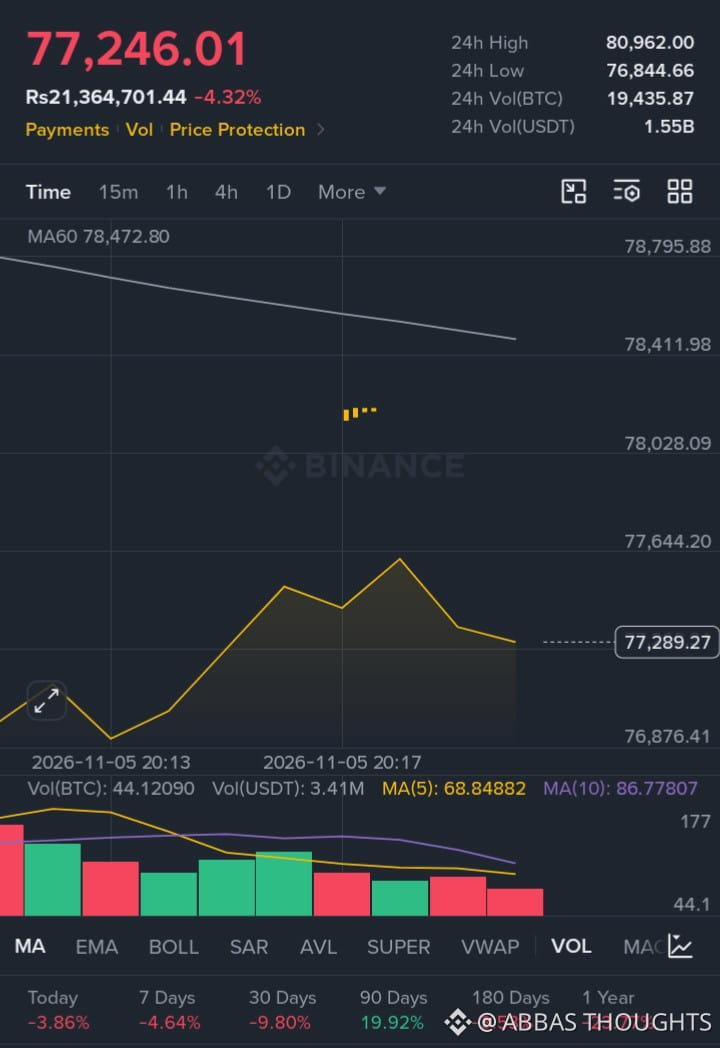
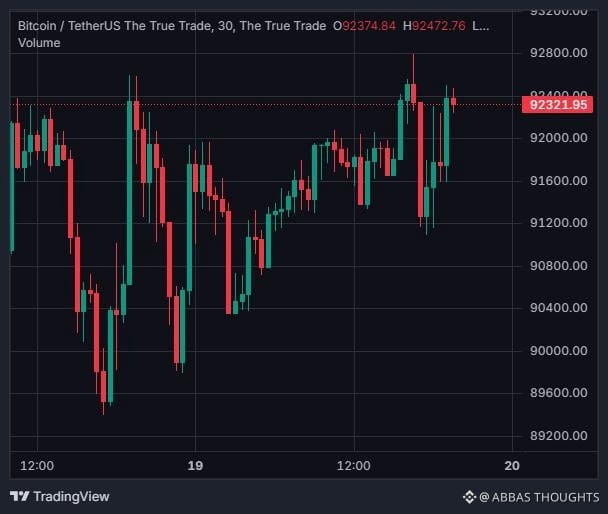
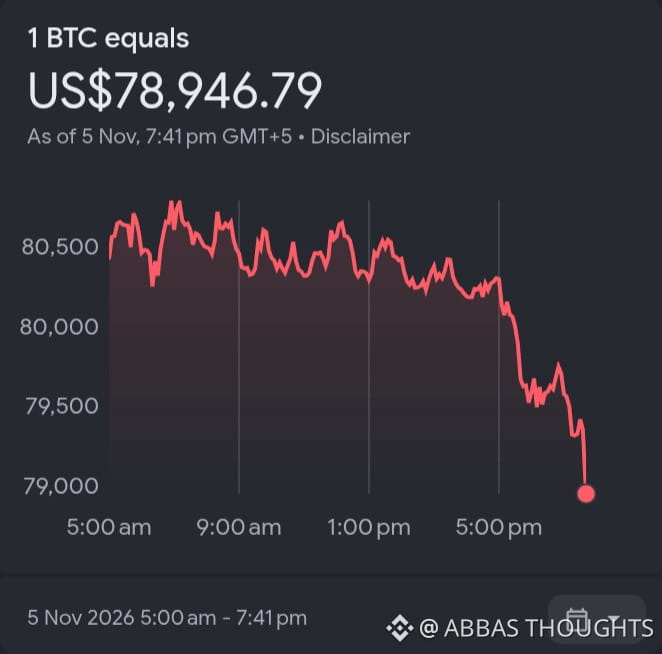
$BTC BITCOIN (BTC) LATEST MARKET ANALYSIS – NOVEMBER 5, 2026
BTC rise Above $79000???
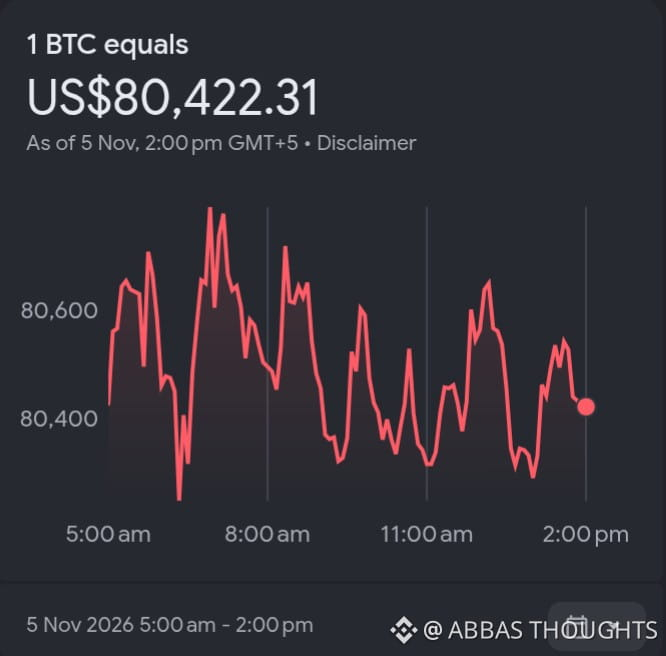
Bitcoin is showing signs of recovery after bouncing back above the $80,000 psychological level.
The short-term technical outlook is bullish, but BTC needs a confirmed breakout to continue its upward momentum.
📊 KEY MARKET LEVELS
🟢 Current reference price: $80,400
🟢 Support 1: $79,746
🟢 Support 2: $77,820
🔴 Resistance 1: $81,128
🔴 Resistance 2: $82,218
🔴 Major resistance: $83,582
📈 TECHNICAL ANALYSIS
• Daily RSI: 50.2 (neutral momentum)
• 4H trend: Bullish bias
• Daily trend: Bullish bias
• Weekly trend: Bullish bias
BULLISH SCENARIO 🚀
If BTC breaks and holds above $81,128, the next targets could be $82,218 and $83,582.
BEARISH SCENARIO ⚠️
If BTC loses $79,746, selling pressure could increase toward $77,820 and potentially $75,253.
🎯 MY MARKET VIEW
Bitcoin is showing recovery potential, but confirmation above resistance is important. Avoid chasing breakouts without volume confirmation.
What do you think?
{spot}(BTCUSDT)
🚀 BTC to $85K or correction toward $77K?
#Bitcoin #BTC #CryptoAnalysis #BinanceSquare #BitcoinTrading #CryptoMarket
$BTC BITCOIN (BTC) LATEST MARKET ANALYSIS – NOVEMBER 5, 2026
BTC rise Above $79000???
Bitcoin is showing signs of recovery after bouncing back above the $80,000 psychological level.
The short-term technical outlook is bullish, but BTC needs a confirmed breakout to continue its upward momentum.
📊 KEY MARKET LEVELS
🟢 Current reference price: $80,400
🟢 Support 1: $79,746
🟢 Support 2: $77,820
🔴 Resistance 1: $81,128
🔴 Resistance 2: $82,218
🔴 Major resistance: $83,582
📈 TECHNICAL ANALYSIS
• Daily RSI: 50.2 (neutral momentum)
• 4H trend: Bullish bias
• Daily trend: Bullish bias
• Weekly trend: Bullish bias
BULLISH SCENARIO 🚀
If BTC breaks and holds above $81,128, the next targets could be $82,218 and $83,582.
BEARISH SCENARIO ⚠️
If BTC loses $79,746, selling pressure could increase toward $77,820 and potentially $75,253.
🎯 MY MARKET VIEW
Bitcoin is showing recovery potential, but confirmation above resistance is important. Avoid chasing breakouts without volume confirmation.
What do you think?
🚀 BTC to $85K or correction toward $77K?
#Bitcoin #BTC #CryptoAnalysis #BinanceSquare #BitcoinTrading #CryptoMarket
BTC rise Above $79000???
Bitcoin is showing signs of recovery after bouncing back above the $80,000 psychological level.
The short-term technical outlook is bullish, but BTC needs a confirmed breakout to continue its upward momentum.
📊 KEY MARKET LEVELS
🟢 Current reference price: $80,400
🟢 Support 1: $79,746
🟢 Support 2: $77,820
🔴 Resistance 1: $81,128
🔴 Resistance 2: $82,218
🔴 Major resistance: $83,582
📈 TECHNICAL ANALYSIS
• Daily RSI: 50.2 (neutral momentum)
• 4H trend: Bullish bias
• Daily trend: Bullish bias
• Weekly trend: Bullish bias
BULLISH SCENARIO 🚀
If BTC breaks and holds above $81,128, the next targets could be $82,218 and $83,582.
BEARISH SCENARIO ⚠️
If BTC loses $79,746, selling pressure could increase toward $77,820 and potentially $75,253.
🎯 MY MARKET VIEW
Bitcoin is showing recovery potential, but confirmation above resistance is important. Avoid chasing breakouts without volume confirmation.
What do you think?
🚀 BTC to $85K or correction toward $77K?
#Bitcoin #BTC #CryptoAnalysis #BinanceSquare #BitcoinTrading #CryptoMarket
49
·
--
Bullish
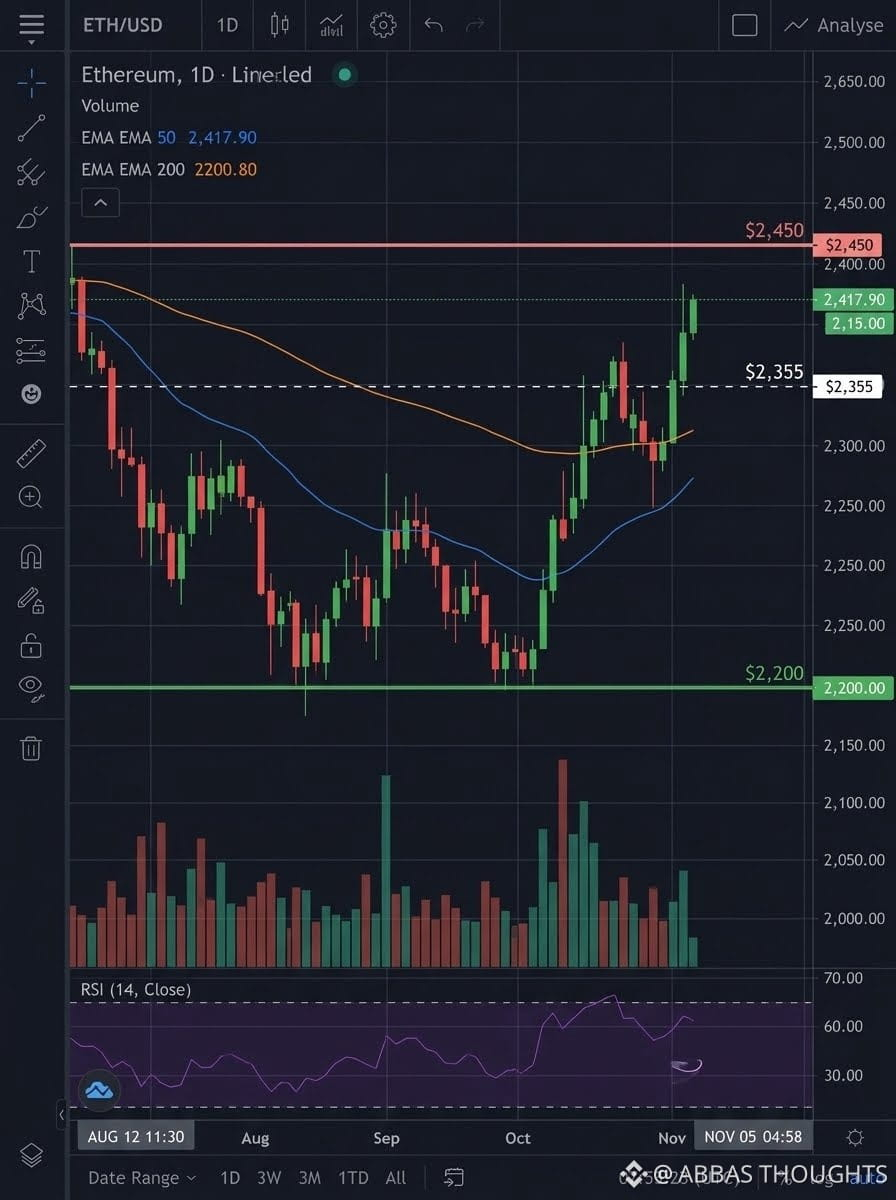
$ETH ETHEREUM (ETH) LATEST MARKET ANALYSIS
November 5, 2026
💰 Current Price: Approximately $2,425
🔍 Market Overview
Ethereum is showing bullish momentum after recovering above the $2,400 level. Buyers are currently showing strength, but traders should watch for possible short-term corrections.
📈 Key Resistance Levels
- R1: $2,453
- R2: $2,497
- R3: $2,558
📉 Key Support Levels
- S1: $2,412
- S2: $2,371
- S3: $2,322
📊 Technical Indicators
- Daily RSI: 54.2
- 4H RSI: 71.1
- Overall trend: Bullish
- Momentum: Strong
- Short-term volatility: High
🚀 Bullish Scenario
If ETH breaks and holds above $2,453, the next potential targets are $2,497 and $2,558.
⚠️ Bearish Scenario
If ETH loses the $2,412 support, a correction towards $2,371 or $2,322 could follow.
🎯 Trading Outlook
ETH currently has a bullish bias, but confirmation above resistance is important. Avoid chasing sudden price movements and always manage risk.
What is your prediction?
🟢 BULLISH 📈 or 🔴 BEARISH 📉?
{spot}(ETHUSDT)
#ETH #Ethereum #CryptoAnalysis #CryptoMarket #BinanceSquare #TradingSignals
$ETH ETHEREUM (ETH) LATEST MARKET ANALYSIS
November 5, 2026
💰 Current Price: Approximately $2,425
🔍 Market Overview
Ethereum is showing bullish momentum after recovering above the $2,400 level. Buyers are currently showing strength, but traders should watch for possible short-term corrections.
📈 Key Resistance Levels
- R1: $2,453
- R2: $2,497
- R3: $2,558
📉 Key Support Levels
- S1: $2,412
- S2: $2,371
- S3: $2,322
📊 Technical Indicators
- Daily RSI: 54.2
- 4H RSI: 71.1
- Overall trend: Bullish
- Momentum: Strong
- Short-term volatility: High
🚀 Bullish Scenario
If ETH breaks and holds above $2,453, the next potential targets are $2,497 and $2,558.
⚠️ Bearish Scenario
If ETH loses the $2,412 support, a correction towards $2,371 or $2,322 could follow.
🎯 Trading Outlook
ETH currently has a bullish bias, but confirmation above resistance is important. Avoid chasing sudden price movements and always manage risk.
What is your prediction?
🟢 BULLISH 📈 or 🔴 BEARISH 📉?
#ETH #Ethereum #CryptoAnalysis #CryptoMarket #BinanceSquare #TradingSignals
November 5, 2026
💰 Current Price: Approximately $2,425
🔍 Market Overview
Ethereum is showing bullish momentum after recovering above the $2,400 level. Buyers are currently showing strength, but traders should watch for possible short-term corrections.
📈 Key Resistance Levels
- R1: $2,453
- R2: $2,497
- R3: $2,558
📉 Key Support Levels
- S1: $2,412
- S2: $2,371
- S3: $2,322
📊 Technical Indicators
- Daily RSI: 54.2
- 4H RSI: 71.1
- Overall trend: Bullish
- Momentum: Strong
- Short-term volatility: High
🚀 Bullish Scenario
If ETH breaks and holds above $2,453, the next potential targets are $2,497 and $2,558.
⚠️ Bearish Scenario
If ETH loses the $2,412 support, a correction towards $2,371 or $2,322 could follow.
🎯 Trading Outlook
ETH currently has a bullish bias, but confirmation above resistance is important. Avoid chasing sudden price movements and always manage risk.
What is your prediction?
🟢 BULLISH 📈 or 🔴 BEARISH 📉?
#ETH #Ethereum #CryptoAnalysis #CryptoMarket #BinanceSquare #TradingSignals


45
·
--
Bullish
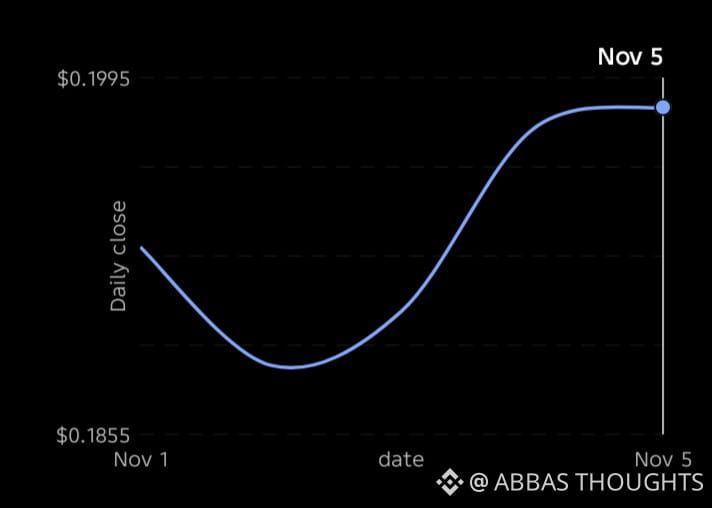
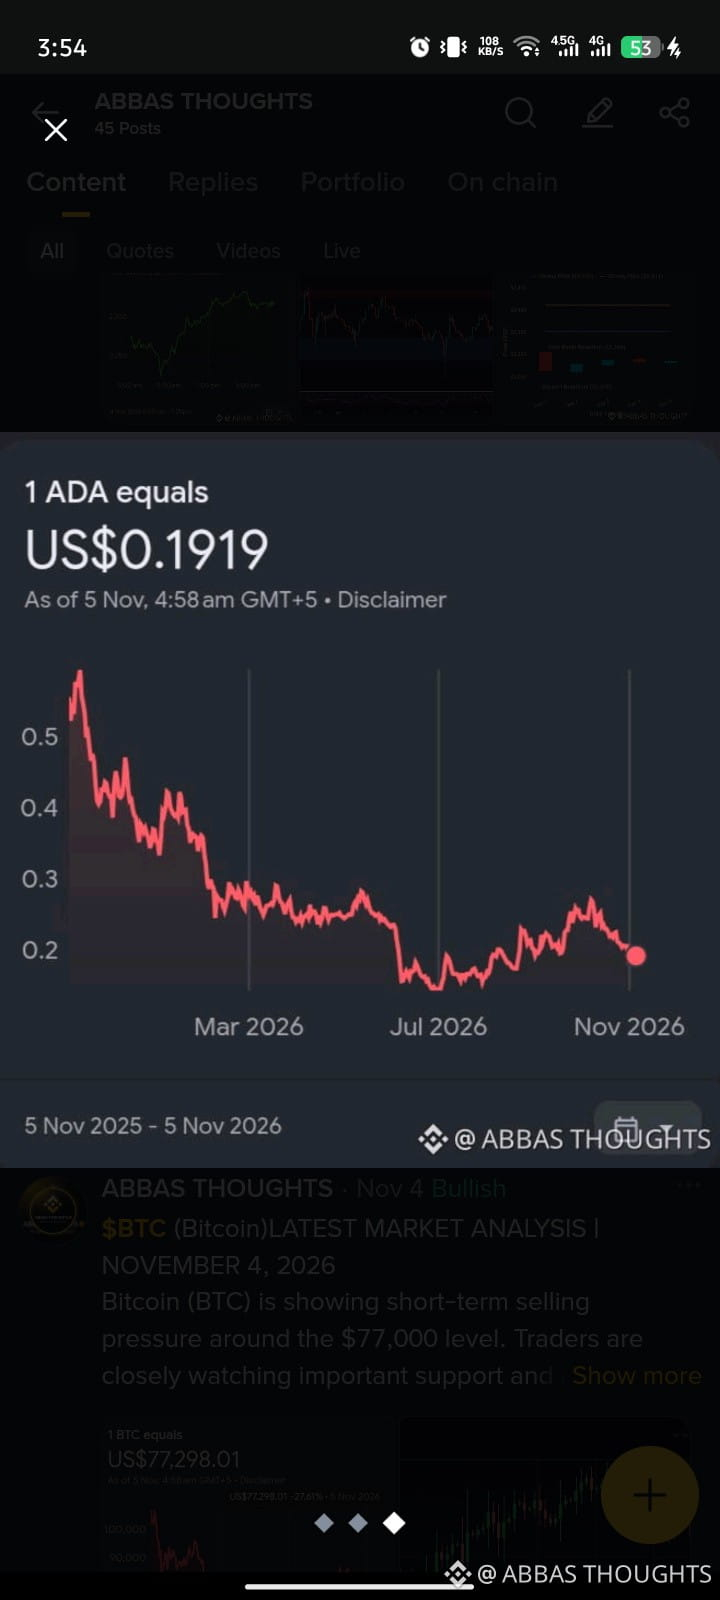
$ADA CARDANO (ADA) LATEST MARKET ANALYSIS – 5 NOVEMBER 2026
Current Price: Approximately $0.198–$0.199
Market Overview:
Cardano (ADA) is showing a short-term recovery, gaining around 3–4% over the last 24 hours. Buyers are attempting to push the price towards the $0.20 resistance zone.
However, the broader trend still needs confirmation.
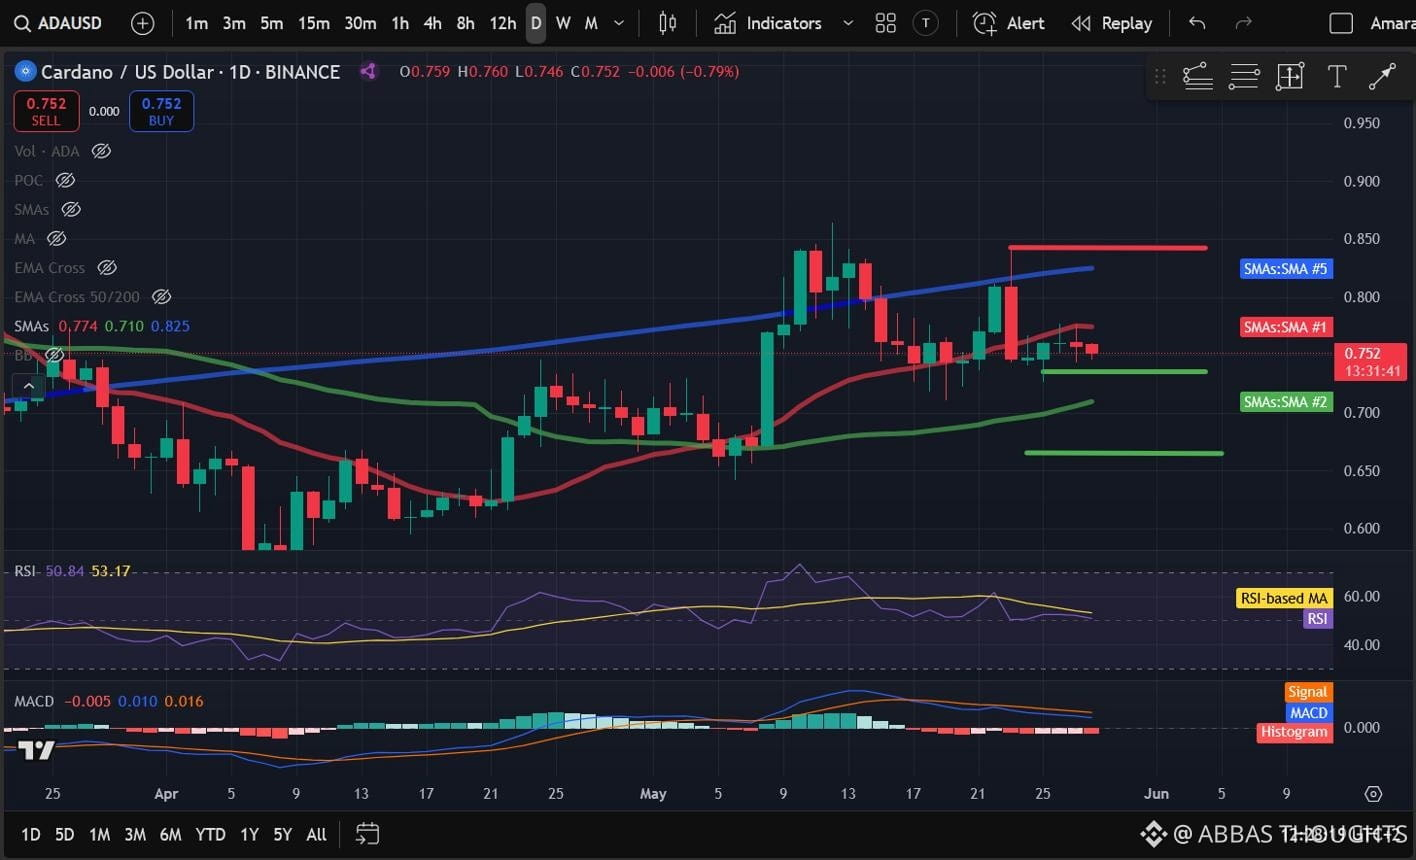
Key Support Levels:
- $0.1950
- $0.1888
- $0.1813
Key Resistance Levels:
- $0.2014
- $0.2079
- $0.2153
📈 Bullish Scenario:
If ADA breaks above $0.2014 with strong buying volume, the next potential targets are $0.2079 and $0.2153.
📉 Bearish Scenario:
If ADA fails to hold $0.1950, selling pressure could push the price towards $0.1888.
My Trading View:
ADA is showing signs of a short-term recovery, but confirmation above resistance is important. Traders should watch volume and candle-closing prices before entering a position.
⚠️ Risk Management: Avoid entering trades without confirmation. Always use proper stop-loss protection.
What is your prediction for ADA?
🚀 Bullish or 🔻 Bearish?
{spot}(ADAUSDT)
#ADA #cardano #CryptoAnalysis #BinanceSquare #Altcoins #TradingSignals #CryptoMarket
$ADA CARDANO (ADA) LATEST MARKET ANALYSIS – 5 NOVEMBER 2026
Current Price: Approximately $0.198–$0.199
Market Overview:
Cardano (ADA) is showing a short-term recovery, gaining around 3–4% over the last 24 hours. Buyers are attempting to push the price towards the $0.20 resistance zone.
However, the broader trend still needs confirmation.
Key Support Levels:
- $0.1950
- $0.1888
- $0.1813
Key Resistance Levels:
- $0.2014
- $0.2079
- $0.2153
📈 Bullish Scenario:
If ADA breaks above $0.2014 with strong buying volume, the next potential targets are $0.2079 and $0.2153.
📉 Bearish Scenario:
If ADA fails to hold $0.1950, selling pressure could push the price towards $0.1888.
My Trading View:
ADA is showing signs of a short-term recovery, but confirmation above resistance is important. Traders should watch volume and candle-closing prices before entering a position.
⚠️ Risk Management: Avoid entering trades without confirmation. Always use proper stop-loss protection.
What is your prediction for ADA?
🚀 Bullish or 🔻 Bearish?
#ADA #cardano #CryptoAnalysis #BinanceSquare #Altcoins #TradingSignals #CryptoMarket
Current Price: Approximately $0.198–$0.199
Market Overview:
Cardano (ADA) is showing a short-term recovery, gaining around 3–4% over the last 24 hours. Buyers are attempting to push the price towards the $0.20 resistance zone.
However, the broader trend still needs confirmation.
Key Support Levels:
- $0.1950
- $0.1888
- $0.1813
Key Resistance Levels:
- $0.2014
- $0.2079
- $0.2153
📈 Bullish Scenario:
If ADA breaks above $0.2014 with strong buying volume, the next potential targets are $0.2079 and $0.2153.
📉 Bearish Scenario:
If ADA fails to hold $0.1950, selling pressure could push the price towards $0.1888.
My Trading View:
ADA is showing signs of a short-term recovery, but confirmation above resistance is important. Traders should watch volume and candle-closing prices before entering a position.
⚠️ Risk Management: Avoid entering trades without confirmation. Always use proper stop-loss protection.
What is your prediction for ADA?
🚀 Bullish or 🔻 Bearish?
#ADA #cardano #CryptoAnalysis #BinanceSquare #Altcoins #TradingSignals #CryptoMarket

71
·
--
Bullish
$BTC BITCOIN LATEST TECHNICAL ANALYSIS
Date: 5 November 2026
BTC Market Overview
Bitcoin is showing signs of recovery, with price trading around the $80,000 zone. Buyers are attempting to maintain bullish momentum, but resistance near $81,100 remains an important hurdle.
📊 Technical Indicators
- Daily RSI: 50.4
- Market Momentum: Bullish bias
- 4H Trend: Bullish
- Volatility: High
Important Support Levels 🟢
- $79,700
- $77,820
- $75,250
Important Resistance Levels 🔴
- $81,128
- $82,218
- $83,562
Bullish Scenario 🟢
A strong 4H and daily candle close above $81,128 could open the way towards $82,218 and $83,562.
Bearish Scenario 🔴
If BTC loses $79,700 with strong selling pressure, a correction towards $77,820 may follow.
My Market View
BTC currently has a bullish bias, but confirmation above resistance is important. Traders should avoid chasing sudden price movements and manage risk carefully.
⚠️ This is technical analysis, not financial advice. Always use proper risk management.
{spot}(BTCUSDT)
#Bitcoin #BTC #CryptoAnalysis #TechnicalAnalysis #CryptoAnalysis"
$BTC BITCOIN LATEST TECHNICAL ANALYSIS
Date: 5 November 2026
BTC Market Overview
Bitcoin is showing signs of recovery, with price trading around the $80,000 zone. Buyers are attempting to maintain bullish momentum, but resistance near $81,100 remains an important hurdle.
📊 Technical Indicators
- Daily RSI: 50.4
- Market Momentum: Bullish bias
- 4H Trend: Bullish
- Volatility: High
Important Support Levels 🟢
- $79,700
- $77,820
- $75,250
Important Resistance Levels 🔴
- $81,128
- $82,218
- $83,562
Bullish Scenario 🟢
A strong 4H and daily candle close above $81,128 could open the way towards $82,218 and $83,562.
Bearish Scenario 🔴
If BTC loses $79,700 with strong selling pressure, a correction towards $77,820 may follow.
My Market View
BTC currently has a bullish bias, but confirmation above resistance is important. Traders should avoid chasing sudden price movements and manage risk carefully.
⚠️ This is technical analysis, not financial advice. Always use proper risk management.
#Bitcoin #BTC #CryptoAnalysis #TechnicalAnalysis #CryptoAnalysis"
Date: 5 November 2026
BTC Market Overview
Bitcoin is showing signs of recovery, with price trading around the $80,000 zone. Buyers are attempting to maintain bullish momentum, but resistance near $81,100 remains an important hurdle.
📊 Technical Indicators
- Daily RSI: 50.4
- Market Momentum: Bullish bias
- 4H Trend: Bullish
- Volatility: High
Important Support Levels 🟢
- $79,700
- $77,820
- $75,250
Important Resistance Levels 🔴
- $81,128
- $82,218
- $83,562
Bullish Scenario 🟢
A strong 4H and daily candle close above $81,128 could open the way towards $82,218 and $83,562.
Bearish Scenario 🔴
If BTC loses $79,700 with strong selling pressure, a correction towards $77,820 may follow.
My Market View
BTC currently has a bullish bias, but confirmation above resistance is important. Traders should avoid chasing sudden price movements and manage risk carefully.
⚠️ This is technical analysis, not financial advice. Always use proper risk management.
#Bitcoin #BTC #CryptoAnalysis #TechnicalAnalysis #CryptoAnalysis"
64
·
--
Bullish
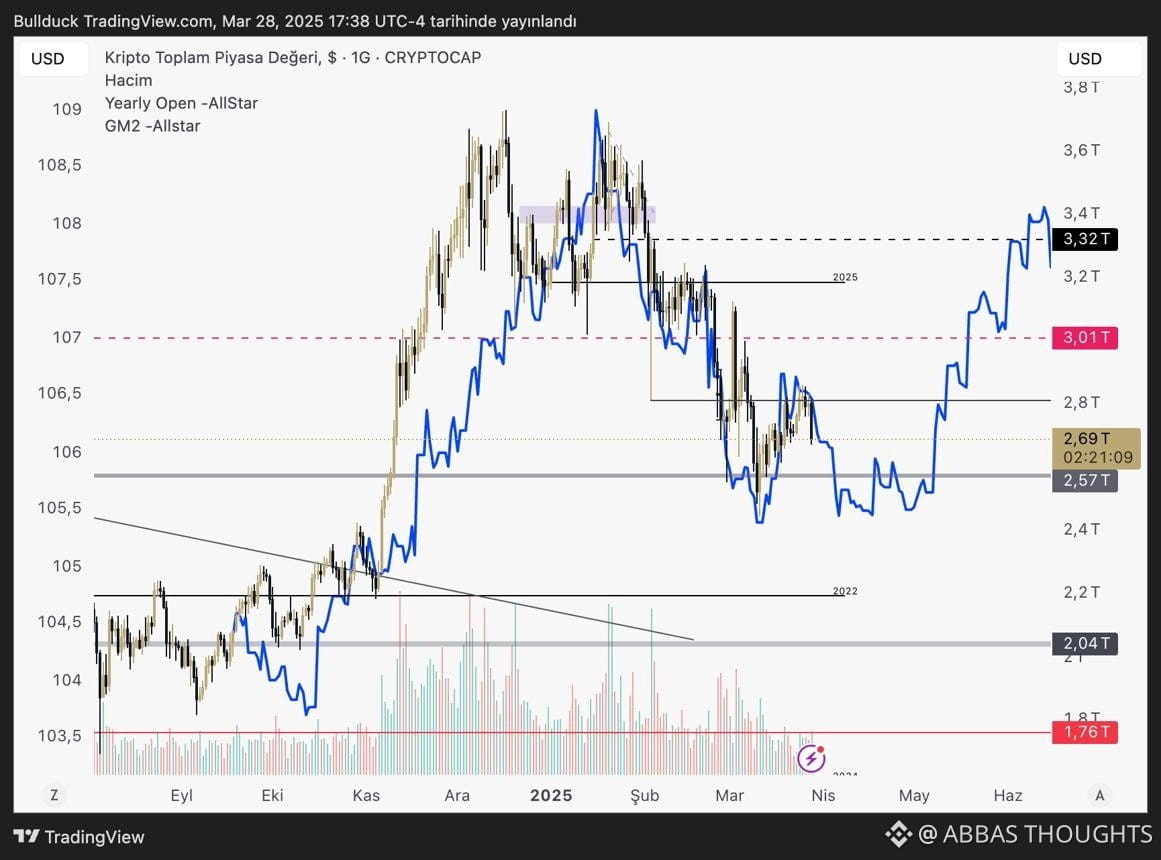
🌍 CRYPTO MARKET OVERALL UPDATE | NOVEMBER 4, 2026
📊 Global Crypto Market Overview
The cryptocurrency market is showing mixed signals today. Bitcoin and Ethereum are attempting to recover, but the overall market remains under pressure.
🔸 Bitcoin $BTC : Around $78,354
🔸 Ethereum $ETH : Around $2,323
🔸 Total Crypto Market Cap: Approximately $2.61 Trillion
🔸 BTC Dominance: Around 59.3%
🔸 Market Sentiment: Fear
📈 MARKET ANALYSIS
Bitcoin (BTC):
Bitcoin is showing recovery attempts. Traders should watch whether BTC can maintain its recent gains and establish stronger support.
Ethereum (ETH):
ETH is also recovering, but confirmation through stronger buying volume is important before expecting a sustained bullish move.
Altcoins:
Most altcoins are still struggling to outperform Bitcoin. A meaningful decline in BTC dominance could support a broader altcoin recovery.
🎯 WHAT TO WATCH NEXT?
1. Bitcoin's support and resistance levels.
2. Ethereum's recovery momentum.
3. BTC dominance movement.
4. Trading volume and market liquidity.
5. Overall market sentiment.
🚀 MY MARKET OUTLOOK
The market is showing signs of recovery, but a confirmed bullish trend is not guaranteed yet.
Traders should avoid emotional decisions, manage risk carefully, and wait for proper confirmation before entering positions.
⚠️ Always use proper stop-loss and risk management.
💬 QUESTION FOR THE COMMUNITY:
Are we preparing for another bullish move, or is this just a temporary market recovery?
{spot}(BTCUSDT)
{spot}(ETHUSDT)
{spot}(ADAUSDT)
#Crypto #Bitcoin #Ethereum #Altcoins #CryptoMarket #BTC #ETH #Trading #MarketAnalysis
🌍 CRYPTO MARKET OVERALL UPDATE | NOVEMBER 4, 2026
📊 Global Crypto Market Overview
The cryptocurrency market is showing mixed signals today. Bitcoin and Ethereum are attempting to recover, but the overall market remains under pressure.
🔸 Bitcoin $BTC : Around $78,354
🔸 Ethereum $ETH : Around $2,323
🔸 Total Crypto Market Cap: Approximately $2.61 Trillion
🔸 BTC Dominance: Around 59.3%
🔸 Market Sentiment: Fear
📈 MARKET ANALYSIS
Bitcoin (BTC):
Bitcoin is showing recovery attempts. Traders should watch whether BTC can maintain its recent gains and establish stronger support.
Ethereum (ETH):
ETH is also recovering, but confirmation through stronger buying volume is important before expecting a sustained bullish move.
Altcoins:
Most altcoins are still struggling to outperform Bitcoin. A meaningful decline in BTC dominance could support a broader altcoin recovery.
🎯 WHAT TO WATCH NEXT?
1. Bitcoin's support and resistance levels.
2. Ethereum's recovery momentum.
3. BTC dominance movement.
4. Trading volume and market liquidity.
5. Overall market sentiment.
🚀 MY MARKET OUTLOOK
The market is showing signs of recovery, but a confirmed bullish trend is not guaranteed yet.
Traders should avoid emotional decisions, manage risk carefully, and wait for proper confirmation before entering positions.
⚠️ Always use proper stop-loss and risk management.
💬 QUESTION FOR THE COMMUNITY:
Are we preparing for another bullish move, or is this just a temporary market recovery?
#Crypto #Bitcoin #Ethereum #Altcoins #CryptoMarket #BTC #ETH #Trading #MarketAnalysis
📊 Global Crypto Market Overview
The cryptocurrency market is showing mixed signals today. Bitcoin and Ethereum are attempting to recover, but the overall market remains under pressure.
🔸 Bitcoin $BTC : Around $78,354
🔸 Ethereum $ETH : Around $2,323
🔸 Total Crypto Market Cap: Approximately $2.61 Trillion
🔸 BTC Dominance: Around 59.3%
🔸 Market Sentiment: Fear
📈 MARKET ANALYSIS
Bitcoin (BTC):
Bitcoin is showing recovery attempts. Traders should watch whether BTC can maintain its recent gains and establish stronger support.
Ethereum (ETH):
ETH is also recovering, but confirmation through stronger buying volume is important before expecting a sustained bullish move.
Altcoins:
Most altcoins are still struggling to outperform Bitcoin. A meaningful decline in BTC dominance could support a broader altcoin recovery.
🎯 WHAT TO WATCH NEXT?
1. Bitcoin's support and resistance levels.
2. Ethereum's recovery momentum.
3. BTC dominance movement.
4. Trading volume and market liquidity.
5. Overall market sentiment.
🚀 MY MARKET OUTLOOK
The market is showing signs of recovery, but a confirmed bullish trend is not guaranteed yet.
Traders should avoid emotional decisions, manage risk carefully, and wait for proper confirmation before entering positions.
⚠️ Always use proper stop-loss and risk management.
💬 QUESTION FOR THE COMMUNITY:
Are we preparing for another bullish move, or is this just a temporary market recovery?
#Crypto #Bitcoin #Ethereum #Altcoins #CryptoMarket #BTC #ETH #Trading #MarketAnalysis
31
·
--
Bullish
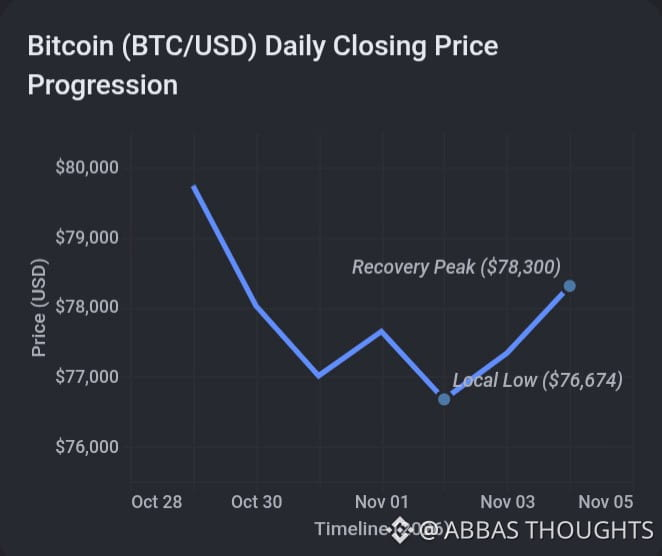
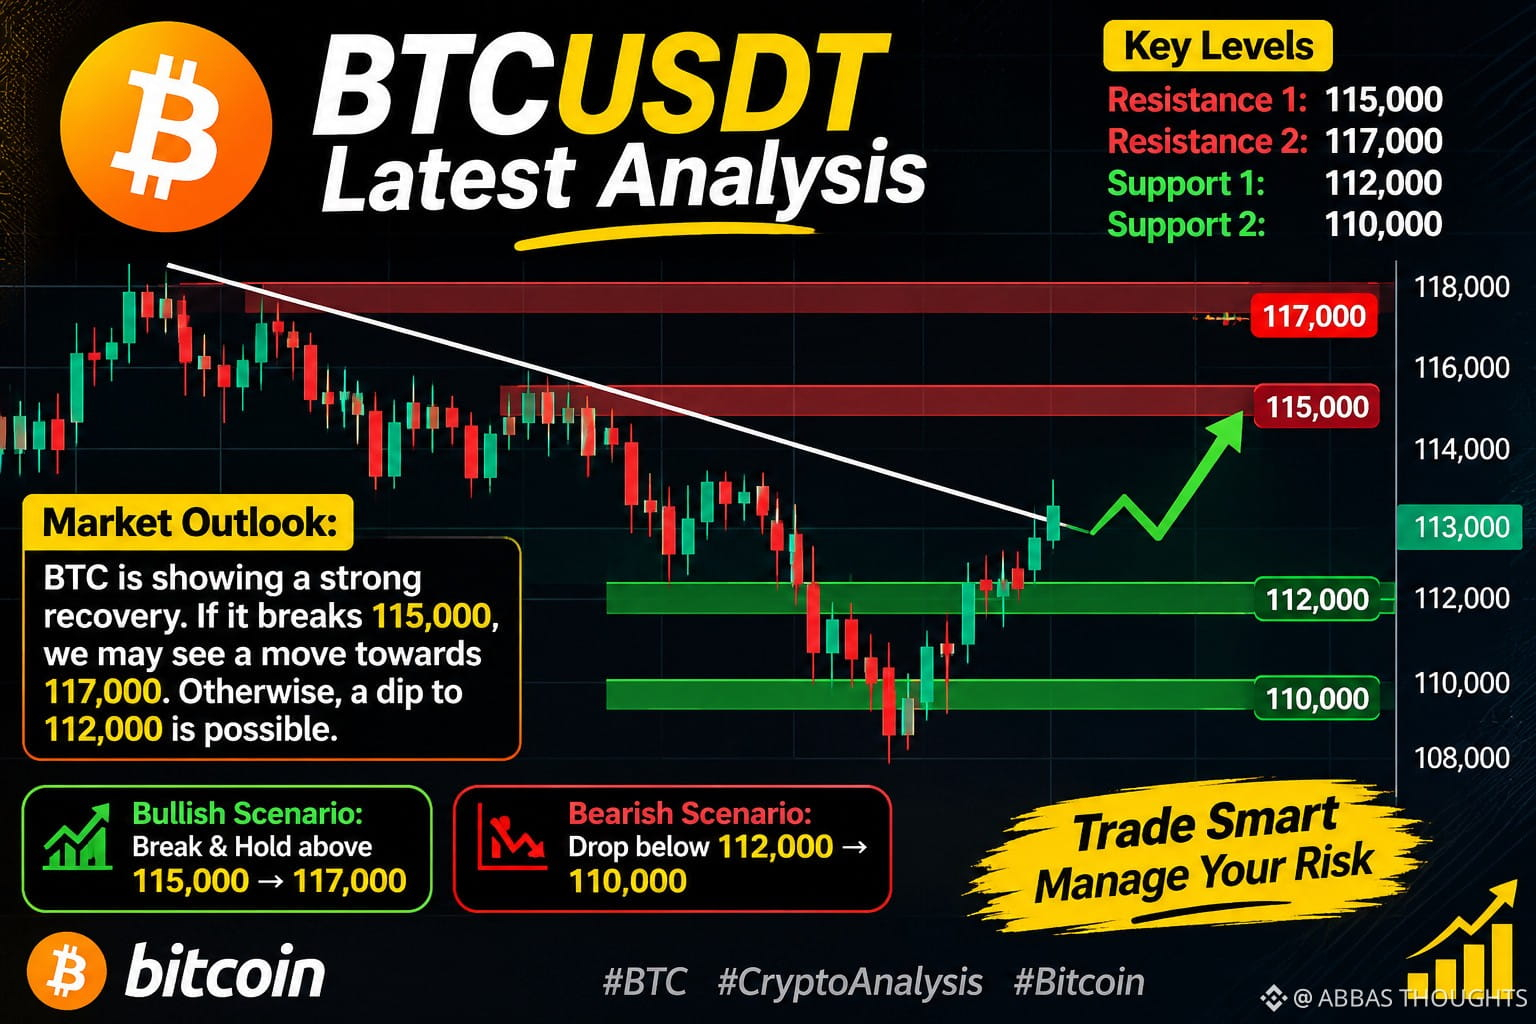
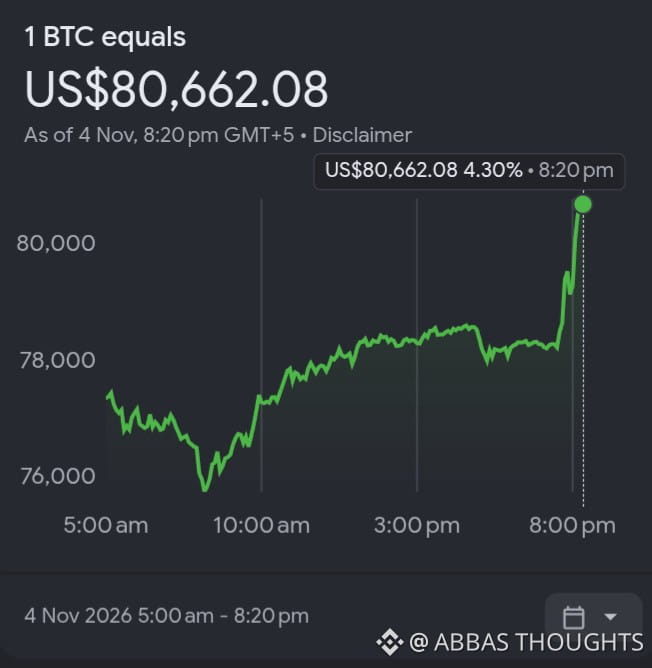
$BTC ₿ BTC/USDT – Bitcoin Market Analysis
Bitcoin is showing signs of recovery after recent selling pressure. Bulls are attempting to regain control, but key resistance levels remain important.
📊 Key Technical Levels
🔴 Resistance 1: $115,000
🔴 Resistance 2: $117,000
🟢 Support 1: $112,000
🟢 Support 2: $110,000
📈 Bullish Scenario:
If BTC breaks and holds above $115,000, the next potential target could be $117,000.
📉 Bearish Scenario:
If BTC loses the $112,000 support, further downside toward $110,000 is possible.
🎯 Trading Strategy:
Wait for confirmation before entering any trade. Always use proper stop-loss and risk management.
⚠️ Trade carefully. This is market analysis, not financial advice.
{spot}(BTCUSDT)
#Bitcoin #BTC #CryptoAnalysis #BTCUSDT #CryptoTrading #Binance #Bybit
$BTC ₿ BTC/USDT – Bitcoin Market Analysis
Bitcoin is showing signs of recovery after recent selling pressure. Bulls are attempting to regain control, but key resistance levels remain important.
📊 Key Technical Levels
🔴 Resistance 1: $115,000
🔴 Resistance 2: $117,000
🟢 Support 1: $112,000
🟢 Support 2: $110,000
📈 Bullish Scenario:
If BTC breaks and holds above $115,000, the next potential target could be $117,000.
📉 Bearish Scenario:
If BTC loses the $112,000 support, further downside toward $110,000 is possible.
🎯 Trading Strategy:
Wait for confirmation before entering any trade. Always use proper stop-loss and risk management.
⚠️ Trade carefully. This is market analysis, not financial advice.
#Bitcoin #BTC #CryptoAnalysis #BTCUSDT #CryptoTrading #Binance #Bybit
Bitcoin is showing signs of recovery after recent selling pressure. Bulls are attempting to regain control, but key resistance levels remain important.
📊 Key Technical Levels
🔴 Resistance 1: $115,000
🔴 Resistance 2: $117,000
🟢 Support 1: $112,000
🟢 Support 2: $110,000
📈 Bullish Scenario:
If BTC breaks and holds above $115,000, the next potential target could be $117,000.
📉 Bearish Scenario:
If BTC loses the $112,000 support, further downside toward $110,000 is possible.
🎯 Trading Strategy:
Wait for confirmation before entering any trade. Always use proper stop-loss and risk management.
⚠️ Trade carefully. This is market analysis, not financial advice.
#Bitcoin #BTC #CryptoAnalysis #BTCUSDT #CryptoTrading #Binance #Bybit
35
·
--
Bullish
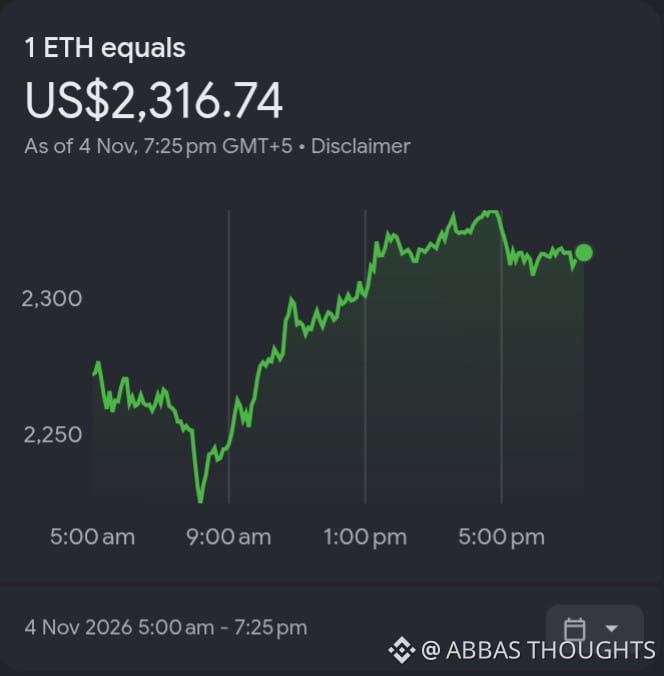
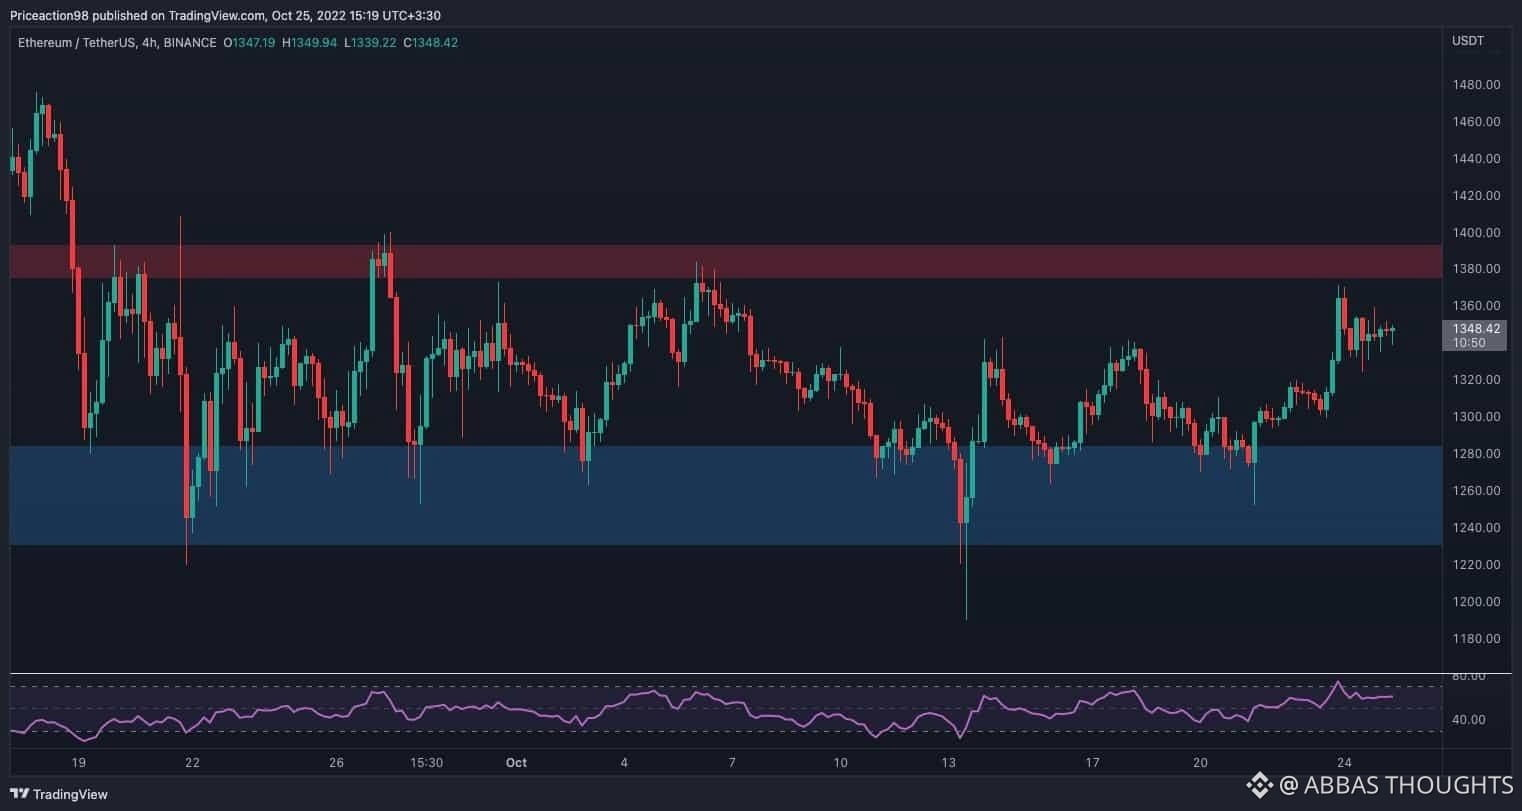
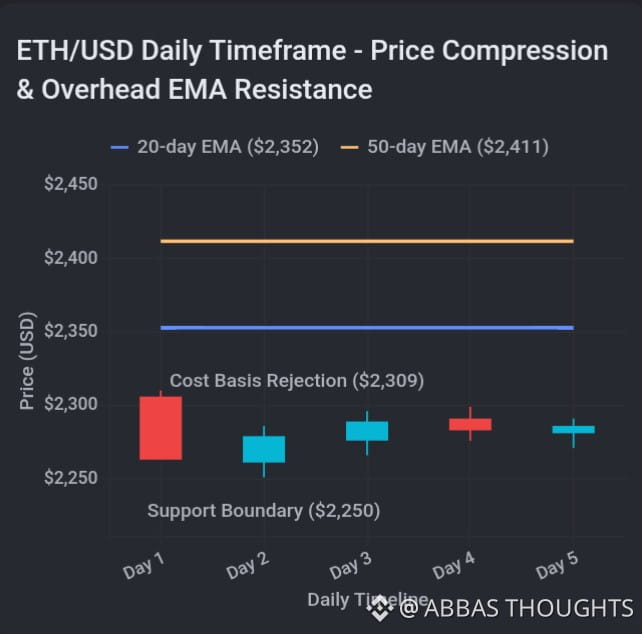
$ETH ETHEREUM – LATEST TECHNICAL ANALYSIS
📊 Market Overview
Ethereum is showing mixed momentum, with short-term recovery attempts while the broader daily trend remains under bearish pressure.
Current Market Structure
- Market Bias: Neutral to Bearish
- Key Resistance: $2,305
- Major Resistance: $2,339
- Key Support: $2,237
- Major Support: $2,203
🟢 BULLISH SCENARIO
If ETH breaks and holds above $2,305, buyers could push the price toward:
- Target 1: $2,339
- Target 2: $2,373
🔴 BEARISH SCENARIO
If ETH loses the $2,237 support zone, further downside could follow:
- Target 1: $2,203
- Target 2: $2,170
Technical Indicators
- RSI (14): 36.6
- Daily trend: Bearish
- 4H trend: Mixed
- 1H trend: Bullish recovery
Trading Strategy
Wait for a confirmed breakout or breakdown before entering a position. Always use proper stop-loss and risk management.
⚠️ This is a technical market analysis, not financial advice.
{spot}(ETHUSDT)
#ETH #Ethereum #CryptoAnalysis #Trading #CryptoMarket #TechnicalAnalysis
$ETH ETHEREUM – LATEST TECHNICAL ANALYSIS
📊 Market Overview
Ethereum is showing mixed momentum, with short-term recovery attempts while the broader daily trend remains under bearish pressure.
Current Market Structure
- Market Bias: Neutral to Bearish
- Key Resistance: $2,305
- Major Resistance: $2,339
- Key Support: $2,237
- Major Support: $2,203
🟢 BULLISH SCENARIO
If ETH breaks and holds above $2,305, buyers could push the price toward:
- Target 1: $2,339
- Target 2: $2,373
🔴 BEARISH SCENARIO
If ETH loses the $2,237 support zone, further downside could follow:
- Target 1: $2,203
- Target 2: $2,170
Technical Indicators
- RSI (14): 36.6
- Daily trend: Bearish
- 4H trend: Mixed
- 1H trend: Bullish recovery
Trading Strategy
Wait for a confirmed breakout or breakdown before entering a position. Always use proper stop-loss and risk management.
⚠️ This is a technical market analysis, not financial advice.
#ETH #Ethereum #CryptoAnalysis #Trading #CryptoMarket #TechnicalAnalysis
📊 Market Overview
Ethereum is showing mixed momentum, with short-term recovery attempts while the broader daily trend remains under bearish pressure.
Current Market Structure
- Market Bias: Neutral to Bearish
- Key Resistance: $2,305
- Major Resistance: $2,339
- Key Support: $2,237
- Major Support: $2,203
🟢 BULLISH SCENARIO
If ETH breaks and holds above $2,305, buyers could push the price toward:
- Target 1: $2,339
- Target 2: $2,373
🔴 BEARISH SCENARIO
If ETH loses the $2,237 support zone, further downside could follow:
- Target 1: $2,203
- Target 2: $2,170
Technical Indicators
- RSI (14): 36.6
- Daily trend: Bearish
- 4H trend: Mixed
- 1H trend: Bullish recovery
Trading Strategy
Wait for a confirmed breakout or breakdown before entering a position. Always use proper stop-loss and risk management.
⚠️ This is a technical market analysis, not financial advice.
#ETH #Ethereum #CryptoAnalysis #Trading #CryptoMarket #TechnicalAnalysis
42
·
--
Bullish
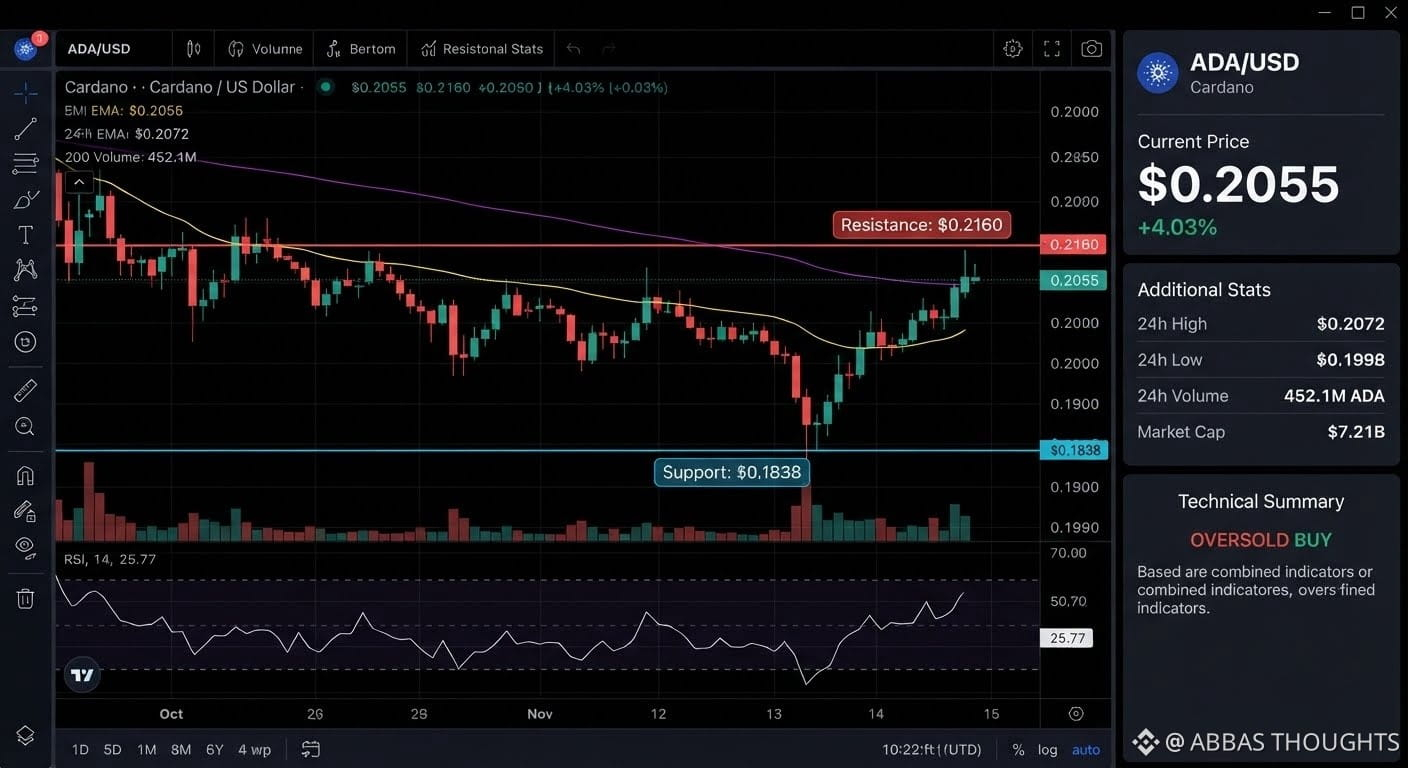
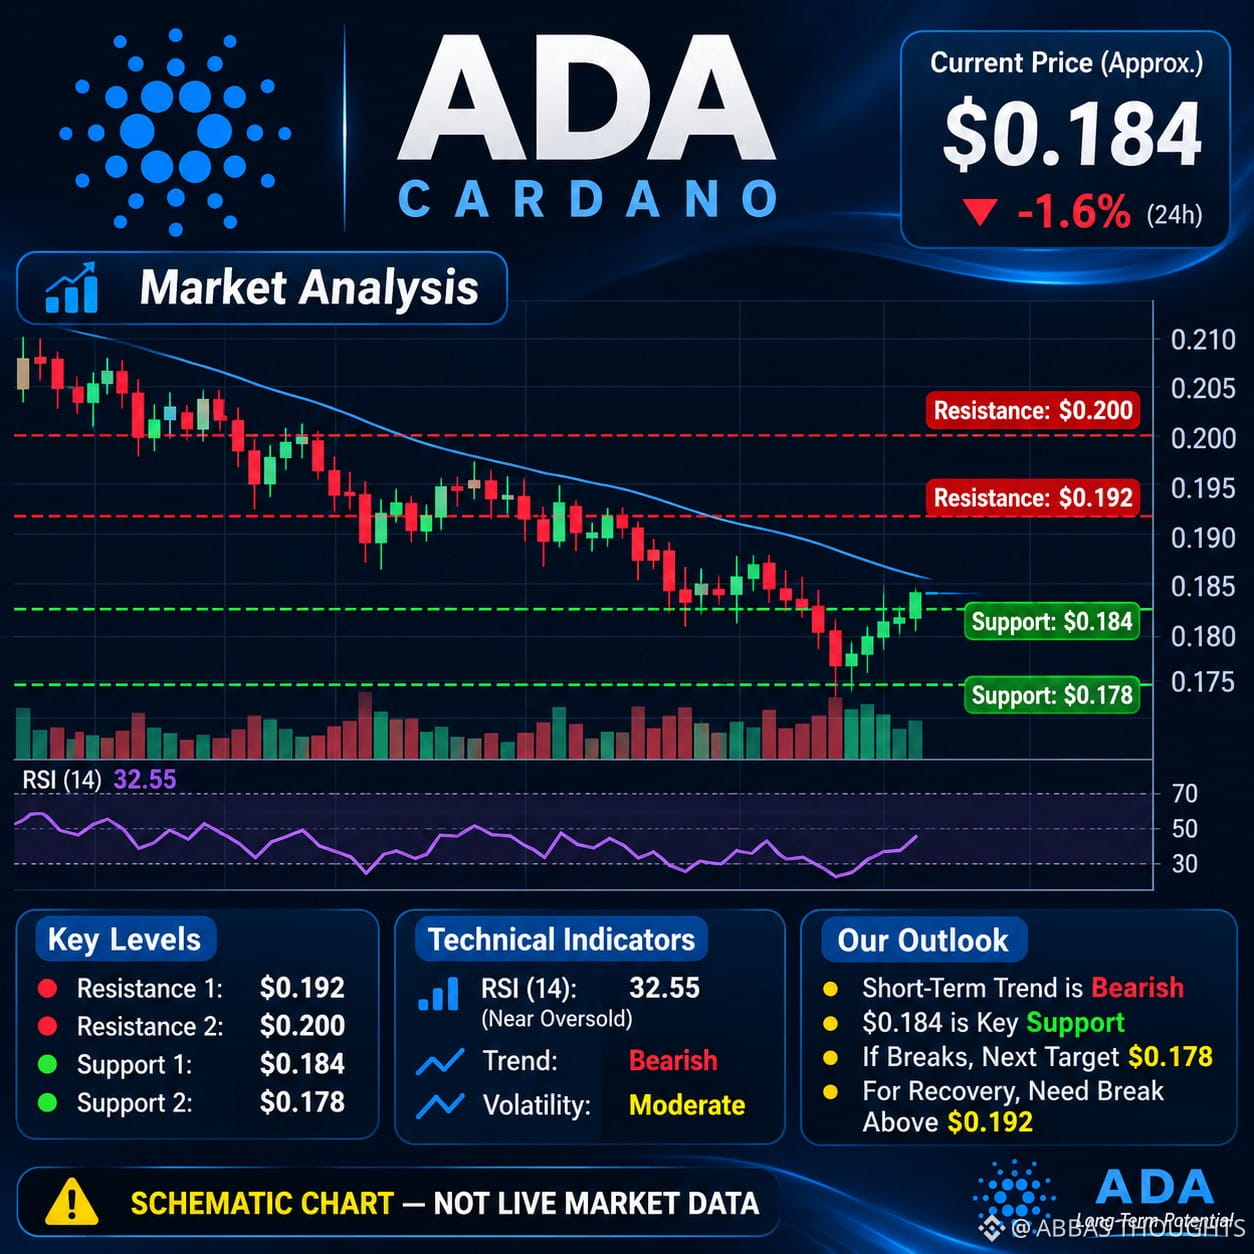
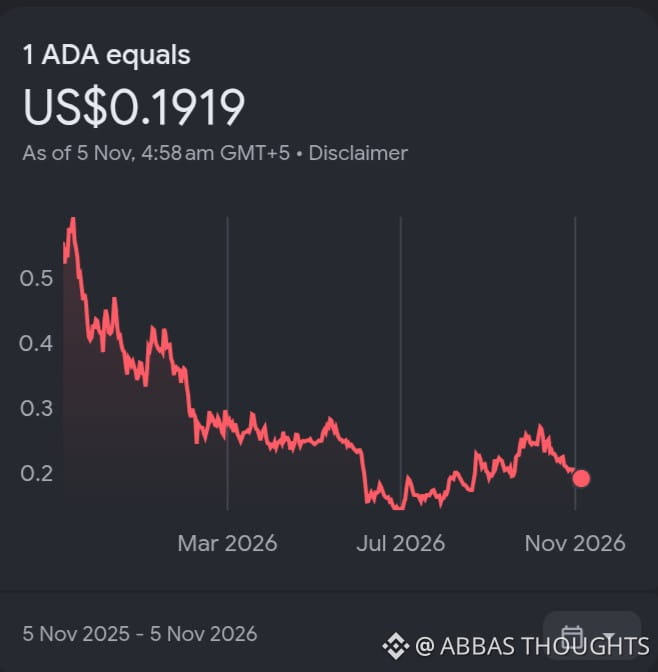
$ADA CARDANO LATEST MARKET ANALYSIS
November 4, 2026
Current Price: Approximately $0.189
Market Trend: Short-Term Bearish
Technical Analysis
ADA is showing weak momentum as sellers continue to put pressure on the market. However, a short-term recovery is possible if buyers regain control.
📉 Support Levels
- Support 1: $0.1846
- Support 2: $0.1785
- Support 3: $0.1693
📈 Resistance Levels
- Resistance 1: $0.1920
- Resistance 2: $0.2002
- Resistance 3: $0.2084
📊 RSI Indicator: Around 33, indicating weak momentum and near-oversold conditions.
Trading Scenarios
🟢 Bullish Scenario:
A strong breakout above $0.1920 could open the way toward $0.2002.
🔴 Bearish Scenario:
A breakdown below $0.1846 could push ADA toward $0.1785.
Final Market Outlook
ADA remains under bearish pressure. Traders should wait for confirmation before entering any position. Watch Bitcoin's movement because it can influence ADA's next direction.
⚠️ Always use proper risk management and stop-loss protection.
{spot}(ADAUSDT)
#ADA #Cardano #CryptoAnalysis #TechnicalAnalysis #Binance #CryptoTrading
$ADA CARDANO LATEST MARKET ANALYSIS
November 4, 2026
Current Price: Approximately $0.189
Market Trend: Short-Term Bearish
Technical Analysis
ADA is showing weak momentum as sellers continue to put pressure on the market. However, a short-term recovery is possible if buyers regain control.
📉 Support Levels
- Support 1: $0.1846
- Support 2: $0.1785
- Support 3: $0.1693
📈 Resistance Levels
- Resistance 1: $0.1920
- Resistance 2: $0.2002
- Resistance 3: $0.2084
📊 RSI Indicator: Around 33, indicating weak momentum and near-oversold conditions.
Trading Scenarios
🟢 Bullish Scenario:
A strong breakout above $0.1920 could open the way toward $0.2002.
🔴 Bearish Scenario:
A breakdown below $0.1846 could push ADA toward $0.1785.
Final Market Outlook
ADA remains under bearish pressure. Traders should wait for confirmation before entering any position. Watch Bitcoin's movement because it can influence ADA's next direction.
⚠️ Always use proper risk management and stop-loss protection.
#ADA #Cardano #CryptoAnalysis #TechnicalAnalysis #Binance #CryptoTrading
November 4, 2026
Current Price: Approximately $0.189
Market Trend: Short-Term Bearish
Technical Analysis
ADA is showing weak momentum as sellers continue to put pressure on the market. However, a short-term recovery is possible if buyers regain control.
📉 Support Levels
- Support 1: $0.1846
- Support 2: $0.1785
- Support 3: $0.1693
📈 Resistance Levels
- Resistance 1: $0.1920
- Resistance 2: $0.2002
- Resistance 3: $0.2084
📊 RSI Indicator: Around 33, indicating weak momentum and near-oversold conditions.
Trading Scenarios
🟢 Bullish Scenario:
A strong breakout above $0.1920 could open the way toward $0.2002.
🔴 Bearish Scenario:
A breakdown below $0.1846 could push ADA toward $0.1785.
Final Market Outlook
ADA remains under bearish pressure. Traders should wait for confirmation before entering any position. Watch Bitcoin's movement because it can influence ADA's next direction.
⚠️ Always use proper risk management and stop-loss protection.
#ADA #Cardano #CryptoAnalysis #TechnicalAnalysis #Binance #CryptoTrading
1
3
818
·
--
Bullish
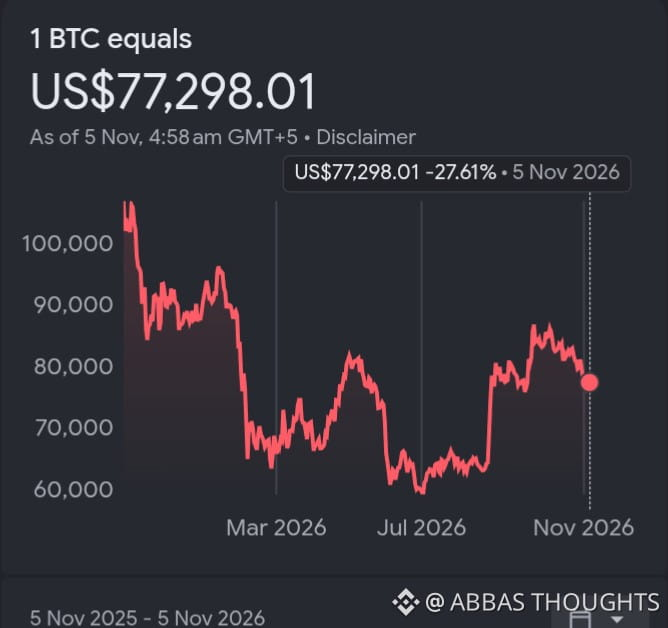
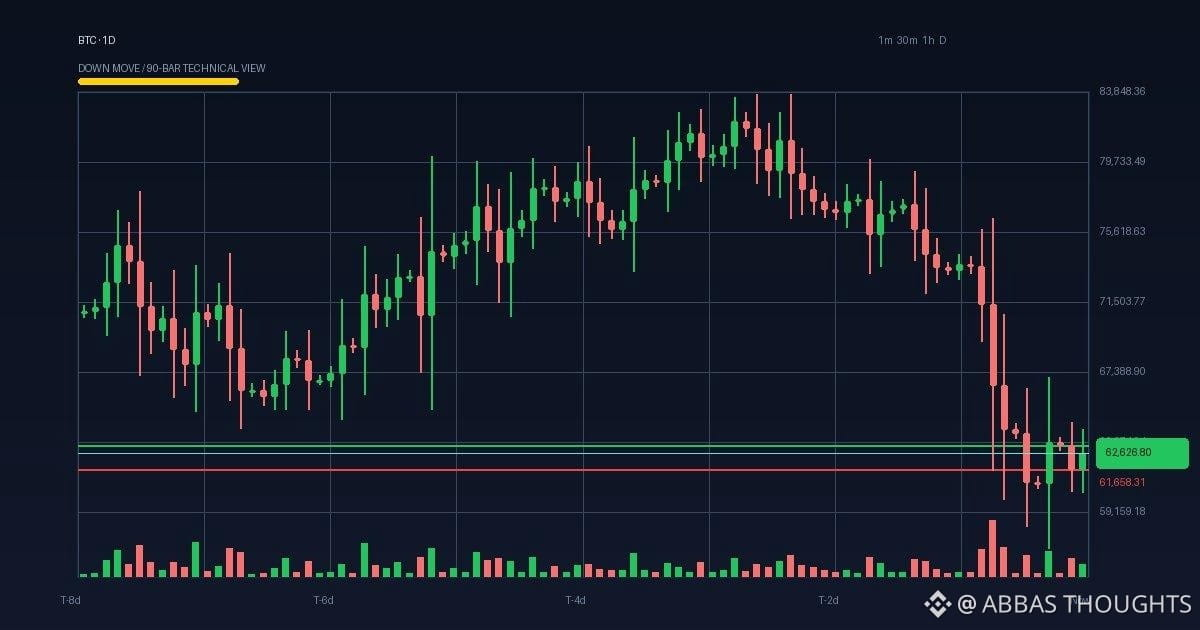
$BTC (Bitcoin)LATEST MARKET ANALYSIS | NOVEMBER 4, 2026
Bitcoin (BTC) is showing short-term selling pressure around the $77,000 level. Traders are closely watching important support and resistance zones.
📊 SUPPORT LEVELS:
🔹 $76,783
🔹 $76,091
🔹 $75,023
📈 RESISTANCE LEVELS:
🔹 $78,346
🔹 $79,828
🔹 $81,783
🟢 BULLISH SCENARIO:
If BTC breaks and holds above $78,346, the next potential targets are $79,828 and $81,783.
🔴 BEARISH SCENARIO:
If BTC breaks below $76,783, further downside toward $76,091 and $75,023 is possible.
MARKET OUTLOOK:
Bitcoin is showing weak short-term momentum. Watch trading volume, RSI, and candlestick confirmations before entering any trade.
⚠️ Always use stop-loss and proper risk management.
{spot}(BTCUSDT)
#BTC #Bitcoin #CryptoAnalysis #CryptoTrading #BinanceSquare #BitcoinUpdate
$BTC (Bitcoin)LATEST MARKET ANALYSIS | NOVEMBER 4, 2026
Bitcoin (BTC) is showing short-term selling pressure around the $77,000 level. Traders are closely watching important support and resistance zones.
📊 SUPPORT LEVELS:
🔹 $76,783
🔹 $76,091
🔹 $75,023
📈 RESISTANCE LEVELS:
🔹 $78,346
🔹 $79,828
🔹 $81,783
🟢 BULLISH SCENARIO:
If BTC breaks and holds above $78,346, the next potential targets are $79,828 and $81,783.
🔴 BEARISH SCENARIO:
If BTC breaks below $76,783, further downside toward $76,091 and $75,023 is possible.
MARKET OUTLOOK:
Bitcoin is showing weak short-term momentum. Watch trading volume, RSI, and candlestick confirmations before entering any trade.
⚠️ Always use stop-loss and proper risk management.
#BTC #Bitcoin #CryptoAnalysis #CryptoTrading #BinanceSquare #BitcoinUpdate
Bitcoin (BTC) is showing short-term selling pressure around the $77,000 level. Traders are closely watching important support and resistance zones.
📊 SUPPORT LEVELS:
🔹 $76,783
🔹 $76,091
🔹 $75,023
📈 RESISTANCE LEVELS:
🔹 $78,346
🔹 $79,828
🔹 $81,783
🟢 BULLISH SCENARIO:
If BTC breaks and holds above $78,346, the next potential targets are $79,828 and $81,783.
🔴 BEARISH SCENARIO:
If BTC breaks below $76,783, further downside toward $76,091 and $75,023 is possible.
MARKET OUTLOOK:
Bitcoin is showing weak short-term momentum. Watch trading volume, RSI, and candlestick confirmations before entering any trade.
⚠️ Always use stop-loss and proper risk management.
#BTC #Bitcoin #CryptoAnalysis #CryptoTrading #BinanceSquare #BitcoinUpdate
63
·
--
Bullish
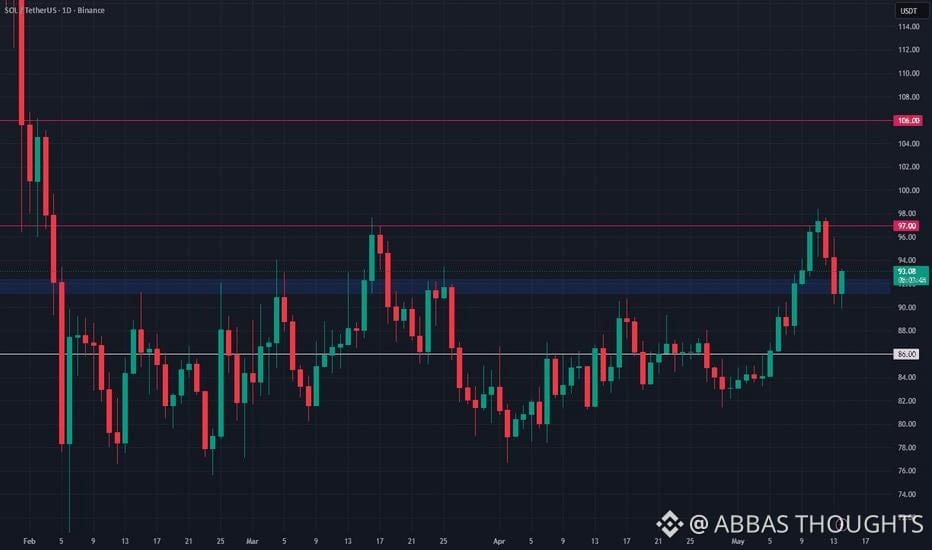
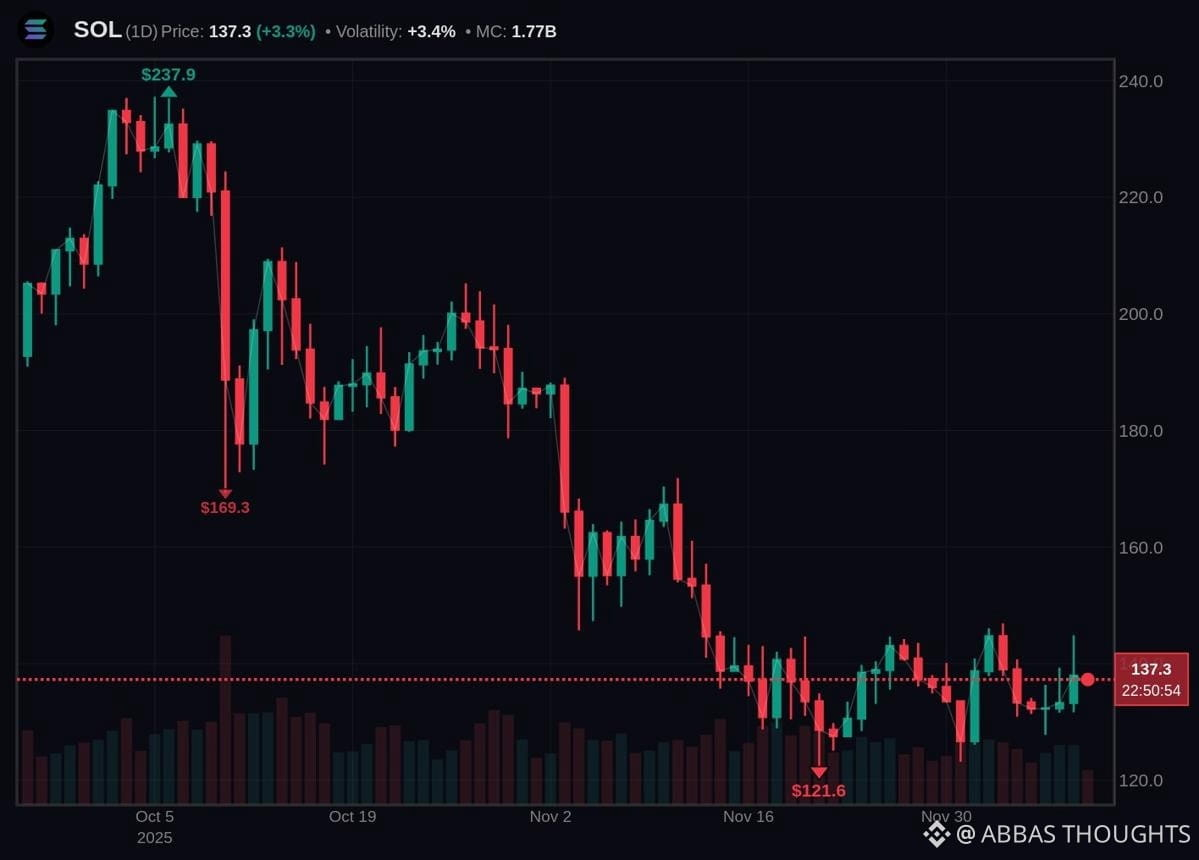
$SOL SOLANA LATEST MARKET ANALYSIS
Current Market Price: Around $93.3
Solana is currently showing bearish short-term momentum, while the overall daily outlook remains neutral.
Technical Analysis:
• RSI (14): 30.4 – Weak momentum, approaching oversold territory.
• MACD: Bearish momentum.
• Short-term trend: Bearish.
• Market volatility: High.
📉 Key Support Levels:
- $90.98
- $88.99
- $87.02
📈 Key Resistance Levels:
- $94.49
- $97.20
- $103.93
🟢 Bullish Scenario:
If SOL breaks above $94.49 and holds that level, a recovery towards $97.20 and $103.93 could become possible.
🔴 Bearish Scenario:
If SOL breaks below $90.98, further downside towards $88.99 and $87.02 could follow.
My Trading Outlook:
Wait for confirmation before entering a trade. Watch volume, RSI and candle closing patterns for the next move.
⚠️ This is technical market analysis, not financial advice. Always manage your risk.
{spot}(SOLUSDT)
#SOL #Solana #CryptoAnalysis #Trading #TechnicalAnalysis #CryptoMarket #Bybit
$SOL SOLANA LATEST MARKET ANALYSIS
Current Market Price: Around $93.3
Solana is currently showing bearish short-term momentum, while the overall daily outlook remains neutral.
Technical Analysis:
• RSI (14): 30.4 – Weak momentum, approaching oversold territory.
• MACD: Bearish momentum.
• Short-term trend: Bearish.
• Market volatility: High.
📉 Key Support Levels:
- $90.98
- $88.99
- $87.02
📈 Key Resistance Levels:
- $94.49
- $97.20
- $103.93
🟢 Bullish Scenario:
If SOL breaks above $94.49 and holds that level, a recovery towards $97.20 and $103.93 could become possible.
🔴 Bearish Scenario:
If SOL breaks below $90.98, further downside towards $88.99 and $87.02 could follow.
My Trading Outlook:
Wait for confirmation before entering a trade. Watch volume, RSI and candle closing patterns for the next move.
⚠️ This is technical market analysis, not financial advice. Always manage your risk.
#SOL #Solana #CryptoAnalysis #Trading #TechnicalAnalysis #CryptoMarket #Bybit
Current Market Price: Around $93.3
Solana is currently showing bearish short-term momentum, while the overall daily outlook remains neutral.
Technical Analysis:
• RSI (14): 30.4 – Weak momentum, approaching oversold territory.
• MACD: Bearish momentum.
• Short-term trend: Bearish.
• Market volatility: High.
📉 Key Support Levels:
- $90.98
- $88.99
- $87.02
📈 Key Resistance Levels:
- $94.49
- $97.20
- $103.93
🟢 Bullish Scenario:
If SOL breaks above $94.49 and holds that level, a recovery towards $97.20 and $103.93 could become possible.
🔴 Bearish Scenario:
If SOL breaks below $90.98, further downside towards $88.99 and $87.02 could follow.
My Trading Outlook:
Wait for confirmation before entering a trade. Watch volume, RSI and candle closing patterns for the next move.
⚠️ This is technical market analysis, not financial advice. Always manage your risk.
#SOL #Solana #CryptoAnalysis #Trading #TechnicalAnalysis #CryptoMarket #Bybit
48
·
--
Bullish
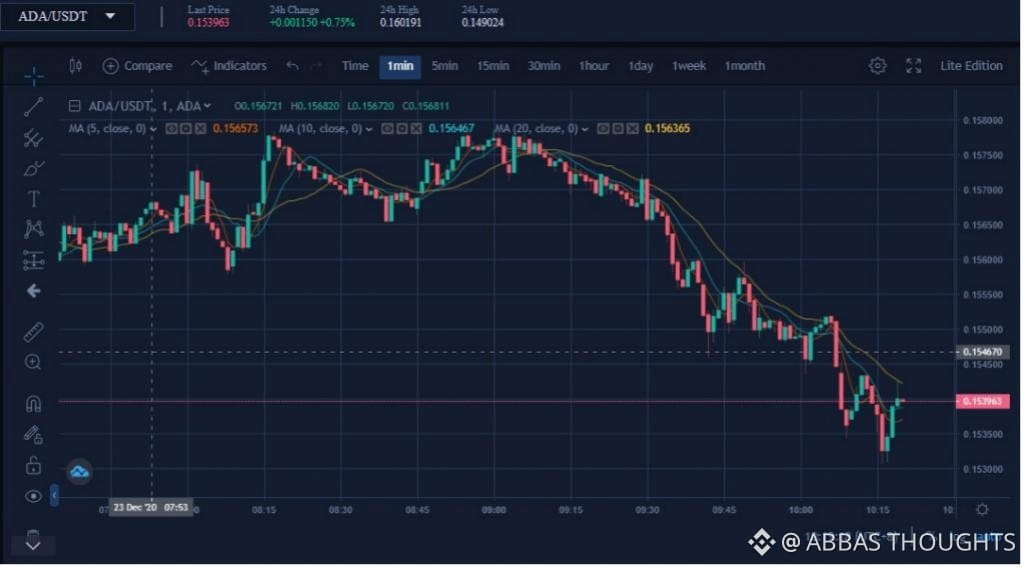
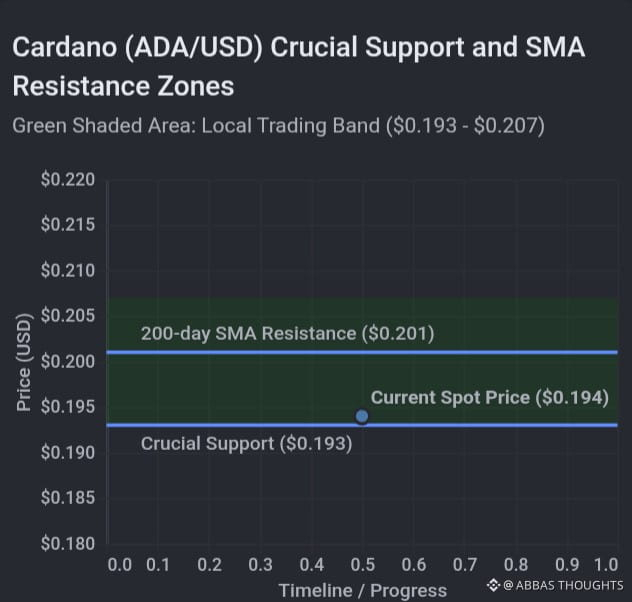
$ADA (Cardano) Latest Market Analysis | November 3, 2026
ADA/USDT Market Overview
Cardano (ADA) is currently showing bearish momentum, with sellers dominating the market. RSI is around 31, indicating weak momentum and a possible oversold condition.
🔹 Key Support Levels:
- Support 1: $0.1843
- Support 2: $0.1811
🔹 Key Resistance Levels:
- Resistance 1: $0.1929
- Resistance 2: $0.2002
📈 Bullish Scenario:
If ADA breaks above $0.1929 with strong buying volume, the next target could be $0.2002.
📉 Bearish Scenario:
If ADA breaks below $0.1843, further downside toward $0.1811 is possible.
My Trading Strategy:
Wait for confirmation before entering any trade. Monitor RSI, trading volume, and candlestick patterns.
Market Opinion:
ADA needs strong buying pressure to confirm a bullish reversal. Stay patient and manage your risk.
{spot}(ADAUSDT)
#ADA #Cardano #CryptoAnalysis #trading #Altcoins #CryptoMarket
$ADA (Cardano) Latest Market Analysis | November 3, 2026
ADA/USDT Market Overview
Cardano (ADA) is currently showing bearish momentum, with sellers dominating the market. RSI is around 31, indicating weak momentum and a possible oversold condition.
🔹 Key Support Levels:
- Support 1: $0.1843
- Support 2: $0.1811
🔹 Key Resistance Levels:
- Resistance 1: $0.1929
- Resistance 2: $0.2002
📈 Bullish Scenario:
If ADA breaks above $0.1929 with strong buying volume, the next target could be $0.2002.
📉 Bearish Scenario:
If ADA breaks below $0.1843, further downside toward $0.1811 is possible.
My Trading Strategy:
Wait for confirmation before entering any trade. Monitor RSI, trading volume, and candlestick patterns.
Market Opinion:
ADA needs strong buying pressure to confirm a bullish reversal. Stay patient and manage your risk.
#ADA #Cardano #CryptoAnalysis #trading #Altcoins #CryptoMarket
ADA/USDT Market Overview
Cardano (ADA) is currently showing bearish momentum, with sellers dominating the market. RSI is around 31, indicating weak momentum and a possible oversold condition.
🔹 Key Support Levels:
- Support 1: $0.1843
- Support 2: $0.1811
🔹 Key Resistance Levels:
- Resistance 1: $0.1929
- Resistance 2: $0.2002
📈 Bullish Scenario:
If ADA breaks above $0.1929 with strong buying volume, the next target could be $0.2002.
📉 Bearish Scenario:
If ADA breaks below $0.1843, further downside toward $0.1811 is possible.
My Trading Strategy:
Wait for confirmation before entering any trade. Monitor RSI, trading volume, and candlestick patterns.
Market Opinion:
ADA needs strong buying pressure to confirm a bullish reversal. Stay patient and manage your risk.
#ADA #Cardano #CryptoAnalysis #trading #Altcoins #CryptoMarket
64
·
--
Bearish
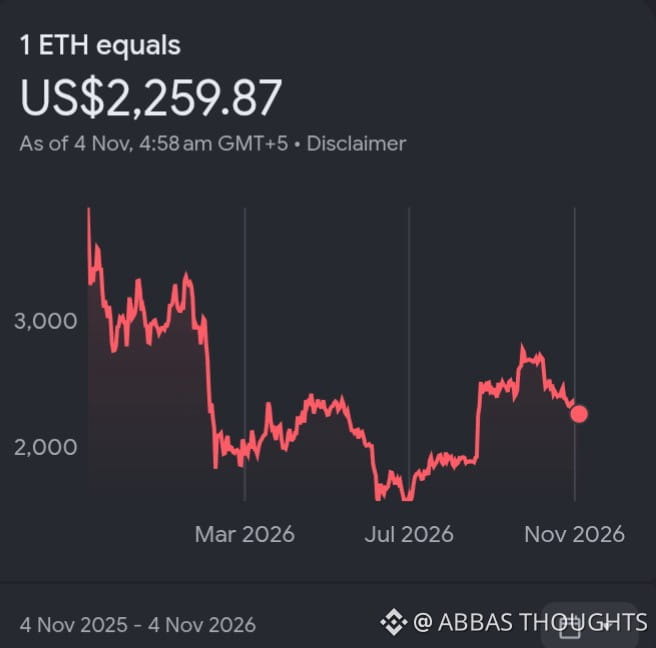
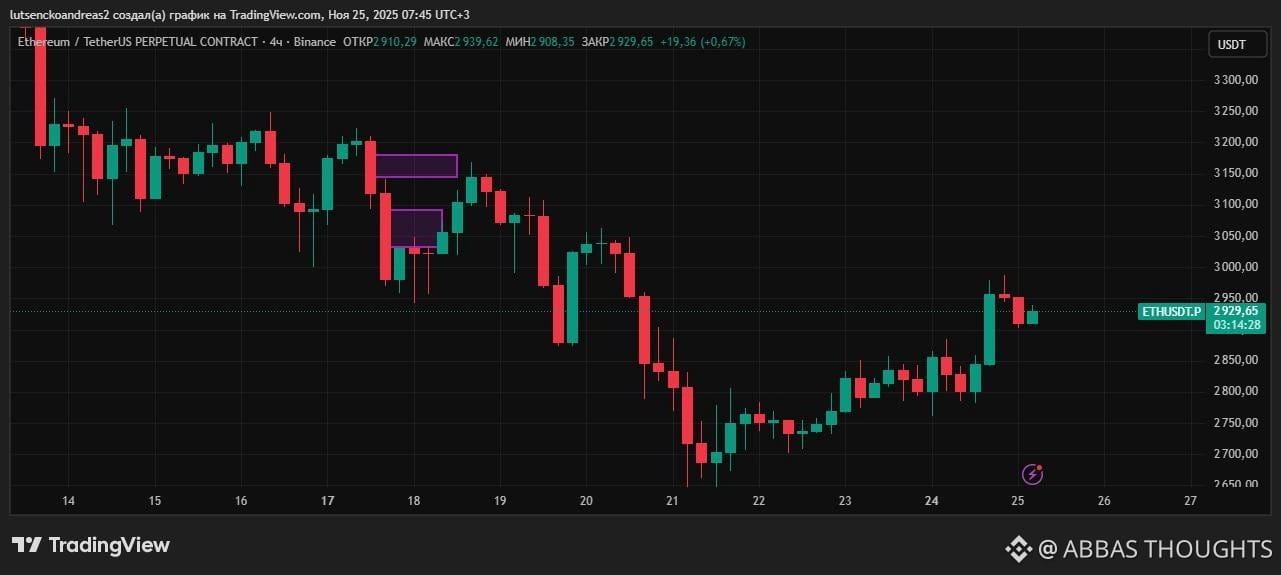
$ETH ETHEREUM LATEST MARKET ANALYSIS
Ethereum is facing selling pressure as the broader crypto market remains weak.
Current Price: Around $2,248–$2,256
🔹 Support Levels:
$2,253
$2,220
$2,173
🔹 Resistance Levels:
$2,294–$2,320
$2,386
$2,424
📈 BULLISH SCENARIO:
A strong breakout above $2,320 could open the door for further recovery.
📉 BEARISH SCENARIO:
A breakdown below $2,220 could bring additional downside pressure.
MY VIEW:
ETH remains under bearish pressure. Watch support and resistance carefully before entering any trade.
⚠️ Trade with proper risk management. This is market analysis, not financial advice.
{spot}(ETHUSDT)
#Ethereum #ETH #CryptoAnalysis #Trading #BinanceSquare
$ETH ETHEREUM LATEST MARKET ANALYSIS
Ethereum is facing selling pressure as the broader crypto market remains weak.
Current Price: Around $2,248–$2,256
🔹 Support Levels:
$2,253
$2,220
$2,173
🔹 Resistance Levels:
$2,294–$2,320
$2,386
$2,424
📈 BULLISH SCENARIO:
A strong breakout above $2,320 could open the door for further recovery.
📉 BEARISH SCENARIO:
A breakdown below $2,220 could bring additional downside pressure.
MY VIEW:
ETH remains under bearish pressure. Watch support and resistance carefully before entering any trade.
⚠️ Trade with proper risk management. This is market analysis, not financial advice.
#Ethereum #ETH #CryptoAnalysis #Trading #BinanceSquare
Ethereum is facing selling pressure as the broader crypto market remains weak.
Current Price: Around $2,248–$2,256
🔹 Support Levels:
$2,253
$2,220
$2,173
🔹 Resistance Levels:
$2,294–$2,320
$2,386
$2,424
📈 BULLISH SCENARIO:
A strong breakout above $2,320 could open the door for further recovery.
📉 BEARISH SCENARIO:
A breakdown below $2,220 could bring additional downside pressure.
MY VIEW:
ETH remains under bearish pressure. Watch support and resistance carefully before entering any trade.
⚠️ Trade with proper risk management. This is market analysis, not financial advice.
#Ethereum #ETH #CryptoAnalysis #Trading #BinanceSquare
68
·
--
Bearish
$BTC BITCOIN LATEST MARKET ANALYSIS | 03 NOVEMBER 2026
BTC/USDT – Market Update
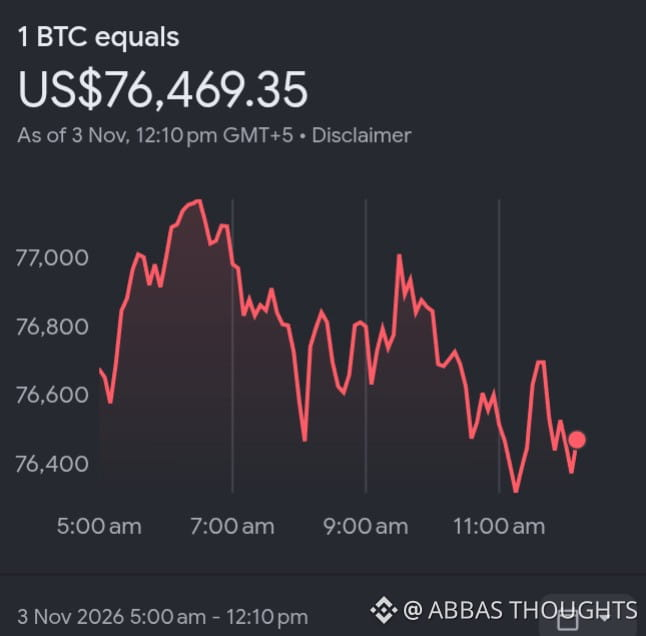
Bitcoin is currently facing selling pressure, with bearish momentum dominating the short-term market structure.
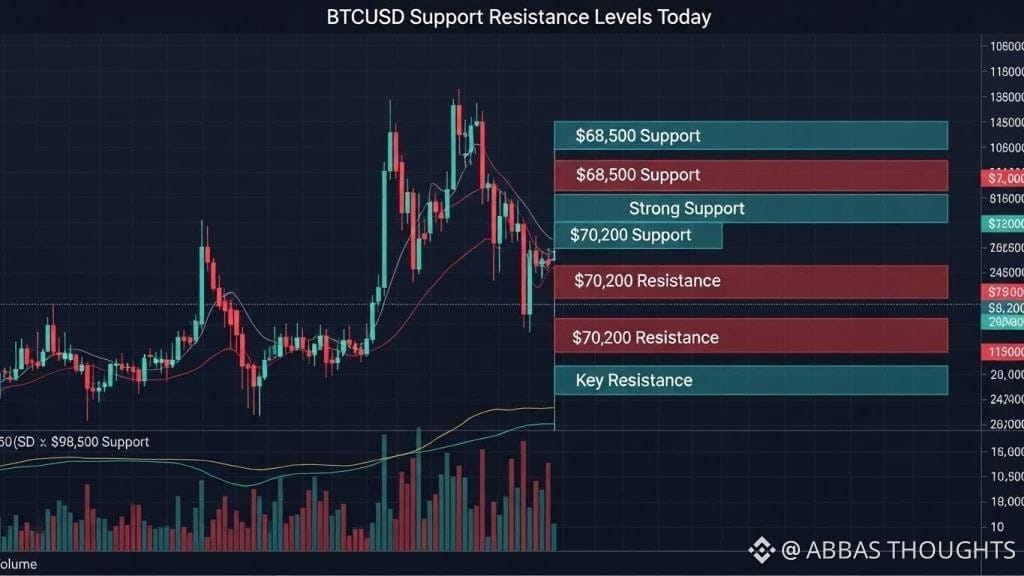
🔴 Key Support Levels:
• $76,000
• $74,600
🟢 Key Resistance Levels:
• $78,000
• $79,500
• $80,000
📉 Bearish Scenario:
If BTC breaks below $76,000 with strong selling volume, the next downside target could be $74,600.
📈 Bullish Scenario:
If buyers defend $76,000 and BTC breaks above $78,000, we could see a recovery towards $79,500–$80,000.
My Trading Outlook:
The market is showing weakness. Traders should watch support and resistance levels carefully before entering any position.
⚠️ Avoid emotional trading. Always use proper risk management and stop-loss protection.
💬 What do you think?
Will Bitcoin recover towards $80K or fall towards $74.6K?
{spot}(BTCUSDT)
#Bitcoin #BTC #CryptoAnalysis #BTCUSDT #CryptoMarket #Trading #BinanceSquare
$BTC BITCOIN LATEST MARKET ANALYSIS | 03 NOVEMBER 2026
BTC/USDT – Market Update
Bitcoin is currently facing selling pressure, with bearish momentum dominating the short-term market structure.
🔴 Key Support Levels:
• $76,000
• $74,600
🟢 Key Resistance Levels:
• $78,000
• $79,500
• $80,000
📉 Bearish Scenario:
If BTC breaks below $76,000 with strong selling volume, the next downside target could be $74,600.
📈 Bullish Scenario:
If buyers defend $76,000 and BTC breaks above $78,000, we could see a recovery towards $79,500–$80,000.
My Trading Outlook:
The market is showing weakness. Traders should watch support and resistance levels carefully before entering any position.
⚠️ Avoid emotional trading. Always use proper risk management and stop-loss protection.
💬 What do you think?
Will Bitcoin recover towards $80K or fall towards $74.6K?
#Bitcoin #BTC #CryptoAnalysis #BTCUSDT #CryptoMarket #Trading #BinanceSquare
BTC/USDT – Market Update
Bitcoin is currently facing selling pressure, with bearish momentum dominating the short-term market structure.
🔴 Key Support Levels:
• $76,000
• $74,600
🟢 Key Resistance Levels:
• $78,000
• $79,500
• $80,000
📉 Bearish Scenario:
If BTC breaks below $76,000 with strong selling volume, the next downside target could be $74,600.
📈 Bullish Scenario:
If buyers defend $76,000 and BTC breaks above $78,000, we could see a recovery towards $79,500–$80,000.
My Trading Outlook:
The market is showing weakness. Traders should watch support and resistance levels carefully before entering any position.
⚠️ Avoid emotional trading. Always use proper risk management and stop-loss protection.
💬 What do you think?
Will Bitcoin recover towards $80K or fall towards $74.6K?
#Bitcoin #BTC #CryptoAnalysis #BTCUSDT #CryptoMarket #Trading #BinanceSquare
94
🌍 OVERALL CRYPTO MARKET UPDATE – NOVEMBER 3, 2026
Crypto Market Shows Slight Recovery – Is a Bullish Move Coming?
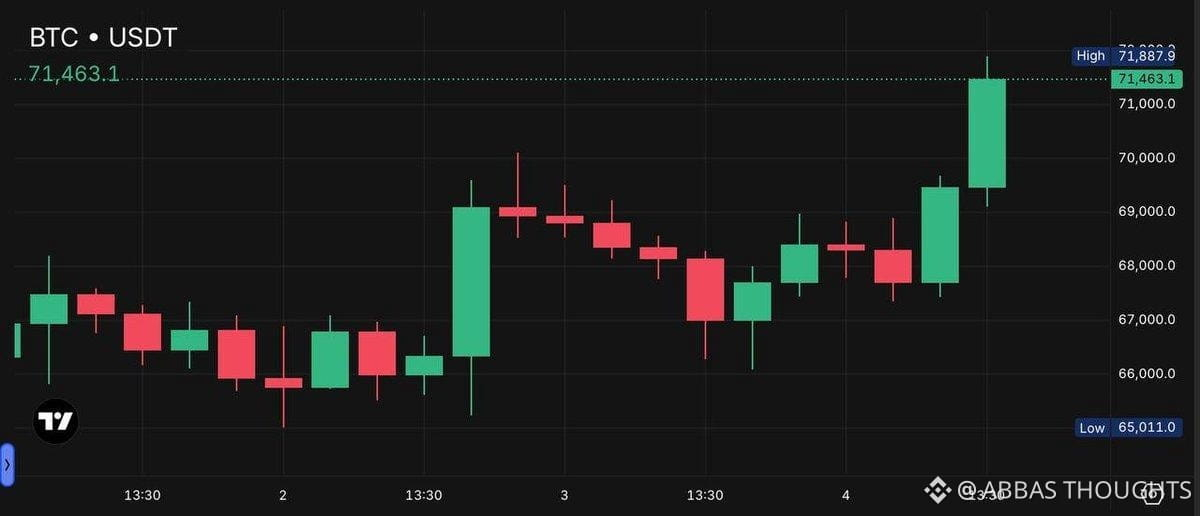
The global cryptocurrency market is showing signs of a modest recovery, but traders remain cautious.
🔹 TOTAL CRYPTO MARKET CAP: $2.61 Trillion
🔹 BITCOIN (BTC): $78,030
🔹 ETHEREUM (ETH): $2,269
🔹 BNB: $710
🔹 XRP: $1.24
🔹 SOLANA (SOL): $94.08
📈 MARKET ANALYSIS
Bitcoin is holding around the $78K zone and remains the key market leader.
Ethereum is showing modest positive movement, while selected altcoins are also attempting to recover.
Bitcoin Dominance is around 60%, indicating that capital remains concentrated in BTC rather than spreading broadly across altcoins.
😨 MARKET SENTIMENT
Fear & Greed Index: 36 (Fear)
This indicates that investors are still cautious despite the slight market recovery.
KEY LEVELS TO WATCH
BTC:
Resistance: $79,000 – $80,000
Support: $77,000 – $76,000
ETH:
Resistance: $2,300 – $2,350
Support: $2,220 – $2,180
WHAT'S NEXT?
A strong breakout above resistance could improve bullish momentum.
However, losing important support levels may trigger another correction.
⚠️ MY STRATEGY
Avoid emotional trading.
Watch BTC closely.
Wait for confirmation before entering any trade.
Always manage your risk.
💬 What do you think?
Are we preparing for another bullish move, or will the market experience another correction?
Share your thoughts below! 👇
#Crypto #Bitcoin #Ethereum #BinanceSquare #CryptoMarket #BTC #Altcoins #MarketAnalysis
🌍 OVERALL CRYPTO MARKET UPDATE – NOVEMBER 3, 2026
Crypto Market Shows Slight Recovery – Is a Bullish Move Coming?
The global cryptocurrency market is showing signs of a modest recovery, but traders remain cautious.
🔹 TOTAL CRYPTO MARKET CAP: $2.61 Trillion
🔹 BITCOIN (BTC): $78,030
🔹 ETHEREUM (ETH): $2,269
🔹 BNB: $710
🔹 XRP: $1.24
🔹 SOLANA (SOL): $94.08
📈 MARKET ANALYSIS
Bitcoin is holding around the $78K zone and remains the key market leader.
Ethereum is showing modest positive movement, while selected altcoins are also attempting to recover.
Bitcoin Dominance is around 60%, indicating that capital remains concentrated in BTC rather than spreading broadly across altcoins.
😨 MARKET SENTIMENT
Fear & Greed Index: 36 (Fear)
This indicates that investors are still cautious despite the slight market recovery.
KEY LEVELS TO WATCH
BTC:
Resistance: $79,000 – $80,000
Support: $77,000 – $76,000
ETH:
Resistance: $2,300 – $2,350
Support: $2,220 – $2,180
WHAT'S NEXT?
A strong breakout above resistance could improve bullish momentum.
However, losing important support levels may trigger another correction.
⚠️ MY STRATEGY
Avoid emotional trading.
Watch BTC closely.
Wait for confirmation before entering any trade.
Always manage your risk.
💬 What do you think?
Are we preparing for another bullish move, or will the market experience another correction?
Share your thoughts below! 👇
#Crypto #Bitcoin #Ethereum #BinanceSquare #CryptoMarket #BTC #Altcoins #MarketAnalysis
Crypto Market Shows Slight Recovery – Is a Bullish Move Coming?
The global cryptocurrency market is showing signs of a modest recovery, but traders remain cautious.
🔹 TOTAL CRYPTO MARKET CAP: $2.61 Trillion
🔹 BITCOIN (BTC): $78,030
🔹 ETHEREUM (ETH): $2,269
🔹 BNB: $710
🔹 XRP: $1.24
🔹 SOLANA (SOL): $94.08
📈 MARKET ANALYSIS
Bitcoin is holding around the $78K zone and remains the key market leader.
Ethereum is showing modest positive movement, while selected altcoins are also attempting to recover.
Bitcoin Dominance is around 60%, indicating that capital remains concentrated in BTC rather than spreading broadly across altcoins.
😨 MARKET SENTIMENT
Fear & Greed Index: 36 (Fear)
This indicates that investors are still cautious despite the slight market recovery.
KEY LEVELS TO WATCH
BTC:
Resistance: $79,000 – $80,000
Support: $77,000 – $76,000
ETH:
Resistance: $2,300 – $2,350
Support: $2,220 – $2,180
WHAT'S NEXT?
A strong breakout above resistance could improve bullish momentum.
However, losing important support levels may trigger another correction.
⚠️ MY STRATEGY
Avoid emotional trading.
Watch BTC closely.
Wait for confirmation before entering any trade.
Always manage your risk.
💬 What do you think?
Are we preparing for another bullish move, or will the market experience another correction?
Share your thoughts below! 👇
#Crypto #Bitcoin #Ethereum #BinanceSquare #CryptoMarket #BTC #Altcoins #MarketAnalysis
32
Log in to explore more content
Join global crypto users on Binance Square
⚡️ Get latest and useful information about crypto.
💬 Trusted by the world’s largest crypto exchange.
👍 Discover real insights from verified creators.
Email / Phone number
Trending Topics
BinanceReopensWithdrawalsForMoreAssets
887,096 views
4,681 Discussing
Security Incident | Recovery Update #8: Withdrawals for More Assets to Reopen (2026-11-05)
Binance Announcement
·411 Likes
·1.8M views
Binance98PercentReplenished
209,818 views
1,922 Discussing
USStocksSlipandCryptoMarketUnderBroadPressure
19,836 views
267 Discussing