
Crypto AnalyZen
1.2k Posts

Crypto AnalyZen
Report
Block User
Gold & Silver Futures Trader | BTC & Top 20
Scenario-based crypto market analysis.
Focus on structure, liquidity and risk.
64 Following
719 Followers
1.3K+ Liked
Posts
All
Quotes
PINNED
Article
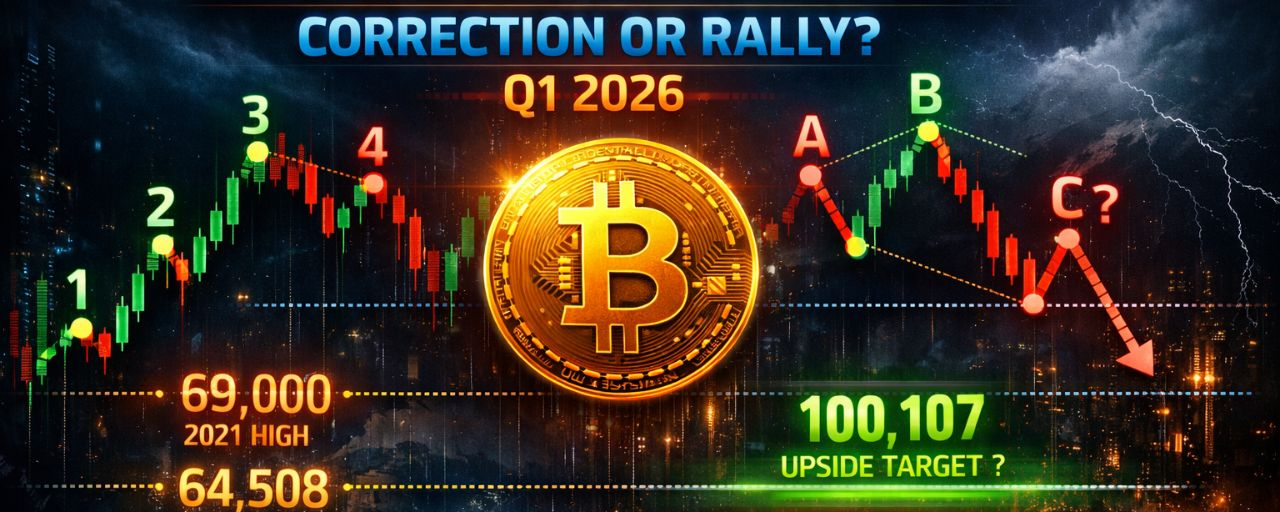
Bitcoin at a Crossroads: Correction to $32K or Rally to $100K?$BTC With Q1 2026 now closed, it is essential to reassess Bitcoin’s structure on higher time frames.
From a macro perspective, the annual chart aligns well with Elliott Wave Theory, showing:
Three completed impulse waves (1–3–5)Two corrective waves (2–4)This suggests that the market may have entered a macro corrective phase (A–B–C), with price currently developing Wave A (downward leg).
Current Market Structure
On the annual chart:
The price has successfully filled the gap between the 2021 high (69,000) and the 2025 low (74,508)The gap midpoint is located at 71,789
The February decline:
Broke below the 50% macro range (64,508.32)
However, it failed to reach 57,672.35, which represents:
50% of the upper wick of the 2021 candle~62% Fibonacci retracement of the recent impulse move
Key Downside Levels
If the correction continues, the following levels are critical:
69,000 → 2021 high / lower boundary of the annual gap64,508.32 → 50% of macro range (ATL–ATH)49,949.16 → 62% retracement of macro range48,189.84 → 2022 high46,216.93 → 2022 open
Monthly Projection
The monthly chart provides a clearer Elliott Wave structure.
Projecting the first downward leg:
Target aligns with a lower time frame gap midpoint at ~51,968
Capitulation Zone (High-Probability Demand Area)
The most critical area for a potential bottom:
37,579 – 32,428
This zone represents:
Likely Wave A completionStrong institutional demand (“smart money” interest)A base for projecting Wave B (upward retracement)
Alternative Scenario (Bullish Case)
Given that the decline paused within the 2024 accumulation zone, we cannot exclude the possibility that:
Wave A has already completedWave B (upward movement) is beginning
Upside Target
Projecting the decline range upward from the capitulation zone:
Target: 100,107
This level represents:
The midpoint of an unfilled upper gap between:
October 2025 low: 102,000January 2026 high: 97,924
{spot}(BTCUSDT)
{future}(BTCUSDT)
Bitcoin at a Crossroads: Correction to $32K or Rally to $100K?
$BTC With Q1 2026 now closed, it is essential to reassess Bitcoin’s structure on higher time frames.
From a macro perspective, the annual chart aligns well with Elliott Wave Theory, showing:
Three completed impulse waves (1–3–5)Two corrective waves (2–4)This suggests that the market may have entered a macro corrective phase (A–B–C), with price currently developing Wave A (downward leg).
Current Market Structure
On the annual chart:
The price has successfully filled the gap between the 2021 high (69,000) and the 2025 low (74,508)The gap midpoint is located at 71,789
The February decline:
Broke below the 50% macro range (64,508.32)
However, it failed to reach 57,672.35, which represents:
50% of the upper wick of the 2021 candle~62% Fibonacci retracement of the recent impulse move
Key Downside Levels
If the correction continues, the following levels are critical:
69,000 → 2021 high / lower boundary of the annual gap64,508.32 → 50% of macro range (ATL–ATH)49,949.16 → 62% retracement of macro range48,189.84 → 2022 high46,216.93 → 2022 open
Monthly Projection
The monthly chart provides a clearer Elliott Wave structure.
Projecting the first downward leg:
Target aligns with a lower time frame gap midpoint at ~51,968
Capitulation Zone (High-Probability Demand Area)
The most critical area for a potential bottom:
37,579 – 32,428
This zone represents:
Likely Wave A completionStrong institutional demand (“smart money” interest)A base for projecting Wave B (upward retracement)
Alternative Scenario (Bullish Case)
Given that the decline paused within the 2024 accumulation zone, we cannot exclude the possibility that:
Wave A has already completedWave B (upward movement) is beginning
Upside Target
Projecting the decline range upward from the capitulation zone:
Target: 100,107
This level represents:
The midpoint of an unfilled upper gap between:
October 2025 low: 102,000January 2026 high: 97,924
From a macro perspective, the annual chart aligns well with Elliott Wave Theory, showing:
Three completed impulse waves (1–3–5)Two corrective waves (2–4)This suggests that the market may have entered a macro corrective phase (A–B–C), with price currently developing Wave A (downward leg).
Current Market Structure
On the annual chart:
The price has successfully filled the gap between the 2021 high (69,000) and the 2025 low (74,508)The gap midpoint is located at 71,789
The February decline:
Broke below the 50% macro range (64,508.32)
However, it failed to reach 57,672.35, which represents:
50% of the upper wick of the 2021 candle~62% Fibonacci retracement of the recent impulse move
Key Downside Levels
If the correction continues, the following levels are critical:
69,000 → 2021 high / lower boundary of the annual gap64,508.32 → 50% of macro range (ATL–ATH)49,949.16 → 62% retracement of macro range48,189.84 → 2022 high46,216.93 → 2022 open
Monthly Projection
The monthly chart provides a clearer Elliott Wave structure.
Projecting the first downward leg:
Target aligns with a lower time frame gap midpoint at ~51,968
Capitulation Zone (High-Probability Demand Area)
The most critical area for a potential bottom:
37,579 – 32,428
This zone represents:
Likely Wave A completionStrong institutional demand (“smart money” interest)A base for projecting Wave B (upward retracement)
Alternative Scenario (Bullish Case)
Given that the decline paused within the 2024 accumulation zone, we cannot exclude the possibility that:
Wave A has already completedWave B (upward movement) is beginning
Upside Target
Projecting the decline range upward from the capitulation zone:
Target: 100,107
This level represents:
The midpoint of an unfilled upper gap between:
October 2025 low: 102,000January 2026 high: 97,924
1
3
78
·
--
Bearish
$XRP - the algorithm keeps showing this post ,👇, and I'm getting scared... judging by the popularity of this post, a lot of people are expecting a rise...
the price is falling without any significant rebounds...
big money doesn't have any significant long positions...
draw your conclusions
#XRPPredictions
{future}(XRPUSDT)
$XRP - the algorithm keeps showing this post ,👇, and I'm getting scared... judging by the popularity of this post, a lot of people are expecting a rise...
the price is falling without any significant rebounds...
big money doesn't have any significant long positions...
draw your conclusions
#XRPPredictions
the price is falling without any significant rebounds...
big money doesn't have any significant long positions...
draw your conclusions
#XRPPredictions
Crypto AnalyZen
·
--
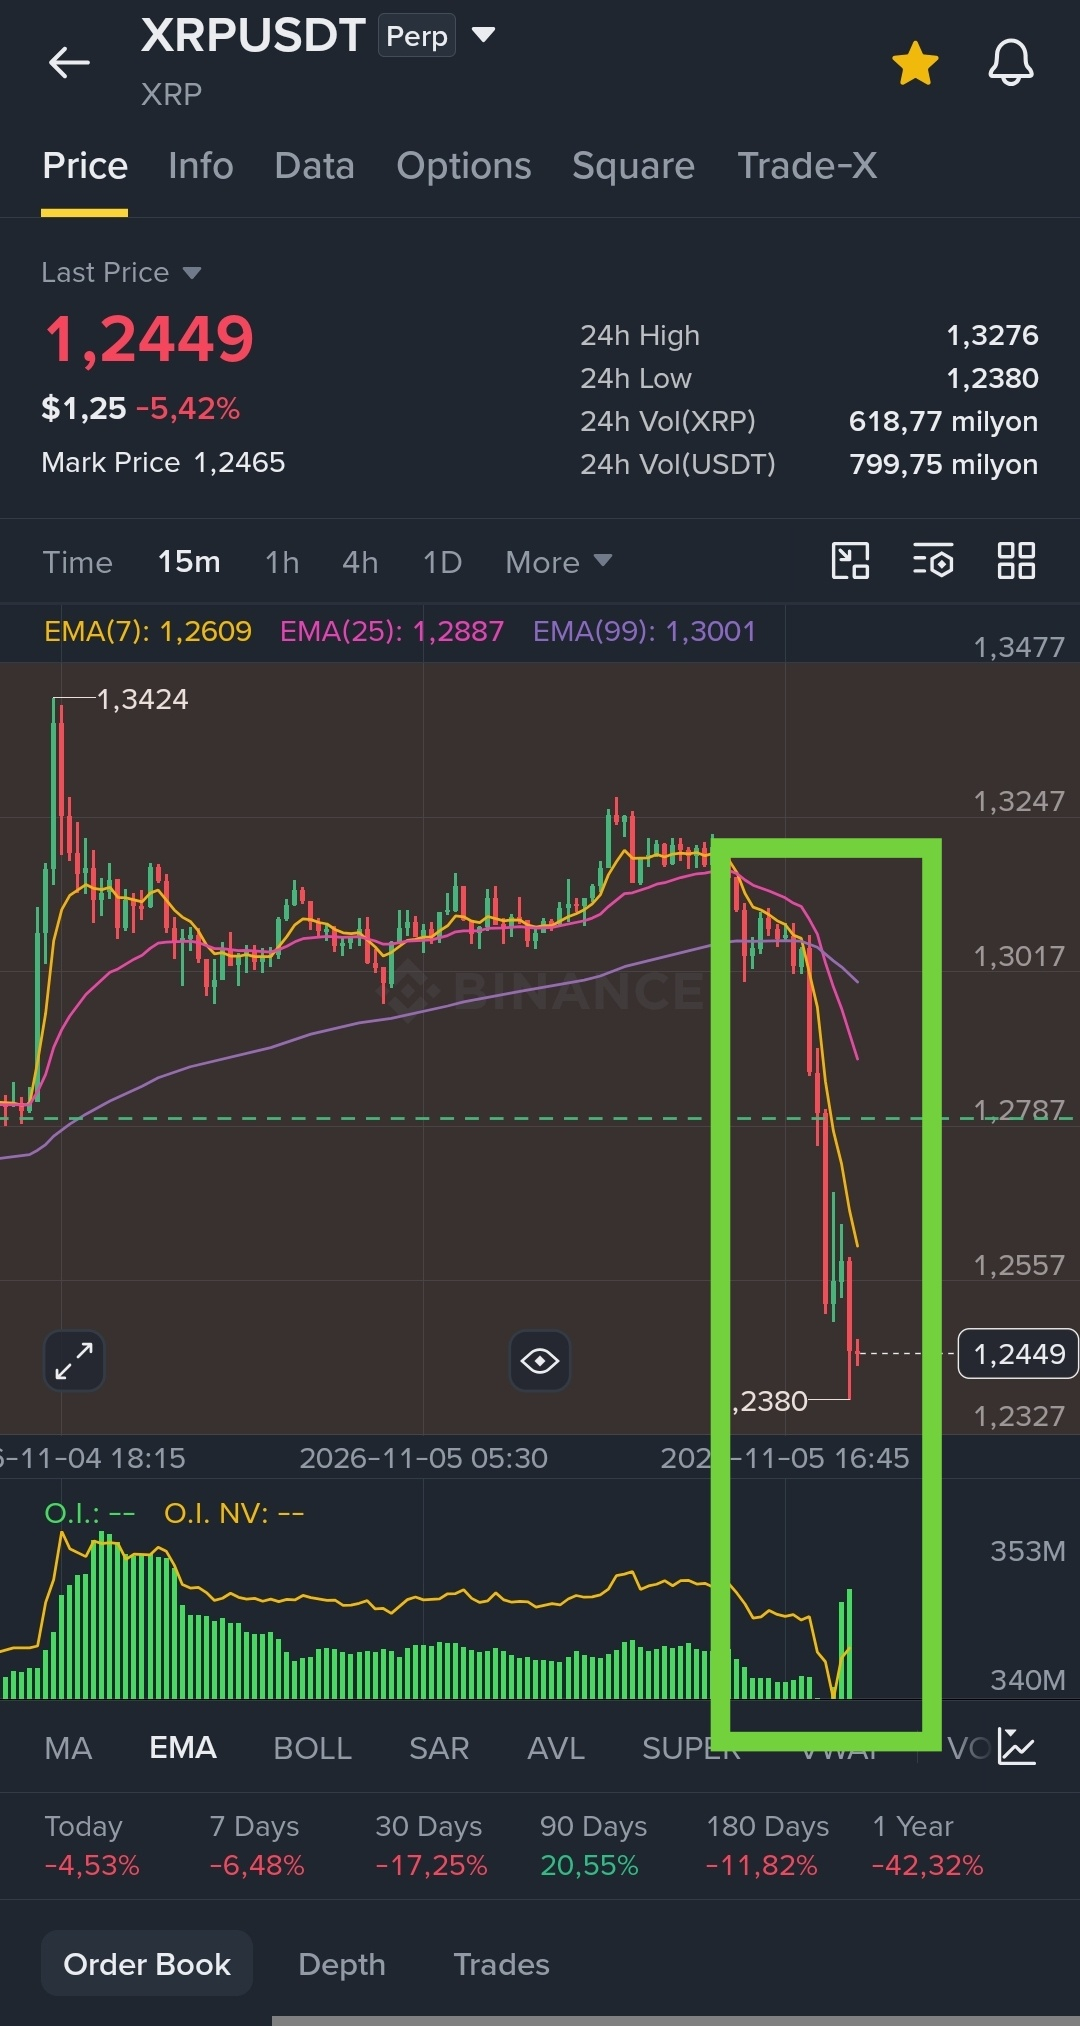
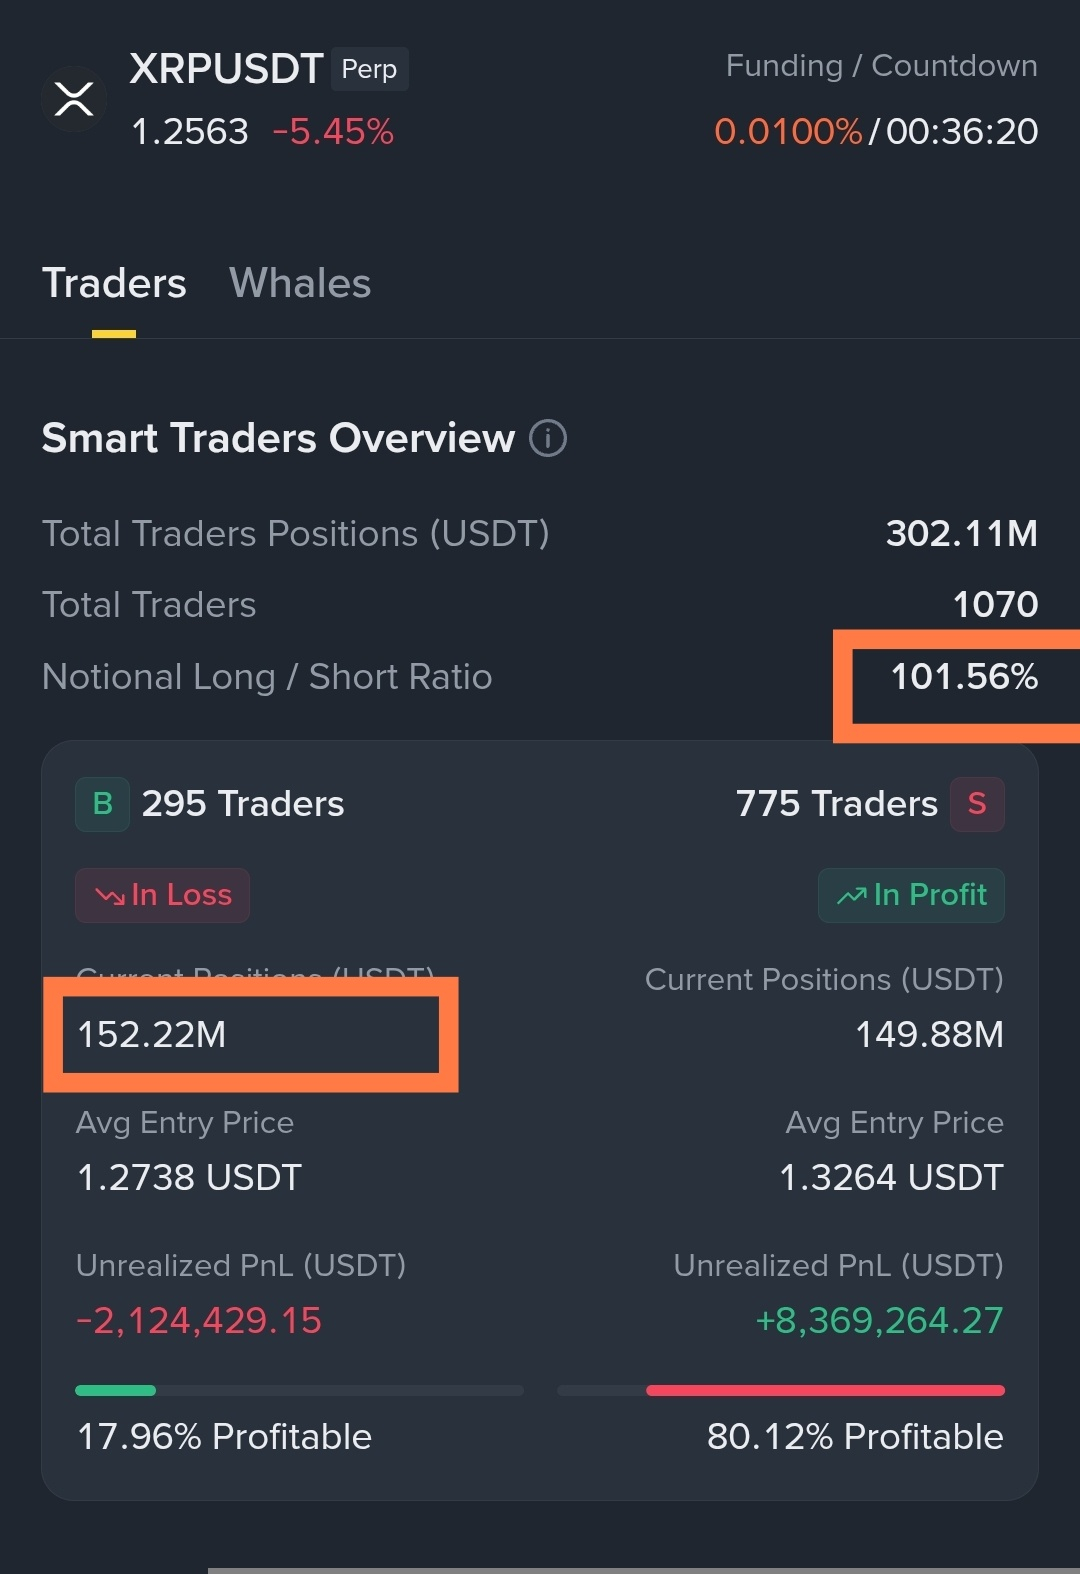
Bearish$XRP - new update analysis see in my profile ....XRP attention !!! - Friday Nov.06
Something's happening;)
Long positions on Smart Money are increasing!
Open interest is increasing as the price falls - there's a high probability that this is a stop-loss hunt on long positions - we can expect an upward rebound at least to 1.2749
#XRPPredictions
Something's happening;)
Long positions on Smart Money are increasing!
Open interest is increasing as the price falls - there's a high probability that this is a stop-loss hunt on long positions - we can expect an upward rebound at least to 1.2749
#XRPPredictions
257
·
--
Bearish
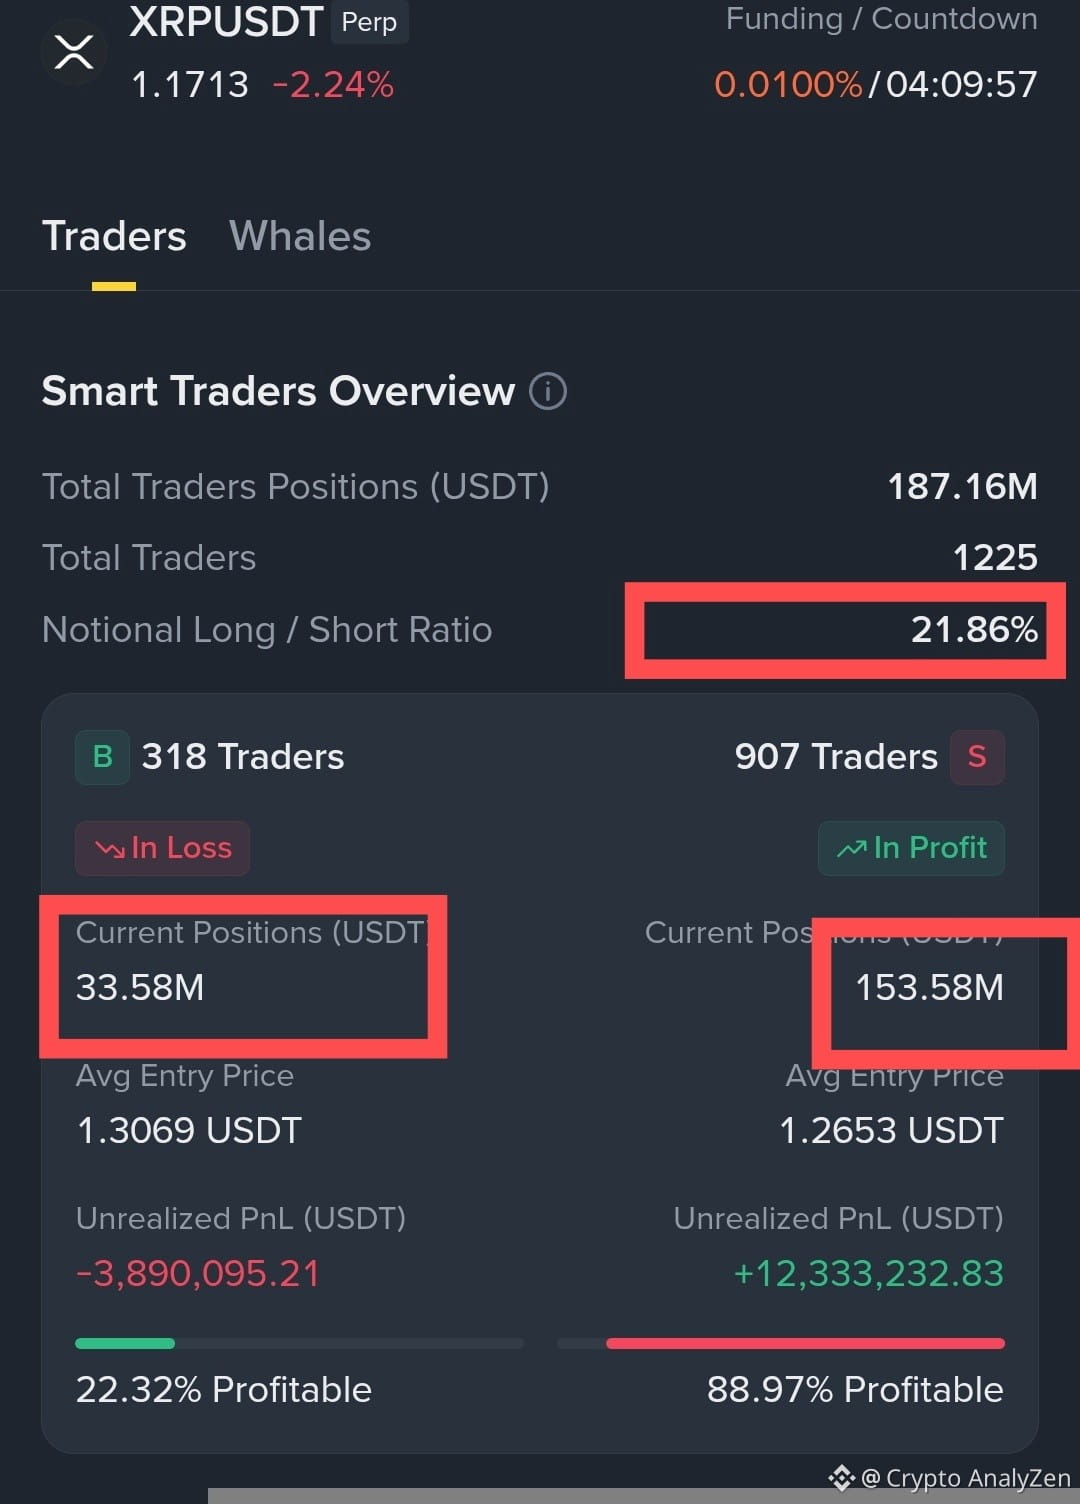
$XRP - TOO EARLY to open longs!
There are no signs on the spot to accumulate positions.
Smart Money - shorts are 5 times larger than longs.
What does this mean?
It's likely that massive shorts are quietly and gradually closing in parts, along with new shorts being opened, which is pulling the price down, sweeping away early-opened longs.
What's the target level?
A sharp closing of such a large number of shorts could trigger an even deeper decline to 1.049.
#XRPRealityCheck #XRPPredictions
{future}(XRPUSDT)
$XRP - TOO EARLY to open longs!
There are no signs on the spot to accumulate positions.
Smart Money - shorts are 5 times larger than longs.
What does this mean?
It's likely that massive shorts are quietly and gradually closing in parts, along with new shorts being opened, which is pulling the price down, sweeping away early-opened longs.
What's the target level?
A sharp closing of such a large number of shorts could trigger an even deeper decline to 1.049.
#XRPRealityCheck #XRPPredictions
There are no signs on the spot to accumulate positions.
Smart Money - shorts are 5 times larger than longs.
What does this mean?
It's likely that massive shorts are quietly and gradually closing in parts, along with new shorts being opened, which is pulling the price down, sweeping away early-opened longs.
What's the target level?
A sharp closing of such a large number of shorts could trigger an even deeper decline to 1.049.
#XRPRealityCheck #XRPPredictions
5
3.5k
·
--
Bearish
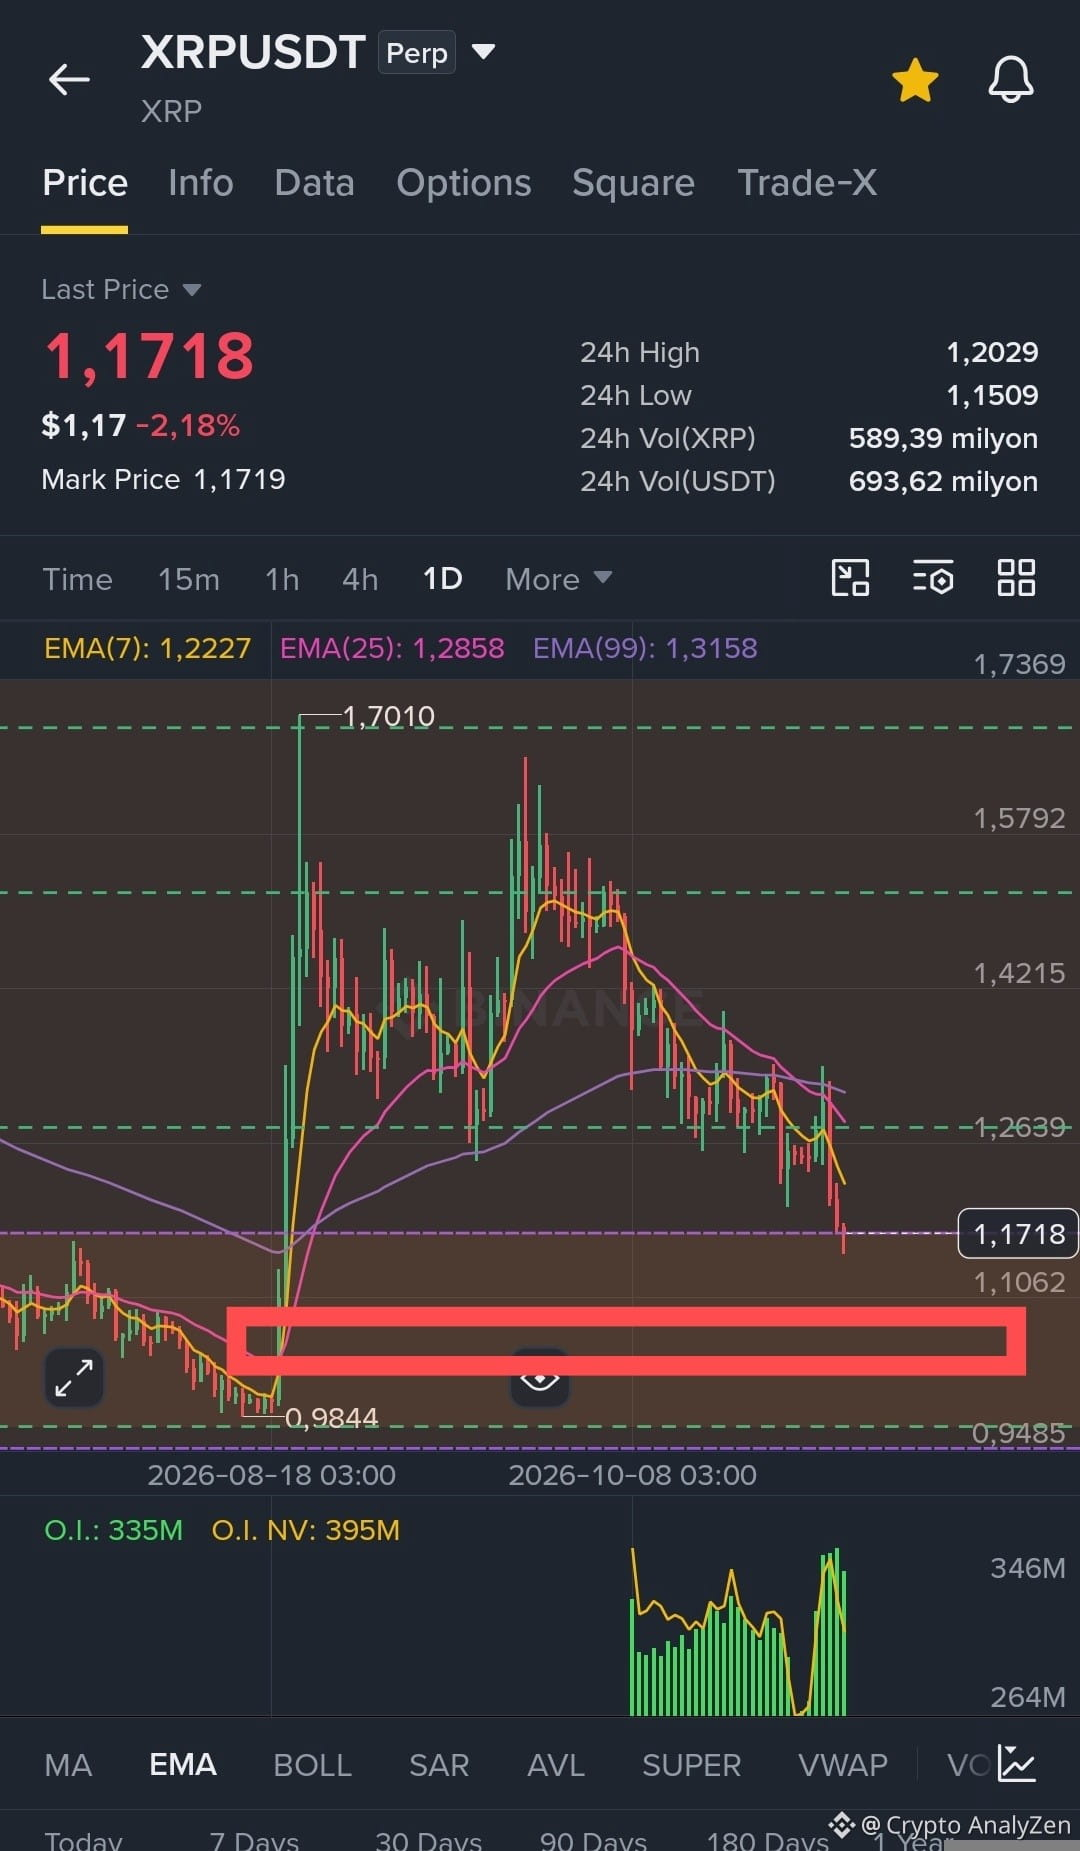
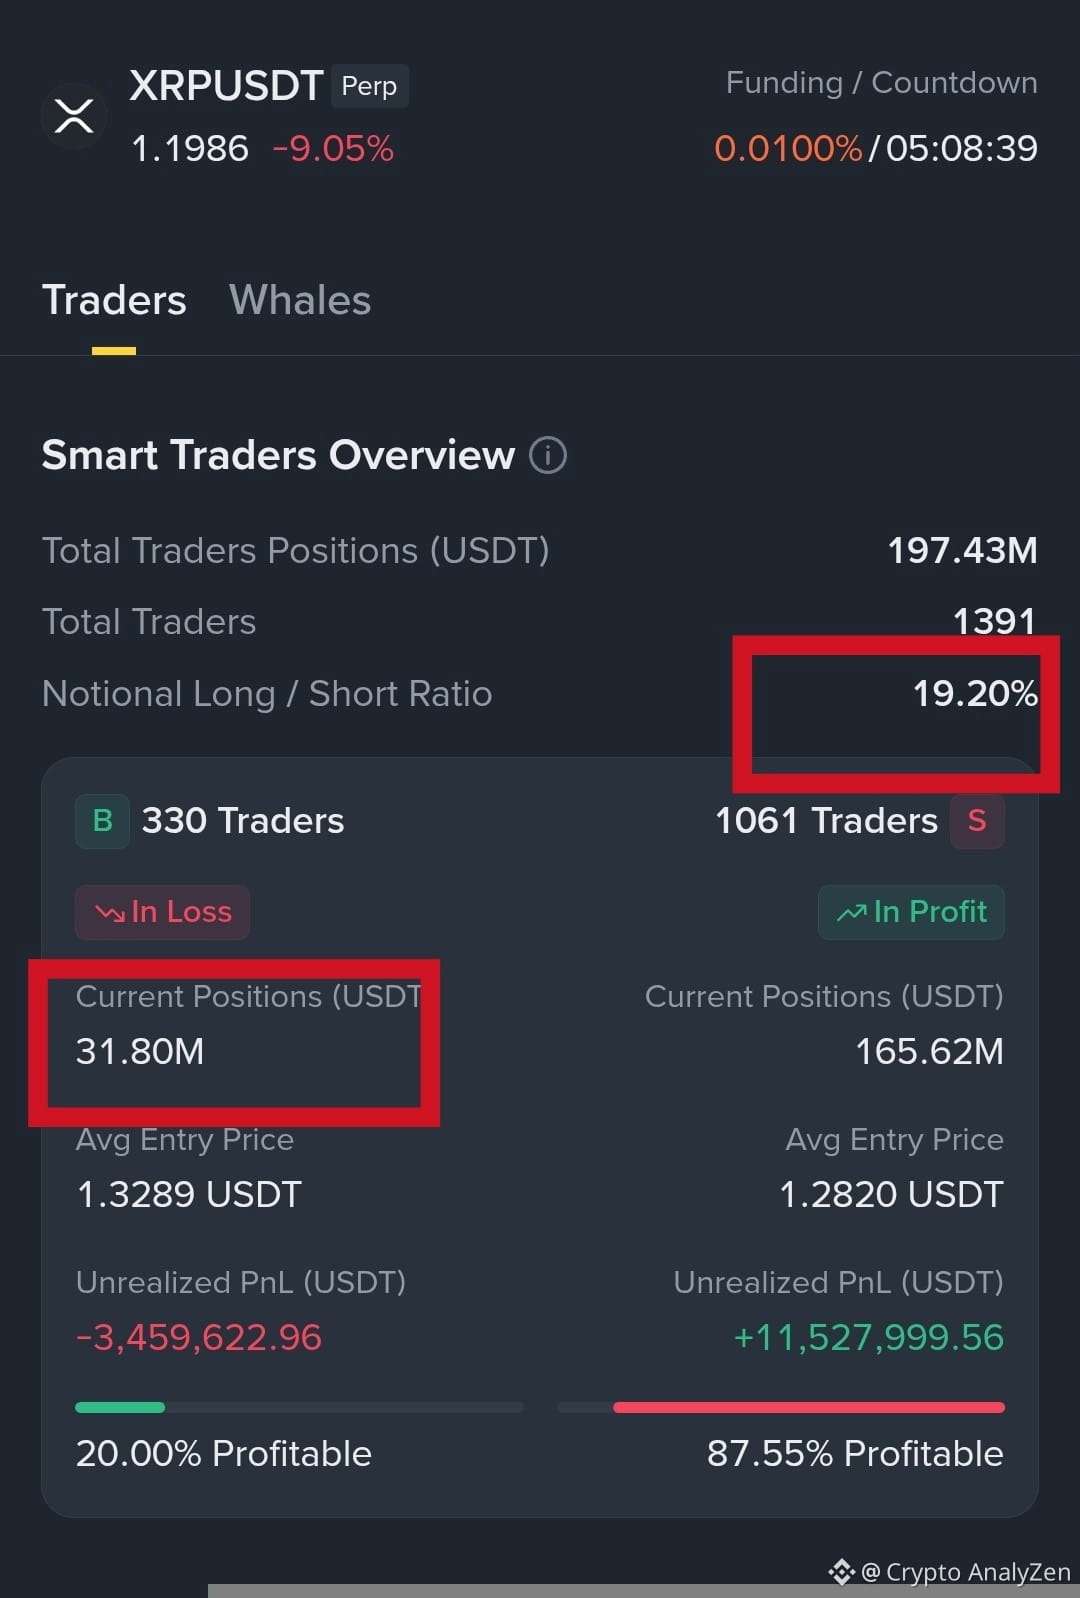
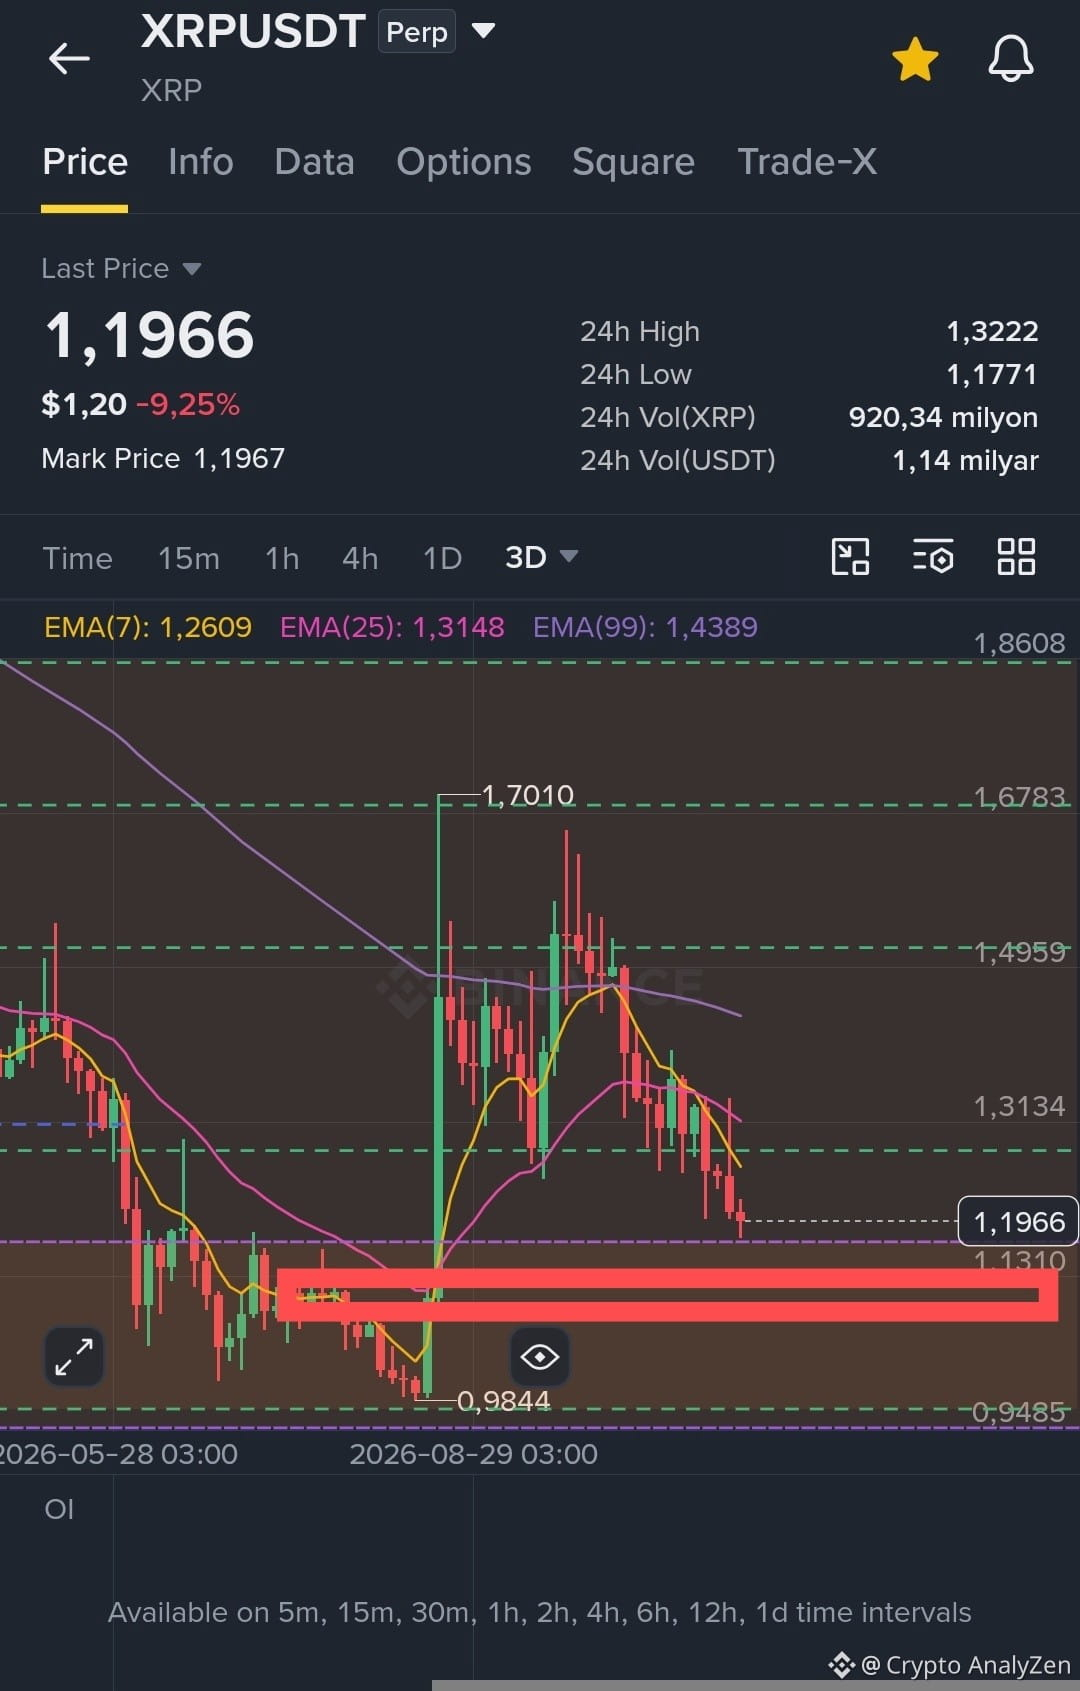
$XRP
attention!!!
sharp decrease in the volume of longs on Smart Money!!!
dominance of shorts can only mean one thing - a sharp and brutal squeeze down is being prepared
next zone 1.14-1.12
#XRPPredictions
{future}(XRPUSDT)
$XRP
attention!!!
sharp decrease in the volume of longs on Smart Money!!!
dominance of shorts can only mean one thing - a sharp and brutal squeeze down is being prepared
next zone 1.14-1.12
#XRPPredictions
attention!!!
sharp decrease in the volume of longs on Smart Money!!!
dominance of shorts can only mean one thing - a sharp and brutal squeeze down is being prepared
next zone 1.14-1.12
#XRPPredictions
8
2
34
70.3k
·
--
Bearish
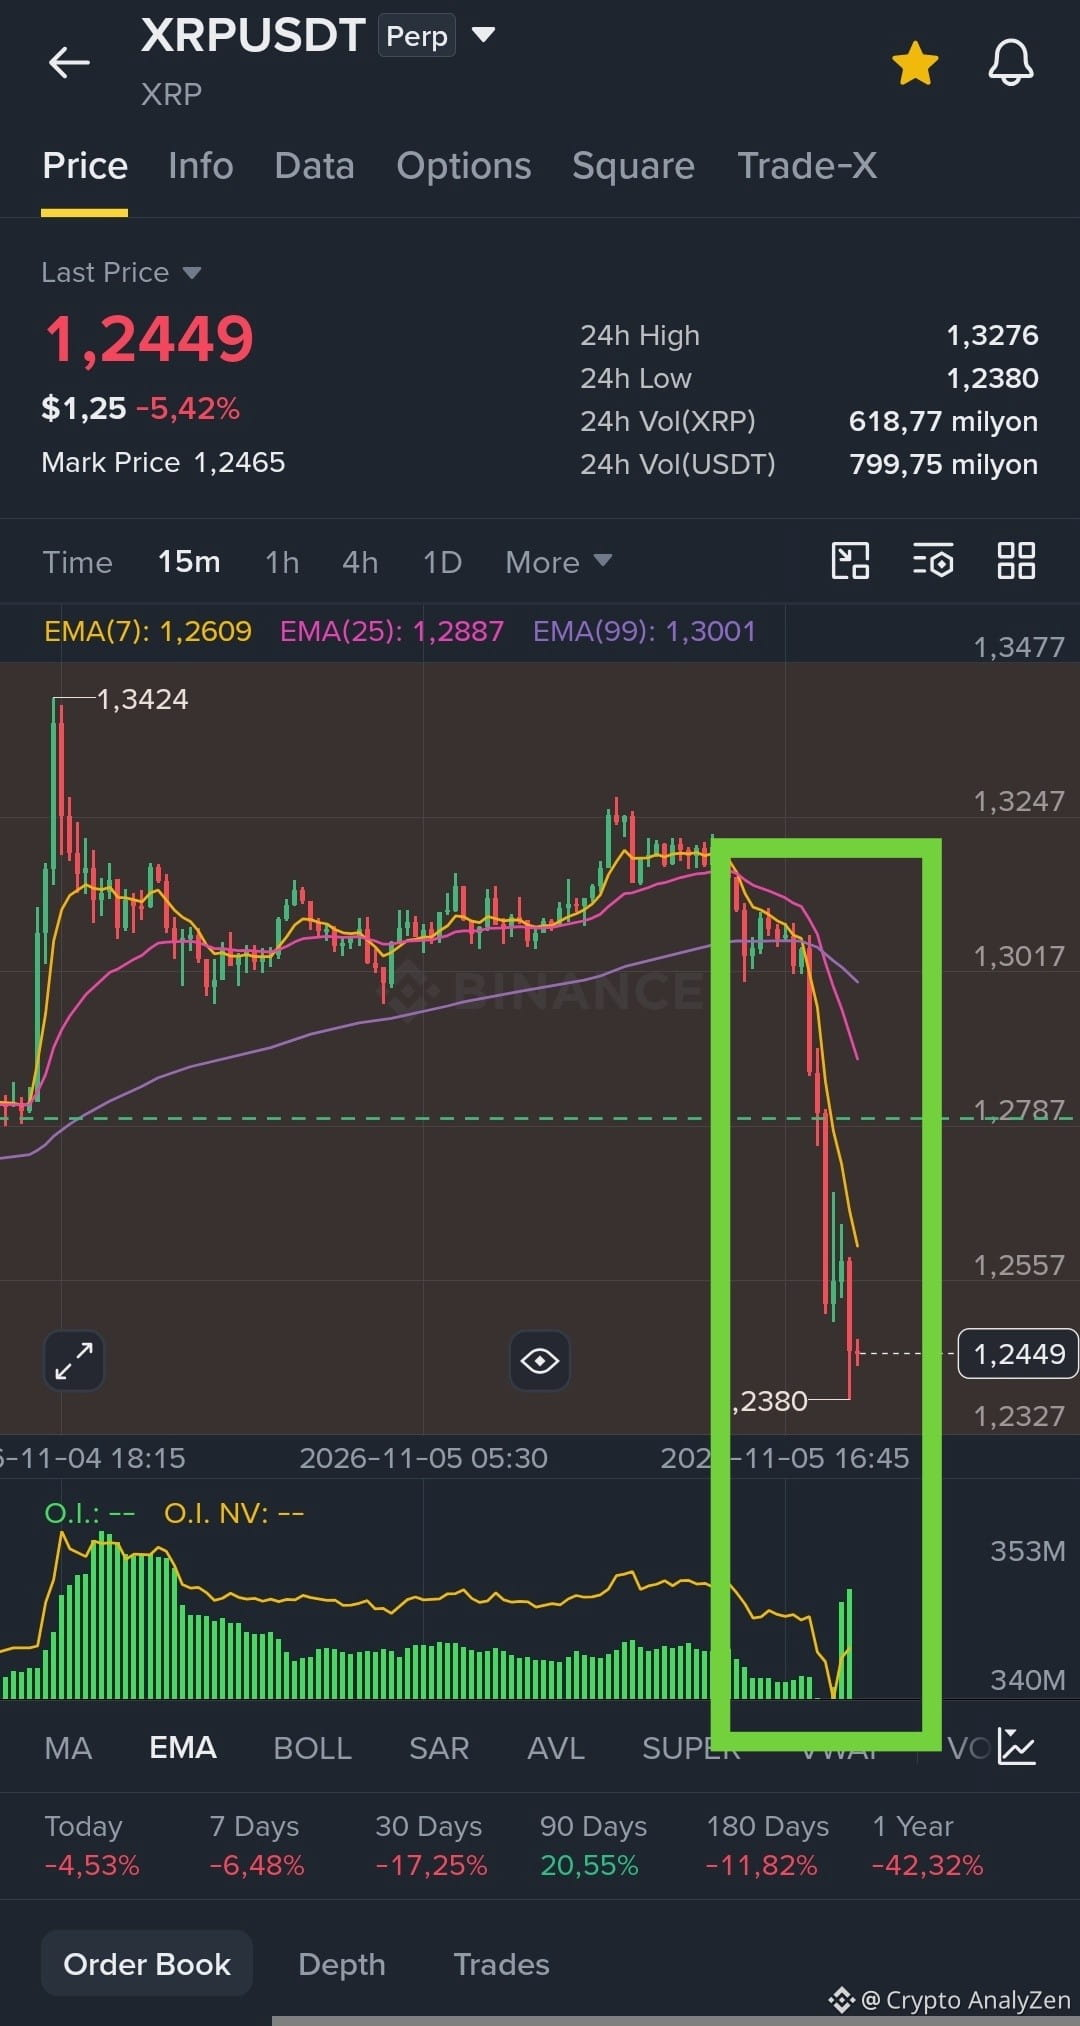
$XRP - new update analysis see in my profile ....[XRP attention !!! - Friday Nov.06](https://app.binance.com/uni-qr/cpos/385317427521808?r=TZHXF7MG&l=en&uco=24fUx02XZ_8iHr5HjXr9Ew&uc=app_square_share_link&us=copylink)
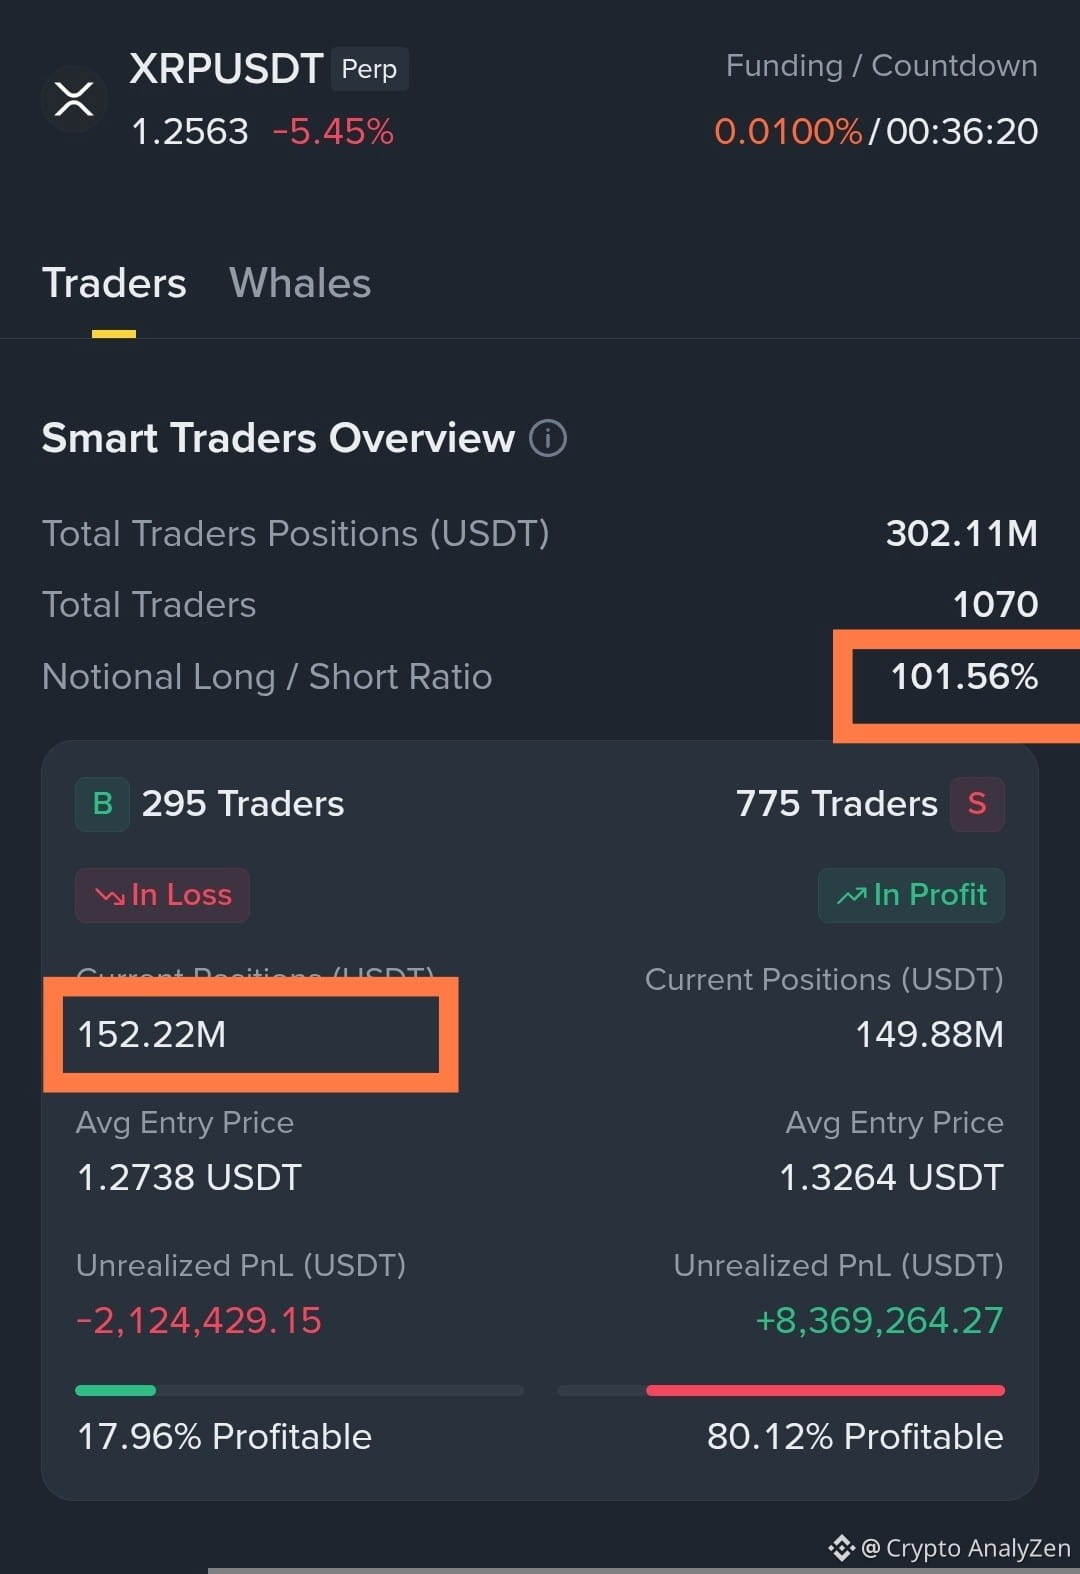
Something's happening;)
Long positions on Smart Money are increasing!
Open interest is increasing as the price falls - there's a high probability that this is a stop-loss hunt on long positions - we can expect an upward rebound at least to 1.2749
#XRPPredictions
{future}(XRPUSDT)
$XRP - new update analysis see in my profile ....XRP attention !!! - Friday Nov.06
Something's happening;)
Long positions on Smart Money are increasing!
Open interest is increasing as the price falls - there's a high probability that this is a stop-loss hunt on long positions - we can expect an upward rebound at least to 1.2749
#XRPPredictions
Something's happening;)
Long positions on Smart Money are increasing!
Open interest is increasing as the price falls - there's a high probability that this is a stop-loss hunt on long positions - we can expect an upward rebound at least to 1.2749
#XRPPredictions
9
3
53
126.6k
·
--
Bearish
$XRP
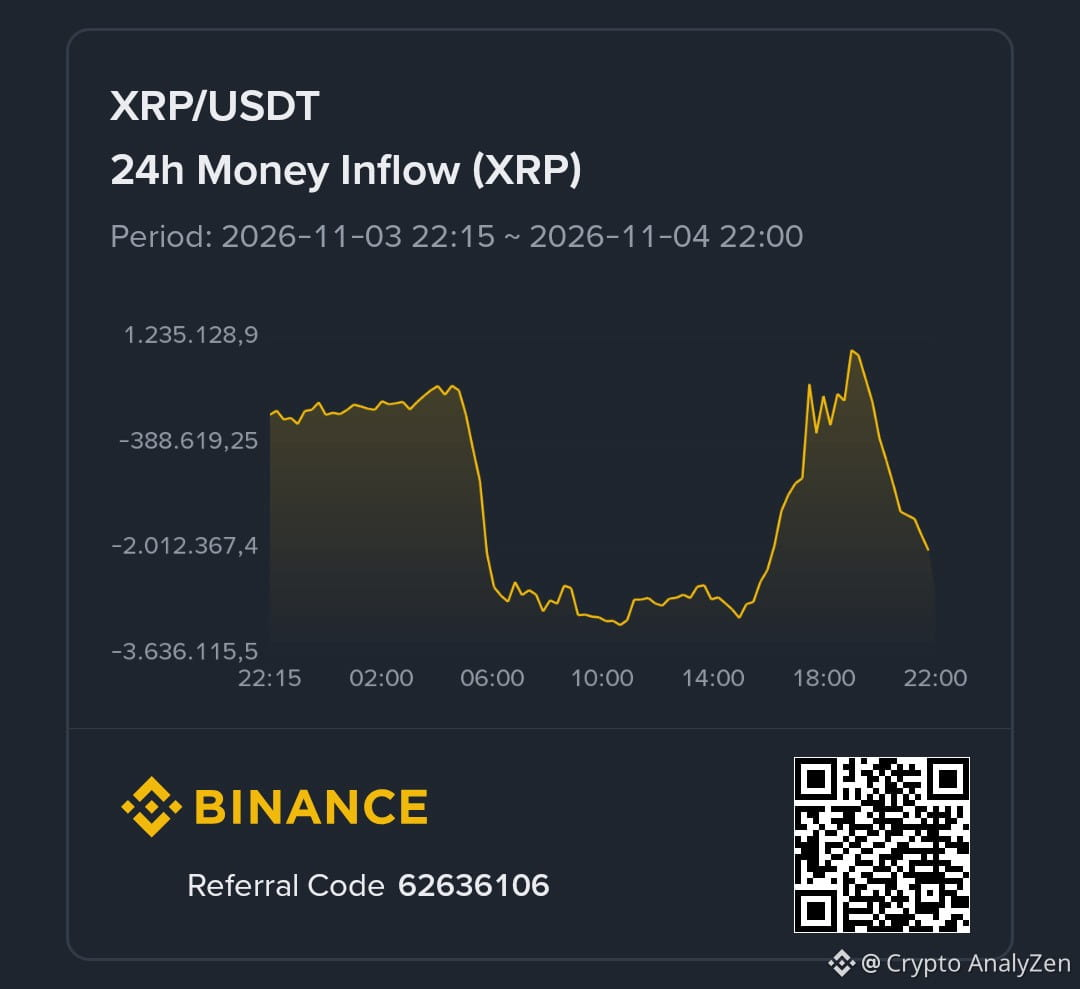
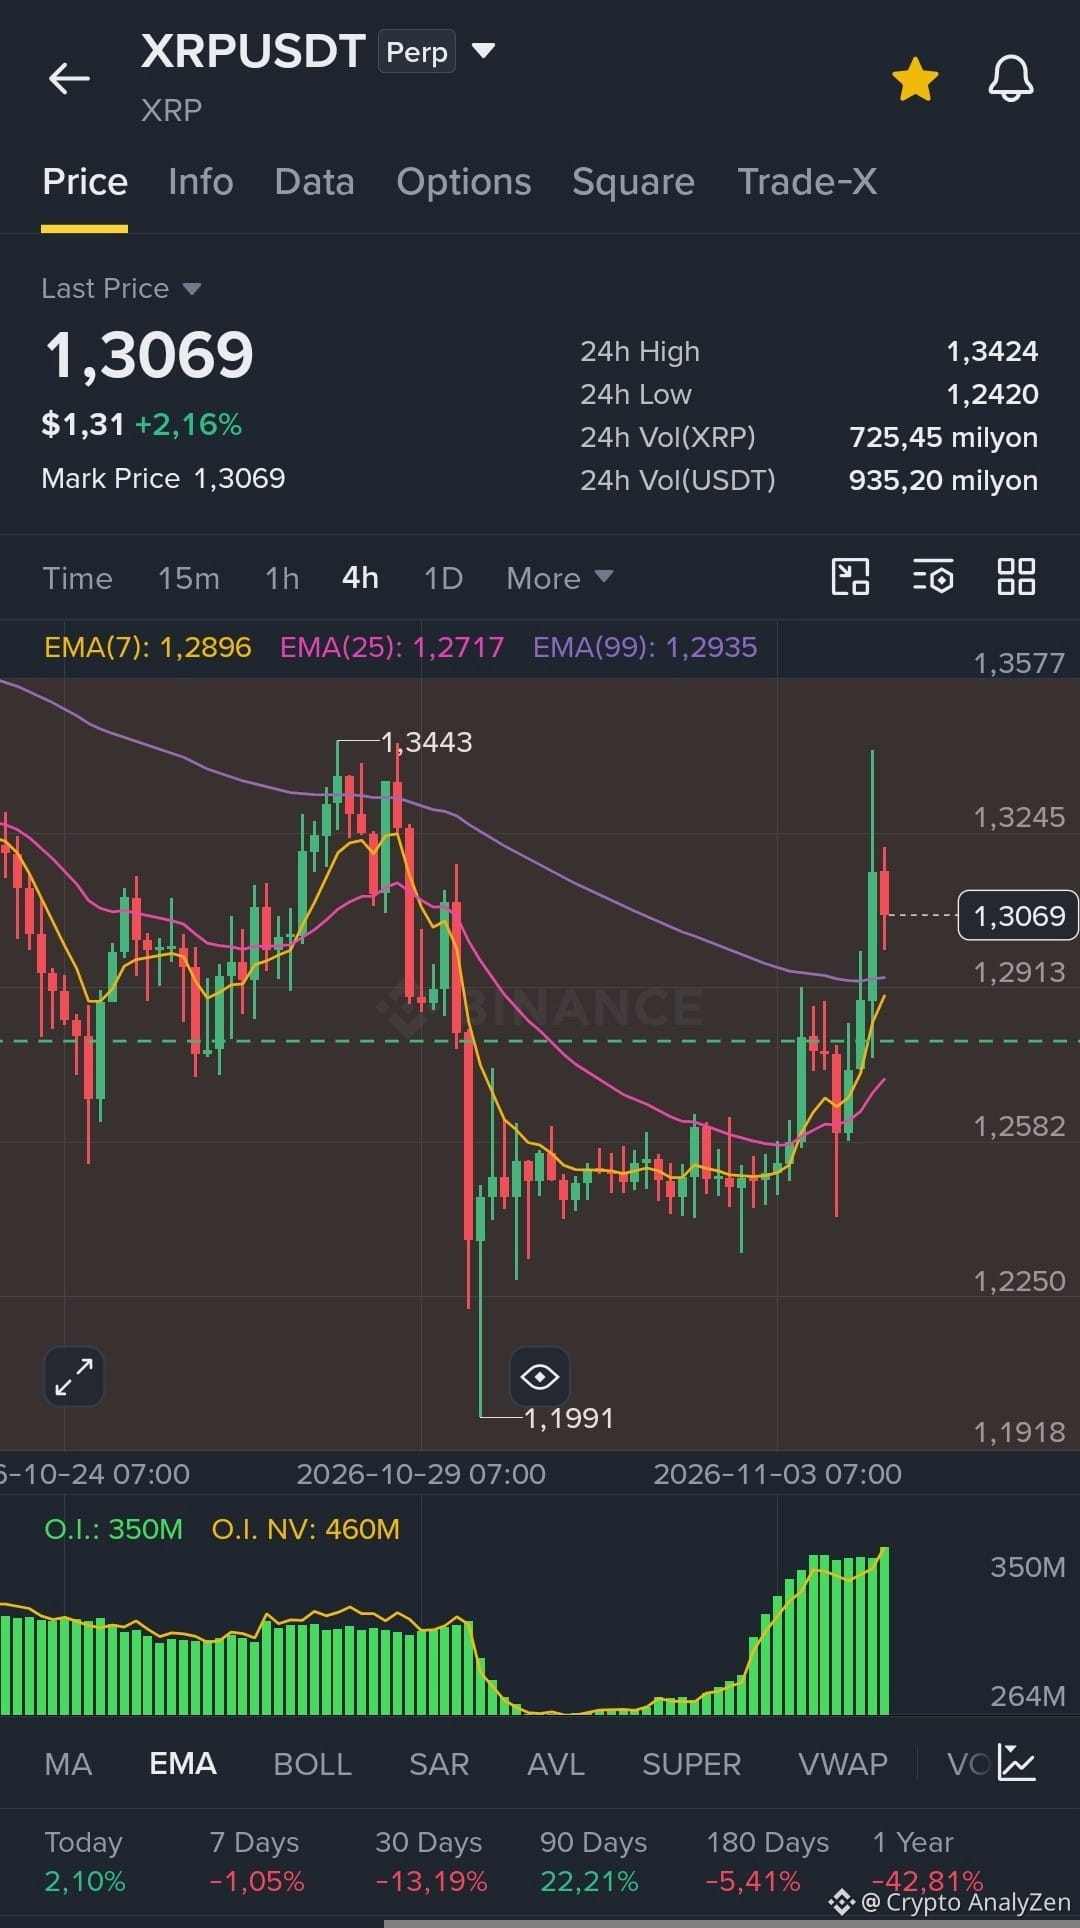
There was a sharp increase in longs and spot positions this morning, which caused the upward movement.
However, look at the current situation with spot.
Trap for late longs.
#Xrp🔥🔥
{future}(XRPUSDT)
$XRP
There was a sharp increase in longs and spot positions this morning, which caused the upward movement.
However, look at the current situation with spot.
Trap for late longs.
#Xrp🔥🔥
There was a sharp increase in longs and spot positions this morning, which caused the upward movement.
However, look at the current situation with spot.
Trap for late longs.
#Xrp🔥🔥
2
203
·
--
Bearish
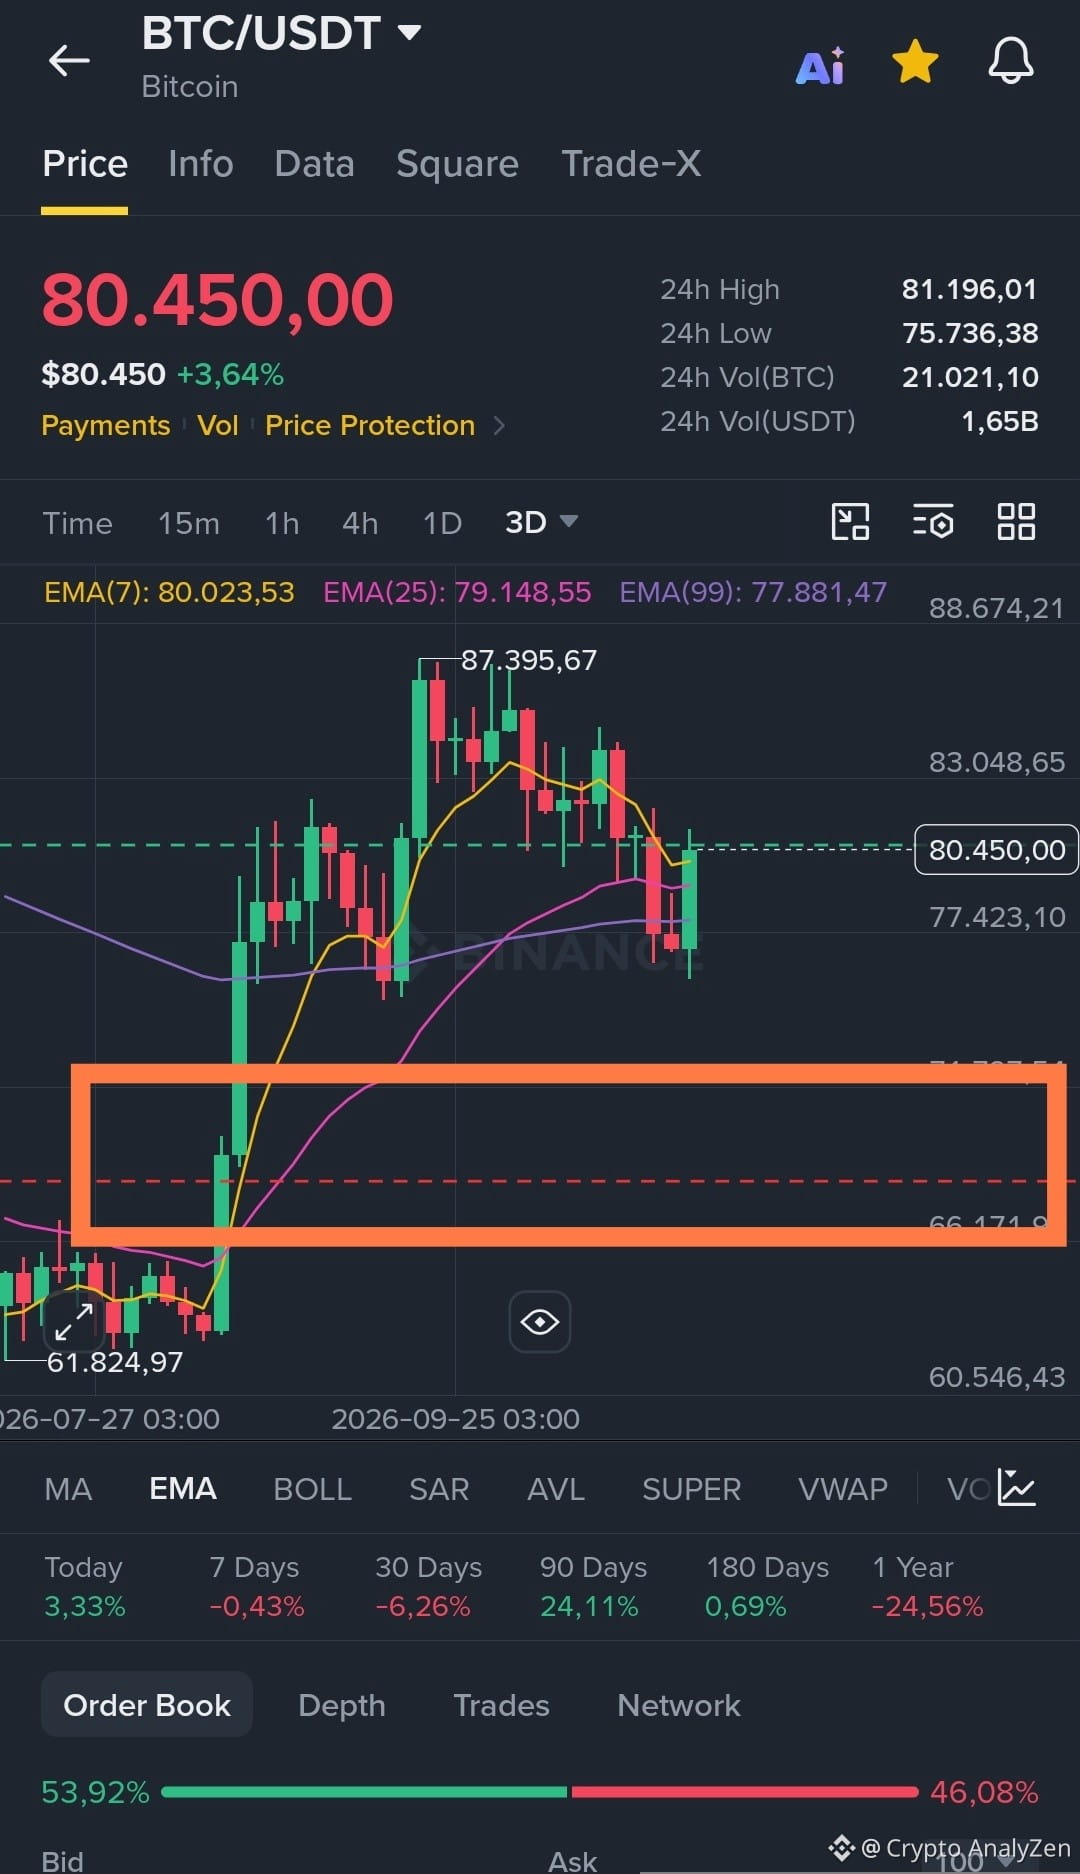
$BTC
The US election mystery has begun ;)
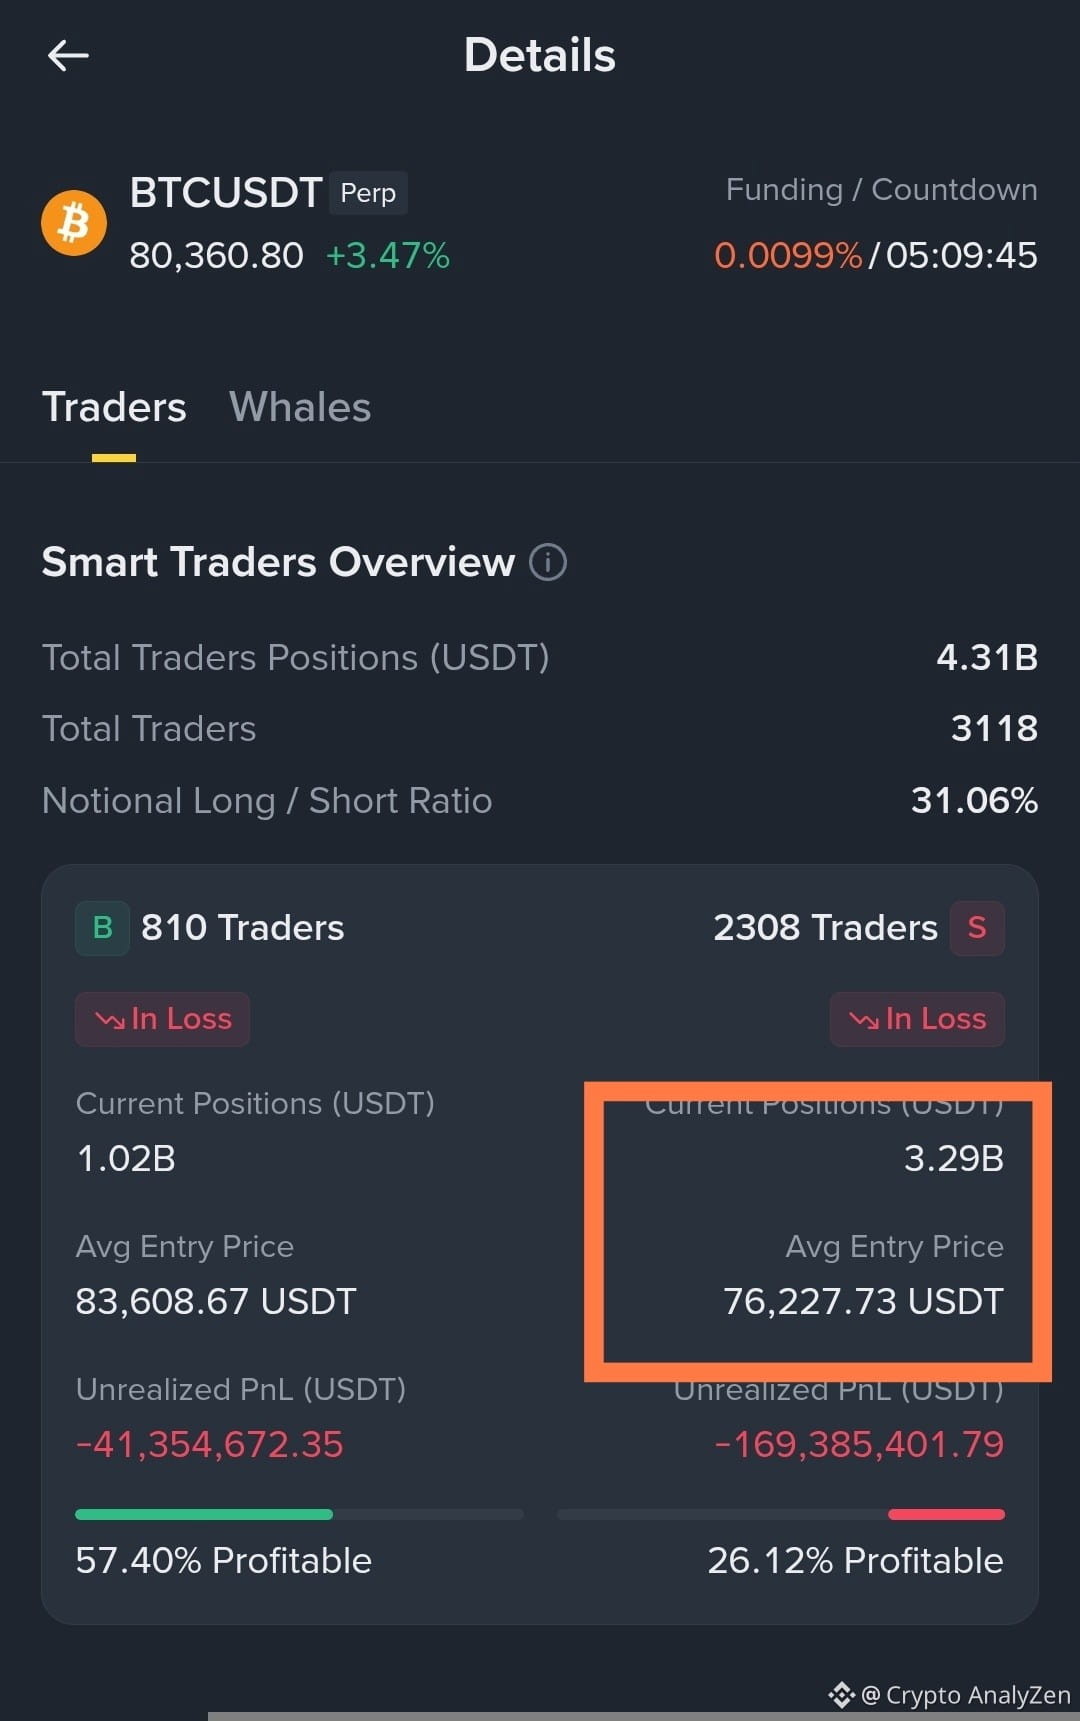
Bitcoin's upward push is highly questionable, and it feels like a survival game.
Smart money - short positions have sharply increased from 2b to 3b.
Expect a downward squeeze.
#BitcoinDunyamiz
#BTCRebounds80K
$BTC
The US election mystery has begun ;)
Bitcoin's upward push is highly questionable, and it feels like a survival game.
Smart money - short positions have sharply increased from 2b to 3b.
Expect a downward squeeze.
#BitcoinDunyamiz
#BTCRebounds80K
The US election mystery has begun ;)
Bitcoin's upward push is highly questionable, and it feels like a survival game.
Smart money - short positions have sharply increased from 2b to 3b.
Expect a downward squeeze.
#BitcoinDunyamiz
#BTCRebounds80K
1
108
·
--
Bearish
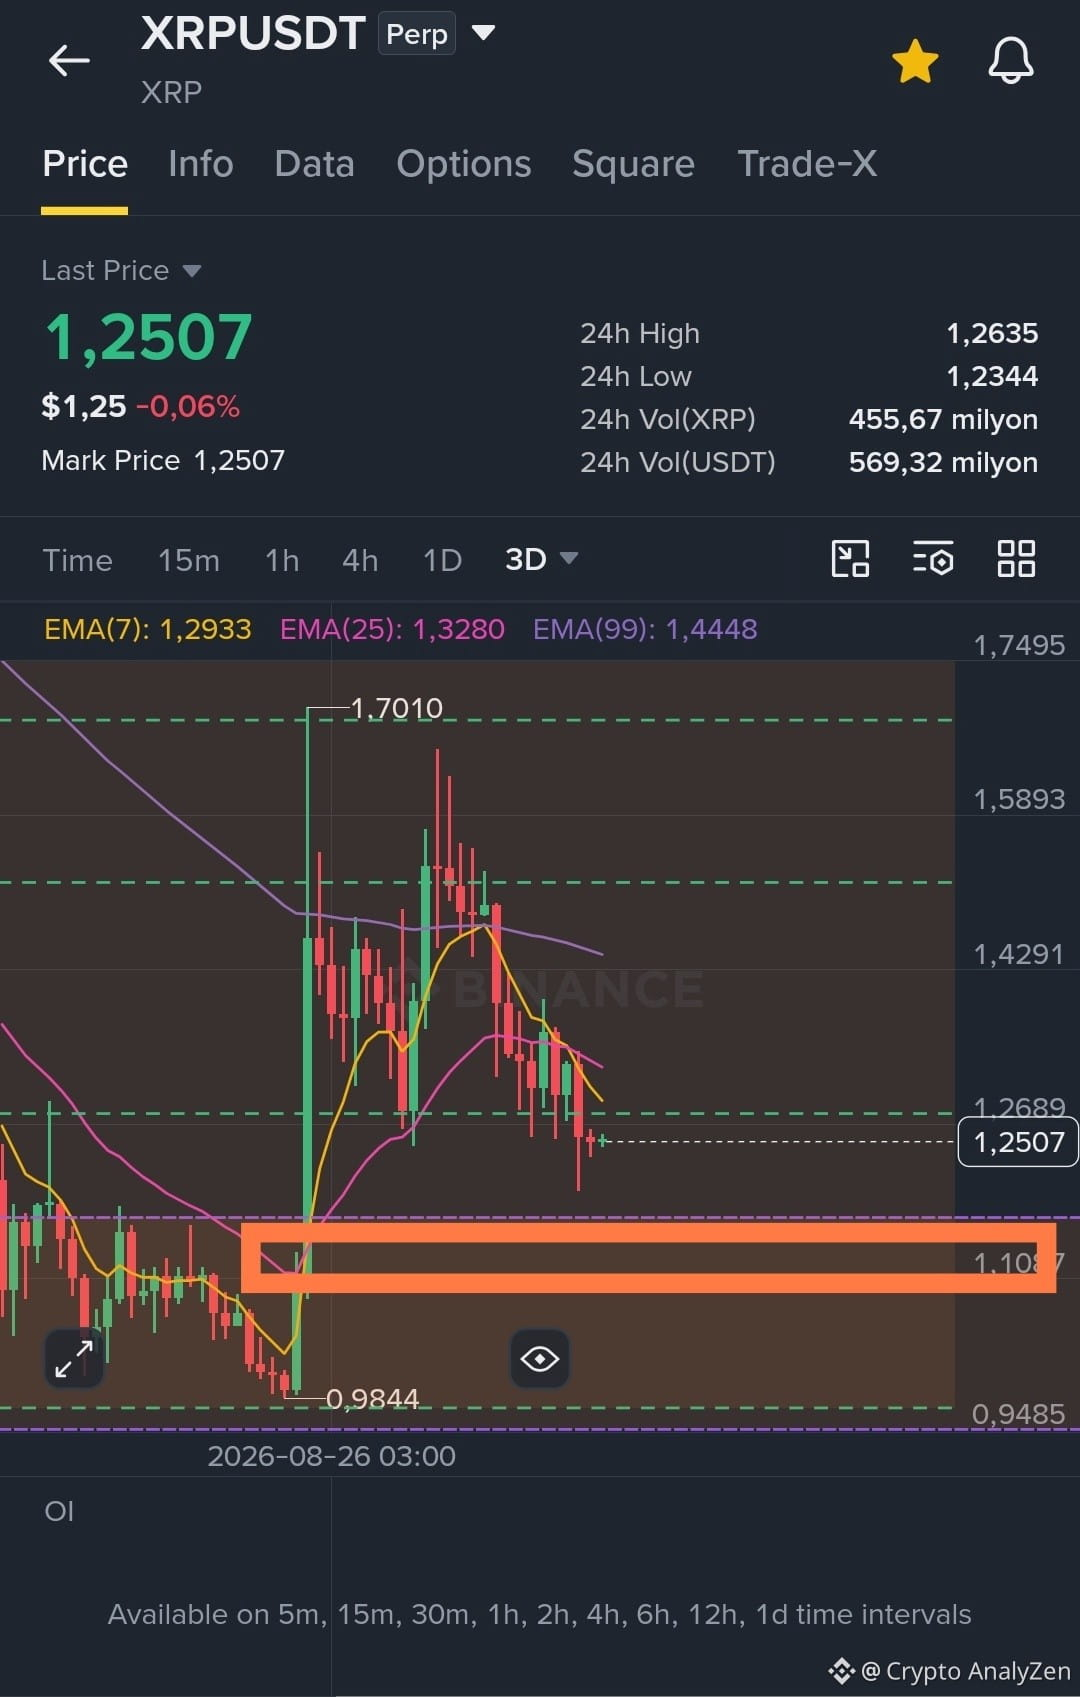
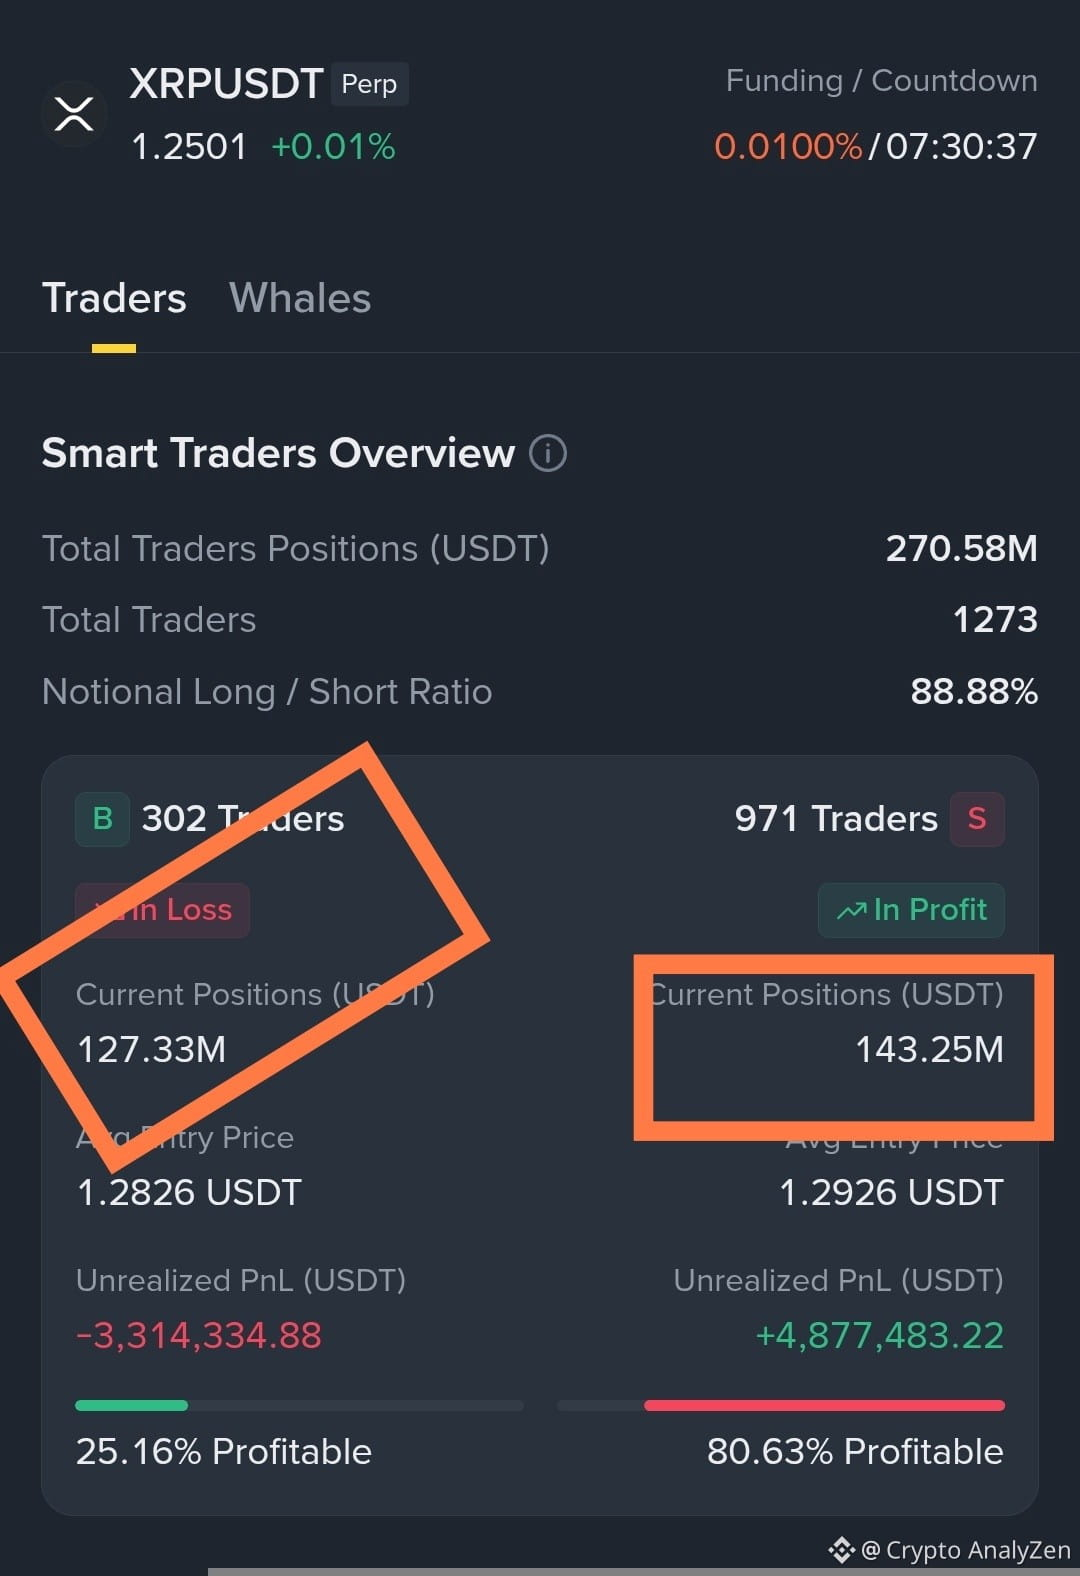
$XRP - too early for longs!
The month closed with a full red candlestick, which promises a downward trend.
Pay attention to Smart Money - long volumes have increased significantly, while the price is in a narrow range.
What could this mean?
The opening of new shorts has suppressed the price's upward movement.
Risk of a decline to 1.14 - which won't change the big picture - the expected move to 1.8 - which could happen next year ;)
#Xrp🔥🔥 #XRPPredictions
{future}(XRPUSDT)
$XRP - too early for longs!
The month closed with a full red candlestick, which promises a downward trend.
Pay attention to Smart Money - long volumes have increased significantly, while the price is in a narrow range.
What could this mean?
The opening of new shorts has suppressed the price's upward movement.
Risk of a decline to 1.14 - which won't change the big picture - the expected move to 1.8 - which could happen next year ;)
#Xrp🔥🔥 #XRPPredictions
The month closed with a full red candlestick, which promises a downward trend.
Pay attention to Smart Money - long volumes have increased significantly, while the price is in a narrow range.
What could this mean?
The opening of new shorts has suppressed the price's upward movement.
Risk of a decline to 1.14 - which won't change the big picture - the expected move to 1.8 - which could happen next year ;)
#Xrp🔥🔥 #XRPPredictions
2
4
4.6k
·
--
Bullish
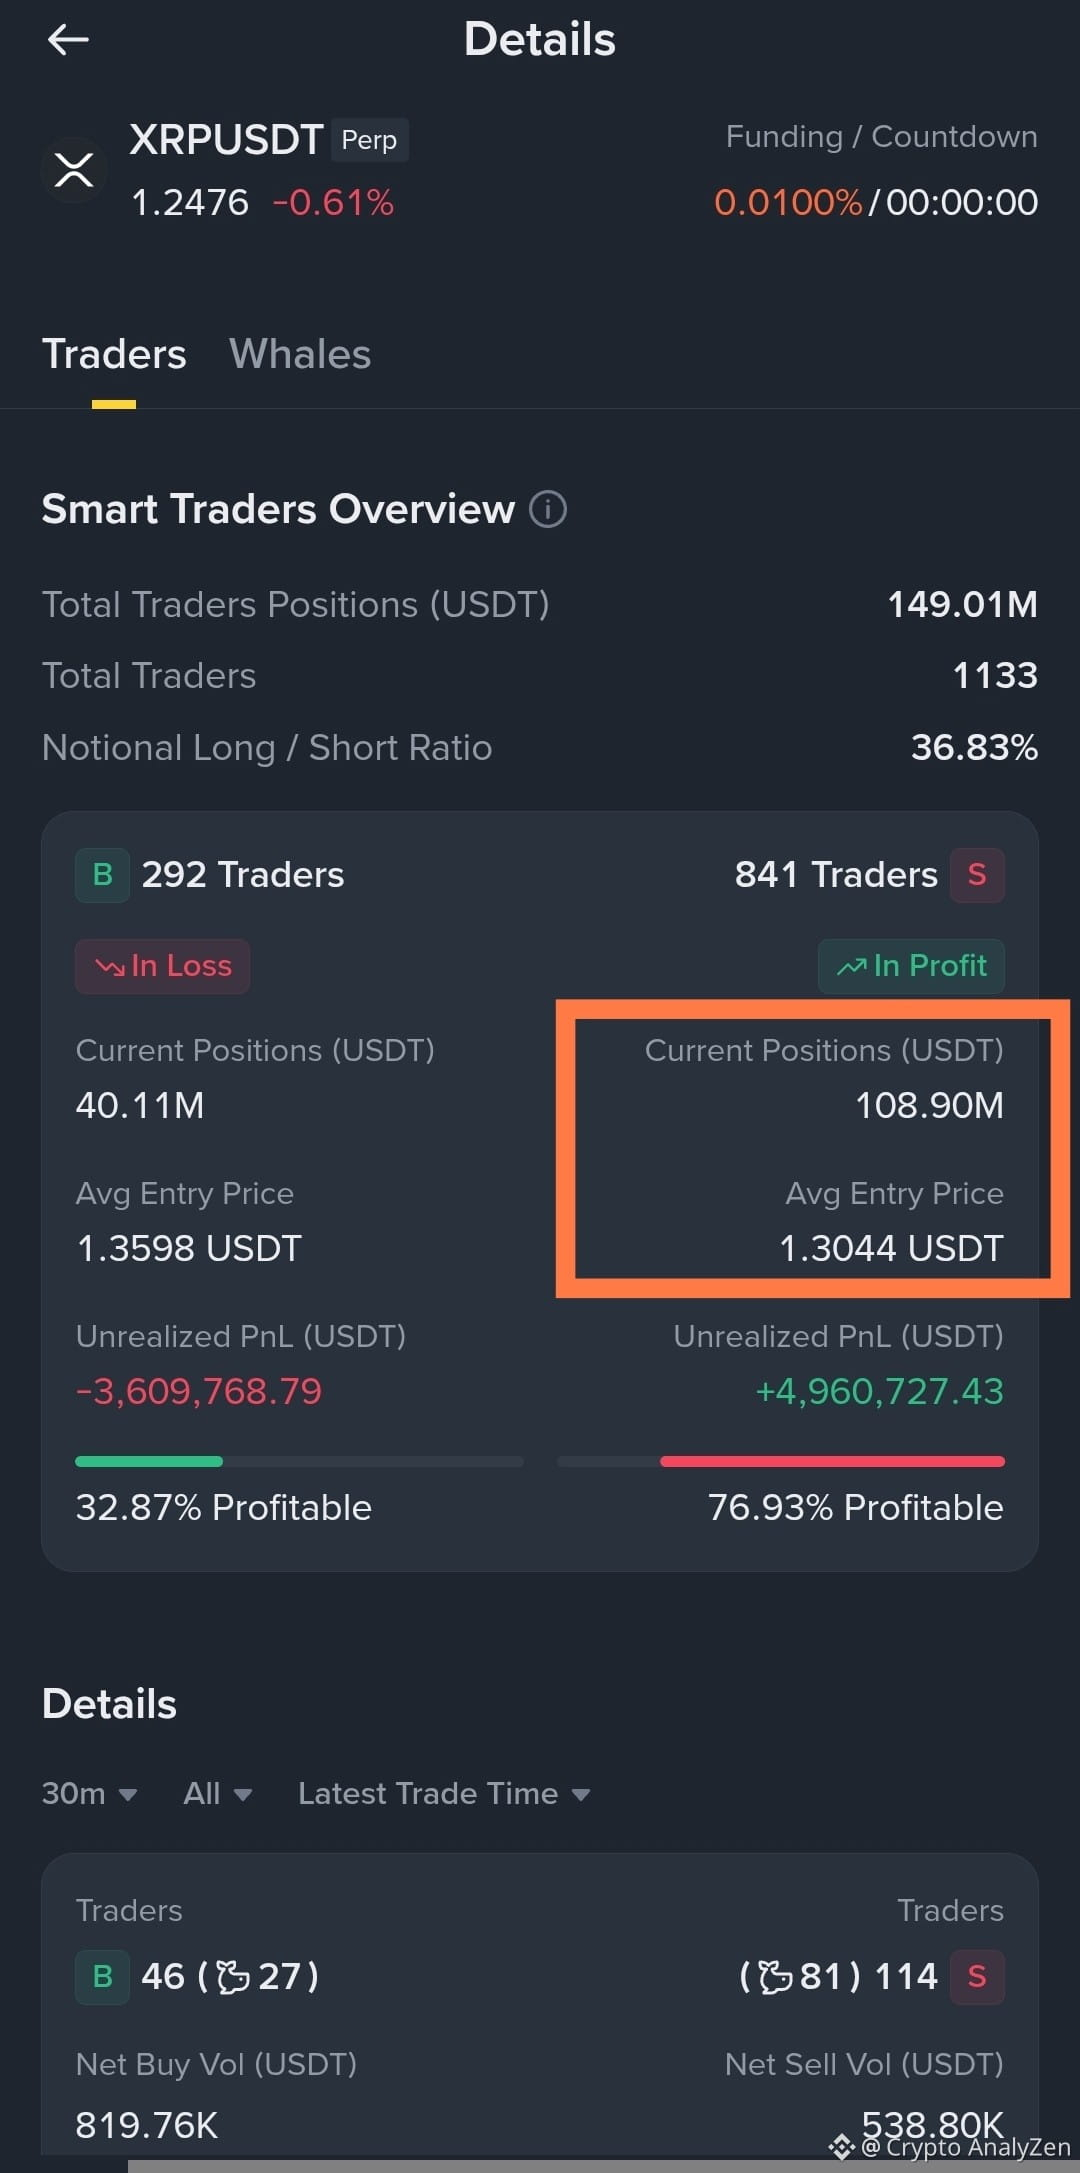
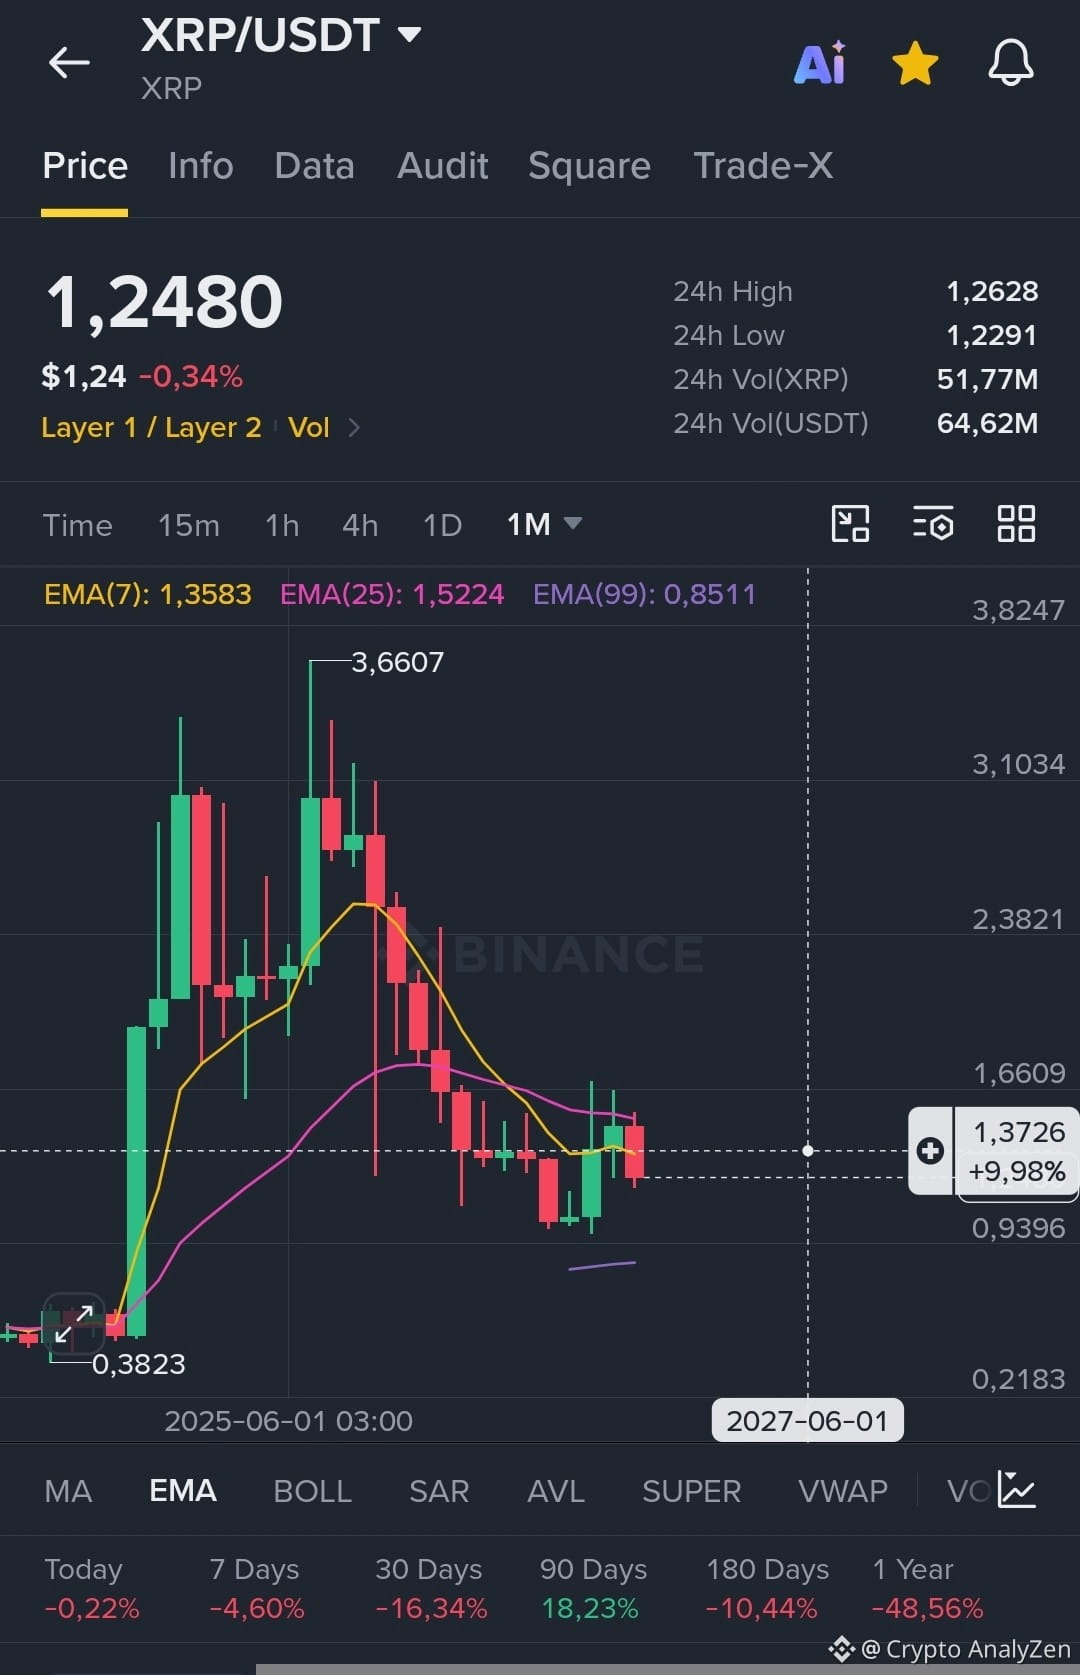
$XRP - the month is set to close with a second inside candlestick
Long-term outlook
The overall picture of a high probability of an upside move to 1.86 remains in effect
Smart Money - Old shorts are being closed, but there is no significant increase in longs
Spot - Easy new buying
---
Probable scenarios
1. Close the month at this level and sharply decline lower to 1.14 with a powerful rebound
2. Close the month at last month's opening level of 1.36
Any assumptions?
#XRPPredictions
{future}(XRPUSDT)
$XRP - the month is set to close with a second inside candlestick
Long-term outlook
The overall picture of a high probability of an upside move to 1.86 remains in effect
Smart Money - Old shorts are being closed, but there is no significant increase in longs
Spot - Easy new buying
---
Probable scenarios
1. Close the month at this level and sharply decline lower to 1.14 with a powerful rebound
2. Close the month at last month's opening level of 1.36
Any assumptions?
#XRPPredictions
Long-term outlook
The overall picture of a high probability of an upside move to 1.86 remains in effect
Smart Money - Old shorts are being closed, but there is no significant increase in longs
Spot - Easy new buying
---
Probable scenarios
1. Close the month at this level and sharply decline lower to 1.14 with a powerful rebound
2. Close the month at last month's opening level of 1.36
Any assumptions?
#XRPPredictions
1
407
$XRP - too early for longs...
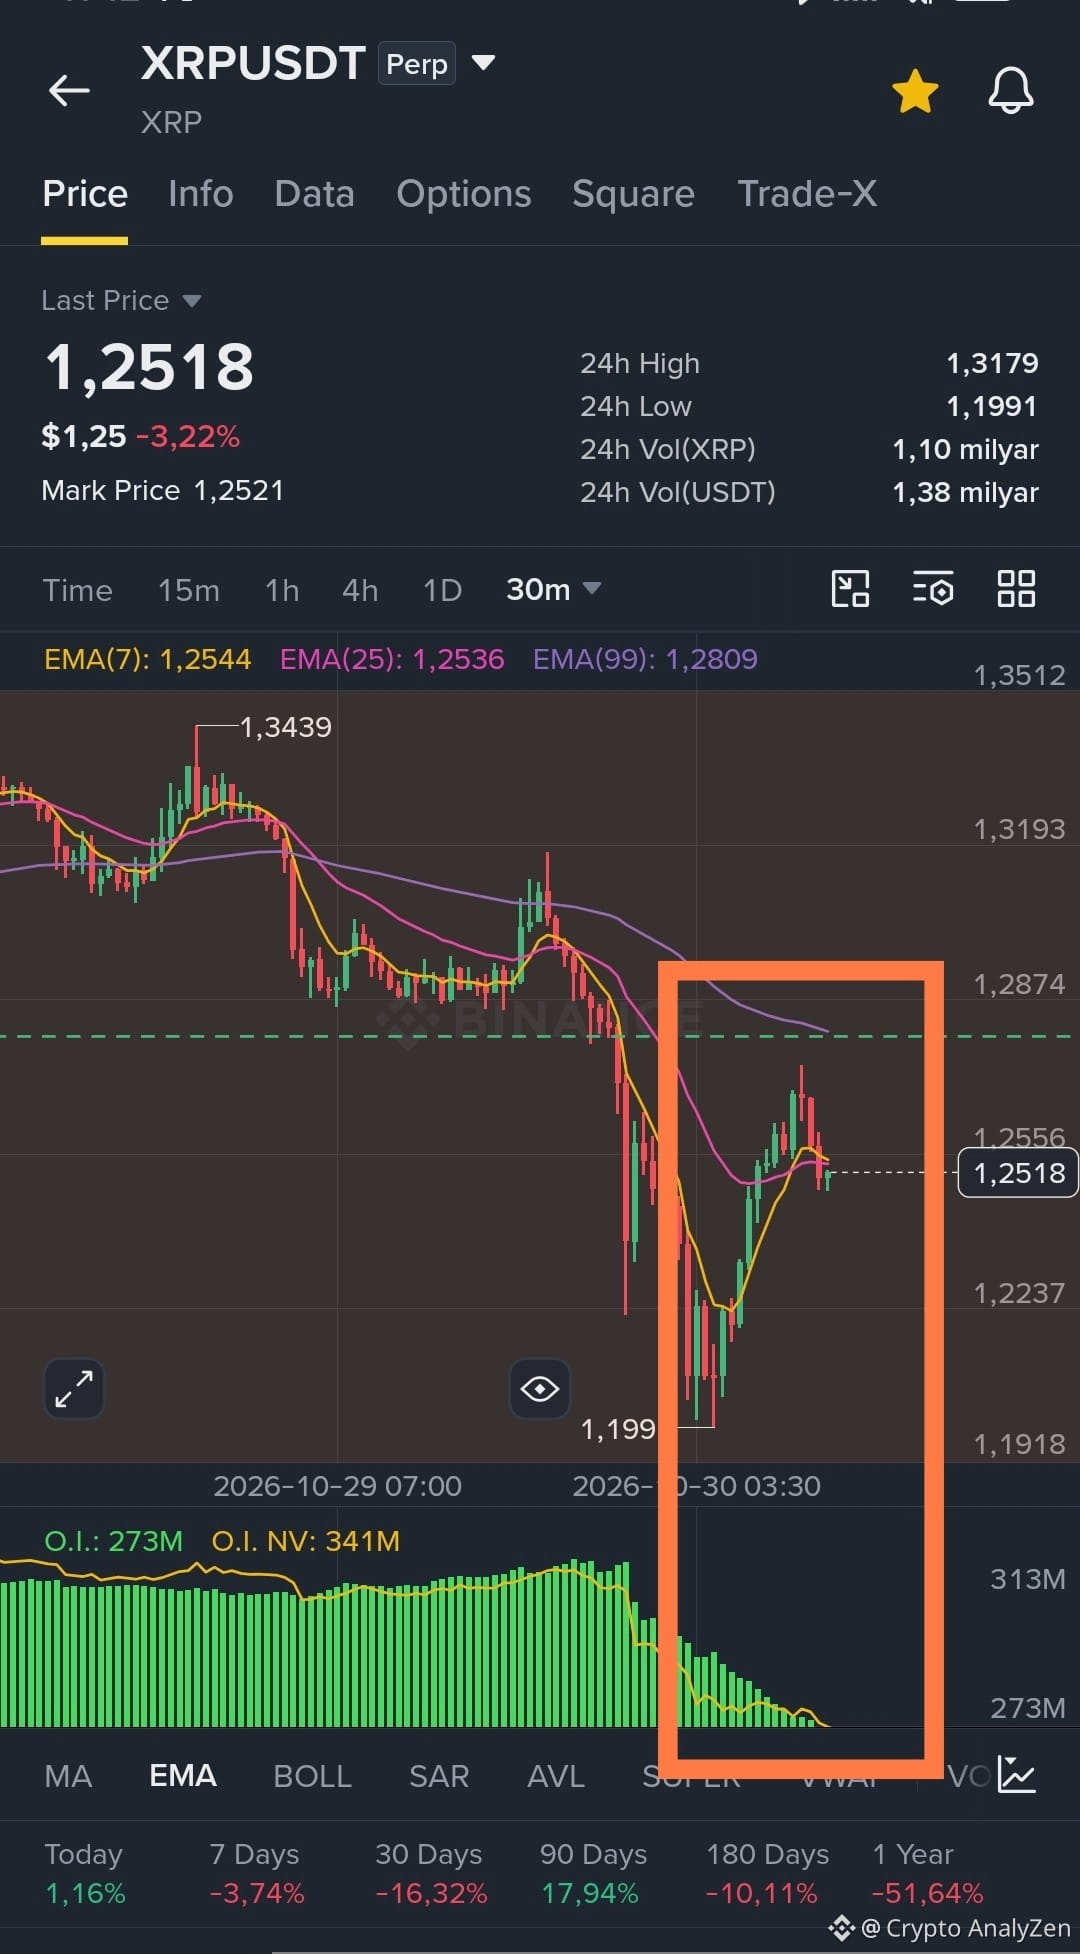
The sharp closing of spot positions after the close of the NY session, plus massive new longs on futures, caused the price to drop below the previous month's low (1.2457).
This is where massive shorts began to close their positions ;)
However, this isn't a reversal yet.
Smart Money - with shorts dominating 4 times more than longs - suggests that we should expect the price to drop below - testing the July high (1.1838).
Where will the month close? ;) type your number ;)
#Xrp🔥🔥
{future}(XRPUSDT)
$XRP - too early for longs...
The sharp closing of spot positions after the close of the NY session, plus massive new longs on futures, caused the price to drop below the previous month's low (1.2457).
This is where massive shorts began to close their positions ;)
However, this isn't a reversal yet.
Smart Money - with shorts dominating 4 times more than longs - suggests that we should expect the price to drop below - testing the July high (1.1838).
Where will the month close? ;) type your number ;)
#Xrp🔥🔥
The sharp closing of spot positions after the close of the NY session, plus massive new longs on futures, caused the price to drop below the previous month's low (1.2457).
This is where massive shorts began to close their positions ;)
However, this isn't a reversal yet.
Smart Money - with shorts dominating 4 times more than longs - suggests that we should expect the price to drop below - testing the July high (1.1838).
Where will the month close? ;) type your number ;)
#Xrp🔥🔥
1
796
·
--
Bearish
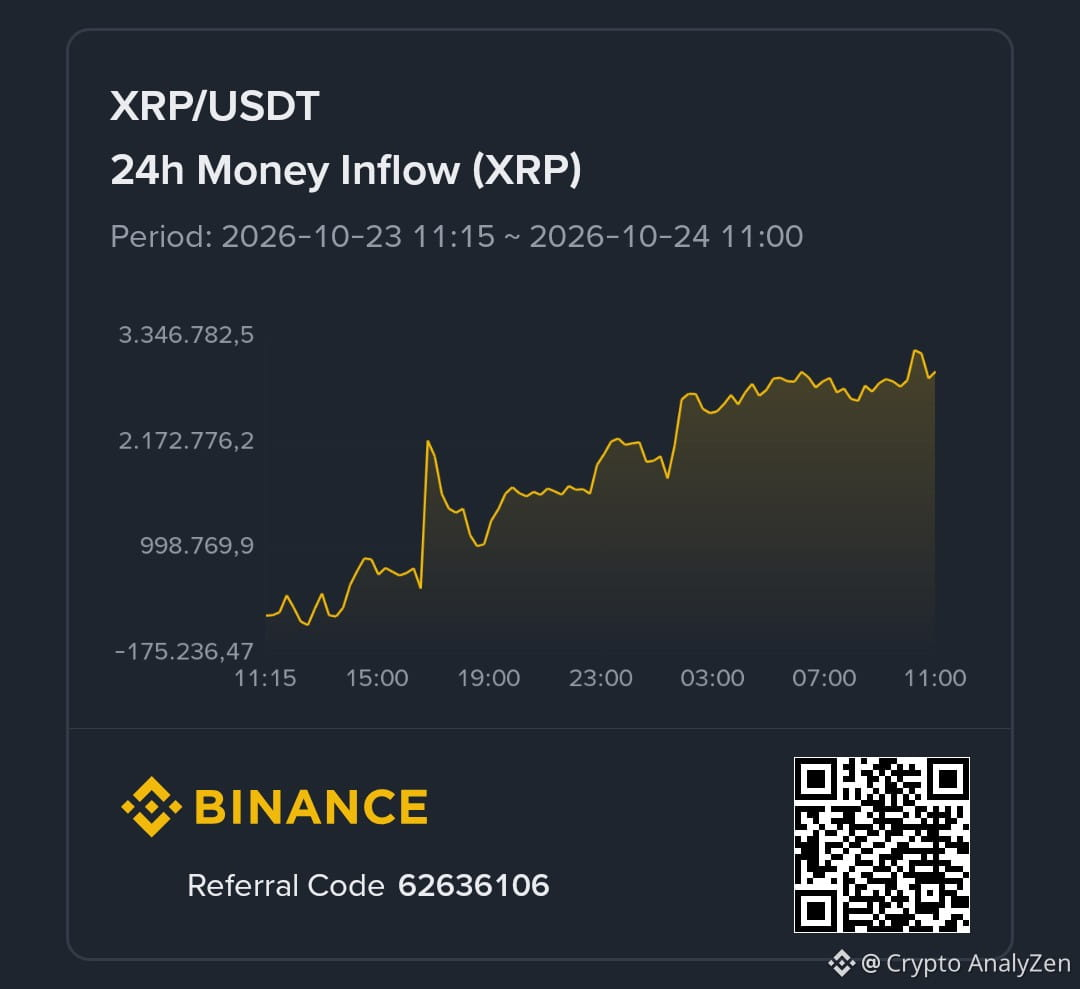
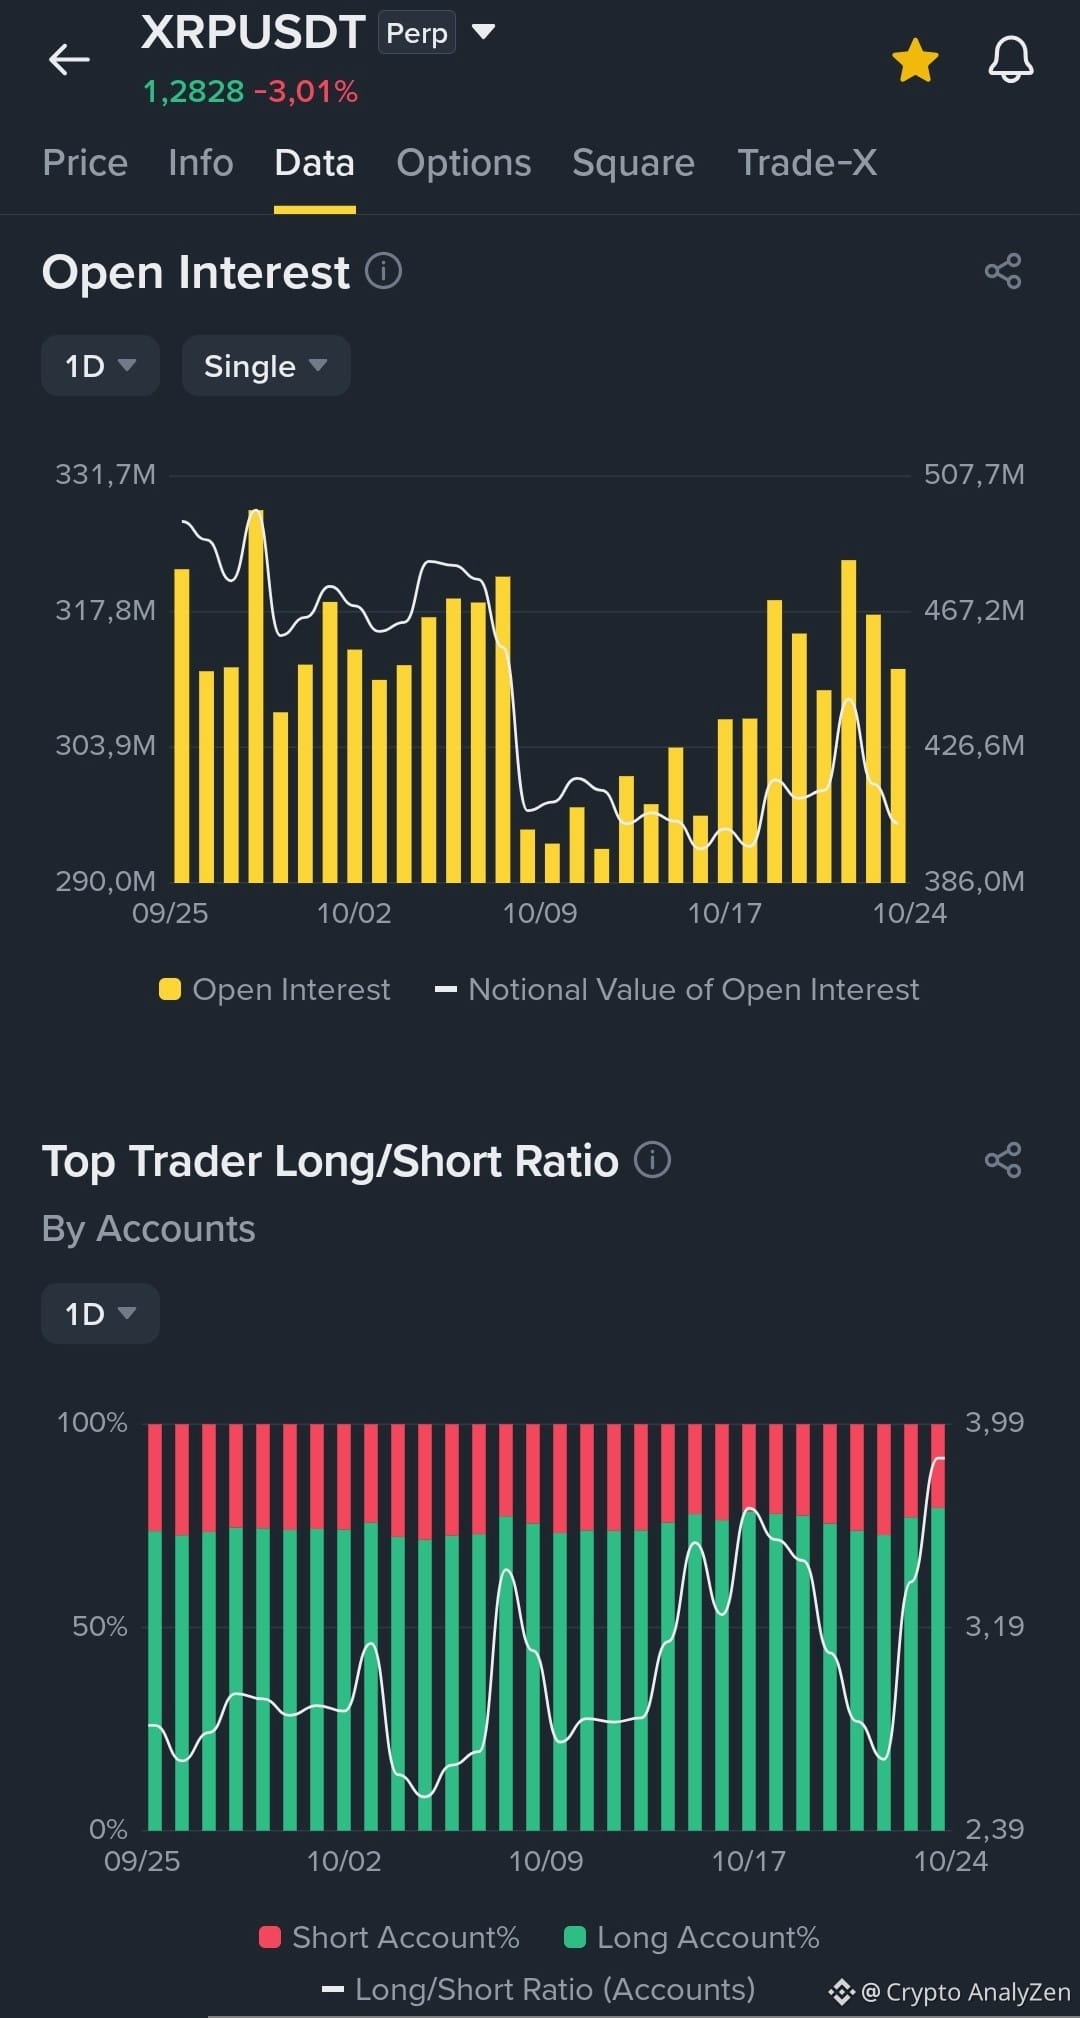
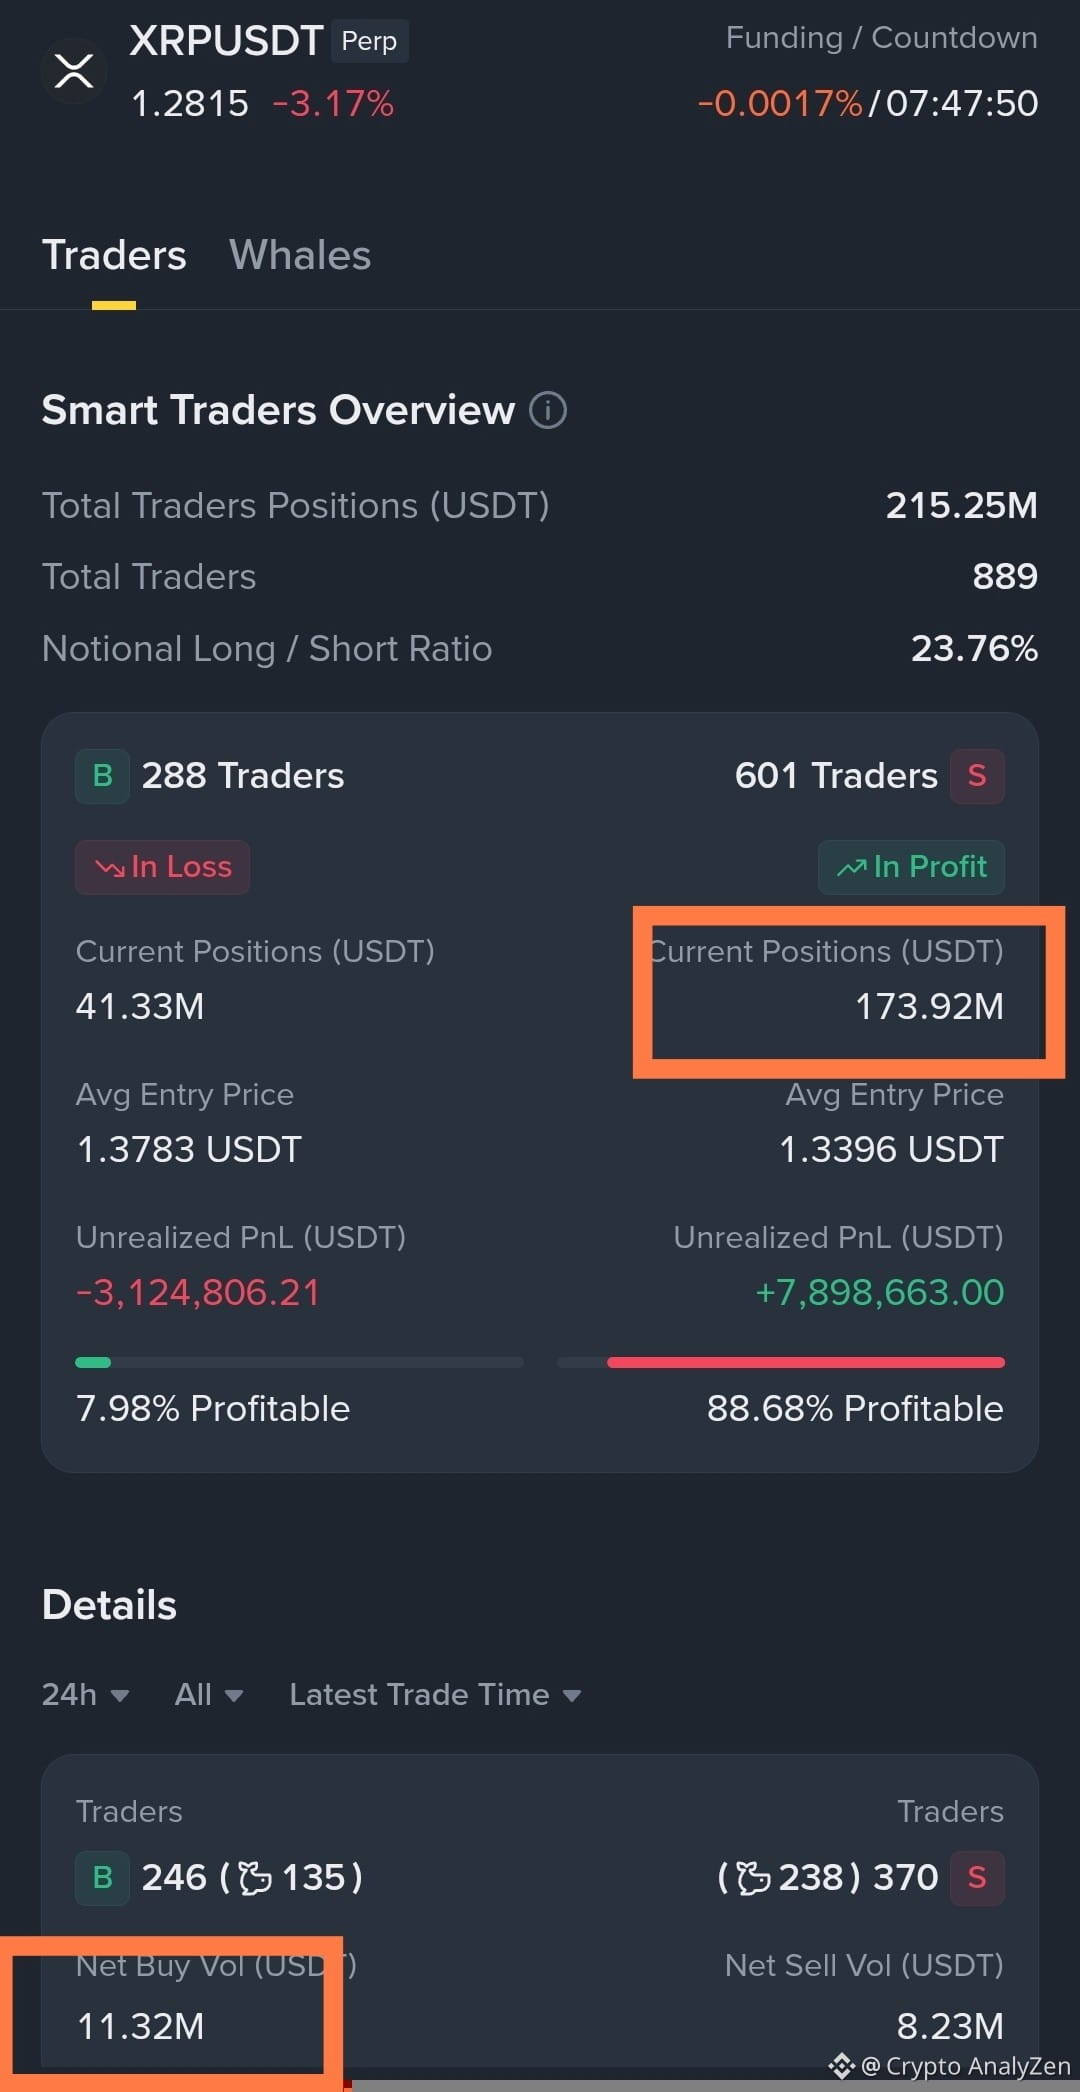
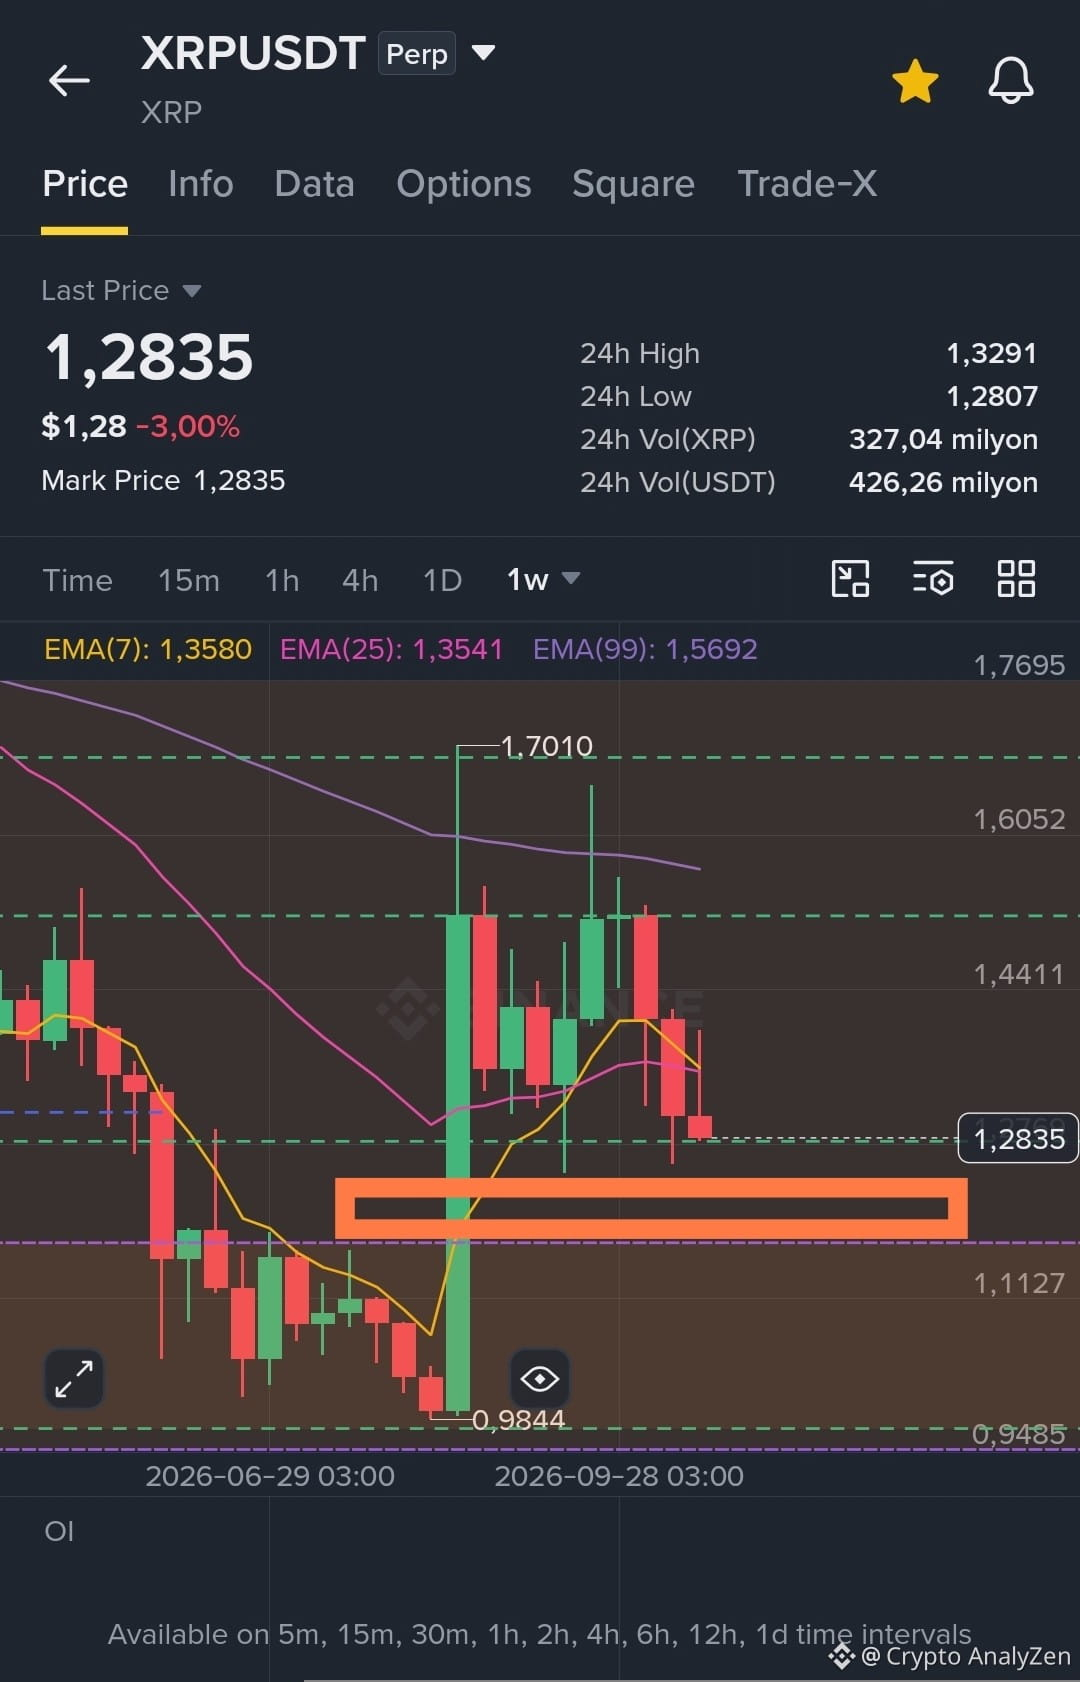
$XRP price is falling...
while
spot positions are increasing...
long positions are increasing on futures...
however, Smart Moneys—with shorts dominating 4 times more than longs—suggests a price decline below last month's low (1.2457) and a test of the July high (1.1838) is expected.
#Xrp🔥🔥 #XRPPredictions
{future}(XRPUSDT)
$XRP price is falling...
while
spot positions are increasing...
long positions are increasing on futures...
however, Smart Moneys—with shorts dominating 4 times more than longs—suggests a price decline below last month's low (1.2457) and a test of the July high (1.1838) is expected.
#Xrp🔥🔥 #XRPPredictions
while
spot positions are increasing...
long positions are increasing on futures...
however, Smart Moneys—with shorts dominating 4 times more than longs—suggests a price decline below last month's low (1.2457) and a test of the July high (1.1838) is expected.
#Xrp🔥🔥 #XRPPredictions
1
393
·
--
Bullish
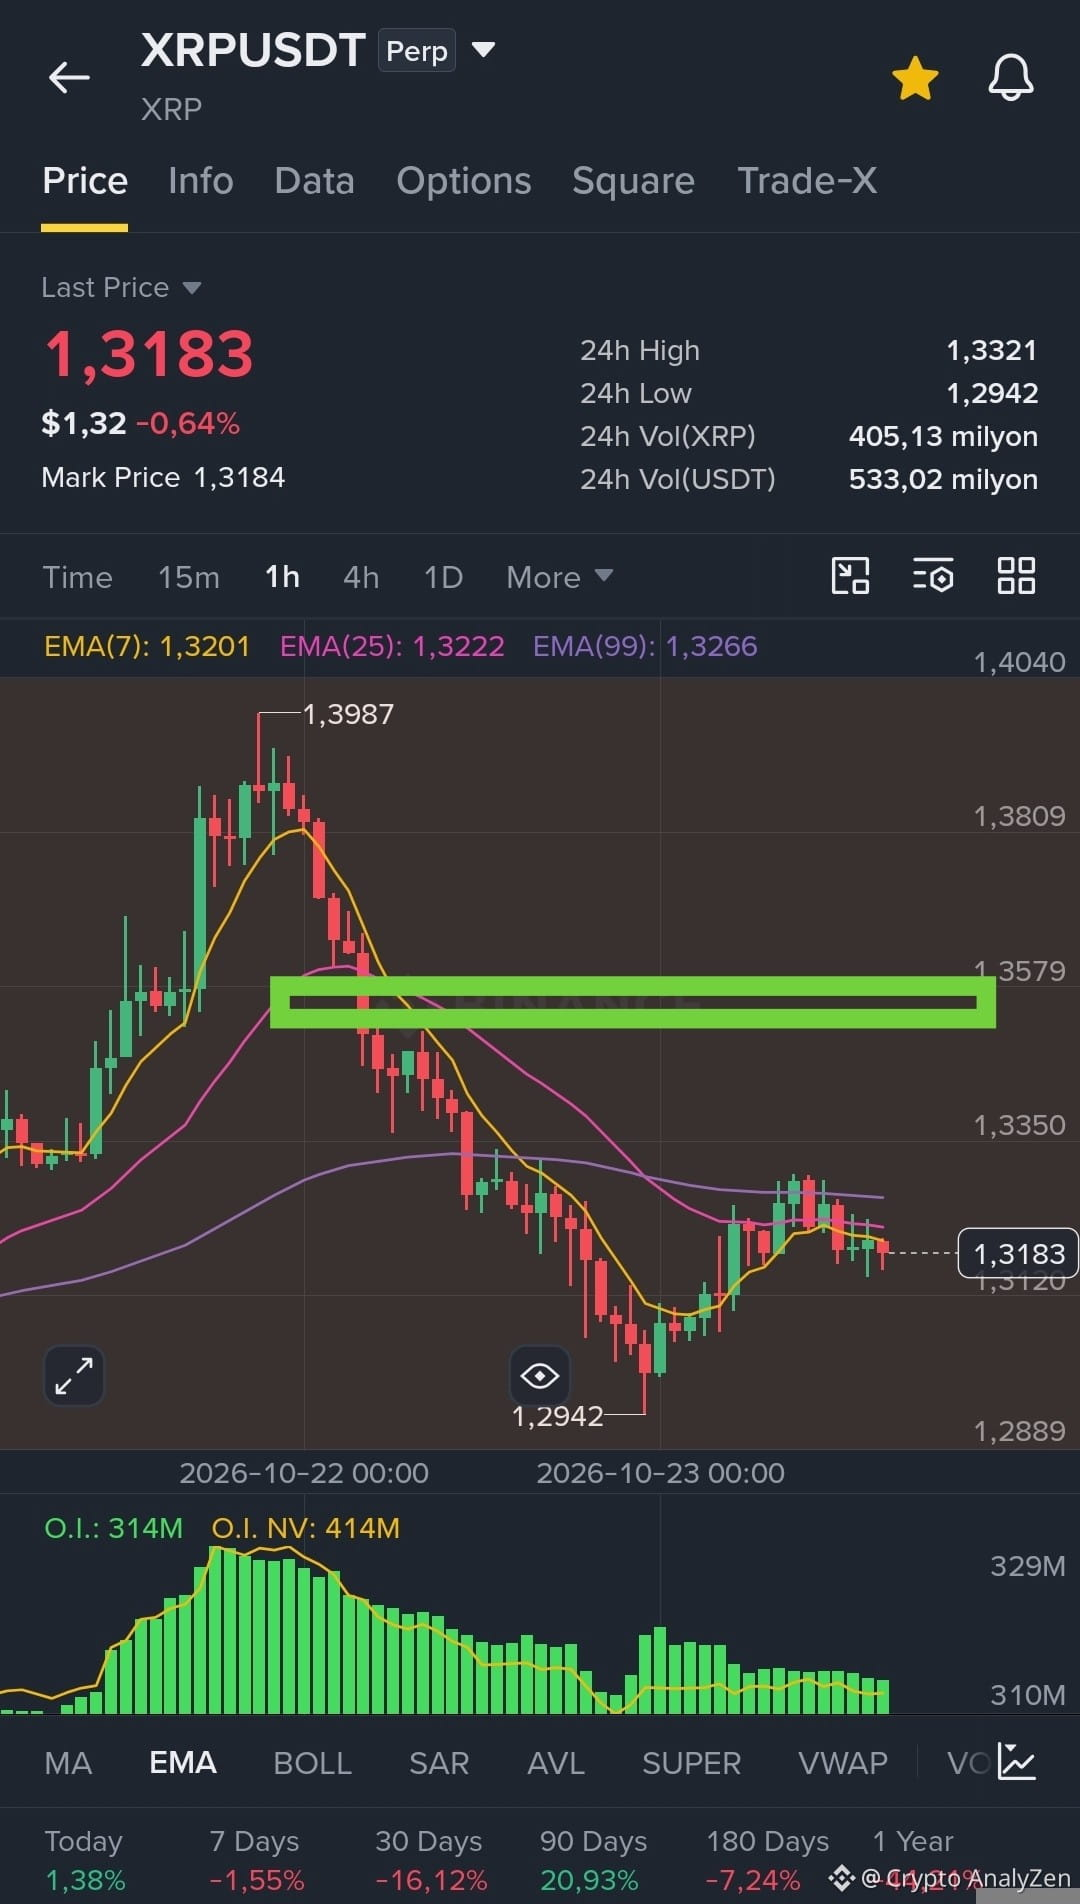
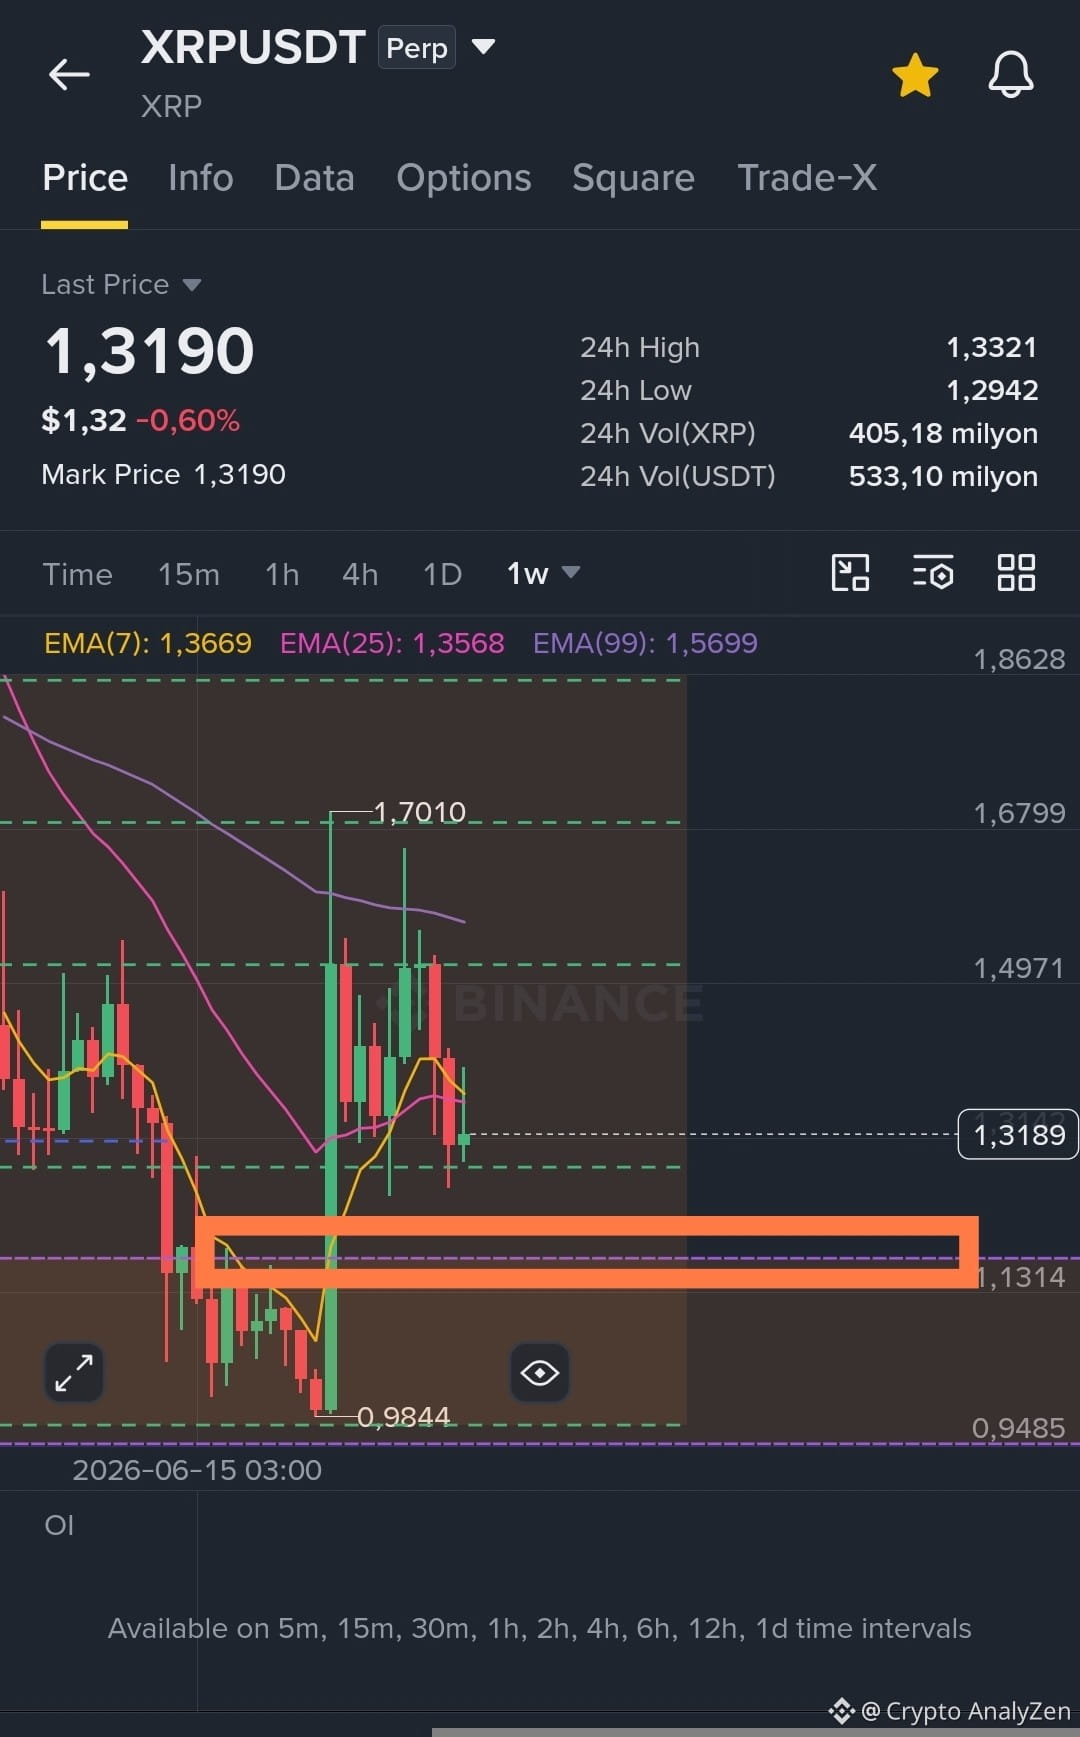
$XRP has reversed ;) but ...
with a general predominance of shorts (4x)
over the past 24 hours, twice as many longs as shorts have been opened
hourly chart - likely to reach 1.34-1.35
weekly chart - high probability of continued decline to 1.14
#XRPPredictions
{future}(XRPUSDT)
$XRP has reversed ;) but ...
with a general predominance of shorts (4x)
over the past 24 hours, twice as many longs as shorts have been opened
hourly chart - likely to reach 1.34-1.35
weekly chart - high probability of continued decline to 1.14
#XRPPredictions
with a general predominance of shorts (4x)
over the past 24 hours, twice as many longs as shorts have been opened
hourly chart - likely to reach 1.34-1.35
weekly chart - high probability of continued decline to 1.14
#XRPPredictions
1
370
·
--
Bullish
$BTC $XRP $SUI
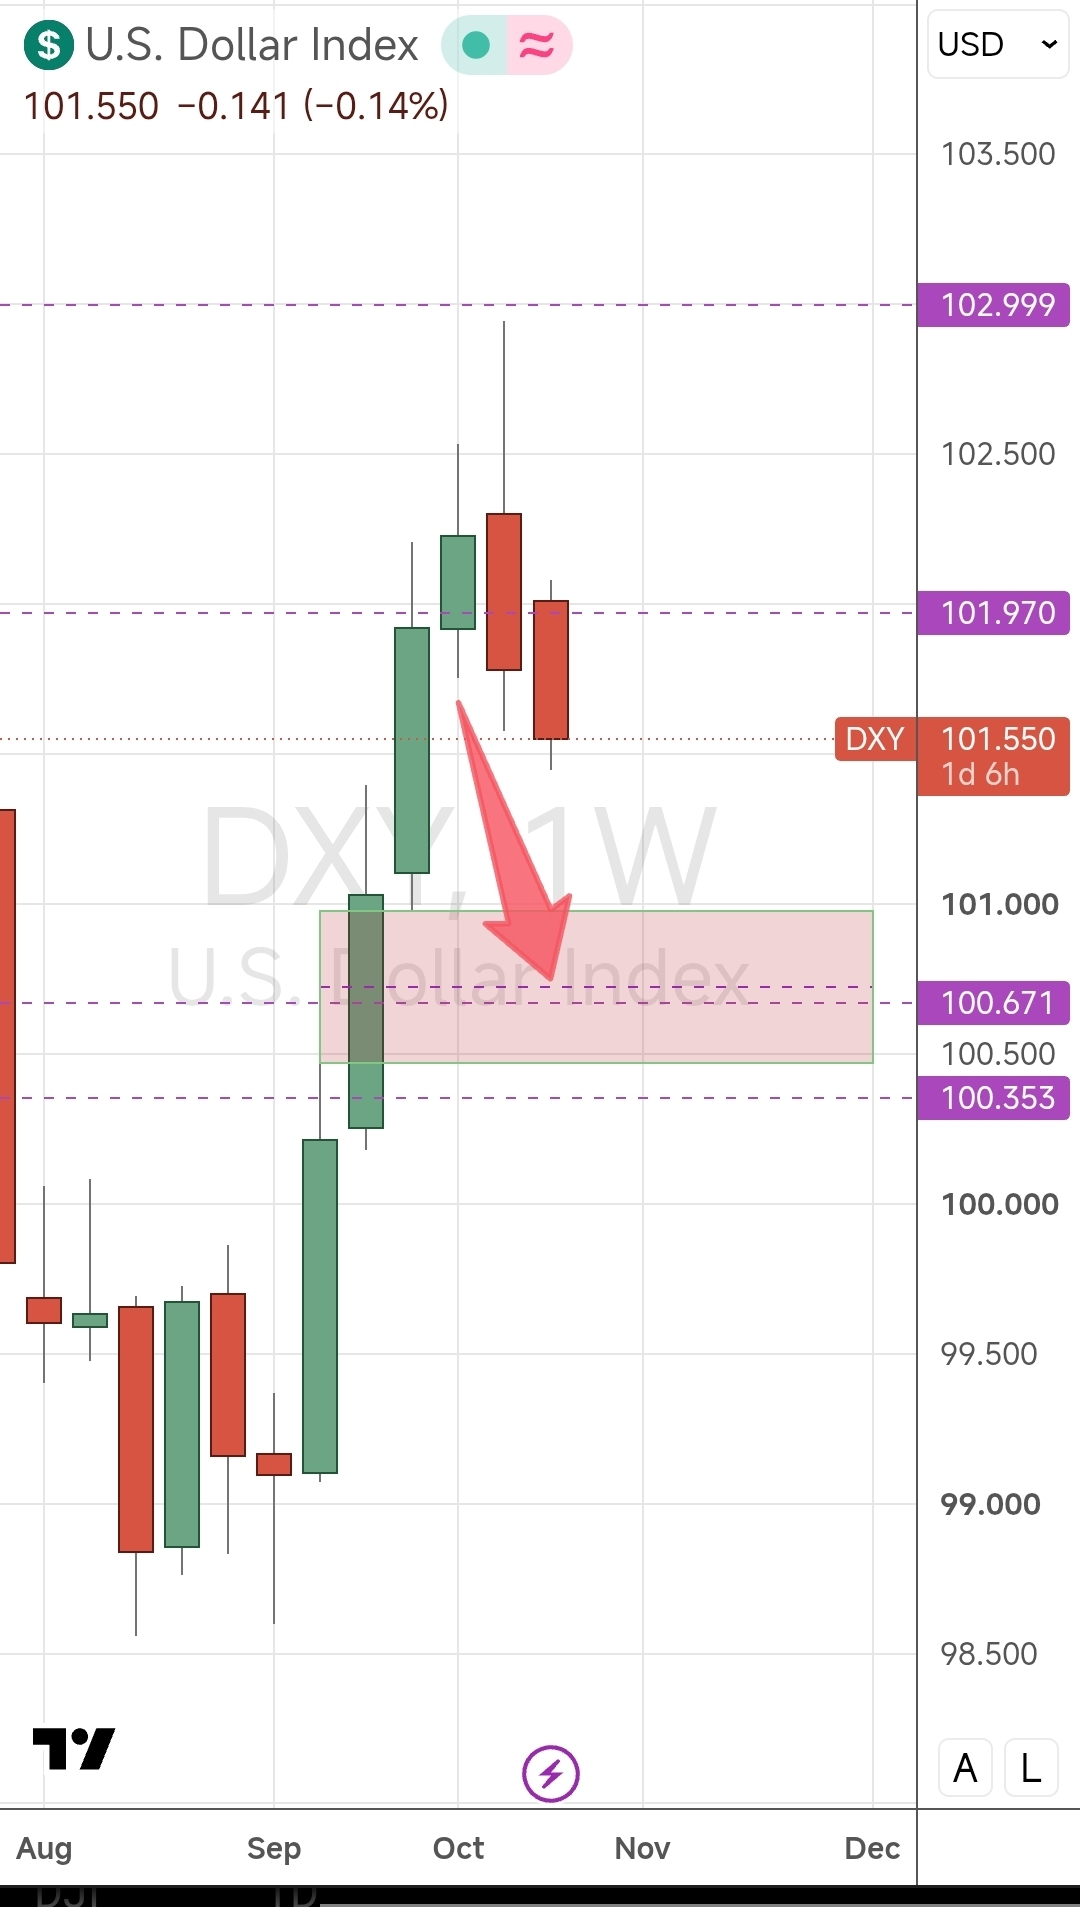
The weekly chart for the dollar index indicates a continued downward movement.
The crypto market has been rocked, sweeping away shorts and longs, as always.
I expect a reversal somewhere around this level and an upward move above yesterday's levels (2x).
otherwise you know what will happen ...
{future}(BTCUSDT)
{future}(XRPUSDT)
{future}(SUIUSDT)
$BTC $XRP $SUI
The weekly chart for the dollar index indicates a continued downward movement.
The crypto market has been rocked, sweeping away shorts and longs, as always.
I expect a reversal somewhere around this level and an upward move above yesterday's levels (2x).
otherwise you know what will happen ...
The weekly chart for the dollar index indicates a continued downward movement.
The crypto market has been rocked, sweeping away shorts and longs, as always.
I expect a reversal somewhere around this level and an upward move above yesterday's levels (2x).
otherwise you know what will happen ...
3
536
·
--
Bearish
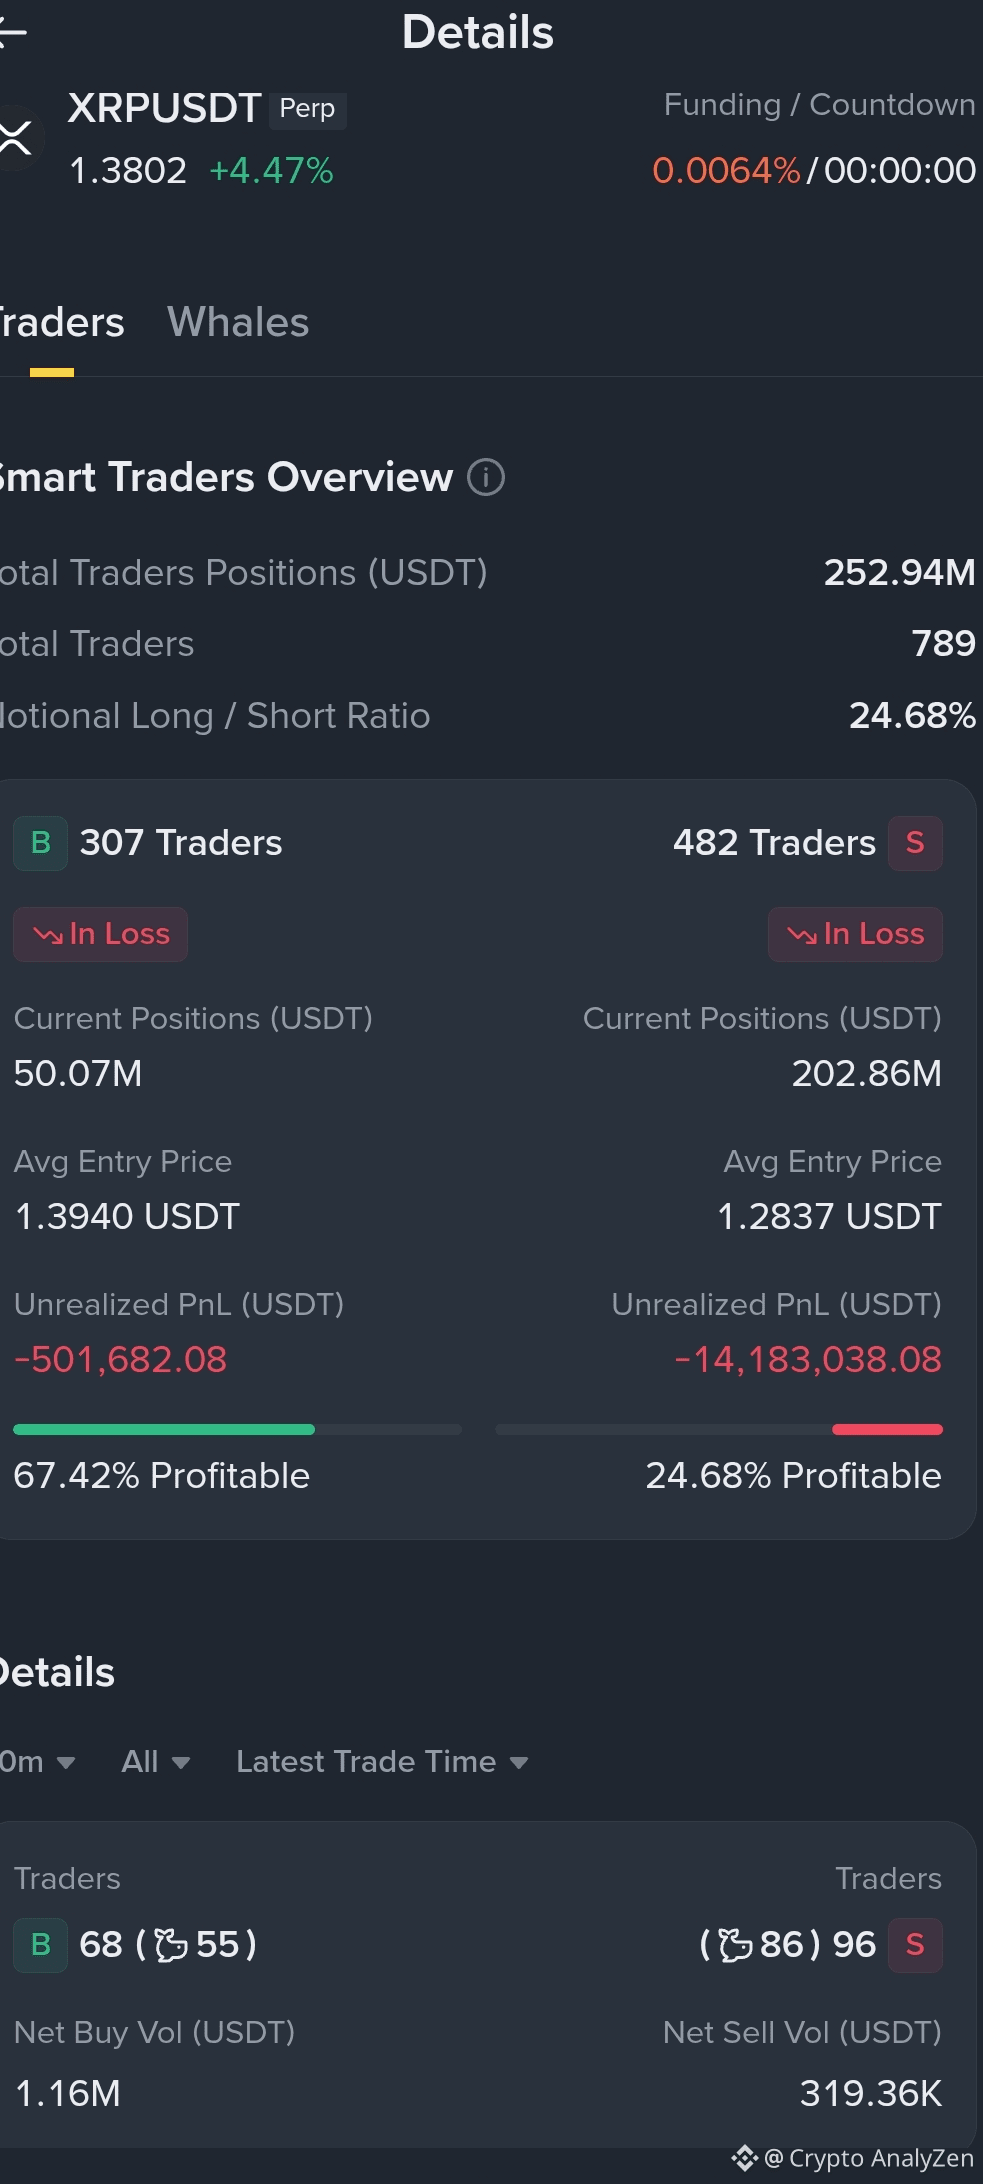
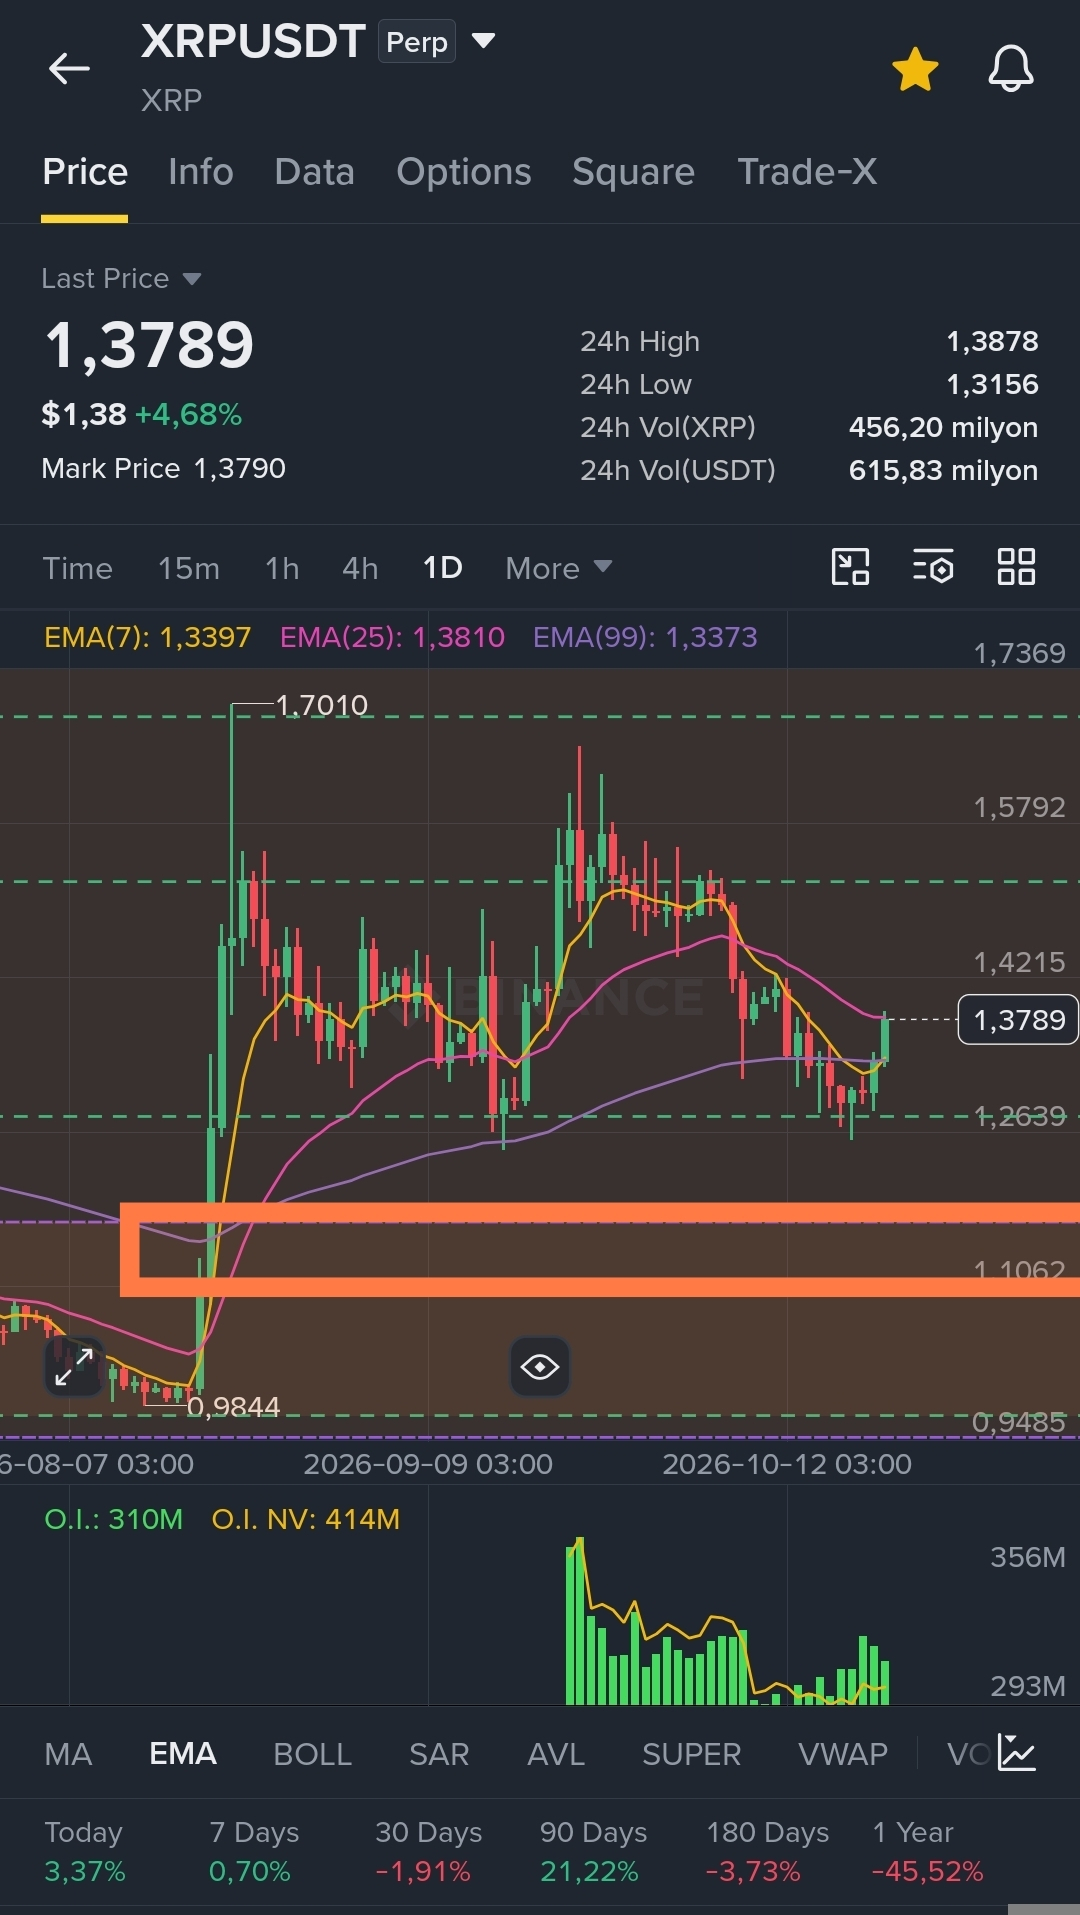
$XRP - the bulls have won the battle, but it's not the end of the war.
Note the total volume of short positions - 4 times larger than longs.
New longs have been pouring in over the last 30 minutes. ;) A trap for late longs.
#XRPPredictions
{future}(XRPUSDT)
$XRP - the bulls have won the battle, but it's not the end of the war.
Note the total volume of short positions - 4 times larger than longs.
New longs have been pouring in over the last 30 minutes. ;) A trap for late longs.
#XRPPredictions
Note the total volume of short positions - 4 times larger than longs.
New longs have been pouring in over the last 30 minutes. ;) A trap for late longs.
#XRPPredictions
2
1.2k
·
--
Bearish
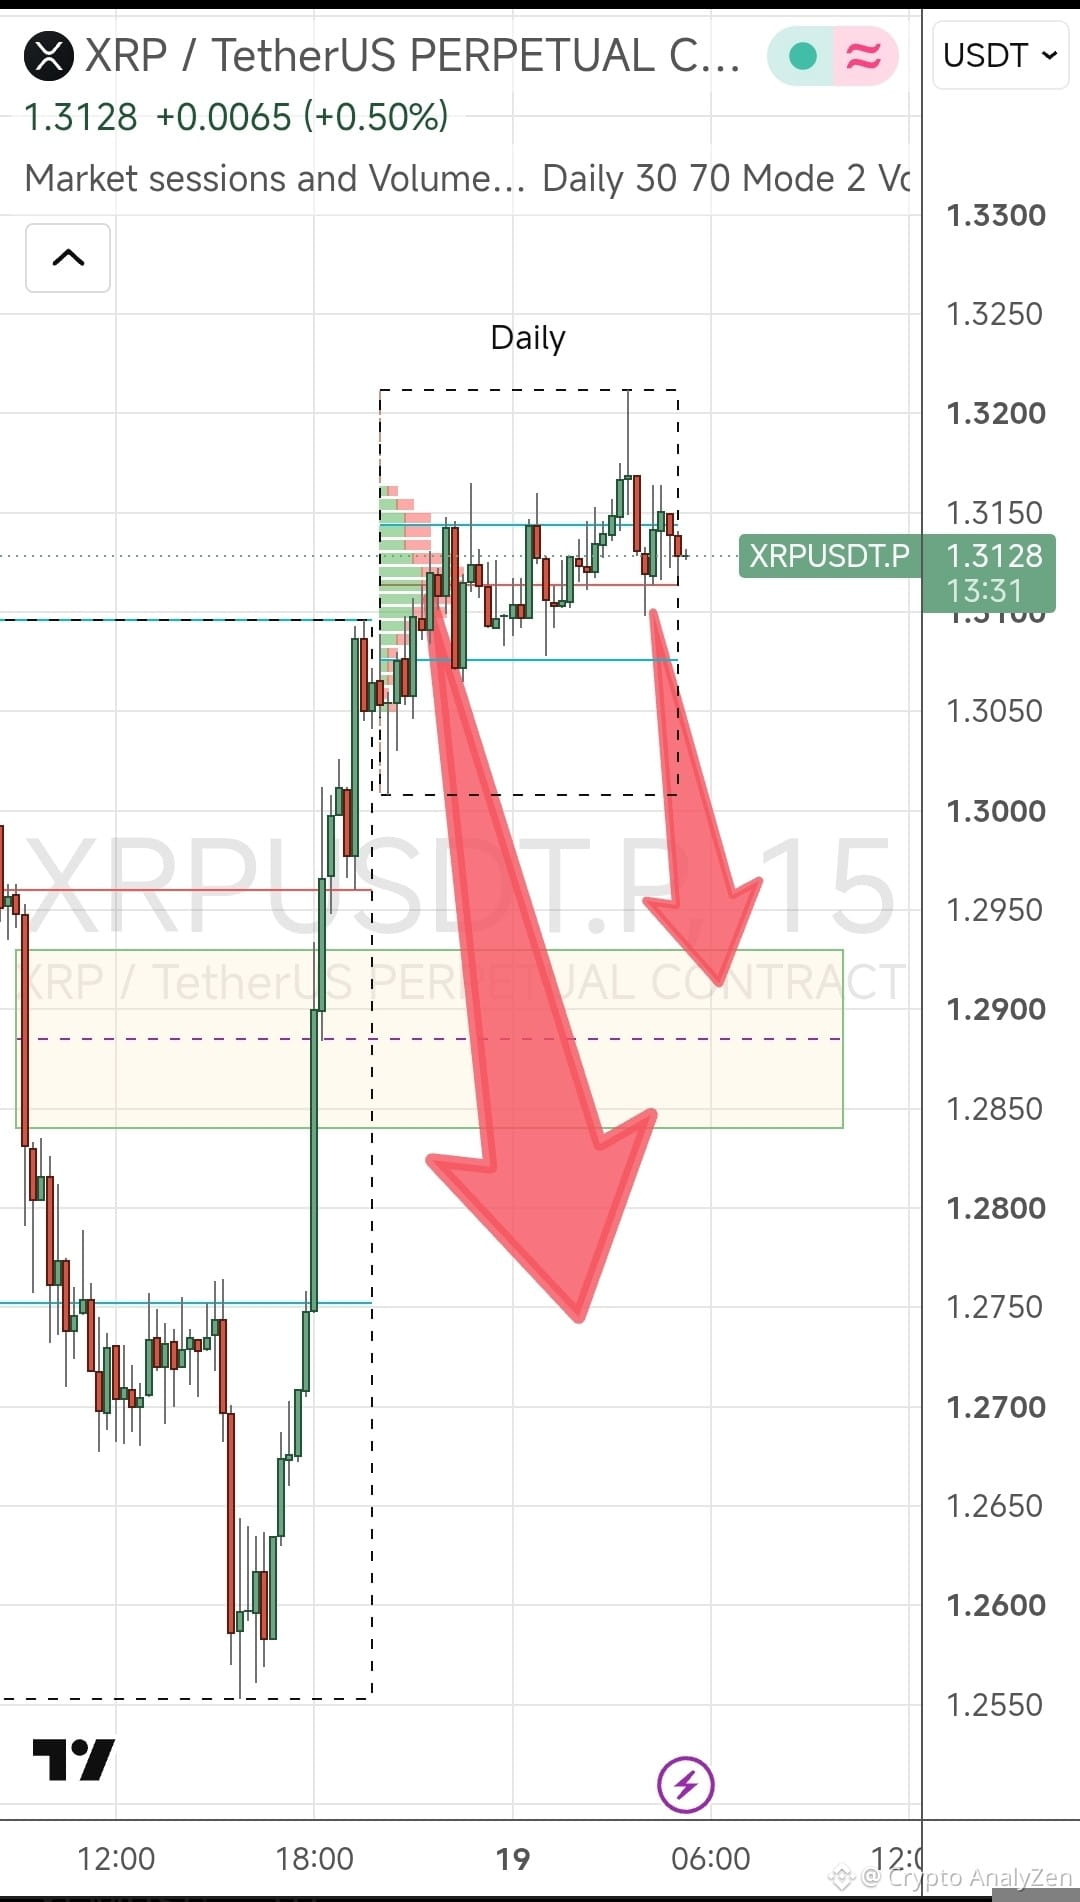
$XRP , like all other coins, continues to be dominated by shorts.
Yesterday's rebound is a hunt for stops on late shorts.
Enlarged opening of longs and closing of shorts could trigger another decline into the marked zone.
{future}(XRPUSDT)
#Xrp🔥🔥
$XRP , like all other coins, continues to be dominated by shorts.
Yesterday's rebound is a hunt for stops on late shorts.
Enlarged opening of longs and closing of shorts could trigger another decline into the marked zone.
#Xrp🔥🔥
Yesterday's rebound is a hunt for stops on late shorts.
Enlarged opening of longs and closing of shorts could trigger another decline into the marked zone.
#Xrp🔥🔥
1
317
·
--
Bearish
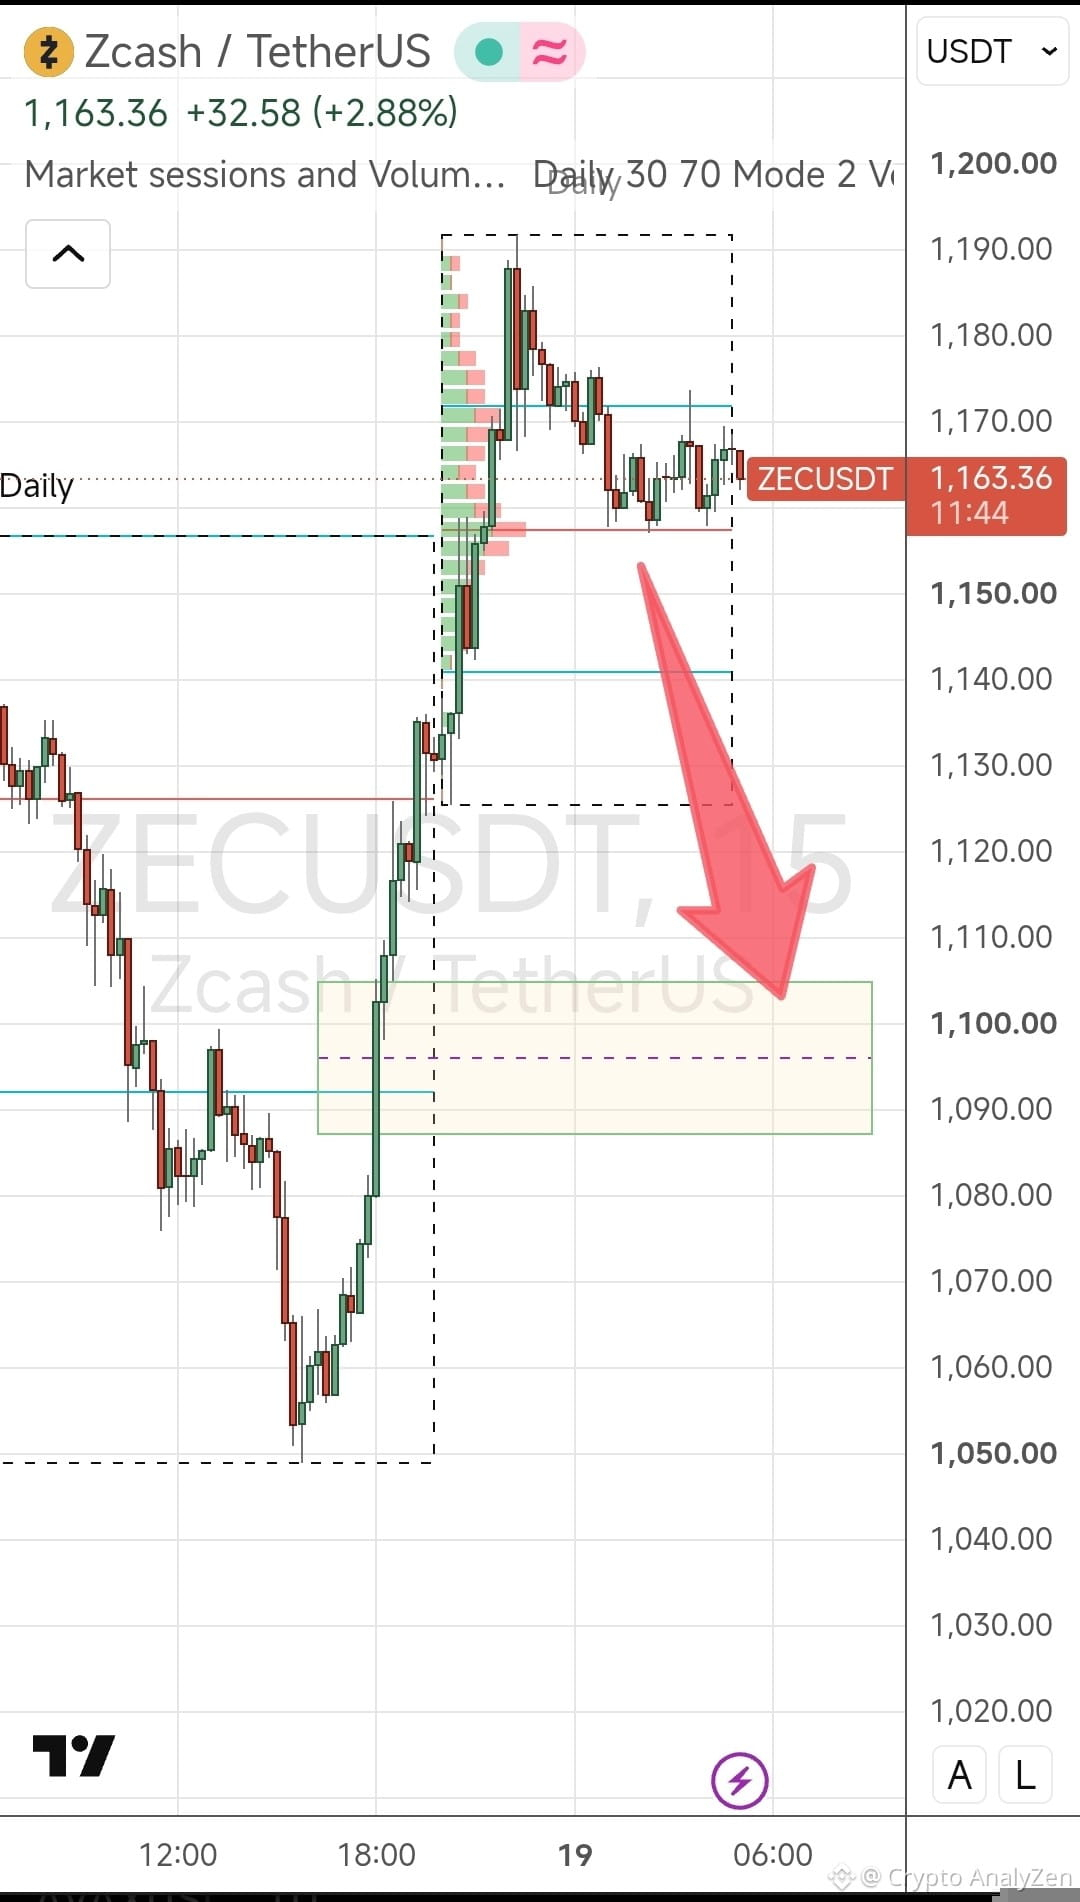
$ZEC rebounds while shorts remain dominant - you don't have to be a psychic to say the goal was to shake out late shorts and attract early longs (fomo)
Let's assume the market has formed a reversal.
Closing shorts and opening longs could drag the price down.
The 1100 zone is a zone of interest for next hours - a fair gap zone
{future}(ZECUSDT)
#zec
$ZEC rebounds while shorts remain dominant - you don't have to be a psychic to say the goal was to shake out late shorts and attract early longs (fomo)
Let's assume the market has formed a reversal.
Closing shorts and opening longs could drag the price down.
The 1100 zone is a zone of interest for next hours - a fair gap zone
#zec
Let's assume the market has formed a reversal.
Closing shorts and opening longs could drag the price down.
The 1100 zone is a zone of interest for next hours - a fair gap zone
#zec
1
225
·
--
Bearish
$BTC $SOL $ETH And this isn't the end of the decline ;)
A slight upward pullback was triggered by stop-losses on longs.
The overall picture on Smart Moneys is that the long-to-short ratio is 20-50%.
Short volumes are 4-5 times larger than long volumes.
#MarketMeltdown
{future}(BTCUSDT)
{spot}(SOLUSDT)
{spot}(ETHUSDT)
$BTC $SOL $ETH And this isn't the end of the decline ;)
A slight upward pullback was triggered by stop-losses on longs.
The overall picture on Smart Moneys is that the long-to-short ratio is 20-50%.
Short volumes are 4-5 times larger than long volumes.
#MarketMeltdown
A slight upward pullback was triggered by stop-losses on longs.
The overall picture on Smart Moneys is that the long-to-short ratio is 20-50%.
Short volumes are 4-5 times larger than long volumes.
#MarketMeltdown
2
257
·
--
Bearish
$BTC $SOL - If my assumptions are correct, we're in for a brutal move down
Fasten your seatbelts.
#MarketSentimentToday
{future}(BTCUSDT)
{spot}(SOLUSDT)
$BTC $SOL - If my assumptions are correct, we're in for a brutal move down
Fasten your seatbelts.
#MarketSentimentToday
Fasten your seatbelts.
#MarketSentimentToday
2
102
·
--
Bearish
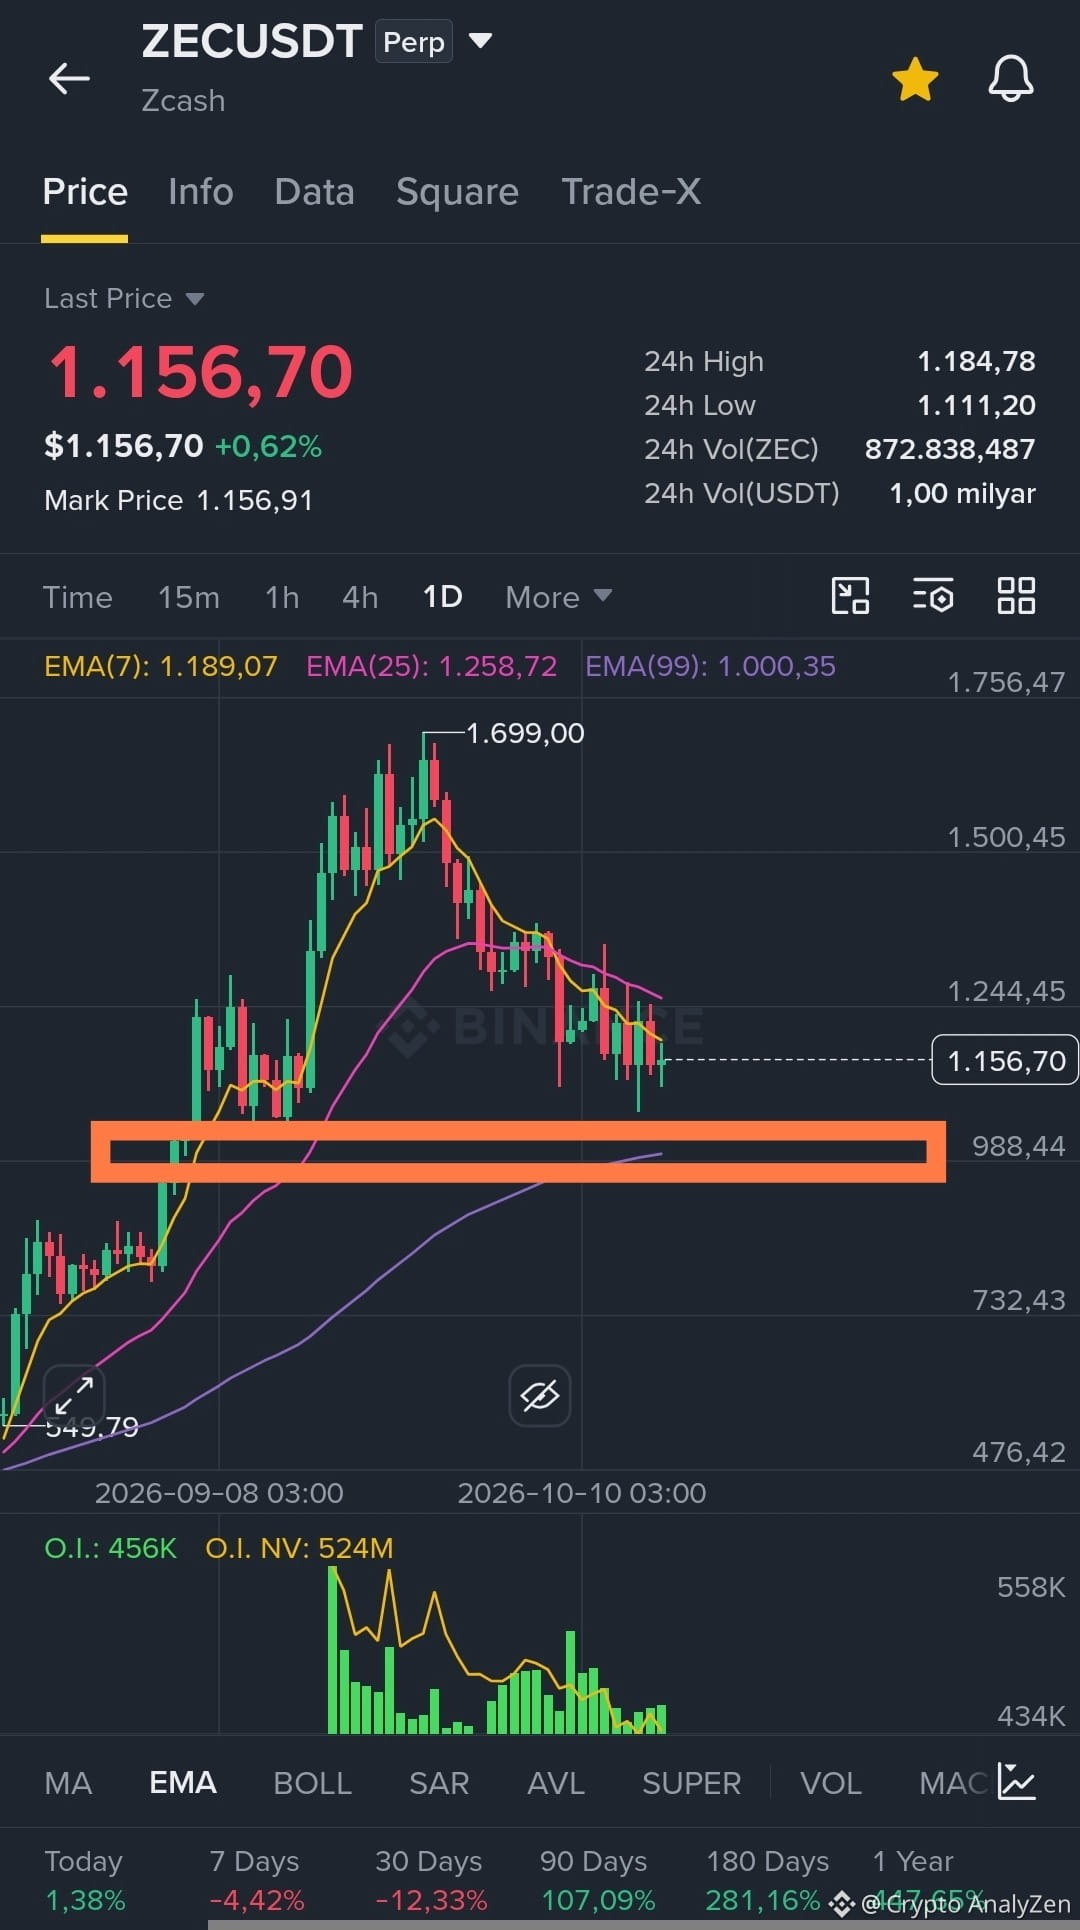
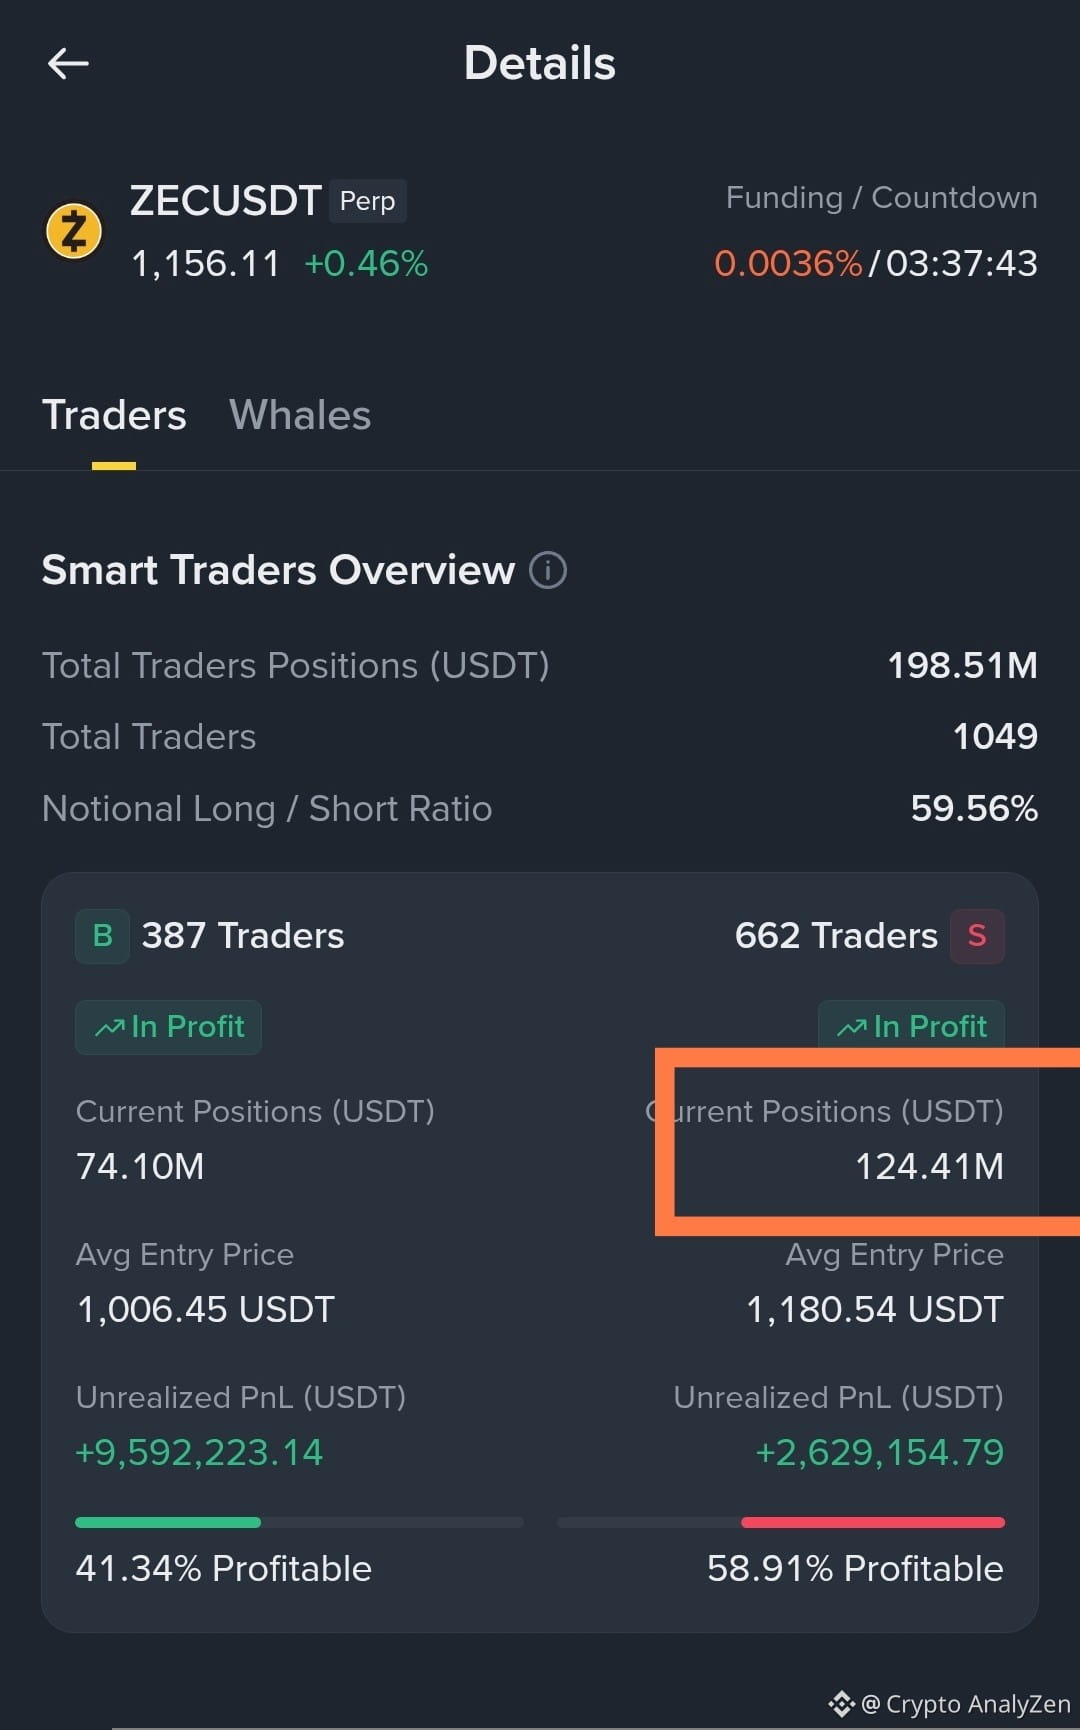
$ZEC - a battle between bulls and bears
Smart moneys - shorts prevail
Spot - price rebound with open interest declining - longs were closed in panic
Futures - open interest rising with a gradual price increase - new shorts opened, despite the increase in longs, long volumes are significantly lagging shorts
---
Conclusion
---
We're heading down
948-848 next
#zec
{future}(ZECUSDT)
$ZEC - a battle between bulls and bears
Smart moneys - shorts prevail
Spot - price rebound with open interest declining - longs were closed in panic
Futures - open interest rising with a gradual price increase - new shorts opened, despite the increase in longs, long volumes are significantly lagging shorts
---
Conclusion
---
We're heading down
948-848 next
#zec
Smart moneys - shorts prevail
Spot - price rebound with open interest declining - longs were closed in panic
Futures - open interest rising with a gradual price increase - new shorts opened, despite the increase in longs, long volumes are significantly lagging shorts
---
Conclusion
---
We're heading down
948-848 next
#zec
1
467
Log in to explore more content
Join global crypto users on Binance Square
⚡️ Get latest and useful information about crypto.
💬 Trusted by the world’s largest crypto exchange.
👍 Discover real insights from verified creators.
Email / Phone number
Trending Topics
BinanceReopensWithdrawalsForHYPE&APT
1,788 views
95 Discussing
#binancereopenswithdrawalsforhype&apt Binance reopened withdrawals for $APT and $HYPE, and that is the real test, not the headline. While withdrawals were frozen, supply was trapped. Nobody could dump even if they wanted to. Now the gate is open, $APT is sitting at $0.59, down about 1.6% today and hugging its 24h low, with unlock talk all over the timeline. If this was just fear, APT holds $0.59 and the reopening is a non-event. If coins start hitting exchanges in size, we find out fast how much supply was waiting to leave. Watching flows, not headlines. What is your read, relief or the dump everyone was waiting for?$APT
OnlyDump
·0 Likes
·144 views
SouthKoreaDraftLawTargets15To20%ShareholderCap
6,447 views
105 Discussing
KeplrAdvisesSocialLoginUsersToTransferAssets
11,165 views
209 Discussing