
币监会主席
1.2k Posts

币监会主席
加密市场“气氛组选手”兼实盘“赌徒”(bushi)。盯BTC涨跌比追剧还勤,主打一个在波动里整活——赚了吹牛皮,亏了喊“没法玩”,主打真实。
Open Trade
Frequent Trader
4.4 Years
930 Following
336 Followers
1.9K+ Liked
Posts
Portfolio
All
Quotes
Videos
PINNED
When you can’t bear it anymore, you often wish you had a strong support to lean on. But no matter how you look, you’ll find that some mountains are covered in thorns, while others are teeming with wild beasts—so you should be your own mountain.
——Cai Chongda $NVDAon
——Cai Chongda $NVDAon
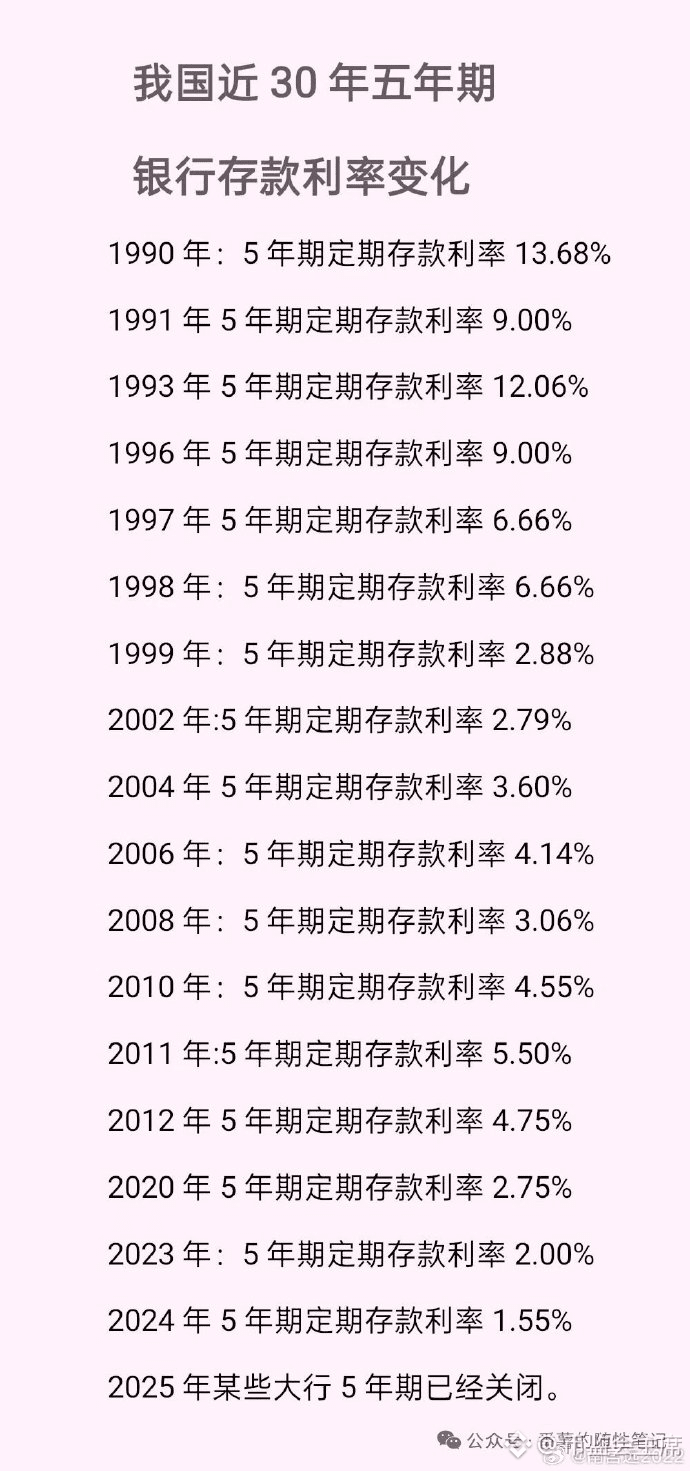



BlackRock’s latest disclosed 2026 Q2 holdings show that assets under management on the watchlist stand at $6.7 trillion.
Breaking down the portfolio structure, the weights of technology and semiconductors are already so high that they can no longer be ignored. The top five holdings are Nvidia at 5.8%, Apple at 5.0%, Alphabet at 4.4%, Microsoft at 3.4%, and Amazon at 2.7%. Add Broadcom at 2.3%, Micron at 1.8%, Meta at 1.5%, and Tesla and AMD at 1.3% each, and these hard-tech and platform-type companies together account for nearly one-third of total assets.
For such large institutions, the concentration at the top is largely determined by passive index weighting, rather than purely active bets. But when nearly one-third of the combination held by the world’s largest players is tied to only a handful of technology companies, the effect of valuation fluctuations on the overall market is heavier than what may appear on the surface.
For ordinary investors, buying along with the index means what you’re essentially buying is this weight structure. When the tech stock weight is already in a high range, the portfolio’s risk exposure to a single industry is raised accordingly.
$NVDA $AAPL
Breaking down the portfolio structure, the weights of technology and semiconductors are already so high that they can no longer be ignored. The top five holdings are Nvidia at 5.8%, Apple at 5.0%, Alphabet at 4.4%, Microsoft at 3.4%, and Amazon at 2.7%. Add Broadcom at 2.3%, Micron at 1.8%, Meta at 1.5%, and Tesla and AMD at 1.3% each, and these hard-tech and platform-type companies together account for nearly one-third of total assets.
For such large institutions, the concentration at the top is largely determined by passive index weighting, rather than purely active bets. But when nearly one-third of the combination held by the world’s largest players is tied to only a handful of technology companies, the effect of valuation fluctuations on the overall market is heavier than what may appear on the surface.
For ordinary investors, buying along with the index means what you’re essentially buying is this weight structure. When the tech stock weight is already in a high range, the portfolio’s risk exposure to a single industry is raised accordingly.
$NVDA $AAPL
Bitcoin spot ETF trading volume surged week over week to $22 billion, setting a new high for this cycle.
The chart is from checkonchain. The stacked columns show major allocations such as IBIT, FBTC, and ARKB all expanding in tandem, while the black line indicates that BTC’s spot price was in a high-range consolidation during the same period.
A spike in trading volume usually has two interpretations. One is that incremental capital is proactively stepping in; institutions’ willingness to allocate to bitcoin via the ETF channel is heating up. The other is that turnover among existing positions accelerates—heightened price volatility drives short-term funds to enter and exit more frequently. Looking at trading volume alone can’t distinguish between the two; it needs to be assessed together with net inflow data.
Worth noting is that increased activity through the ETF channel can change the structure of BTC’s marginal price-setting power. When spot ETF holdings become large enough, the liquidity rhythm of traditional markets is likely to transmit more into the crypto space, and the volatility characteristics previously determined purely by internal crypto supply and demand may weaken.
$BTC
The chart is from checkonchain. The stacked columns show major allocations such as IBIT, FBTC, and ARKB all expanding in tandem, while the black line indicates that BTC’s spot price was in a high-range consolidation during the same period.
A spike in trading volume usually has two interpretations. One is that incremental capital is proactively stepping in; institutions’ willingness to allocate to bitcoin via the ETF channel is heating up. The other is that turnover among existing positions accelerates—heightened price volatility drives short-term funds to enter and exit more frequently. Looking at trading volume alone can’t distinguish between the two; it needs to be assessed together with net inflow data.
Worth noting is that increased activity through the ETF channel can change the structure of BTC’s marginal price-setting power. When spot ETF holdings become large enough, the liquidity rhythm of traditional markets is likely to transmit more into the crypto space, and the volatility characteristics previously determined purely by internal crypto supply and demand may weaken.
$BTC
The informed source from the victim side of the Hangzhou drinking-party incident: The girl sought help to no avail and was briefly unconscious when she resisted and was hospitalized#比特币永续合约资金费率创20个月新高 $AAPL.US

AAPL+0.83%
AAPLUS+0.74%
Satoshi Nakamoto’s Bitcoin just lies there quietly.
Single signature. The key was created on a computer connected to the internet. No complicated multisig setup. No carefully designed custodial architecture.
17 years later, no one stole them.#中国7月产出零售投资全线不及预期 $GOOGL.US
Single signature. The key was created on a computer connected to the internet. No complicated multisig setup. No carefully designed custodial architecture.
17 years later, no one stole them.#中国7月产出零售投资全线不及预期 $GOOGL.US
#SpaceX股价涨至140美元 $PORTAL Quant Trading Giant Exposed: Loses $15 Billion in a Single Month
In July, U.S. high-frequency trading market maker Jane Street recorded losses of about $15 billion. Insiders said the quant giant disclosed this figure to its lenders. For Jane Street, it is a rare setback. In recent years, Jane Street has become one of the key players in global markets. Before this loss occurred, the firm’s quarterly performance had been setting records for itself. Caixin previously noted that Jane Street achieved a record net trading income of $16.1 billion in the first quarter this year, surpassing Wall Street’s top investment banks and competitors such as Castle Securities and Hudson River Trading. Insiders said that even after factoring in the July loss, Jane Street’s net trading income over the past year through Friday still exceeded $40 billion.
Jane Street’s massive July loss came amid extreme volatility in U.S. artificial intelligence (AI) stocks. After a strong rally during most of 2026, AI shares saw a sharp reversal in July, plunging rapidly. The selloff also hit several hedge funds focused on AI, including Situational Awareness, led by “AI prodigy” Leopold Aschenbrenner—Jane Street is one of the investors in that fund. It is worth noting that Jane Street’s investment in Situational Awareness is unusual: it primarily trades using its own capital. Insiders said the two companies are closely connected—one former Jane Street employee previously worked at Situational Awareness
In July, U.S. high-frequency trading market maker Jane Street recorded losses of about $15 billion. Insiders said the quant giant disclosed this figure to its lenders. For Jane Street, it is a rare setback. In recent years, Jane Street has become one of the key players in global markets. Before this loss occurred, the firm’s quarterly performance had been setting records for itself. Caixin previously noted that Jane Street achieved a record net trading income of $16.1 billion in the first quarter this year, surpassing Wall Street’s top investment banks and competitors such as Castle Securities and Hudson River Trading. Insiders said that even after factoring in the July loss, Jane Street’s net trading income over the past year through Friday still exceeded $40 billion.
Jane Street’s massive July loss came amid extreme volatility in U.S. artificial intelligence (AI) stocks. After a strong rally during most of 2026, AI shares saw a sharp reversal in July, plunging rapidly. The selloff also hit several hedge funds focused on AI, including Situational Awareness, led by “AI prodigy” Leopold Aschenbrenner—Jane Street is one of the investors in that fund. It is worth noting that Jane Street’s investment in Situational Awareness is unusual: it primarily trades using its own capital. Insiders said the two companies are closely connected—one former Jane Street employee previously worked at Situational Awareness
Reddit (RDDT) confirms inclusion in the S&P 500, effective before market open on August 18, replacing the acquired AVB. It briefly surged about 11% after hours.
Passive buying from index funds is real, tangible demand. But getting added to the index isn’t a free lunch—historically, many stocks have “announced a rise and been included in a decline.”
This is similar to the logic behind ETF approvals in the crypto asset space: forced buying supports underlying structural demand, but “buy the expectation, sell the fact” holds true on both sides. Traditional finance is accelerating its absorption of community-based assets—this is a signal worth watching for the crypto market.
$RDDT .US #美股 #标普500 #被动买盘
Passive buying from index funds is real, tangible demand. But getting added to the index isn’t a free lunch—historically, many stocks have “announced a rise and been included in a decline.”
This is similar to the logic behind ETF approvals in the crypto asset space: forced buying supports underlying structural demand, but “buy the expectation, sell the fact” holds true on both sides. Traditional finance is accelerating its absorption of community-based assets—this is a signal worth watching for the crypto market.
$RDDT .US #美股 #标普500 #被动买盘
RDDTUS-3.67%
This week, the US July CPI and PPI data are set to be released, and market attention is shifting back to the inflation path and rate-cut expectations.
CPI reflects overall price pressure, while PPI provides a leading indication of cost pressures on the corporate side; together, they shape the Federal Reserve’s policy room. If the data come in below expectations, rate-cut expectations often heat up; if they exceed expectations, short-term volatility in risk assets may be amplified.
For the crypto market, expectations for macro liquidity remain an important contextual variable. Volatility typically increases before and after the data release, so position management is often more crucial than directional judgment.
$APR #US July CPI and PPI data to be released this week
CPI reflects overall price pressure, while PPI provides a leading indication of cost pressures on the corporate side; together, they shape the Federal Reserve’s policy room. If the data come in below expectations, rate-cut expectations often heat up; if they exceed expectations, short-term volatility in risk assets may be amplified.
For the crypto market, expectations for macro liquidity remain an important contextual variable. Volatility typically increases before and after the data release, so position management is often more crucial than directional judgment.
$APR #US July CPI and PPI data to be released this week
I scrolled to a video about “70 beauty micro-habits” and, after watching, felt that this logic is actually the same as investing.
Nothing in the video—early sleep, exercise, skincare, diet—shows results immediately. Everything relies on building it day by day. Many people give up after three days when they don’t see changes, but what truly widens the gap is precisely the following dozens of days and hundreds of days.
It’s the same in the crypto market. People ask every day: which coin will rise tomorrow, which track will explode next week. But the ones that really run are often those who do a few dull things solidly first—understand their own risk tolerance, set a maximum position limit, don’t panic-buy when it drops, don’t get carried away when it rises, and then simply wait patiently for the cycle.
Compounding fears two things most: interruption and impulsive moves. Hear one theory today and change your strategy once; tomorrow you switch to another asset—time is all spent starting over, while the principal just stays where it is.
My own experience is that treating “do a little every day” as a habit is far more useful than “go all out once in a while.” Whether it’s getting better looking or getting richer, the path is pretty much the same: repeat simple actions until they bring about a qualitative change. Don’t expect shortcuts—most shortcuts are really just taking your principal.
标签 $COTI #复利 #自律 #长期主义
Nothing in the video—early sleep, exercise, skincare, diet—shows results immediately. Everything relies on building it day by day. Many people give up after three days when they don’t see changes, but what truly widens the gap is precisely the following dozens of days and hundreds of days.
It’s the same in the crypto market. People ask every day: which coin will rise tomorrow, which track will explode next week. But the ones that really run are often those who do a few dull things solidly first—understand their own risk tolerance, set a maximum position limit, don’t panic-buy when it drops, don’t get carried away when it rises, and then simply wait patiently for the cycle.
Compounding fears two things most: interruption and impulsive moves. Hear one theory today and change your strategy once; tomorrow you switch to another asset—time is all spent starting over, while the principal just stays where it is.
My own experience is that treating “do a little every day” as a habit is far more useful than “go all out once in a while.” Whether it’s getting better looking or getting richer, the path is pretty much the same: repeat simple actions until they bring about a qualitative change. Don’t expect shortcuts—most shortcuts are really just taking your principal.
标签 $COTI #复利 #自律 #长期主义
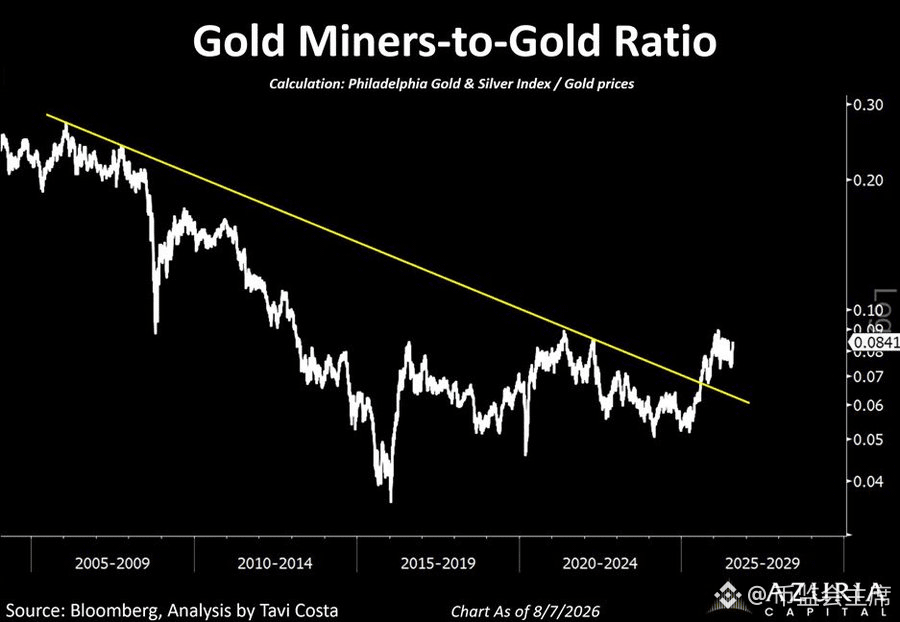
Seeing this chart, the ratio between gold mining stocks and the gold price has finally broken through a downward trend line that has lasted for more than ten years. The current ratio is roughly around 0.084.
Over the past nearly 20 years, the overall performance of gold mining stocks has failed to beat gold itself. The reason is also quite simple: as the gold price rises, costs rise as well; share dilution, environmental protection, and geopolitical risk come in waves one after another, causing the stocks’ sensitivity to weaken over time. But when the ratio breaks the trend line, it implies that capital is starting to re-price “equity that can produce gold” again, beyond just “physical gold.”
I think this has reference value for crypto assets. Many people compare BTC to digital gold, and mining stocks to mining company stocks. But BTC itself does not have the problem of expanding extraction costs, nor does it face resource risk tied to a single country. So, in the “scarcity narrative,” BTC is cleaner than gold mining stocks, but in terms of “discounted cash flow,” it’s not as good as mature mining companies that pay dividends.
In other words, BTC and gold mining stocks are two variants of the gold narrative: one locks in scarcity through protocol rules, and the other amplifies the gold price through corporate earnings. A breakout in the ratio suggests the market is shifting from “buying only gold” to “buying gold-related assets,” with risk appetite moving up one notch.
My own approach is to treat it as an indirect signal: when traditional markets are willing to pay a premium for higher-risk gold-related assets, high-beta positions in the crypto market typically benefit as well. But I don’t chase when it’s already at a high level—I use it only as a reference for position sizing.
Tag $COTI #黄金 #资产配置 #cryptocurrency
Over the past nearly 20 years, the overall performance of gold mining stocks has failed to beat gold itself. The reason is also quite simple: as the gold price rises, costs rise as well; share dilution, environmental protection, and geopolitical risk come in waves one after another, causing the stocks’ sensitivity to weaken over time. But when the ratio breaks the trend line, it implies that capital is starting to re-price “equity that can produce gold” again, beyond just “physical gold.”
I think this has reference value for crypto assets. Many people compare BTC to digital gold, and mining stocks to mining company stocks. But BTC itself does not have the problem of expanding extraction costs, nor does it face resource risk tied to a single country. So, in the “scarcity narrative,” BTC is cleaner than gold mining stocks, but in terms of “discounted cash flow,” it’s not as good as mature mining companies that pay dividends.
In other words, BTC and gold mining stocks are two variants of the gold narrative: one locks in scarcity through protocol rules, and the other amplifies the gold price through corporate earnings. A breakout in the ratio suggests the market is shifting from “buying only gold” to “buying gold-related assets,” with risk appetite moving up one notch.
My own approach is to treat it as an indirect signal: when traditional markets are willing to pay a premium for higher-risk gold-related assets, high-beta positions in the crypto market typically benefit as well. But I don’t chase when it’s already at a high level—I use it only as a reference for position sizing.
Tag $COTI #黄金 #资产配置 #cryptocurrency
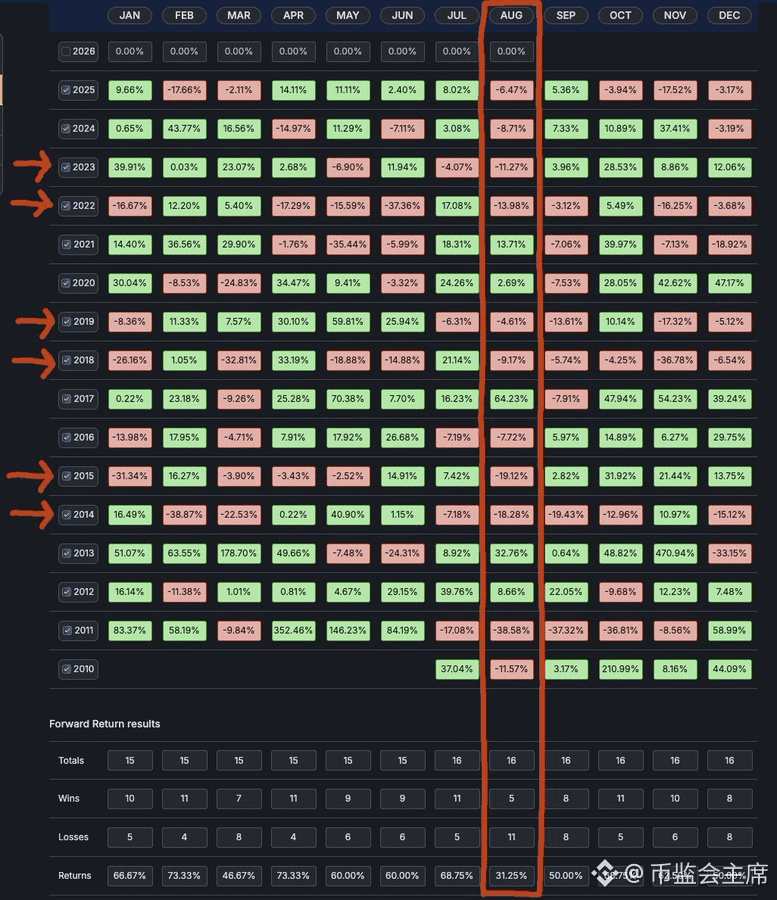
August historical win rate is only 31.25%—when you lay out monthly returns from the past more than ten years, August really is one of the weaker months of the year.
But historical data is just statistics, not a forecast. For a highly volatile asset like crypto, the key isn’t to guess which month will fall—it’s whether you’ve kept enough cash and whether your position sizing can withstand volatility.
Panic and FOMO both easily lead to wrong decisions when emotions are at their peak. Discipline matters more than the month.
$COTI #Web3 #宏观 #risk management
But historical data is just statistics, not a forecast. For a highly volatile asset like crypto, the key isn’t to guess which month will fall—it’s whether you’ve kept enough cash and whether your position sizing can withstand volatility.
Panic and FOMO both easily lead to wrong decisions when emotions are at their peak. Discipline matters more than the month.
$COTI #Web3 #宏观 #risk management
Today BTC lowest likely look at 62,350 (day+1H lower Bollinger band resonance support; if it breaks, then further down to 62,350 (day+1H lower Bollinger band resonance support; if it breaks, then down to 62,200 / 58,000), with a high possibly touching 58,000). The high then touched 64,200 (1H upper Bollinger band + day EMA20 resistance pressure). Current price 62,953 has already fallen below 63,800’s key level (the “gate”); most likely it will stay weak and churn within the $62,350–64,200 range corridor.
Today’s BNB minimum looks like 583 (Fib 0.382 + daily EMA50 + 24h low-confluence support), maximum touches 583 (Fib 0.382 + daily EMA50 + 24h low-confluence support), and a higher touch at 597 (Fib 0.5 with suppression from the 7/31 high). Current price 588.7 is consolidating at a high level after the 7/30 breakout on increased volume. Most likely, it will grind in the 583–596 range. If it holds steady above 597 on volume, then watch 600. If it breaks below 583, expect a retest of 583, then 574.
(Personal review only, not investment advice; the market is risky.)
(Personal review only, not investment advice; the market is risky.)
📊 ETH today’s high-low price prediction
In one sentence: Today’s ETH is expected to test a low of $1,845 (strong support from the day EMA50) and potentially reach a high of $1,973 (double resistance from the day/4H Bollinger upper bands), with a high probability of consolidating in the $1,868–$1,928 range.
Compared with BTC, ETH’s daily trend is still bullish (a bit stronger than BTC); however, a shallow dead cross on the MACD with decreasing volume means it also lacks momentum to push higher. If BTC breaks the $63,800 key level and drags sentiment, ETH could fall to $1,774 (day Bollinger lower band).
⚠️ Personal review notes only—do not constitute investment advice. The market is risky, so keep your own watch.
#以太坊 #ETH #Binance Square
In one sentence: Today’s ETH is expected to test a low of $1,845 (strong support from the day EMA50) and potentially reach a high of $1,973 (double resistance from the day/4H Bollinger upper bands), with a high probability of consolidating in the $1,868–$1,928 range.
Compared with BTC, ETH’s daily trend is still bullish (a bit stronger than BTC); however, a shallow dead cross on the MACD with decreasing volume means it also lacks momentum to push higher. If BTC breaks the $63,800 key level and drags sentiment, ETH could fall to $1,774 (day Bollinger lower band).
⚠️ Personal review notes only—do not constitute investment advice. The market is risky, so keep your own watch.
#以太坊 #ETH #Binance Square
📊 BTC price prediction for today: high and low
Clear one-liner for everyone:
Today’s support to watch is $62,645 (once $63,800—the key level—is broken, it may dip toward the lower daily Bollinger band); the resistance to test is $64,800 (a weaker rebound aiming near the daily EMA50). Most likely, it will churn in the corridor of $63,100–$64,300. If it truly breaks below $63,800, expect a shift to shorts and faster acceleration.
Current price is $63,950, sitting just above the key level. The key question for today is whether it can hold $63,800.
⚠️ Personal review only; not investment advice. The market has risks—watch the chart yourself.
#比特币 #BTC #Binance Plaza
Clear one-liner for everyone:
Today’s support to watch is $62,645 (once $63,800—the key level—is broken, it may dip toward the lower daily Bollinger band); the resistance to test is $64,800 (a weaker rebound aiming near the daily EMA50). Most likely, it will churn in the corridor of $63,100–$64,300. If it truly breaks below $63,800, expect a shift to shorts and faster acceleration.
Current price is $63,950, sitting just above the key level. The key question for today is whether it can hold $63,800.
⚠️ Personal review only; not investment advice. The market has risks—watch the chart yourself.
#比特币 #BTC #Binance Plaza
📊 How will BTC move today?
The latest live price just pulled up to $63,950—down a bit from this morning. It’s now hovering right above the critical line at $63,800. One step away: today’s key is to hold this level.
Let’s look at three timeframes:
On the daily chart, the MACD bearish cross is still widening (histogram -115). The EMA20 is capping price at $64,283, the overall bias remains bearish. Latest volume has shrunk to 1940—nobody wants to push higher.
On the 4-hour chart, it’s still a bearish cross (-43). The lower Bollinger band is at $63,137—this is the first buffer level below.
On the 1-hour chart, MACD has a bullish cross (+62), and price has climbed above the 1H EMA20. However, the EMA20/50 are still arranged bearishly—plainly put, this is a weak pullback during a downtrend. Price hasn’t truly turned up.
Above, a triple-top at $66,956 is 4.4% away—out of reach today.
Today’s likely paths (I have three scenarios in mind):
🟢 Optimistic (20%): The 1H bullish cross continues, and volume returns to push price back to the daily EMA20 at $64,283. Then watch for $64,800 (near the EMA50).
🟡 Neutral (40%): Ranging between $63,137 (4H Bollinger lower band) and $64,283—chop up and down, repeatedly testing the $63,800 critical line.
🔴 Pessimistic (40%): Break below $63,800. The daily rebound ends (confirmation), and then price heads down to $62,645 (daily Bollinger), then $62,200 (previous low), and in extreme cases $58,000.
My take: slightly bearish—hold the critical line. The daily bearish cross is widening, volume is shrinking, and the triple-top overhead is pressing down. There’s basically nothing to “buy into” above. The 1H bullish cross is only a weak pullback, not a reversal. Most likely today is low-range consolidation and repeated tests of the critical line; if it truly breaks, downside acceleration is coming.
🔑 Remember these four points
• Break $63,800 (critical line) → rebound ends, get out
• Break $63,137 (4H Bollinger lower band) → accelerate, watch $62,645
• Stand above $64,283 (daily EMA20) → weak pullback turns stable
• Triple-top at $66,956 is too far—don’t worry about it today
📌 Trading plan: If you’re holding longs, fully exit on a break of $63,800—don’t fight the trade. If you’re currently in cash/no position, don’t catch falling knives; wait for a retest around $62,200–$63,100 that holds (doesn’t break), or for confirmation after price closes above $64,283.
⚠️ Personal review only—this is not investment advice.
#比特币 #BTC #币安广场
The latest live price just pulled up to $63,950—down a bit from this morning. It’s now hovering right above the critical line at $63,800. One step away: today’s key is to hold this level.
Let’s look at three timeframes:
On the daily chart, the MACD bearish cross is still widening (histogram -115). The EMA20 is capping price at $64,283, the overall bias remains bearish. Latest volume has shrunk to 1940—nobody wants to push higher.
On the 4-hour chart, it’s still a bearish cross (-43). The lower Bollinger band is at $63,137—this is the first buffer level below.
On the 1-hour chart, MACD has a bullish cross (+62), and price has climbed above the 1H EMA20. However, the EMA20/50 are still arranged bearishly—plainly put, this is a weak pullback during a downtrend. Price hasn’t truly turned up.
Above, a triple-top at $66,956 is 4.4% away—out of reach today.
Today’s likely paths (I have three scenarios in mind):
🟢 Optimistic (20%): The 1H bullish cross continues, and volume returns to push price back to the daily EMA20 at $64,283. Then watch for $64,800 (near the EMA50).
🟡 Neutral (40%): Ranging between $63,137 (4H Bollinger lower band) and $64,283—chop up and down, repeatedly testing the $63,800 critical line.
🔴 Pessimistic (40%): Break below $63,800. The daily rebound ends (confirmation), and then price heads down to $62,645 (daily Bollinger), then $62,200 (previous low), and in extreme cases $58,000.
My take: slightly bearish—hold the critical line. The daily bearish cross is widening, volume is shrinking, and the triple-top overhead is pressing down. There’s basically nothing to “buy into” above. The 1H bullish cross is only a weak pullback, not a reversal. Most likely today is low-range consolidation and repeated tests of the critical line; if it truly breaks, downside acceleration is coming.
🔑 Remember these four points
• Break $63,800 (critical line) → rebound ends, get out
• Break $63,137 (4H Bollinger lower band) → accelerate, watch $62,645
• Stand above $64,283 (daily EMA20) → weak pullback turns stable
• Triple-top at $66,956 is too far—don’t worry about it today
📌 Trading plan: If you’re holding longs, fully exit on a break of $63,800—don’t fight the trade. If you’re currently in cash/no position, don’t catch falling knives; wait for a retest around $62,200–$63,100 that holds (doesn’t break), or for confirmation after price closes above $64,283.
⚠️ Personal review only—this is not investment advice.
#比特币 #BTC #币安广场
🌡️ How does BTC feel right now?
In one sentence: neutral but cautious— the rebound didn’t really take off, money is waiting on the sidelines, and the hesitation carries a slight bearish tilt. Not panic, but that early flash of optimism has already cooled.
Current price $64,063, down about 1.9% from the $65,279 from the night two days ago. The daily chart has basically given back those good signals from then.
🔴 Weakening signals
• Daily MACD flips to a dead cross: it was a golden cross +76 the night before, now −107— the bottoming attempt has been disproven, and momentum has fizzled out
• 4-hour returns to a bearish lineup: the long structure where EMA20 crossed above EMA50 earlier has slid back
• Triple top at $66,956 gets farther away as time passes: price is now about 4.1% below it, and the trapped-supply overhead remains unmoved
• Volume shrinks back to near dead-volume: the latest daily candle is only 1826, totally different from the 9000+ that was posted the night before— no one is genuinely buying aggressively at this level with real money
🟡 But it’s not panic yet
• The key level $63,800 is being held: now $64,063— it hasn’t broken
• The 4-hour lower Bollinger Band at $63,149 hasn’t been broken either
• 1-hour MACD has a golden cross: after a deeper drop, there’s short-term dip-buying activity— in the $63,600–64,000 zone, bids are present and there’s a rebound attempt, but it’s just picking up discounts, not chasing upside
Put into plain words: that “hesitation in confirmation” (slightly bullish) from the night before didn’t play out two days later— trapped funds are too heavy, and there’s a lack of fresh catalysts, so long-side momentum basically went out. Money is stuck around $64,000. There’s some short-term picking up after the dip, but nobody dares to chase. Fear is clearly higher than the night before, but it hasn’t reached the kind of panic from a breakdown.
📌 On positioning: if holding longs, reduce when price breaks below $63,800; don’t chase if you’re in cash— wait for a pullback of $62,200–63,100 that holds, or for price to reclaim and confirm above the daily EMA50 at $64,927.
⚠️ This is personal reflection only, not investment advice.
#比特币 #BTC #Binance Square
In one sentence: neutral but cautious— the rebound didn’t really take off, money is waiting on the sidelines, and the hesitation carries a slight bearish tilt. Not panic, but that early flash of optimism has already cooled.
Current price $64,063, down about 1.9% from the $65,279 from the night two days ago. The daily chart has basically given back those good signals from then.
🔴 Weakening signals
• Daily MACD flips to a dead cross: it was a golden cross +76 the night before, now −107— the bottoming attempt has been disproven, and momentum has fizzled out
• 4-hour returns to a bearish lineup: the long structure where EMA20 crossed above EMA50 earlier has slid back
• Triple top at $66,956 gets farther away as time passes: price is now about 4.1% below it, and the trapped-supply overhead remains unmoved
• Volume shrinks back to near dead-volume: the latest daily candle is only 1826, totally different from the 9000+ that was posted the night before— no one is genuinely buying aggressively at this level with real money
🟡 But it’s not panic yet
• The key level $63,800 is being held: now $64,063— it hasn’t broken
• The 4-hour lower Bollinger Band at $63,149 hasn’t been broken either
• 1-hour MACD has a golden cross: after a deeper drop, there’s short-term dip-buying activity— in the $63,600–64,000 zone, bids are present and there’s a rebound attempt, but it’s just picking up discounts, not chasing upside
Put into plain words: that “hesitation in confirmation” (slightly bullish) from the night before didn’t play out two days later— trapped funds are too heavy, and there’s a lack of fresh catalysts, so long-side momentum basically went out. Money is stuck around $64,000. There’s some short-term picking up after the dip, but nobody dares to chase. Fear is clearly higher than the night before, but it hasn’t reached the kind of panic from a breakdown.
📌 On positioning: if holding longs, reduce when price breaks below $63,800; don’t chase if you’re in cash— wait for a pullback of $62,200–63,100 that holds, or for price to reclaim and confirm above the daily EMA50 at $64,927.
⚠️ This is personal reflection only, not investment advice.
#比特币 #BTC #Binance Square
Log in to explore more content